Embed Size (px)
Citation preview

Direct aerosol radiative forcing based on combined A-Train observations – challenges
in deriving all-sky estimates
Jens Redemann, Y. Shinozuka, M.Kacenelenbogen, M. Vaughan, R. Ferrare, C. Hostetler, R. Rogers, P. Russell, J.
Livingston, O. Torres, L. Remer
NASA Ames – BAERI – NASA Langley – SSAI – SRI – NASA Goddard – UMBC
http://geo.arc.nasa.gov/sgg/AATS-website/
email: [email protected]

Goals and Motivation
MODIS
OMI
CALIOP
Goal: To use A-Train aerosol obs to constrain aerosol radiative properties to calculate observationally-based DFaerosol(z) and its uncertainty
Goals & Motivation
Approach
Technical details
Input & Spatial
sampling
Representativenes
s of input
Sample retrieval
Results
AOD & ssa
comparisons to
AERONET
AOD and ssa
distribution
Maps of TOA and
surface DARF
Comparisons of
DARF to previous
results
Conclusions

Target:DFaerosol(z) + d DFaerosol(z)
Constraints/Input:- MODIS AOD (550, 1240 nm) + (±0.03±5%) - OMI AAOD (388 nm) + ±(0.05+30%) - CALIPSO ext (532, 1064 nm) + dext- CALIPSO back (532 nm) ±(0.1 Mm-1sr-
1+30%)
Retrieval:ext (l, z) + dextssa (l, z) + dssa
g (l, z) + dg
Aerosol models: 7 fine and 3 coarse mode models and refractive indices for bi-modal log-normal size distribution → 100 combinationsFree parameters: Nfine, Ncoarse
Rtx code
Comparison:CERES Fclear
Airborne Fclear
Comparison:AERONET AOD, ssa, gAirborne test bed data
Approach Goals & Motivation
Approach
Technical details
Input & Spatial
sampling
Representativenes
s of input
Sample retrieval
Results
AOD & ssa
comparisons to
AERONET
AOD and ssa
distribution
Maps of TOA and
surface DARF
Comparisons of
DARF to previous
results
Conclusions

Input &Spatial Sampling
Constraints/Input:- MODIS AOD (7/2 l) + dAOD- OMI AAOD (388 nm) + dAAOD- CALIPSO ext (532, 1064 nm) + dext- CALIPSO back (532 , 1064 nm) + dback
Goals & Motivation
Approach
Technical details
Input & Spatial
sampling
Representativenes
s of input
Sample retrieval
Results
AOD & ssa
comparisons to
AERONET
AOD and ssa
distribution
Maps of TOA and
surface DARF
Comparisons of
DARF to previous
results
Conclusions

OMAERUV (Torres group) OMAERO (KNMI group)
AOD 388nm AOD 388nm
ssa 388nm ssa 388nm
Representativeness of input - 1 Goals & Motivation
Approach
Technical details
Input & Spatial
sampling
Representativenes
s of input
Sample retrieval
Results
AOD & ssa
comparisons to
AERONET
AOD and ssa
distribution
Maps of TOA and
surface DARF
Comparisons of
DARF to previous
results
Conclusions

Representativeness of input - 2
OMAERO data collocated with MODIS and CALIOP is a reasonable representation of global OMAERO over ocean
OMAERUV data collocated with MODIS and CALIOP is a poor representation of global OMAERUV over ocean
Goals & Motivation
Approach
Technical details
Input & Spatial
sampling
Representativenes
s of input
Sample retrieval
Results
AOD & ssa
comparisons to
AERONET
AOD and ssa
distribution
Maps of TOA and
surface DARF
Comparisons of
DARF to previous
results
Conclusions

Goals & Motivation
Approach
Technical details
Input & Spatial
sampling
Representativenes
s of input
Sample retrieval
Results
AOD & ssa
comparisons to
AERONET
AOD and ssa
distribution
Maps of TOA and
surface DARF
Comparisons of
DARF to previous
results
Conclusions
2/12
ˆ
ˆ
i
ii
ii x
xxw
Metric: Simple weighted cost function
ix̂ix : retrieved
: observables
: unc. in obs.
: weighting factors
ix̂
iw
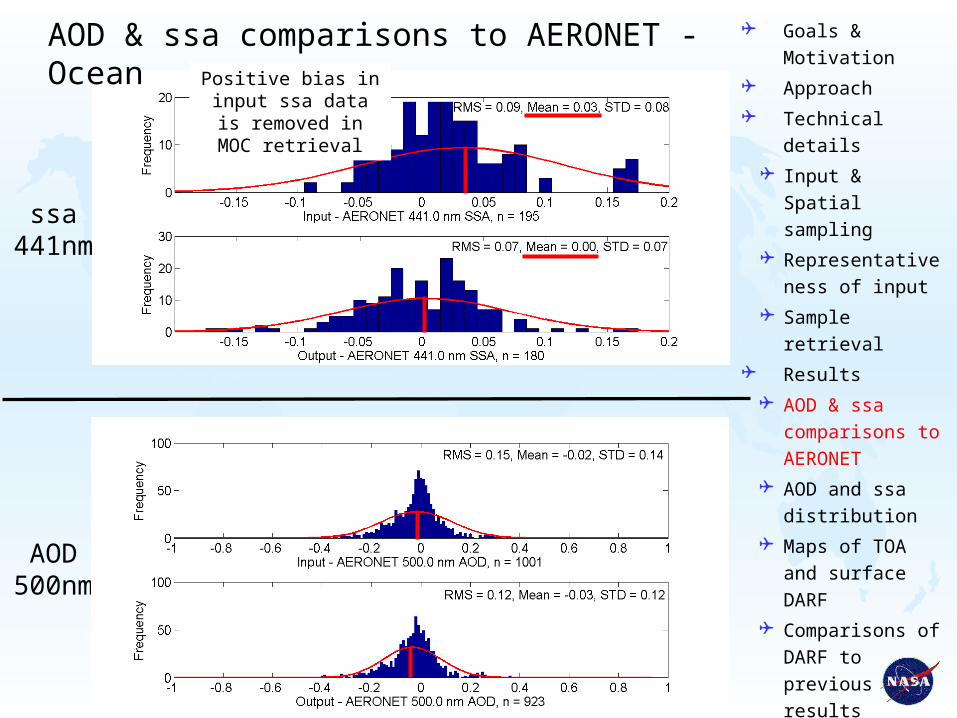
AOD & ssa comparisons to AERONET - Ocean
ssa441nm
Positive bias in input ssa data is removed
in MOC retrieval
AOD500nm
Goals & Motivation
Approach
Technical details
Input & Spatial
sampling
Representativenes
s of input
Sample retrieval
Results
AOD & ssa
comparisons to
AERONET
AOD and ssa
distribution
Maps of TOA and
surface DARF
Comparisons of
DARF to previous
results
Conclusions

ssa550nm
AOD550nm
AOD and ssa distribution Goals & Motivation
Approach
Technical details
Input & Spatial
sampling
Representativenes
s of input
Sample retrieval
Results
AOD & ssa
comparisons to
AERONET
AOD and ssa
distribution
Maps of TOA and
surface DARF
Comparisons of
DARF to previous
results
Conclusions

AOD and ssa distribution
ssa400nm550nm
2200nm
AOD400nm550nm
2200nm
Goals & Motivation
Approach
Technical details
Input & Spatial
sampling
Representativenes
s of input
Sample retrieval
Results
AOD & ssa
comparisons to
AERONET
AOD and ssa
distribution
Maps of TOA and
surface DARF
Comparisons of
DARF to previous
results
Conclusions

MODIS snow-free, gap-filled albedo parameters (8-day res.)
Black-sky albedo (0.3-5mm) at solar noon, Day 185, 2007
Goals & Motivation
Approach
Technical details
Input & Spatial
sampling
Representativenes
s of input
Sample retrieval
Results
AOD & ssa
comparisons to
AERONET
AOD and ssa
distribution
Maps of TOA and
surface DARF
Comparisons of
DARF to previous
results
Conclusions

Maps of TOA and surface clear sky DFaerosol
TOA
Surface
Goals & Motivation
Approach
Technical details
Input & Spatial
sampling
Representativenes
s of input
Sample retrieval
Results
AOD & ssa
comparisons to
AERONET
AOD and ssa
distribution
Maps of TOA and
surface DARF
Comparisons of
DARF to previous
results
Conclusions

Comparisons of DFaerosol to previous results
Seasonal clear-sky DFaerosol results at TOA and SFC from models and observations [W/m2] after CCSP, adapted from Yu et al. 2006.
Goals & Motivation
Approach
Technical details
Input & Spatial
sampling
Representativenes
s of input
Sample retrieval
Results
AOD & ssa
comparisons to
AERONET
AOD and ssa
distribution
Maps of TOA and
surface DARF
Comparisons of
DARF to previous
results
Conclusions

[Kacenelenbogen et al., in prep.]
CALIOP Aerosol Above Cloud observationsC
AL
IOP
AA
C A
OD
HSRL AAC AOD
day and night RMSE: 0.07
Bias: 3.68 x 10⁻¹⁸
• Lack of correlation CALIOP – HSRL AAC AOD and ~68% of points
outside the ±40% envelope
60
50
40
30
20
10
0CALIOP, October 2007
• CALIOP detects AAC in ~23% of the cases where the HSRL detects AAC
• CALIOP underestimation of AAC mostly due to tenuous aerosol layers under the
CALIOP detection threshold
R2=0.27N=151
HSRL AACCALIOP AAC86 flights 2006-09

ConclusionsThis data set:
– Provides a PURELY observational estimate of clear-sky DFaerosol (z) that compares favorably with previous observationally-based estimates and better with model based estimates at TOA
– Is based on stringently quality-screened, instantaneously collocated level 2 MODIS AOD (7/2l), OMI AAOD at 388nm, and CALIOP aerosol backscatter at 532nm
– Is based on aerosol models that are consistent with suborbital obs– Uses OMAERUV over land and OMAERO over ocean (because of
representativeness of their subsampling)– Contains 12 months (2007) of aerosol extinction, ssa and g as f(t,
lat, long, l, z)
– Agrees better with AERONET in terms of ssa(441nm) than input OMI+MODIS data
– Uses CALIOP layer heights to constrain OMAERUV AAOD– Provides uncertainty estimates based on range of aerosol models
that are consistent with observation within their uncertainties
Future work:– Utilize MODIS DB and/or MAIAC data – Cover all of the available collocated MODIS, OMI, CALIOP data
(June 2006-Dec. 2008)– All-sky DFaerosol by running retrievals with limited input
Goals & Motivation
Approach
Technical details
Input & Spatial
sampling
Representativenes
s of input
Sample retrieval
Results
AOD & ssa
comparisons to
AERONET
AOD and ssa
distribution
Maps of TOA and
surface DARF
Comparisons of
DARF to previous
results
Conclusions

ADDITIONAL SLIDES

Aerosol models: Based on field observations, optimized to span observed range of ssa vs. EAE and lidar ratio vs. EAE
Goals & Motivation
Approach
Technical details
Input & Spatial
sampling
Aerosol models
Metric
Sample retrieval
Representativenes
s of input
Results
AOD & ssa
comparisons to
AERONET
AOD and ssa
distribution
Maps of TOA and
surface DARF
Comparisons of
DARF to previous
results
Conclusions

Minimize X and select top 3% solutions with
2/12
ˆ
ˆ
i
ii
ii x
xxw
ix̂ix : retrieved parameters
: observables
: uncertainties in obs.
: weighting factorsix̂
iw
iii xxx ˆ|ˆ|
Metric: Simple weighted cost function
xi = AOD 550nm (±0.03±5%) AOD 1240 nm (±0.03±5%) - MODIS AAOD 388 nm ±(0.05+30%) - OMI
b532 ±(0.1Mm-1sr-1+30%), - CALIOP
Goals & Motivation
Approach
Technical details
Input & Spatial
sampling
Aerosol models
Metric
Sample retrieval
Representativenes
s of input
Results
AOD & ssa
comparisons to
AERONET
AOD and ssa
distribution
Maps of TOA and
surface DARF
Comparisons of
DARF to previous
results
Conclusions
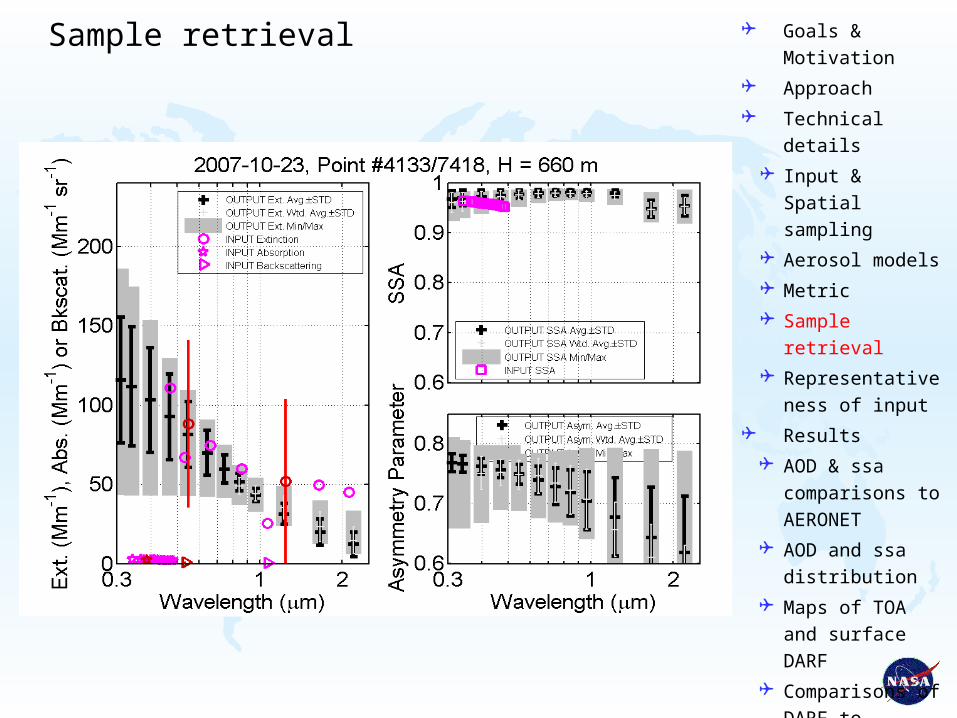
Sample retrieval Goals & Motivation
Approach
Technical details
Input & Spatial
sampling
Aerosol models
Metric
Sample retrieval
Representativenes
s of input
Results
AOD & ssa
comparisons to
AERONET
AOD and ssa
distribution
Maps of TOA and
surface DARF
Comparisons of
DARF to previous
results
Conclusions

Goals & Motivation
Approach
Technical details
Input & Spatial
sampling
Aerosol models
Metric
Sample retrieval
Representativenes
s of input
Results
AOD & ssa
comparisons to
AERONET
AOD and ssa
distribution
Maps of TOA and
surface DARF
Comparisons of
DARF to previous
results
Conclusions
AOD & ssa comparisons to AERONET – Land (Dark Target)
Positive bias in input ssa data is removed
in MOC retrieval
ssa441nm
AOD500nm

![[SHINOZUKA] Modeling Synthetics and Engineering Applications of Strong Earthquake Wave Motion](https://img.pdfslide.net/doc/110x75/577cc3a51a28aba71196b006/shinozuka-modeling-synthetics-and-engineering-applications-of-strong-earthquake.jpg)