Embed Size (px)
Citation preview
Direct atomic structure determination by theinspection of structural phasePhilip N. H. Nakashimaa,1, Alexander F. Moodieb, and Joanne Etheridgea,b
aDepartment of Materials Engineering and bMonash Centre for Electron Microscopy, Monash University, VIC 3800, Australia
Edited by David A. Weitz, Harvard University, Cambridge, MA, and approved July 18, 2013 (received for review April 22, 2013)
A century has passed since Bragg solved the first atomic structureusing diffraction. As with this first structure, all atomic structuresto date have been deduced from the measurement of many dif-fracted intensities using iterative and statistical methods. Weshow that centrosymmetric atomic structures can be determinedwithout the need to measure or even record a diffracted intensity.Instead, atomic structures can be determined directly and quicklyfrom the observation of crystallographic phases in electron dif-fraction patterns. Furthermore, only a few phases are required toachieve high resolution. This represents a paradigm shift in struc-ture determination methods, which we demonstrate with themoderately complex α-Al2O3. We show that the observation ofjust nine phases enables the location of all atoms with a resolutionof better than 0.1 Å. This level of certainty previously required themeasurement of thousands of diffracted intensities.
crystallographic phase problem | convergent beam electron diffraction |CBED | 3-beam diffraction
Determining the atomic structure of a material is a vital stepin the fundamental understanding of its properties. Crystal
structures can be described by a Fourier series whose coefficientsare called “structure factors” (1–3). The structure factor mag-nitude indicates how much matter there is, and its phase indi-cates where it is. As with the first structure determined by Bragg(4), all atomic structures to date have, in essence, had to bededuced indirectly from measurements of magnitude only. Thisis because phase information is either entirely lost in the in-tensities of X-ray and neutron diffraction patterns or difficultto extract analytically from electron diffraction patterns (thenotorious phase problem) (1, 5–8). The absence of phase in-formation, and hence explicit information on the location ofmatter, has necessitated an indirect approach to structure de-termination that has prevailed since Bragg’s original discovery.The structure must be deduced by refining structural models it-eratively until they reproduce the diffracted intensities measuredin experiments (1, 3, 9–19). To achieve reliability, thousands ofdiffracted intensities must be measured. This is time-consuming,sometimes inaccurate, and uniqueness cannot be guaranteed ifthe phases are inaccessible. As bemoaned by many a crystallog-rapher, the quantity we should ideally measure is phase (5, 7, 8).Here we describe a method for the determination of structure
from the direct experimental observation of phase, withoutrecourse to structure refinement by iterative pattern matching(1, 3, 9–19). The method identifies distinctive features arisingfrom dynamical scattering in convergent beam electron diffraction(CBED) patterns taken in a three-beam condition to determineindividual phases by inspection. It depends on qualitative in-terpretation of the intensity distribution alone with all of thenecessary information obtained purely by inspection. Usingthe observed phases, the position of matter within the unit cellis rapidly and unequivocally identified. This method requires noknowledge of the crystal’s unit cell dimensions nor how manyatoms are in the cell and is independent of specimen thickness.It does not even assume that atoms exist (although it is wellknown that they do). This is a paradigm shift in atomic structuredetermination. We explain the method here, step-by-step, using
the moderately complex hexagonal centrosymmetric structure ofα-Al2O3 (30 atoms in its unit cell) as an example structure. Theoutline structure is evident after the observation of just fivestructure factor phases and is determined to better than 0.1 Åresolution after nine phases, sufficient to identify the subtle off-axis shifts of the oxygen atoms. Using conventional structuredetermination methods, the same structure required the mea-surement of several thousand magnitudes to deliver a comparablelevel of accuracy (20, 21).We make no assumptions about the structure of α-Al2O3. The
first step in the structure determination is to determine the spacegroup. This is readily determined by inspecting the symmetriesof appropriately oriented CBED patterns, using long-establishedmethods (22). No measurement of intensities is required. Fromthis we find that α-Al2O3 belongs to space group 167, R-3c.Having established the space group, one can index the re-
flections present in any CBED pattern from the same materialby relating CBED patterns from different zones via commonreciprocal lattice vectors.With the space group and pattern indexing in hand, we now
consider the special geometry of three-beam CBED patterns, asillustrated in Fig. 1. Three-beam patterns involve the simulta-neous satisfaction of the Bragg condition for two differentreflections, say g and h, where the scattering vectors, g and h, arenot collinear, meaning the Bragg condition loci for each re-flection intersect (ζg = 0 and ζh = 0, where ζ is the excitationerror or, in other words, deviation from the Bragg condition).This region of intersection is “three-beam” in nature if and onlyif no other Bragg loci pass through it. Previous work establishedthat such diffraction geometries in electron scattering allow themagnitudes of the structure factor triplet, Vg, Vh, and Vg–h(where g–h is the vector that couples discs g and h), to be mea-sured directly from the position of features in the intensity dis-tributions of the discs (23–26). More importantly, the position, Γ3,of one of these features gives the three-phase invariant (23–26):
Γ3 =σVh:Vg�h
Vg; [1]
where σ is the interaction constant for electrons of a particularenergy and is always positive. [It is of interest that the quantity,Γ3, which arises naturally in the analysis of three-beam dynamicalscattering, is the same as that introduced by Hauptman, whocalled it the three-phase invariant and derived it from an entirelydifferent approach (11).]The sign of Γ3 gives the sign of the three-phase invariant
and can be determined easily by inspection of the direction of
Author contributions: P.N.H.N., A.F.M., and J.E. designed research; P.N.H.N. performedresearch; P.N.H.N., A.F.M., and J.E. contributed new reagents/analytic tools; P.N.H.N. an-alyzed data; and P.N.H.N., A.F.M., and J.E. wrote the paper.
The authors declare no conflict of interest.
This article is a PNAS Direct Submission.1To whom correspondence should be addressed. E-mail: [email protected].
This article contains supporting information online at www.pnas.org/lookup/suppl/doi:10.1073/pnas.1307323110/-/DCSupplemental.
14144–14149 | PNAS | August 27, 2013 | vol. 110 | no. 35 www.pnas.org/cgi/doi/10.1073/pnas.1307323110
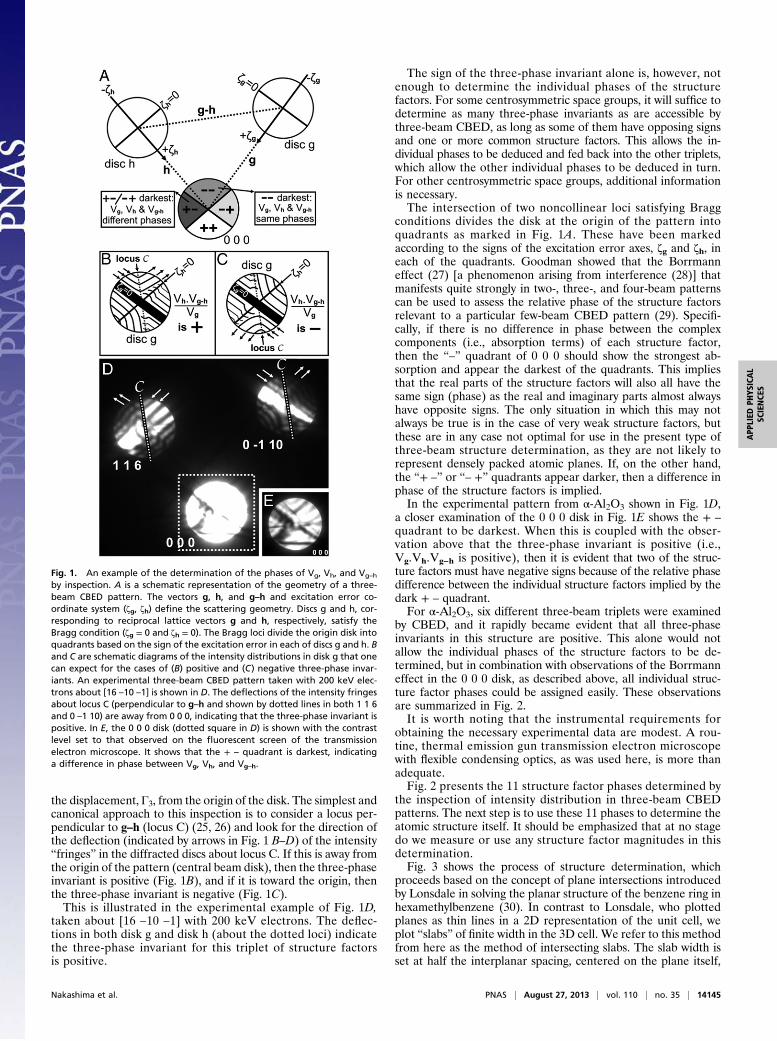
the displacement, Γ3, from the origin of the disk. The simplest andcanonical approach to this inspection is to consider a locus per-pendicular to g–h (locus C) (25, 26) and look for the direction ofthe deflection (indicated by arrows in Fig. 1 B–D) of the intensity“fringes” in the diffracted discs about locus C. If this is away fromthe origin of the pattern (central beam disk), then the three-phaseinvariant is positive (Fig. 1B), and if it is toward the origin, thenthe three-phase invariant is negative (Fig. 1C).This is illustrated in the experimental example of Fig. 1D,
taken about [16 –10 –1] with 200 keV electrons. The deflec-tions in both disk g and disk h (about the dotted loci) indicatethe three-phase invariant for this triplet of structure factorsis positive.
The sign of the three-phase invariant alone is, however, notenough to determine the individual phases of the structurefactors. For some centrosymmetric space groups, it will suffice todetermine as many three-phase invariants as are accessible bythree-beam CBED, as long as some of them have opposing signsand one or more common structure factors. This allows the in-dividual phases to be deduced and fed back into the other triplets,which allow the other individual phases to be deduced in turn.For other centrosymmetric space groups, additional informationis necessary.The intersection of two noncollinear loci satisfying Bragg
conditions divides the disk at the origin of the pattern intoquadrants as marked in Fig. 1A. These have been markedaccording to the signs of the excitation error axes, ζg and ζh, ineach of the quadrants. Goodman showed that the Borrmanneffect (27) [a phenomenon arising from interference (28)] thatmanifests quite strongly in two-, three-, and four-beam patternscan be used to assess the relative phase of the structure factorsrelevant to a particular few-beam CBED pattern (29). Specifi-cally, if there is no difference in phase between the complexcomponents (i.e., absorption terms) of each structure factor,then the “–” quadrant of 0 0 0 should show the strongest ab-sorption and appear the darkest of the quadrants. This impliesthat the real parts of the structure factors will also all have thesame sign (phase) as the real and imaginary parts almost alwayshave opposite signs. The only situation in which this may notalways be true is in the case of very weak structure factors, butthese are in any case not optimal for use in the present type ofthree-beam structure determination, as they are not likely torepresent densely packed atomic planes. If, on the other hand,the “+ –” or “– +” quadrants appear darker, then a difference inphase of the structure factors is implied.In the experimental pattern from α-Al2O3 shown in Fig. 1D,
a closer examination of the 0 0 0 disk in Fig. 1E shows the + –
quadrant to be darkest. When this is coupled with the obser-vation above that the three-phase invariant is positive (i.e.,Vg.Vh.Vg–h is positive), then it is evident that two of the struc-ture factors must have negative signs because of the relative phasedifference between the individual structure factors implied by thedark + – quadrant.For α-Al2O3, six different three-beam triplets were examined
by CBED, and it rapidly became evident that all three-phaseinvariants in this structure are positive. This alone would notallow the individual phases of the structure factors to be de-termined, but in combination with observations of the Borrmanneffect in the 0 0 0 disk, as described above, all individual struc-ture factor phases could be assigned easily. These observationsare summarized in Fig. 2.It is worth noting that the instrumental requirements for
obtaining the necessary experimental data are modest. A rou-tine, thermal emission gun transmission electron microscopewith flexible condensing optics, as was used here, is more thanadequate.Fig. 2 presents the 11 structure factor phases determined by
the inspection of intensity distribution in three-beam CBEDpatterns. The next step is to use these 11 phases to determine theatomic structure itself. It should be emphasized that at no stagedo we measure or use any structure factor magnitudes in thisdetermination.Fig. 3 shows the process of structure determination, which
proceeds based on the concept of plane intersections introducedby Lonsdale in solving the planar structure of the benzene ring inhexamethylbenzene (30). In contrast to Lonsdale, who plottedplanes as thin lines in a 2D representation of the unit cell, weplot “slabs” of finite width in the 3D cell. We refer to this methodfrom here as the method of intersecting slabs. The slab width isset at half the interplanar spacing, centered on the plane itself,
Fig. 1. An example of the determination of the phases of Vg, Vh, and Vg–h
by inspection. A is a schematic representation of the geometry of a three-beam CBED pattern. The vectors g, h, and g–h and excitation error co-ordinate system (ζg, ζh) define the scattering geometry. Discs g and h, cor-responding to reciprocal lattice vectors g and h, respectively, satisfy theBragg condition (ζg = 0 and ζh = 0). The Bragg loci divide the origin disk intoquadrants based on the sign of the excitation error in each of discs g and h. Band C are schematic diagrams of the intensity distributions in disk g that onecan expect for the cases of (B) positive and (C) negative three-phase invar-iants. An experimental three-beam CBED pattern taken with 200 keV elec-trons about [16 –10 –1] is shown in D. The deflections of the intensity fringesabout locus C (perpendicular to g–h and shown by dotted lines in both 1 1 6and 0 –1 10) are away from 0 0 0, indicating that the three-phase invariant ispositive. In E, the 0 0 0 disk (dotted square in D) is shown with the contrastlevel set to that observed on the fluorescent screen of the transmissionelectron microscope. It shows that the + – quadrant is darkest, indicatinga difference in phase between Vg, Vh, and Vg–h.
Nakashima et al. PNAS | August 27, 2013 | vol. 110 | no. 35 | 14145
APP
LIED
PHYS
ICAL
SCIENCE
S

and thus corresponding to the range ±π/2 in the argument of thecosine of the Fourier series expansion:
V ðrÞ=X
g
Vg e−2πig:r =X
g
Vg cosð−2πðhx+ ky+ lzÞÞ: [2]
More specifically, we allocate the value Vg to the region thatfalls within a distance of dhkl/4 (dhkl is the interplanar spacing forthe set of planes with Miller indices h, k, and l) from the planeand –Vg to the region between planes where dhkl/4 < d ≤ dhkl/2.In all cases, jVgj is set to 1, as the present method relies only onthe phases of the structure factors and not their magnitudes. Thisprocess effectively mimics the Fourier series with the exceptionthat the cosine function is essentially replaced by a square wavefunction with an amplitude of unity. Therefore, even in a crystalstructure where all of the structure factor phases are positive(e.g., CsCl; SI Text) or all of them are negative, this methodalways plots an equal number of positive and negative slabs, eachwith thickness dhkl/2 and magnitude of unity. The structure factorphases dictate where those positive and negative slabs are locatedwith respect to the corresponding sets of crystal planes. Next wewill show that fewer than 10 structure factor phases are necessaryfor an unequivocal atomic structure determination of α-Al2O3(and CsCl; see Fig. S1 and SI Text).Fig. 3A shows the positive slabs corresponding to (0 3 0)
planes, and Fig. 3B follows this by adding all symmetry-equivalent
slabs. At this point, the positive iso-surface has the form ofrods of intersection of the {0 3 0} slabs. Addition of successivesets of slabs proceeds in the order listed in Fig. 2. This processhas been animated and is provided as Movie S1, which makes theevolution of the slab intersection maxima easier to follow visu-ally. By Fig. 3E, after using only four symmetry-inequivalent setsof slabs, the outline structure appears, which reproduces thewell-established structure (21) of α-Al2O3 to within 0.12 Å.Addition of more sets of slabs, as shown in Fig. 3 F–I, furtherimproves the resolution. After a total of eight sets of slabs (Fig.3I), the resolution is <0.1 Å, as quantified in Fig. 4.In Fig. 3J, we compare the structure determined using this
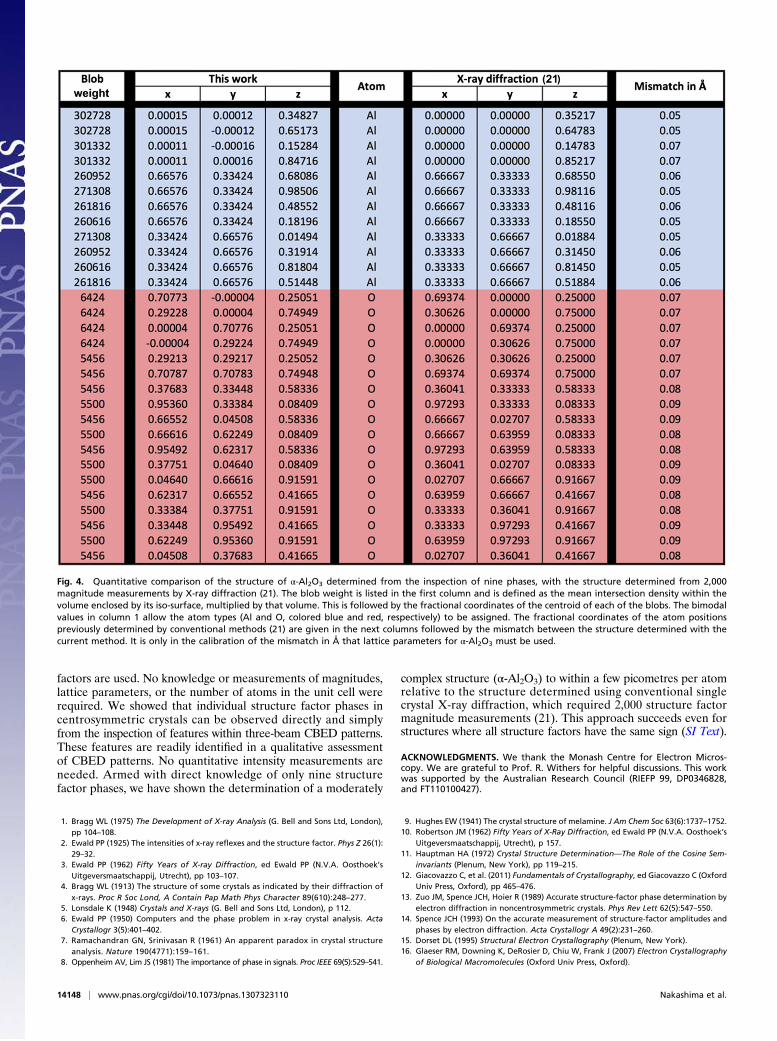
method (Fig. 3I) with the established structure determined byconventional methods [from about 2,000 structure factor mag-nitude measurements by X-ray diffraction (21)]. A quantitativecomparison is made in Fig. 4, which summarizes the locations ofthe centroids of each “blob” seen in Fig. 3I and compares themwith the previously published atomic positions for α-Al2O3 asdetermined by X-ray diffraction (21). We choose to use the wordblob here as no assumption has been made so far about theexistence of atoms in the probed material. We know, however,that the composition of the material is two aluminum atoms forevery three oxygen atoms, and we know that aluminum is muchheavier than oxygen. It is therefore trivial to assign an atomicspecies to each blob in Fig. 3I, as the blob weights are clearly
Fig. 2. Phase determination from the inspection of six experimental three-beam CBED triplets in α-Al2O3. Columns from left to right show the indicesof the minor zone axes at which the inspections were made; the direction of the deflection of the intensity fringes along locus C in discs g and h; thesign of the three-phase invariant deduced from the deflections; the quadrant in the 0 0 0 disk that is the darkest; the indices of g, h, and g–h; and theabsolute sign of each structure factor deduced directly from the information in this table. All of the above information was obtained by inspectiononly. The right-hand side of the table condenses these results into a set of 11 symmetry-inequivalent structure factors with their signs, as determinedby inspection.
14146 | www.pnas.org/cgi/doi/10.1073/pnas.1307323110 Nakashima et al.
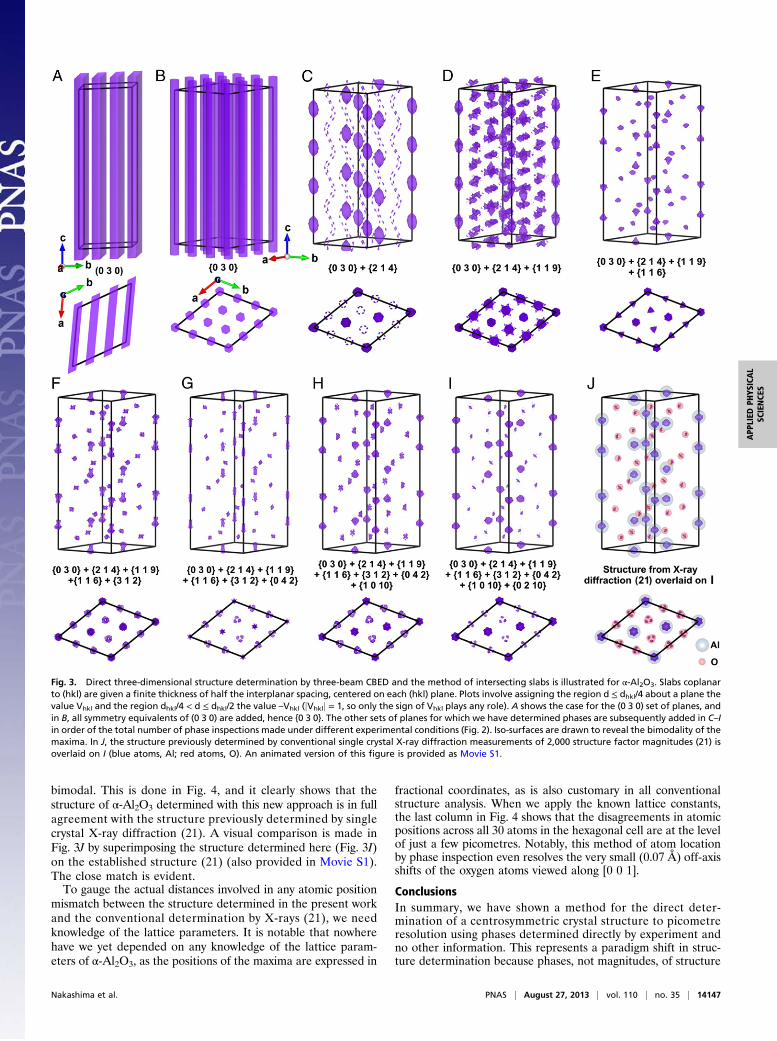
bimodal. This is done in Fig. 4, and it clearly shows that thestructure of α-Al2O3 determined with this new approach is in fullagreement with the structure previously determined by singlecrystal X-ray diffraction (21). A visual comparison is made inFig. 3J by superimposing the structure determined here (Fig. 3I)on the established structure (21) (also provided in Movie S1).The close match is evident.To gauge the actual distances involved in any atomic position
mismatch between the structure determined in the present workand the conventional determination by X-rays (21), we needknowledge of the lattice parameters. It is notable that nowherehave we yet depended on any knowledge of the lattice param-eters of α-Al2O3, as the positions of the maxima are expressed in
fractional coordinates, as is also customary in all conventionalstructure analysis. When we apply the known lattice constants,the last column in Fig. 4 shows that the disagreements in atomicpositions across all 30 atoms in the hexagonal cell are at the levelof just a few picometres. Notably, this method of atom locationby phase inspection even resolves the very small (0.07 Å) off-axisshifts of the oxygen atoms viewed along [0 0 1].
ConclusionsIn summary, we have shown a method for the direct deter-mination of a centrosymmetric crystal structure to picometreresolution using phases determined directly by experiment andno other information. This represents a paradigm shift in struc-ture determination because phases, not magnitudes, of structure
Fig. 3. Direct three-dimensional structure determination by three-beam CBED and the method of intersecting slabs is illustrated for α-Al2O3. Slabs coplanarto (hkl) are given a finite thickness of half the interplanar spacing, centered on each (hkl) plane. Plots involve assigning the region d ≤ dhkl/4 about a plane thevalue Vhkl and the region dhkl/4 < d ≤ dhkl/2 the value –Vhkl (jVhklj = 1, so only the sign of Vhkl plays any role). A shows the case for the (0 3 0) set of planes, andin B, all symmetry equivalents of (0 3 0) are added, hence {0 3 0}. The other sets of planes for which we have determined phases are subsequently added in C–Iin order of the total number of phase inspections made under different experimental conditions (Fig. 2). Iso-surfaces are drawn to reveal the bimodality of themaxima. In J, the structure previously determined by conventional single crystal X-ray diffraction measurements of 2,000 structure factor magnitudes (21) isoverlaid on I (blue atoms, Al; red atoms, O). An animated version of this figure is provided as Movie S1.
Nakashima et al. PNAS | August 27, 2013 | vol. 110 | no. 35 | 14147
APP
LIED
PHYS
ICAL
SCIENCE
S
factors are used. No knowledge or measurements of magnitudes,lattice parameters, or the number of atoms in the unit cell wererequired. We showed that individual structure factor phases incentrosymmetric crystals can be observed directly and simplyfrom the inspection of features within three-beam CBED patterns.These features are readily identified in a qualitative assessmentof CBED patterns. No quantitative intensity measurements areneeded. Armed with direct knowledge of only nine structurefactor phases, we have shown the determination of a moderately
complex structure (α-Al2O3) to within a few picometres per atomrelative to the structure determined using conventional singlecrystal X-ray diffraction, which required 2,000 structure factormagnitude measurements (21). This approach succeeds even forstructures where all structure factors have the same sign (SI Text).
ACKNOWLEDGMENTS. We thank the Monash Centre for Electron Micros-copy. We are grateful to Prof. R. Withers for helpful discussions. This workwas supported by the Australian Research Council (RIEFP 99, DP0346828,and FT110100427).
1. Bragg WL (1975) The Development of X-ray Analysis (G. Bell and Sons Ltd, London),pp 104–108.
2. Ewald PP (1925) The intensities of x-ray reflexes and the structure factor. Phys Z 26(1):29–32.
3. Ewald PP (1962) Fifty Years of X-ray Diffraction, ed Ewald PP (N.V.A. Oosthoek’sUitgeversmaatschappij, Utrecht), pp 103–107.
4. Bragg WL (1913) The structure of some crystals as indicated by their diffraction ofx-rays. Proc R Soc Lond, A Contain Pap Math Phys Character 89(610):248–277.
5. Lonsdale K (1948) Crystals and X-rays (G. Bell and Sons Ltd, London), p 112.6. Ewald PP (1950) Computers and the phase problem in x-ray crystal analysis. Acta
Crystallogr 3(5):401–402.7. Ramachandran GN, Srinivasan R (1961) An apparent paradox in crystal structure
analysis. Nature 190(4771):159–161.8. Oppenheim AV, Lim JS (1981) The importance of phase in signals. Proc IEEE 69(5):529–541.
9. Hughes EW (1941) The crystal structure of melamine. J Am Chem Soc 63(6):1737–1752.10. Robertson JM (1962) Fifty Years of X-Ray Diffraction, ed Ewald PP (N.V.A. Oosthoek’s
Uitgeversmaatschappij, Utrecht), p 157.11. Hauptman HA (1972) Crystal Structure Determination—The Role of the Cosine Sem-
invariants (Plenum, New York), pp 119–215.12. Giacovazzo C, et al. (2011) Fundamentals of Crystallography, ed Giacovazzo C (Oxford
Univ Press, Oxford), pp 465–476.13. Zuo JM, Spence JCH, Hoier R (1989) Accurate structure-factor phase determination by
electron diffraction in noncentrosymmetric crystals. Phys Rev Lett 62(5):547–550.14. Spence JCH (1993) On the accurate measurement of structure-factor amplitudes and
phases by electron diffraction. Acta Crystallogr A 49(2):231–260.15. Dorset DL (1995) Structural Electron Crystallography (Plenum, New York).16. Glaeser RM, Downing K, DeRosier D, Chiu W, Frank J (2007) Electron Crystallography
of Biological Macromolecules (Oxford Univ Press, Oxford).
Fig. 4. Quantitative comparison of the structure of α-Al2O3 determined from the inspection of nine phases, with the structure determined from 2,000magnitude measurements by X-ray diffraction (21). The blob weight is listed in the first column and is defined as the mean intersection density within thevolume enclosed by its iso-surface, multiplied by that volume. This is followed by the fractional coordinates of the centroid of each of the blobs. The bimodalvalues in column 1 allow the atom types (Al and O, colored blue and red, respectively) to be assigned. The fractional coordinates of the atom positionspreviously determined by conventional methods (21) are given in the next columns followed by the mismatch between the structure determined with thecurrent method. It is only in the calibration of the mismatch in Å that lattice parameters for α-Al2O3 must be used.
14148 | www.pnas.org/cgi/doi/10.1073/pnas.1307323110 Nakashima et al.

17. Cowley JM (1995) Diffraction Physics (Elsevier, Amsterdam), 3rd Ed.18. Vincent R, Midgley PA (1994) Double conical beam-rocking system for measurement
of integrated electron diffraction intensities. Ultramicroscopy 53(3):271–282.19. Kolb U, Mugnaioli E, Gorelik TE (2011) Automated electron diffraction tomography—
A new tool for nano crystal structure analysis. Cryst Res Technol 46(6):542–554.20. Lewis J, Schwarzenbach D, Flack HD (1982) Electric field gradients and charge density
in corundum, α-Al2O3. Acta Crystallogr A 38(SEPT):733–739.21. Maslen EN, Streltsov VA, Streltsova NR, Ishizawa N, Satow Y (1993) Synchrotron x-ray
study of the electron density in α-Al2O3. Acta Crystallogr B 49(6):973–980.22. Goodman P (2006) in International Tables for Crystallography Volume B: Reciprocal
Space, ed Shmueli U (Springer, Dordrecht, The Netherlands), pp 285–306.23. Moodie AF (1978-79) Some problems in imaging and inversion. Chem Scr 14(1-5):21–22.24. Moodie AF, Etheridge J, Humphreys CJ (1996) The symmetry of three-beam scattering
equations: Inversion of three-beam diffraction patterns from centrosymmetric crys-tals. Acta Crystallogr A 52(4):596–605.
25. Nakashima PNH, Moodie AF, Etheridge J (2007) Structural phase and amplitudemeasurement from distances in convergent-beam electron diffraction patterns. ActaCrystallogr A 63(Pt 5):387–390.
26. Nakashima PNH, Moodie AF, Etheridge J (2008) A practical guide to the mea-surement of structure phases and magnitudes by three-beam convergent beamelectron diffraction. Ultramicroscopy 108(9):901–910.
27. Borrmann G (1941) Über extinktionsdiagramme der Röntgenstrahlen von Quarz.Phys Z 42(1):157–162.
28. Anstis GR, Lynch DF, Moodie AF, O’Keefe MA (1973) N-beam lattice images. III. Upperlimits of ionicity in W4Nb26O77. Acta Crystallogr A 29(MAR):138–147.
29. Goodman P (1973) Borrmann effect in few-beam electron-diffraction patterns—Use of Born series to analyze diffraction asymmetries. Z Naturforsch A 28(5):580–587.
30. Lonsdale K (1929) The structure of the benzene ring in C6(CH3)6. Proc R Soc Lond, AContain Pap Math Phys Character 123(792):494–515.
Nakashima et al. PNAS | August 27, 2013 | vol. 110 | no. 35 | 14149
APP
LIED
PHYS
ICAL
SCIENCE
S