Embed Size (px)
Citation preview
Direct Detection and Quantification of Methylationin Nucleic Acid Sequences Using High-ResolutionMelting Analysis
Carlos M. Rodrıguez Lopez, Beatriz Guzman Asenjo, Amanda J. Lloyd, and Mike J. Wilkinson*
Aberystwyth University, IBERSsInstitute of Biological, Environmental and Rural Sciences, Aberystwyth,Wales, SY23 3DA, UK
High-resolution melting (HRM) analysis exploits the re-duced thermal stability of DNA fragments that containbase mismatches to detect single nucleotide polymor-phisms (SNPs). However, the capacity of HRM to revealother features of DNA chemistry remains unexplored.DNA methylation plays a key role in regulating geneexpression and is essential for normal development inmany higher organisms. The presence of methylated basesperturbs the double-stranded DNA structure, although itseffect on DNA thermal stability is largely unknown. Here,we reveal that methylated DNA has enhanced thermalstability and is sufficiently divergent from nonmethylatedDNA to allow detection and quantification by HRM analy-sis. This approach reliably distinguishes between sequence-identical DNA differing only in the methylation of onebase. The method also provides accurate discriminationbetween mixes of methylated and nonmethylated DNAs,allowing discrimination between DNA that is 1% and 0%methylated and also between 97.5% and 100% methy-lated. Thus, the method provides a new means of adjust-ing thermal optima for DNA hybridization and PCR-basedtechniques and to empirically measure the impact of DNAmethylation marks on the thermostability of regulatoryregions. In the longer term, it could enable the develop-ment of new techniques to quantify methylated DNA.
DNA methylation is widespread across many distinct eukary-otic phyla, including plants, mammals, birds, and invertebrates.1-4
DNA methylation usually involves the incorporation of a methylgroup to carbon 5 of the cytosine pyrimidine ring to form5-methylcytosine. Methylcytosine has attracted particular interestamong molecular biologists because of its confirmed role in generegulation.
In plants, cytosines are methylated in cytosine-guanine (CpG)dinucleotides or in the CpHpG and CpHpH contexts, where Hcan be any nucleotide but guanine. DNA methylation has alsobeen implicated in the regulation of development and differentia-
tion of cell type.5 The presence of methylcytosine is often linkedwith gene silencing. For example, in Arabidopsis thaliana L.hypermethylated alleles of genes SUPERMAN (SUP), PHOSPHO-RIBOSYLANTHRANILATE ISOMERASE (PAI) and AGAMOUS(AG)6-8 show significantly reduced expression, as do hyperm-ethylated forms of CYCLOIDEA (LCYC) in Linaria.9 Conversely,hypomethylated alleles of APETALA3 (AP3) and FWA in A.thaliana exhibit ectopic expression.10 Aberrant methylation hasalso been shown in plants affecting ecologically important traits,including floral symmetry,9 plant and seed pigmentation levels,11
and pathogen resistance.12 Phenotypes produced by such epial-leles could theoretically have substantial fitness implications ifobserved in the wild, although such effects are currently unre-ported. There is nevertheless evidence that epialleles can impacton agronomically important traits of crop plants. For example,COLORLESS NON-RIPENING (CNR) is a naturally occurringepimutation in tomato that inhibits normal ripening and producesa severe phenotype where fruit develop a colorless, mealypericarp.13
DNA methylation is similarly known to play a role in theepigenetic control of gene expression in many mammalian species,including humans, and is essential for normal embryonic develop-ment, genomic imprinting, and X-chromosome inactivation.14 Inmammals, 5-methylcytosine is found almost exclusively in the CpGcontext. Among the earliest and most common genetic alterationsobserved in human malignancies is the aberrant methylation ofso-called “CpG islands” that are located within the 5′ regulatoryregions of genes, causing alterations to gene expression.14 Forinstance, MYOGENIC FACTOR 3 (MYF3) is normally hypom-ethylated in nonmalignant tissue but can be dramatically hyper-
* To whom correspondence should be addressed. E-mail: [email protected].(1) delGaudio, R.; DiGiaimo, R.; Geraci, G. FEBS Lett. 1997, 417, 48–52.(2) Finnegan, E. J.; Genger, R. K.; Peacock, W. J.; Dennis, E. S. Annu. Rev.
Plant Physiol. Plant Mol. Biol. 1998, 49, 223–247.(3) Gupta, S.; Pathak, R. U.; Kanungo, M. S. Gene 2006, 377, 159–168.(4) Suzuki, S.; Ono, R.; Narita, T.; Pask, A. J.; Shaw, G.; Wang, C.; Kohda, T.;
Alsop, A. E.; Graves, J. A. M.; Kohara, Y.; Ishino, F.; Renfree, M. B.; Kaneko-Ishino, T. PLoS Genet. 2007, 34, 531–537.
(5) Finnegan, E. J.; Peacock, W. J.; Dennis, E. S. Curr. Opin. Genet. Dev. 2000,10, 217–223.
(6) Jacobsen, S. E.; Meyerowitz, E. M. Science 1997, 277, 1100–1103.(7) Melquist, S.; Luff, B.; Bender, J. Genetics 1999, 153, 401–413.(8) Jacobsen, S. E.; Sakai, H.; Finnegan, E. J.; Cao, X. F.; Meyerowitz, E. M.
Curr. Biol. 2000, 10, 179–186.(9) Cubas, P.; Vincent, C.; Coen, E. Nature 1999, 401, 157–161.
(10) Kinoshita, T.; Miura, A.; Choi, Y. H.; Kinoshita, Y.; Cao, X. F.; Jacobsen,S. E.; Fischer, R. L.; Kakutani, T. Science 2004, 303, 521–523.
(11) Chandler, V. L.; Eggleston, W. B.; Dorweiler, J. E. Plant Mol. Biol. 2000,43, 121–145.
(12) Stokes, T. L.; Kunkel, B. N.; Richards, E. J. Genes Dev. 2002, 16, 171–182.
(13) Manning, K.; Tor, M.; Poole, M.; Hong, Y,; Thompson, A. J.; King, G. J.;Giovannoni, J. J.; Seymour, G. B. Nat. Genet. 2006, 38, 948–952.
(14) Jones, P. A.; Laird, P. W. Nat. Genet. 1999, 21, 163–167.
Anal. Chem. 2010, 82, 9100–9108
10.1021/ac1024057 2010 American Chemical Society9100 Analytical Chemistry, Vol. 82, No. 21, November 1, 2010Published on Web 10/14/2010
methylated in many types of cancerous tissue.15 Thus, interest inmethods to detect and quantify DNA methylation is growing asresearch and clinical interest in the importance of the phenomenonintensifies.
Several techniques have been developed for the detection andlocalization of DNA methylation, but all have limitations. Earlymethods relied on the differential ability of methylation sensitiverestriction enzymes to digest methylated and nonmethylated DNAtemplates16-20 and typically featured restriction of genomic DNAfollowed by Southern analysis or PCR amplification. Here,problems arise due to the limited number or inappropriate locationof restriction sites, incomplete DNA digestion for reasons otherthan the presence of methylated DNA (e.g., insufficient incubationtime, excess template, suboptimal buffer chemistry, or the pres-ence of endogenous chemical agents that denature or deactivatethe restriction enzymes), and, for hybridization-based systems,the requirement for substantive quantities of clean template DNA.Many of the more recent DNA methylation detection techniquesare based on the prior application of sodium bisulfite to thegenomic DNA. This treatment converts nonmethylated cytosinesto uracils but leaves methylated cytosines unaffected. In subse-quent amplification by PCR, uracils are converted to thymidineswhile methylated cytosines remain unchanged.21 Methylationstatus can then be determined most directly using various formsof DNA sequencing22-24 or inferred indirectly, such as bycompetitive PCR approaches in which amplification is eitherenhanced or impeded by the presence of sites carrying bisulfiteconversions18,19 or converted single-nucleotide polymorphism(SNP) detection via high-resolution melting (HRM) analysis.25,26
The main issue with all methods based on bisulfite-mediatedconversion lay with the need to ensure complete base conver-sion.27 Other techniques focus on the analysis of the global levelsof DNA methylation in complete genomes.28 This approachcombines capillary electrophoresis and immunocapture of meth-ylated DNA to deliver a quick assay that needs small amounts ofinitial genomic DNA but lacks single base resolution. Recently,another issue emerged. It was reported that methyl-sensitiveenzymes and bisulfite modification of the DNA cannot distinguishbetween methylated cytosines and other DNA modifications, suchas cytosine hydroxymethylation.29
Cytosine methylation is known to slightly change the finestructure of DNA30 and to change the conformation of repeatarrays.31-33 However, the effect on the fine-scale thermostabilityof oligonucleotides or short sections of genomic DNA is unre-ported. HRM analysis offers a highly sensitive means of detectingsubtle changes to DNA thermostability and has been widely usedfor SNP genotyping,34,35 distinguishing homozygous and het-erozygous sequence variants,36 and to characterize microsatellitesand sequence-characterized amplified product markers.37 To date,its use for the detection of methylcytosine has been limited toindirect analysis of PCR amplicons generated from bisulfite-converted template DNA.18,38 Recent developments in fluorescent-detection instruments and the use of fully saturating intercalatingdyes have made HRM analysis considerably more sensitive andaccurate,38-41 perhaps creating the opportunity to apply thetechnique to study slight changes in thermostability afforded byDNA methylation. Specifically, fluorescent melt data can now beacquired at a rate of 0.1 °C s-1, allowing for rapid, high-throughput, and high-resolution analysis of DNA. Multivalentcations (such as Mg2+), small proteins such as spermidine, orpeptides containing alternating lysine bases stabilize differen-tially methylated and nonmethylated DNA by cooperativeshielding of phosphate backbones of helical DNA.42,43 How theyaffect HRM profiles is yet to be evaluated. In this study, weinvestigated the feasibility of using HRM technology to detectchanges to the methylation status of DNA.
EXPERIMENTAL SECTIONTarget DNA. HPLC-purified methylated and nonmethylated
DNA fragments representing three oligonucleotide sequenceswere synthesized by Sigma Aldrich (UK) (Table S-1, SupportingInformation). The first fragment was a 77 base long oligonucle-otide and contained seven CpG sites, hereafter denoted ashypothetical gene (Table S-1a, Supporting Information). In themethylated version, seven cytosines within the CpG dinucleotideswere replaced by 5-methylcytosines on both strands, but theremaining bases were unchanged. The second sequence wasrepresentative of a 32 base section of the human MYF3 gene, again
(15) Chen, B.; Dias, P.; Jenkins, J. J.; Savell, V. H.; Parham, D. M. Am. J. Pathol.1998, 152, 1071–1079.
(16) Singersam, J.; Grant, M.; Lebon, J. M.; Okuyama, K.; Chapman, V.; Monk,M.; Riggs, A. D. Mol. Cell. Biol. 1990, 10, 4987–4989.
(17) Singer, J.; Robertsems, J.; Riggs, A. D. Science 1979, 203, 1019–1021.(18) Herman, J. G.; Graff, J. R.; Myohanen, S.; Nelkin, B. D.; Baylin, S. B. Proc.
Natl. Acad. Sci. U.S.A. 1996, 93, 9821–9826.(19) Eads, C. A.; Danenberg, K. D.; Kawakami, K.; Saltz, L. B.; Blake, C.; Shibata,
D.; Danenberg, P. V.; Laird, P. W. Nucleic Acids Res. 2000, 28, E32.(20) Reyna-Lopez, G. E.; Simpson, J.; Ruiz-Herrera, J. Mol. Gen. Genet. 1997,
253, 703–710.(21) Wang, R. Y.-H.; Gehrke, C. W.; Ehrlich, M. Nucleic Acids Res. 1980, 8,
4777–4790.(22) Sanger, F.; Nicklen, S.; Coulson, A. R. Proc. Natl. Acad. Sci. U.S.A. 1977,
74, 5463–5467.(23) Sanger, F.; Coulson, A. R.; Barrell, B. G.; Smith, A. J. H.; Roe, B. A. J. Mol.
Biol. 1980, 143, 161–178.(24) Elaine, R. M. Trends Genet. 2008, 24, 133–141.(25) Worm, J.; Aggerholm, A.; Guldberg, P. Clin Chem. 2001, 47, 1183–1189.(26) White, H. E.; Hall, V. J.; Cross, N. C. P. Clin Chem. 2007, 53, 1960–1962.(27) Voss, K. O.; Roos, K. P.; Nonay, R. L.; Dovichi, N. J. Anal. Chem. 1998,
70, 3818–3823.(28) Wang, X.; Song, Y.; Song, M.; Wang, Z.; Li, T.; Wang, H. Anal. Chem. 2009,
81, 7885–7891.
(29) Nestor, C.; Ruzov, A.; Meehan, R. R.; Dunican, D. S. BioTechniques 2010,484, 317–319.
(30) Heinemann, U.; Hahn, M. J. Biol. Chem. 1992, 267, 7332–7341.(31) Marcourt, L.; Cordier, C.; Couesnon, T.; Dodin, G. Eur. J. Biochem. 1999,
265, 1032–42.(32) Lefebvre, A.; Mauffret, O.; el Antri, S.; Monnot, M.; Lescot, E.; Fermandjian,
S. Eur. J. Biochem. 1995, 229, 445–54.(33) Cordier, C.; Marcourt, L.; Petitjean, M.; Dodin, G. FEBS J. 1999, 261,
722–733.(34) Liew, M.; Pryor, R; Palais, R.; Meadows, C.; Erali, M.; Lyon, E.; Wittwer,
C. Clin. Chem. 2004, 50, 1156–1164.(35) Germer, S.; Higuchi, R. Genome Res. 1999, 9, 72–78.(36) Herrmann, M. G.; Durtschi, J. D.; Bromley, L. K.; Wittwer, C. T.;
Voelkerding, K. V. Clin Chem. 2006, 52, 494–503.(37) Croxford, A. E.; Rogers, T.; Caligari, P. D. S.; Wilkinson, M. J. New Phytol.
2008, 180, 594–607.(38) Guldberg, P.; Worm, J.; Gronbaek, K. Methods 2002, 27, 121–127.(39) Monis, P. T.; Giglio, S.; Saint, C. P. Anal. Biochem. 2005, 340, 24–34.(40) Krypuy, M.; Newnham, G. M.; Thomas, D. M.; Conron, M.; Dobrovic, A.
BMC Cancer 2006, 6, 295–706.(41) Wittwer, C. T.; Reed, G. H.; Gundry, C. N.; Vandersteen, J. G.; Pryor, R. J.
Clin Chem. 2003, 49, 853–860.(42) Behe, M.; Felsenfeld, G. Proc. Natl. Acad. Sci. U.S.A. 1981, 78, 1619–
1623.(43) Kim, Y. G.; Park, H. J.; Kim, K. K.; Lowenhaupt, K.; Rich, A. Nucleic Acids
Res. 2006, 34, 4937–4942.
9101Analytical Chemistry, Vol. 82, No. 21, November 1, 2010
containing seven CpG sites (Table S-1b, Supporting Information).In the methylated version seven cytosines were replaced by5-methylcytosines on each strand, but the remaining bases wereunaltered. The final oligonucleotide was an 85 base sequencetaken from the tomato CNR gene (Table S-1c, Supporting Informa-tion). The oligonucleotides contained three CpG sites and oneCpHpG site. In the methylated versions, one, two, three, or fourcytosines within the four possible sites were synthesized with5-methylcytosines on both strands. In all cases, double-stranded(ds) DNA fragments were created by mixing complementaryoligonucleotides in equal proportions as described in Table S-2(Supporting Information), heating to 95 °C for 5 min, and allowingthe reaction mix to cool slowly to room temperature for at least15 min to ensure complete reannealling.
HRM Reaction Mix. dsDNA (typically 0.2 µM but see below)was added to a reaction mixture containing 0-3.0 mM MgCl2 or0.1-2.0 µM spermidine, 1.6 mM (NH4)SO4, 6.7 mM Tris-HCl(pH 8.8 at 25 °C), and 0.001% Tween-20. The intercalatingfluorescent DNA dye SYTO 09 (Invitrogen, UK) was added toa final concentration of 0.5 µM. All melts were performed in20 µL volumes.
HRM Conditions. Melting curve analysis was conducted onthe Rotor-Gene 6000 (software version 1.7, Qiagen, UK) using theCycling A-Green channel. During the melt, temperature wasincreased from 50 to 90 °C in 0.1 °C incremental steps, with eachstep held for 2s.
Using Rotor-Gene 6000 software, the melting curves werenormalized by calculation of the “line of best fit” between twonormalization regions selected before and after the major decreasein fluorescence (representing the “fragment melt”). Comparisonswere made between methylated and nonmethylated DNA in termsof Tm or in a combination of Tm and altered curve shape.
Effect of Methylated DNA/Nonmethylated DNA Mixes onHRM. The ability of HRM to provide a quantitative measure ofmethylation was assessed using 17 mixes of methylated andnonmethylated DNA (comprising 0, 1, 2.5, 5, 10, 20, 35, 45, 50,55, 60, 65, 75, 85, 90, 95, and 100% methylated DNA) for a 77 baselong oligonucleotide, representing a hypothetical region of atypical eukaryotic gene, which when methylated had sevenmethylated cytosines on each strand, and an 85 base longoligonucleotide from the tomato CNR gene, which when methy-lated had one or three methylated cytosines on each strand (TableS-1, Supporting Information). Five replicates were created for eachreaction mixture and then subjected to HRM analysis as above.
Optimization of Salt and Spermidine Concentration onHRM. HRM reaction mixtures were assembled using DNA mixescontaining 97.5 or 100% methylated DNA but with 0.1, 0.2, 0.5,1.0, 1.5, or 2.0 µM spermidine and 0, 1, 1.5, 2.5, 2.75, or 3 mMMgCl2. Five replicates were created for each reaction mixtureand then subjected to HRM analysis as above.
Sensitivity of Detection. To test the ability of HRM todistinguish between variable numbers of methylated sites in thesame fragment, CNR oligonucleotides containing zero to fourmethylated cytosine residues were subjected to HRM using theconditions described above. Eight replicates were created for eachreaction mixture and then subjected to HRM analysis as above.
Effect of Fragment Concentration. In order to determinethe current threshold of HRM for the detection of methylated DNA
needed for an optimal detection of the denaturation profiles, wecompiled a dilution series of DNA mixes ranging from 0.2 mM to0.2 nM. Three mixes were used in this experiment (0, 50, and100% methylated DNA).
Efficacy of HRM on Total Genomic DNA. We next testedthe capacity of HRM to detect global differences in the methylationstatus of genomic DNA. Here, we extracted genomic DNA fromtwo A. thaliana genotypes: Columbia (Col-0 ref N1092) and amethylation maintenance mutant met1 (Decreased Methylation2DNA, met1 ref N854300) using the DNeasy 96 Plant Kit (Qiagen,UK) and the Mixer Mill MM 300 (Retsch, Haan, Germany)according to the manufacturers’ instructions. Isolated DNA wasdiluted in nanopure water to produce working stocks of 30 ngµL-1. The isolated DNA was then sonicated at 120 W for 3 minto obtain fragments in the 100-600 bp size range. We thensubjected 500 ng of these fragmented DNAs to HRM asdescribed above.
Statistical Analysis. The significance of observed differencesbetween treatments in Tm and altered curve shape was calculatedby principal component analysis (PCA) and sample clusteranalysis (SCA) using Rotor-Gene ScreenClust HRM Software(Qiagen).44 The software calculates the optimal number ofclusters and allocates each sample into the most appropriatecluster, indicating, in this case, which methylation contents andreagent concentrations generates significantly different HRMcurves. The software also provides the probability that eachsample belongs to the assigned (and others) cluster(s) andthe typicality of samples within its allocated cluster (indicateshow well the sample fits within its allocated cluster).44
To maximize the discriminatory power, a preliminary analysiswas run for all experiments by fixing the maximum number ofpossible clusters for each specific experiment and then comparingto the optimal number of clusters generated automatically by thesoftware. Only groups of samples separated by both types ofanalysis and with probabilities (P) >0.999 and typicalities (T) >0.05were deemed statistically different.
RESULTS AND DISCUSSIONMethylation and DNA Thermostability. Here we explored
the capacity of HRM to directly detect and quantify DNAmethylation, with a longer term view toward developing newmethods. HRM has already been successfully employed for thedetection of epigenetic differences in DNA fragments followingbisulfite treatment.25,34 However, since there are weaknessesassociated with the efficacy of bisulfite-modified DNA,45 wedecided to employ HRM with artificially synthesized oligonucle-otides, thereby circumventing the bisulfite-treatment step. Tomaximize biological relevance, we elected to use DNA sequencescorresponding to a section of the 5′ regulatory region of the humanMYF3 gene and the tomato CNR gene, which can both showaberrant methylation in real biological samples.13,15 However, wealso included an arbitrary sequence of DNA to avoid limiting thestudy and to circumvent the possibility that structural featuresmay emerge as being characteristic of methylation-controlledgenes such as MYF3 and CNR.
(44) Reja, V.; Kwok, A.; Stone, G.; Yang, L.; Missel, A.; Menzela, C.; Bassam, B.Methods 2010, 504, S10–S14.
(45) Grunau, C.; Clark, S. J.; Rosenthal, A. Nucleic Acids Res. 2001, 29, E65-65.
9102 Analytical Chemistry, Vol. 82, No. 21, November 1, 2010
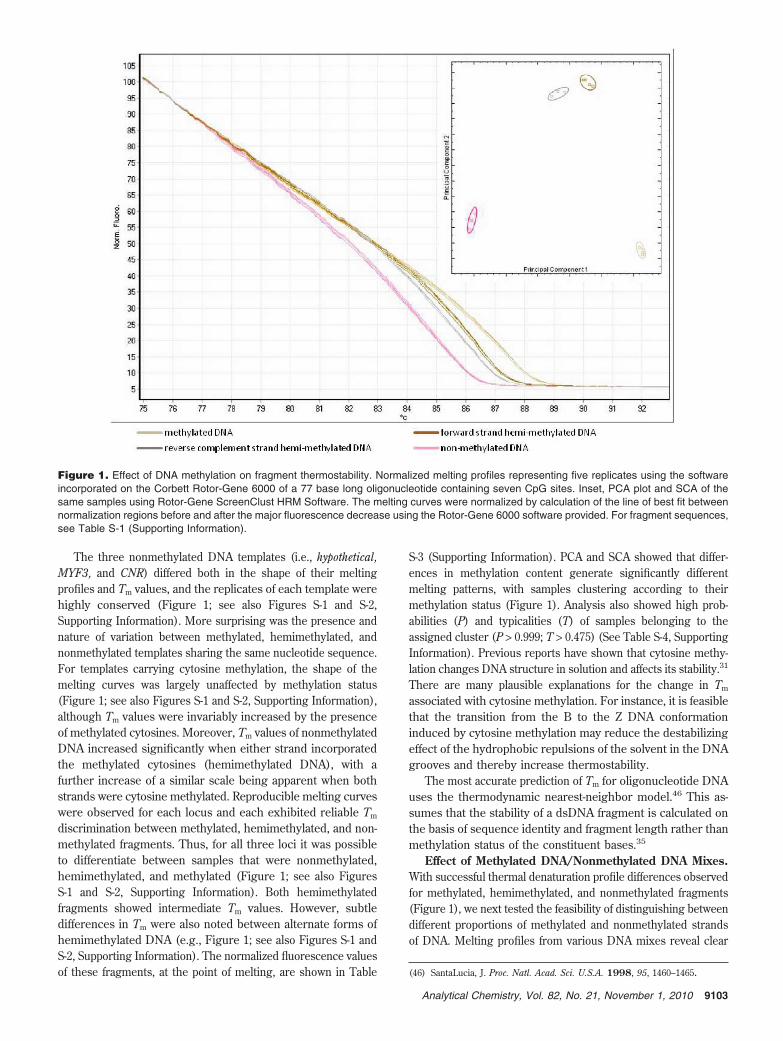
The three nonmethylated DNA templates (i.e., hypothetical,MYF3, and CNR) differed both in the shape of their meltingprofiles and Tm values, and the replicates of each template werehighly conserved (Figure 1; see also Figures S-1 and S-2,Supporting Information). More surprising was the presence andnature of variation between methylated, hemimethylated, andnonmethylated templates sharing the same nucleotide sequence.For templates carrying cytosine methylation, the shape of themelting curves was largely unaffected by methylation status(Figure 1; see also Figures S-1 and S-2, Supporting Information),although Tm values were invariably increased by the presenceof methylated cytosines. Moreover, Tm values of nonmethylatedDNA increased significantly when either strand incorporatedthe methylated cytosines (hemimethylated DNA), with afurther increase of a similar scale being apparent when bothstrands were cytosine methylated. Reproducible melting curveswere observed for each locus and each exhibited reliable Tm
discrimination between methylated, hemimethylated, and non-methylated fragments. Thus, for all three loci it was possibleto differentiate between samples that were nonmethylated,hemimethylated, and methylated (Figure 1; see also FiguresS-1 and S-2, Supporting Information). Both hemimethylatedfragments showed intermediate Tm values. However, subtledifferences in Tm were also noted between alternate forms ofhemimethylated DNA (e.g., Figure 1; see also Figures S-1 andS-2, Supporting Information). The normalized fluorescence valuesof these fragments, at the point of melting, are shown in Table
S-3 (Supporting Information). PCA and SCA showed that differ-ences in methylation content generate significantly differentmelting patterns, with samples clustering according to theirmethylation status (Figure 1). Analysis also showed high prob-abilities (P) and typicalities (T) of samples belonging to theassigned cluster (P > 0.999; T > 0.475) (See Table S-4, SupportingInformation). Previous reports have shown that cytosine methy-lation changes DNA structure in solution and affects its stability.31
There are many plausible explanations for the change in Tm
associated with cytosine methylation. For instance, it is feasiblethat the transition from the B to the Z DNA conformationinduced by cytosine methylation may reduce the destabilizingeffect of the hydrophobic repulsions of the solvent in the DNAgrooves and thereby increase thermostability.
The most accurate prediction of Tm for oligonucleotide DNAuses the thermodynamic nearest-neighbor model.46 This as-sumes that the stability of a dsDNA fragment is calculated onthe basis of sequence identity and fragment length rather thanmethylation status of the constituent bases.35
Effect of Methylated DNA/Nonmethylated DNA Mixes.With successful thermal denaturation profile differences observedfor methylated, hemimethylated, and nonmethylated fragments(Figure 1), we next tested the feasibility of distinguishing betweendifferent proportions of methylated and nonmethylated strandsof DNA. Melting profiles from various DNA mixes reveal clear
(46) SantaLucia, J. Proc. Natl. Acad. Sci. U.S.A. 1998, 95, 1460–1465.
Figure 1. Effect of DNA methylation on fragment thermostability. Normalized melting profiles representing five replicates using the softwareincorporated on the Corbett Rotor-Gene 6000 of a 77 base long oligonucleotide containing seven CpG sites. Inset, PCA plot and SCA of thesame samples using Rotor-Gene ScreenClust HRM Software. The melting curves were normalized by calculation of the line of best fit betweennormalization regions before and after the major fluorescence decrease using the Rotor-Gene 6000 software provided. For fragment sequences,see Table S-1 (Supporting Information).
9103Analytical Chemistry, Vol. 82, No. 21, November 1, 2010
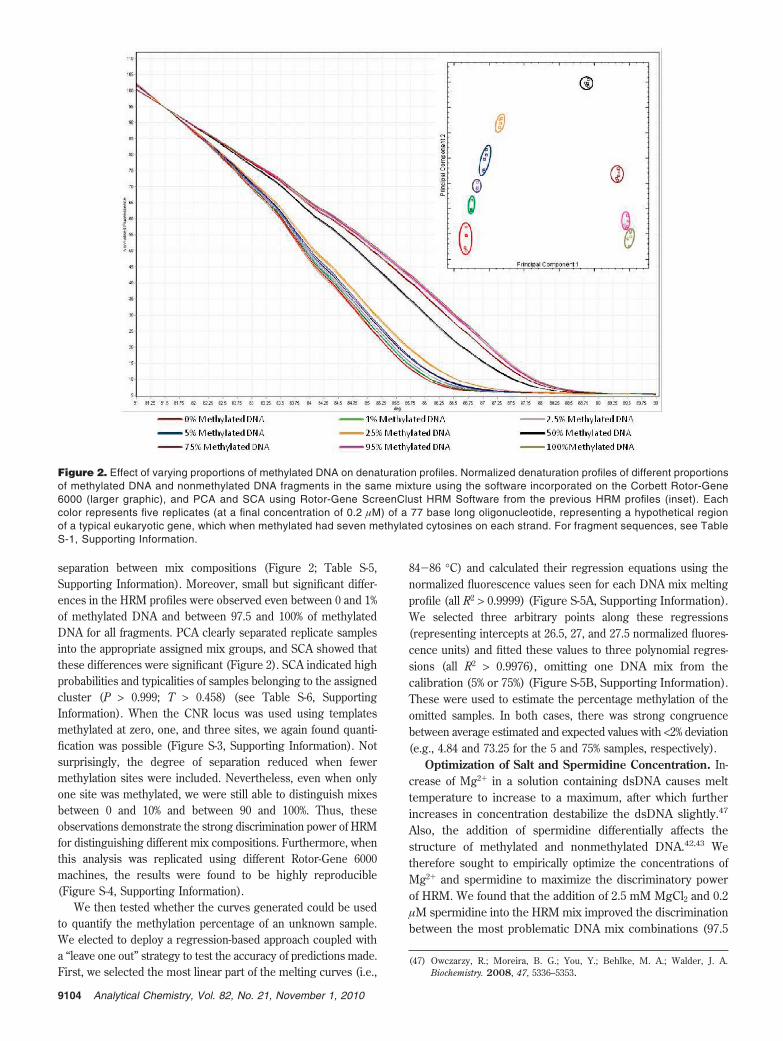
separation between mix compositions (Figure 2; Table S-5,Supporting Information). Moreover, small but significant differ-ences in the HRM profiles were observed even between 0 and 1%of methylated DNA and between 97.5 and 100% of methylatedDNA for all fragments. PCA clearly separated replicate samplesinto the appropriate assigned mix groups, and SCA showed thatthese differences were significant (Figure 2). SCA indicated highprobabilities and typicalities of samples belonging to the assignedcluster (P > 0.999; T > 0.458) (see Table S-6, SupportingInformation). When the CNR locus was used using templatesmethylated at zero, one, and three sites, we again found quanti-fication was possible (Figure S-3, Supporting Information). Notsurprisingly, the degree of separation reduced when fewermethylation sites were included. Nevertheless, even when onlyone site was methylated, we were still able to distinguish mixesbetween 0 and 10% and between 90 and 100%. Thus, theseobservations demonstrate the strong discrimination power of HRMfor distinguishing different mix compositions. Furthermore, whenthis analysis was replicated using different Rotor-Gene 6000machines, the results were found to be highly reproducible(Figure S-4, Supporting Information).
We then tested whether the curves generated could be usedto quantify the methylation percentage of an unknown sample.We elected to deploy a regression-based approach coupled witha “leave one out” strategy to test the accuracy of predictions made.First, we selected the most linear part of the melting curves (i.e.,
84-86 °C) and calculated their regression equations using thenormalized fluorescence values seen for each DNA mix meltingprofile (all R2 > 0.9999) (Figure S-5A, Supporting Information).We selected three arbitrary points along these regressions(representing intercepts at 26.5, 27, and 27.5 normalized fluores-cence units) and fitted these values to three polynomial regres-sions (all R2 > 0.9976), omitting one DNA mix from thecalibration (5% or 75%) (Figure S-5B, Supporting Information).These were used to estimate the percentage methylation of theomitted samples. In both cases, there was strong congruencebetween average estimated and expected values with <2% deviation(e.g., 4.84 and 73.25 for the 5 and 75% samples, respectively).
Optimization of Salt and Spermidine Concentration. In-crease of Mg2+ in a solution containing dsDNA causes melttemperature to increase to a maximum, after which furtherincreases in concentration destabilize the dsDNA slightly.47
Also, the addition of spermidine differentially affects thestructure of methylated and nonmethylated DNA.42,43 Wetherefore sought to empirically optimize the concentrations ofMg2+ and spermidine to maximize the discriminatory powerof HRM. We found that the addition of 2.5 mM MgCl2 and 0.2µM spermidine into the HRM mix improved the discriminationbetween the most problematic DNA mix combinations (97.5
(47) Owczarzy, R.; Moreira, B. G.; You, Y.; Behlke, M. A.; Walder, J. A.Biochemistry. 2008, 47, 5336–5353.
Figure 2. Effect of varying proportions of methylated DNA on denaturation profiles. Normalized denaturation profiles of different proportionsof methylated DNA and nonmethylated DNA fragments in the same mixture using the software incorporated on the Corbett Rotor-Gene6000 (larger graphic), and PCA and SCA using Rotor-Gene ScreenClust HRM Software from the previous HRM profiles (inset). Eachcolor represents five replicates (at a final concentration of 0.2 µM) of a 77 base long oligonucleotide, representing a hypothetical regionof a typical eukaryotic gene, which when methylated had seven methylated cytosines on each strand. For fragment sequences, see TableS-1, Supporting Information.
9104 Analytical Chemistry, Vol. 82, No. 21, November 1, 2010
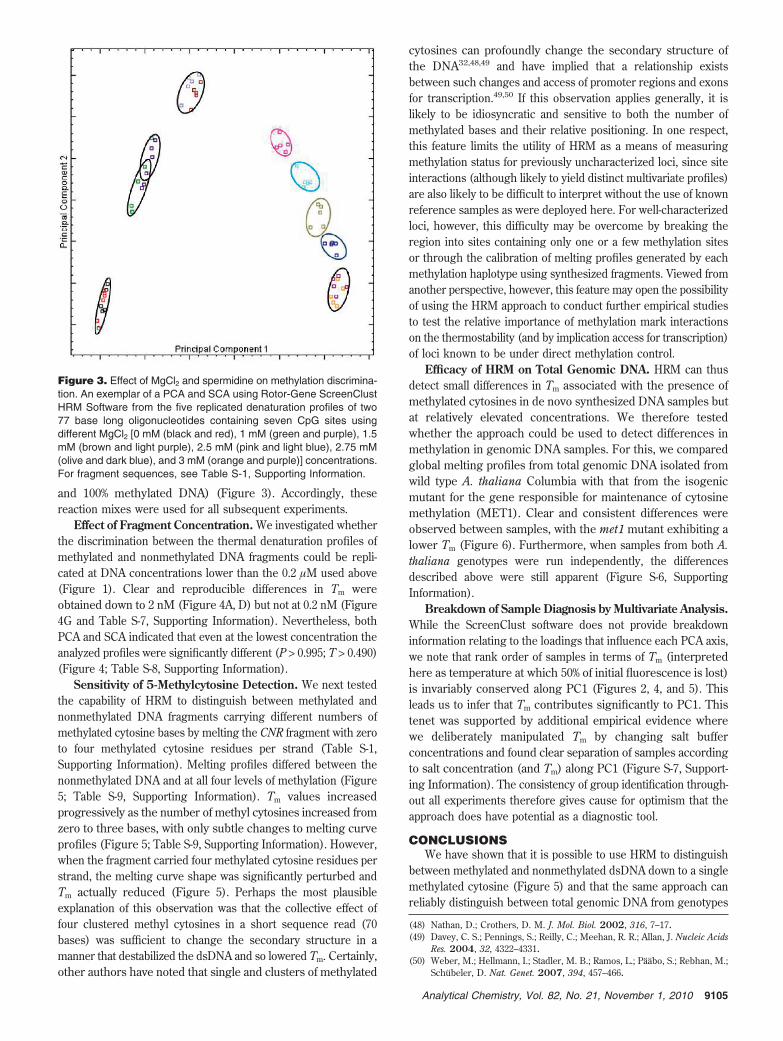
and 100% methylated DNA) (Figure 3). Accordingly, thesereaction mixes were used for all subsequent experiments.
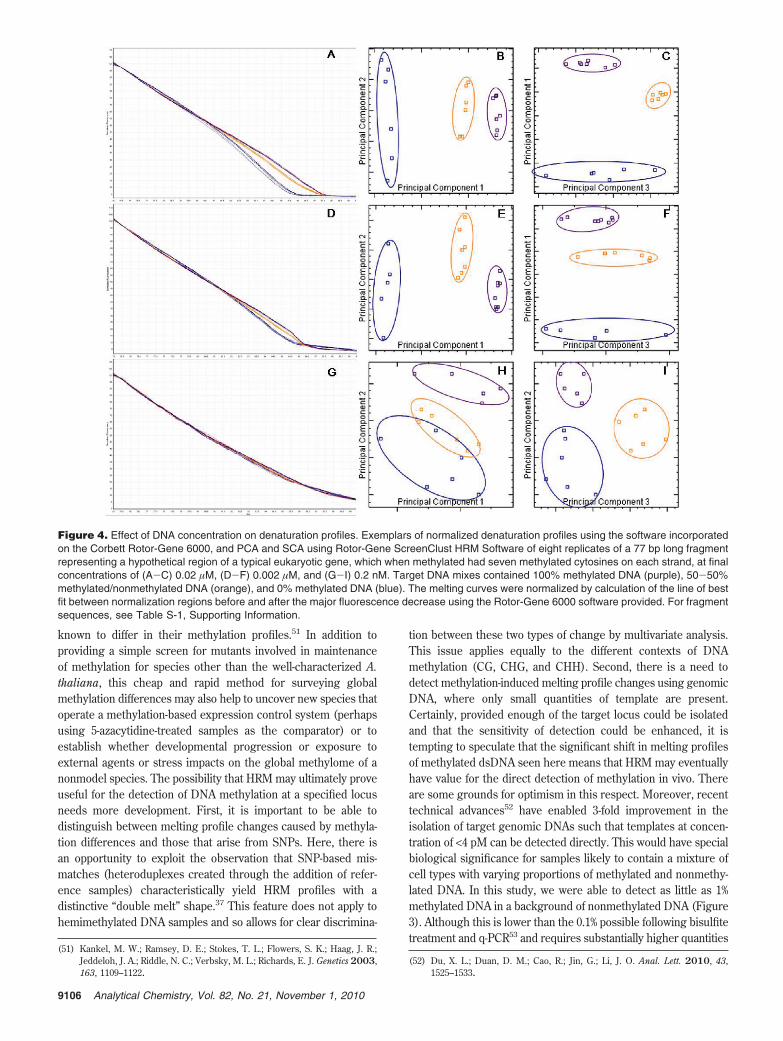
Effect of Fragment Concentration. We investigated whetherthe discrimination between the thermal denaturation profiles ofmethylated and nonmethylated DNA fragments could be repli-cated at DNA concentrations lower than the 0.2 µM used above(Figure 1). Clear and reproducible differences in Tm wereobtained down to 2 nM (Figure 4A, D) but not at 0.2 nM (Figure4G and Table S-7, Supporting Information). Nevertheless, bothPCA and SCA indicated that even at the lowest concentration theanalyzed profiles were significantly different (P > 0.995; T > 0.490)(Figure 4; Table S-8, Supporting Information).
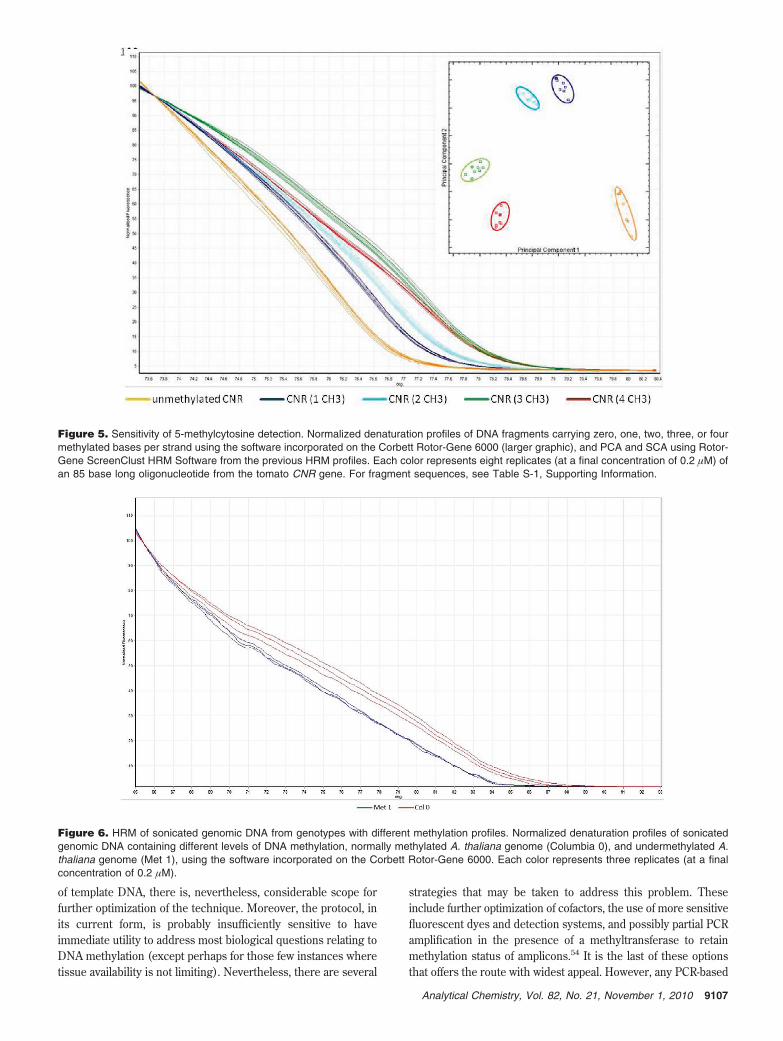
Sensitivity of 5-Methylcytosine Detection. We next testedthe capability of HRM to distinguish between methylated andnonmethylated DNA fragments carrying different numbers ofmethylated cytosine bases by melting the CNR fragment with zeroto four methylated cytosine residues per strand (Table S-1,Supporting Information). Melting profiles differed between thenonmethylated DNA and at all four levels of methylation (Figure5; Table S-9, Supporting Information). Tm values increasedprogressively as the number of methyl cytosines increased fromzero to three bases, with only subtle changes to melting curveprofiles (Figure 5; Table S-9, Supporting Information). However,when the fragment carried four methylated cytosine residues perstrand, the melting curve shape was significantly perturbed andTm actually reduced (Figure 5). Perhaps the most plausibleexplanation of this observation was that the collective effect offour clustered methyl cytosines in a short sequence read (70bases) was sufficient to change the secondary structure in amanner that destabilized the dsDNA and so lowered Tm. Certainly,other authors have noted that single and clusters of methylated
cytosines can profoundly change the secondary structure ofthe DNA32,48,49 and have implied that a relationship existsbetween such changes and access of promoter regions and exonsfor transcription.49,50 If this observation applies generally, it islikely to be idiosyncratic and sensitive to both the number ofmethylated bases and their relative positioning. In one respect,this feature limits the utility of HRM as a means of measuringmethylation status for previously uncharacterized loci, since siteinteractions (although likely to yield distinct multivariate profiles)are also likely to be difficult to interpret without the use of knownreference samples as were deployed here. For well-characterizedloci, however, this difficulty may be overcome by breaking theregion into sites containing only one or a few methylation sitesor through the calibration of melting profiles generated by eachmethylation haplotype using synthesized fragments. Viewed fromanother perspective, however, this feature may open the possibilityof using the HRM approach to conduct further empirical studiesto test the relative importance of methylation mark interactionson the thermostability (and by implication access for transcription)of loci known to be under direct methylation control.
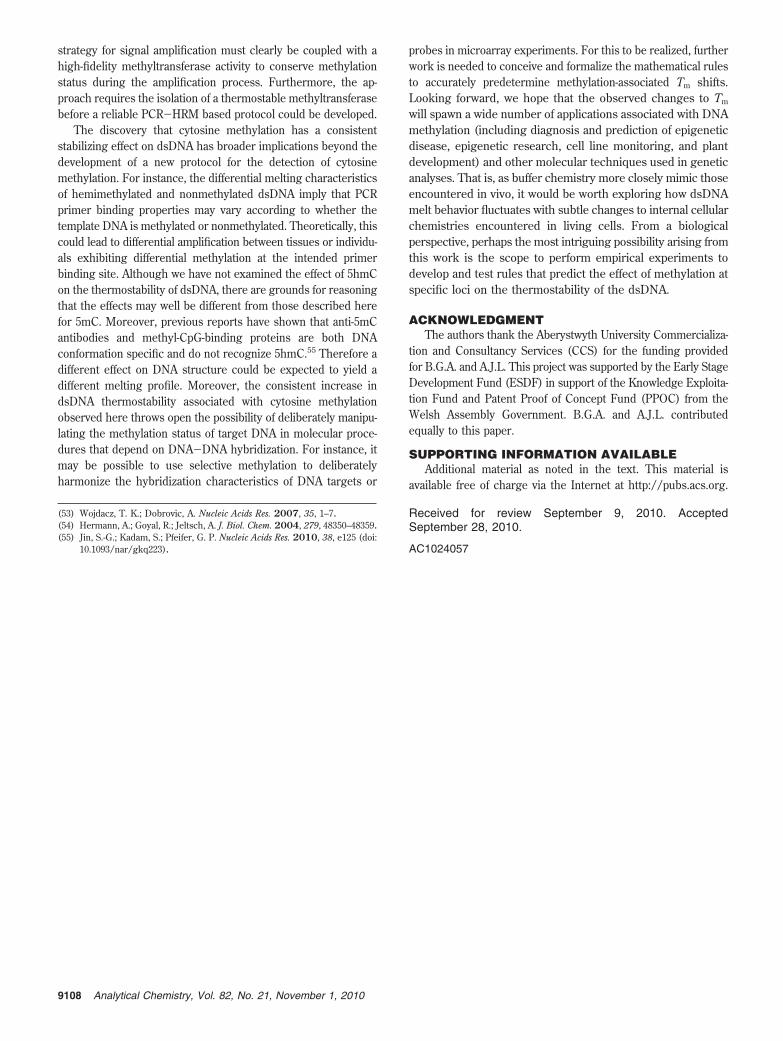
Efficacy of HRM on Total Genomic DNA. HRM can thusdetect small differences in Tm associated with the presence ofmethylated cytosines in de novo synthesized DNA samples butat relatively elevated concentrations. We therefore testedwhether the approach could be used to detect differences inmethylation in genomic DNA samples. For this, we comparedglobal melting profiles from total genomic DNA isolated fromwild type A. thaliana Columbia with that from the isogenicmutant for the gene responsible for maintenance of cytosinemethylation (MET1). Clear and consistent differences wereobserved between samples, with the met1 mutant exhibiting alower Tm (Figure 6). Furthermore, when samples from both A.thaliana genotypes were run independently, the differencesdescribed above were still apparent (Figure S-6, SupportingInformation).
Breakdown of Sample Diagnosis by Multivariate Analysis.While the ScreenClust software does not provide breakdowninformation relating to the loadings that influence each PCA axis,we note that rank order of samples in terms of Tm (interpretedhere as temperature at which 50% of initial fluorescence is lost)is invariably conserved along PC1 (Figures 2, 4, and 5). Thisleads us to infer that Tm contributes significantly to PC1. Thistenet was supported by additional empirical evidence wherewe deliberately manipulated Tm by changing salt bufferconcentrations and found clear separation of samples accordingto salt concentration (and Tm) along PC1 (Figure S-7, Support-ing Information). The consistency of group identification through-out all experiments therefore gives cause for optimism that theapproach does have potential as a diagnostic tool.
CONCLUSIONSWe have shown that it is possible to use HRM to distinguish
between methylated and nonmethylated dsDNA down to a singlemethylated cytosine (Figure 5) and that the same approach canreliably distinguish between total genomic DNA from genotypes
(48) Nathan, D.; Crothers, D. M. J. Mol. Biol. 2002, 316, 7–17.(49) Davey, C. S.; Pennings, S.; Reilly, C.; Meehan, R. R.; Allan, J. Nucleic Acids
Res. 2004, 32, 4322–4331.(50) Weber, M.; Hellmann, I.; Stadler, M. B.; Ramos, L.; Paabo, S.; Rebhan, M.;
Schubeler, D. Nat. Genet. 2007, 394, 457–466.
Figure 3. Effect of MgCl2 and spermidine on methylation discrimina-tion. An exemplar of a PCA and SCA using Rotor-Gene ScreenClustHRM Software from the five replicated denaturation profiles of two77 base long oligonucleotides containing seven CpG sites usingdifferent MgCl2 [0 mM (black and red), 1 mM (green and purple), 1.5mM (brown and light purple), 2.5 mM (pink and light blue), 2.75 mM(olive and dark blue), and 3 mM (orange and purple)] concentrations.For fragment sequences, see Table S-1, Supporting Information.
9105Analytical Chemistry, Vol. 82, No. 21, November 1, 2010
known to differ in their methylation profiles.51 In addition toproviding a simple screen for mutants involved in maintenanceof methylation for species other than the well-characterized A.thaliana, this cheap and rapid method for surveying globalmethylation differences may also help to uncover new species thatoperate a methylation-based expression control system (perhapsusing 5-azacytidine-treated samples as the comparator) or toestablish whether developmental progression or exposure toexternal agents or stress impacts on the global methylome of anonmodel species. The possibility that HRM may ultimately proveuseful for the detection of DNA methylation at a specified locusneeds more development. First, it is important to be able todistinguish between melting profile changes caused by methyla-tion differences and those that arise from SNPs. Here, there isan opportunity to exploit the observation that SNP-based mis-matches (heteroduplexes created through the addition of refer-ence samples) characteristically yield HRM profiles with adistinctive “double melt” shape.37 This feature does not apply tohemimethylated DNA samples and so allows for clear discrimina-
tion between these two types of change by multivariate analysis.This issue applies equally to the different contexts of DNAmethylation (CG, CHG, and CHH). Second, there is a need todetect methylation-induced melting profile changes using genomicDNA, where only small quantities of template are present.Certainly, provided enough of the target locus could be isolatedand that the sensitivity of detection could be enhanced, it istempting to speculate that the significant shift in melting profilesof methylated dsDNA seen here means that HRM may eventuallyhave value for the direct detection of methylation in vivo. Thereare some grounds for optimism in this respect. Moreover, recenttechnical advances52 have enabled 3-fold improvement in theisolation of target genomic DNAs such that templates at concen-tration of <4 pM can be detected directly. This would have specialbiological significance for samples likely to contain a mixture ofcell types with varying proportions of methylated and nonmethy-lated DNA. In this study, we were able to detect as little as 1%methylated DNA in a background of nonmethylated DNA (Figure3). Although this is lower than the 0.1% possible following bisulfitetreatment and q-PCR53 and requires substantially higher quantities
(51) Kankel, M. W.; Ramsey, D. E.; Stokes, T. L.; Flowers, S. K.; Haag, J. R.;Jeddeloh, J. A.; Riddle, N. C.; Verbsky, M. L.; Richards, E. J. Genetics 2003,163, 1109–1122.
(52) Du, X. L.; Duan, D. M.; Cao, R.; Jin, G.; Li, J. O. Anal. Lett. 2010, 43,1525–1533.
Figure 4. Effect of DNA concentration on denaturation profiles. Exemplars of normalized denaturation profiles using the software incorporatedon the Corbett Rotor-Gene 6000, and PCA and SCA using Rotor-Gene ScreenClust HRM Software of eight replicates of a 77 bp long fragmentrepresenting a hypothetical region of a typical eukaryotic gene, which when methylated had seven methylated cytosines on each strand, at finalconcentrations of (A-C) 0.02 µM, (D-F) 0.002 µM, and (G-I) 0.2 nM. Target DNA mixes contained 100% methylated DNA (purple), 50-50%methylated/nonmethylated DNA (orange), and 0% methylated DNA (blue). The melting curves were normalized by calculation of the line of bestfit between normalization regions before and after the major fluorescence decrease using the Rotor-Gene 6000 software provided. For fragmentsequences, see Table S-1, Supporting Information.
9106 Analytical Chemistry, Vol. 82, No. 21, November 1, 2010
of template DNA, there is, nevertheless, considerable scope forfurther optimization of the technique. Moreover, the protocol, inits current form, is probably insufficiently sensitive to haveimmediate utility to address most biological questions relating toDNA methylation (except perhaps for those few instances wheretissue availability is not limiting). Nevertheless, there are several
strategies that may be taken to address this problem. Theseinclude further optimization of cofactors, the use of more sensitivefluorescent dyes and detection systems, and possibly partial PCRamplification in the presence of a methyltransferase to retainmethylation status of amplicons.54 It is the last of these optionsthat offers the route with widest appeal. However, any PCR-based
Figure 5. Sensitivity of 5-methylcytosine detection. Normalized denaturation profiles of DNA fragments carrying zero, one, two, three, or fourmethylated bases per strand using the software incorporated on the Corbett Rotor-Gene 6000 (larger graphic), and PCA and SCA using Rotor-Gene ScreenClust HRM Software from the previous HRM profiles. Each color represents eight replicates (at a final concentration of 0.2 µM) ofan 85 base long oligonucleotide from the tomato CNR gene. For fragment sequences, see Table S-1, Supporting Information.
Figure 6. HRM of sonicated genomic DNA from genotypes with different methylation profiles. Normalized denaturation profiles of sonicatedgenomic DNA containing different levels of DNA methylation, normally methylated A. thaliana genome (Columbia 0), and undermethylated A.thaliana genome (Met 1), using the software incorporated on the Corbett Rotor-Gene 6000. Each color represents three replicates (at a finalconcentration of 0.2 µM).
9107Analytical Chemistry, Vol. 82, No. 21, November 1, 2010
strategy for signal amplification must clearly be coupled with ahigh-fidelity methyltransferase activity to conserve methylationstatus during the amplification process. Furthermore, the ap-proach requires the isolation of a thermostable methyltransferasebefore a reliable PCR-HRM based protocol could be developed.
The discovery that cytosine methylation has a consistentstabilizing effect on dsDNA has broader implications beyond thedevelopment of a new protocol for the detection of cytosinemethylation. For instance, the differential melting characteristicsof hemimethylated and nonmethylated dsDNA imply that PCRprimer binding properties may vary according to whether thetemplate DNA is methylated or nonmethylated. Theoretically, thiscould lead to differential amplification between tissues or individu-als exhibiting differential methylation at the intended primerbinding site. Although we have not examined the effect of 5hmCon the thermostability of dsDNA, there are grounds for reasoningthat the effects may well be different from those described herefor 5mC. Moreover, previous reports have shown that anti-5mCantibodies and methyl-CpG-binding proteins are both DNAconformation specific and do not recognize 5hmC.55 Therefore adifferent effect on DNA structure could be expected to yield adifferent melting profile. Moreover, the consistent increase indsDNA thermostability associated with cytosine methylationobserved here throws open the possibility of deliberately manipu-lating the methylation status of target DNA in molecular proce-dures that depend on DNA-DNA hybridization. For instance, itmay be possible to use selective methylation to deliberatelyharmonize the hybridization characteristics of DNA targets or
probes in microarray experiments. For this to be realized, furtherwork is needed to conceive and formalize the mathematical rulesto accurately predetermine methylation-associated Tm shifts.Looking forward, we hope that the observed changes to Tm
will spawn a wide number of applications associated with DNAmethylation (including diagnosis and prediction of epigeneticdisease, epigenetic research, cell line monitoring, and plantdevelopment) and other molecular techniques used in geneticanalyses. That is, as buffer chemistry more closely mimic thoseencountered in vivo, it would be worth exploring how dsDNAmelt behavior fluctuates with subtle changes to internal cellularchemistries encountered in living cells. From a biologicalperspective, perhaps the most intriguing possibility arising fromthis work is the scope to perform empirical experiments todevelop and test rules that predict the effect of methylation atspecific loci on the thermostability of the dsDNA.
ACKNOWLEDGMENTThe authors thank the Aberystwyth University Commercializa-
tion and Consultancy Services (CCS) for the funding providedfor B.G.A. and A.J.L. This project was supported by the Early StageDevelopment Fund (ESDF) in support of the Knowledge Exploita-tion Fund and Patent Proof of Concept Fund (PPOC) from theWelsh Assembly Government. B.G.A. and A.J.L. contributedequally to this paper.
SUPPORTING INFORMATION AVAILABLEAdditional material as noted in the text. This material is
available free of charge via the Internet at http://pubs.acs.org.
Received for review September 9, 2010. AcceptedSeptember 28, 2010.
AC1024057
(53) Wojdacz, T. K.; Dobrovic, A. Nucleic Acids Res. 2007, 35, 1–7.(54) Hermann, A.; Goyal, R.; Jeltsch, A. J. Biol. Chem. 2004, 279, 48350–48359.(55) Jin, S.-G.; Kadam, S.; Pfeifer, G. P. Nucleic Acids Res. 2010, 38, e125 (doi:
10.1093/nar/gkq223).
9108 Analytical Chemistry, Vol. 82, No. 21, November 1, 2010
S-1
Direct Detection and Quantification of
Methylation in Nucleic Acid Sequences using
High Resolution Melt analysis
Carlos M. Rodríguez López1, Beatriz Guzmán Asenjo
2, Amanda J. Lloyd
1 and Michael
J. Wilkinson1*
1 Aberystwyth University, IBERS - Institute of Biological, Environmental and Rural
Sciences, Aberystwyth, Wales, SY23 3DA
2 Bea insert your new address
* To whom correspondence should be addressed. E-mail: [email protected].
Table of contents
Table S-1 Oligonucleotide sequences ...…………………………………………………..S-3
Table S-2. Oligonucleotide combinations ………………………………………………..S-4
Table S-3 Effect of DNA methylation of fragment thermostability (Comparison of the
different normalized fluorescence values obtained by HRM) ..….……………..……...…..S-5
Table S-4 Effect of DNA methylation of fragment thermostability (Average Typicalities
and Probabilities) ……………………………………….…………………………………..S-6
Table S-5 Effect of varying proportions of methylated DNA on denaturation profiles
(Comparison of the different normalized fluorescence values obtained by HRM) ………..S-7
Table S-6 Effect of varying proportions of methylated DNA on denaturation profiles
(Average Typicalities and Probabilities) ……………….………………………….…..…..S-8
Table S-7 Effect of DNA concentration on denaturation profiles (Comparison of the
different normalized fluorescence values obtained by HRM) ..….…………………..…....S-9
Table S-8 Effect of DNA concentration on denaturation profiles (Average Typicalities
and Probabilities) ……………….……………………………………………………..…..S-10
Table S-9 Sensitivity of 5-Methylcytosine Detection (Comparison of the different
normalized fluorescence values obtained from HRM) ……………………………….…..S-11
S-2
Table S-10 Sensitivity of 5-Methylcytosine Detection (Average Typicalities and
Probabilities) …………...……………………………….……………………………..S-12
Figure S-1 Effect of DNA methylation of fragment thermostability (HRM profiles and
SCA for MYF3 fragment) ..………………………….…………………………….…..S-13
Figure S-2 Effect of DNA methylation of fragment thermostability (HRM profiles and
SCA for CNR fragment) ...………………………….……………..……………….…..S-14
Figure S-3 Effect of varying proportions of methylated DNA on denaturation profiles
(HRM profiles for CNR fragment containing 0,1 or 3 methylated sites) ….……….…..S-15 Figure S-4 Interassay replicability on the effect of varying proportions of methylated DNA on
denaturation profiles (Replicated normalized denaturation profiles) ………..……………….…..S-16 Figure S-5. Standard curve generation for the quantification of the percentage of methylated fragments
in an unknown DNA sample. ...………………………….……………..……………….…..S-17 Figure S-6 Interassay replicability on HRM of sonicated genomic DNA from genotypes containing
different methylation levels. ....………………………….……………..……………….…..S-18
Figure S-7 Effect of DNA methylation and varying MgCl2 concentrations on denaturation profiles (HRM
profiles and SCA for CNR fragment) ……….……………..……………………….…..S-19
S-3
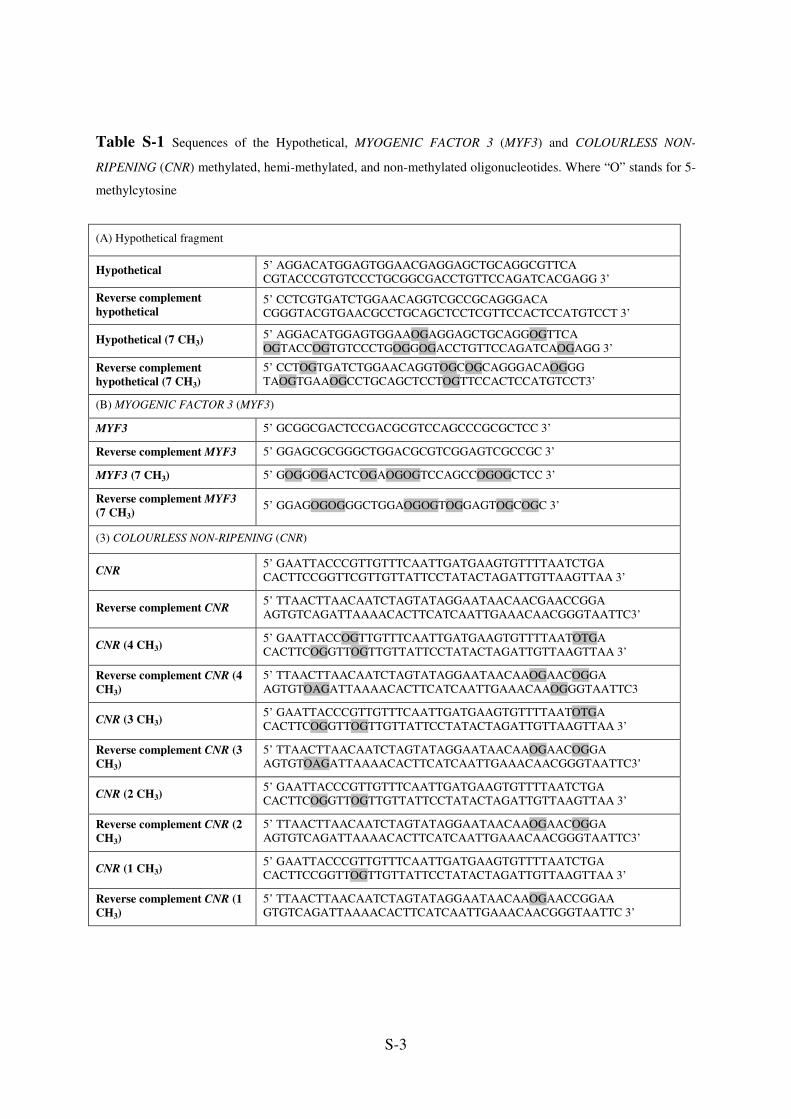
Table S-1 Sequences of the Hypothetical, MYOGENIC FACTOR 3 (MYF3) and COLOURLESS NON-
RIPENING (CNR) methylated, hemi-methylated, and non-methylated oligonucleotides. Where “O” stands for 5-
methylcytosine
(A) Hypothetical fragment
Hypothetical 5’ AGGACATGGAGTGGAACGAGGAGCTGCAGGCGTTCA
CGTACCCGTGTCCCTGCGGCGACCTGTTCCAGATCACGAGG 3’
Reverse complement
hypothetical 5’ CCTCGTGATCTGGAACAGGTCGCCGCAGGGACA
CGGGTACGTGAACGCCTGCAGCTCCTCGTTCCACTCCATGTCCT 3’
Hypothetical (7 CH3) 5’ AGGACATGGAGTGGAAOGAGGAGCTGCAGGOGTTCA
OGTACCOGTGTCCCTGOGGOGACCTGTTCCAGATCAOGAGG 3’
Reverse complement
hypothetical (7 CH3)
5’ CCTOGTGATCTGGAACAGGTOGCOGCAGGGACAOGGG
TAOGTGAAOGCCTGCAGCTCCTOGTTCCACTCCATGTCCT3’
(B) MYOGENIC FACTOR 3 (MYF3)
MYF3 5’ GCGGCGACTCCGACGCGTCCAGCCCGCGCTCC 3’
Reverse complement MYF3 5’ GGAGCGCGGGCTGGACGCGTCGGAGTCGCCGC 3’
MYF3 (7 CH3) 5’ GOGGOGACTCOGAOGOGTCCAGCCOGOGCTCC 3’
Reverse complement MYF3
(7 CH3) 5’ GGAGOGOGGGCTGGAOGOGTOGGAGTOGCOGC 3’
(3) COLOURLESS NON-RIPENING (CNR)
CNR 5’ GAATTACCCGTTGTTTCAATTGATGAAGTGTTTTAATCTGA
CACTTCCGGTTCGTTGTTATTCCTATACTAGATTGTTAAGTTAA 3’
Reverse complement CNR 5’ TTAACTTAACAATCTAGTATAGGAATAACAACGAACCGGA
AGTGTCAGATTAAAACACTTCATCAATTGAAACAACGGGTAATTC3’
CNR (4 CH3) 5’ GAATTACCOGTTGTTTCAATTGATGAAGTGTTTTAATOTGA
CACTTCOGGTTOGTTGTTATTCCTATACTAGATTGTTAAGTTAA 3’
Reverse complement CNR (4
CH3)
5’ TTAACTTAACAATCTAGTATAGGAATAACAAOGAACOGGA
AGTGTOAGATTAAAACACTTCATCAATTGAAACAAOGGGTAATTC3
CNR (3 CH3) 5’ GAATTACCCGTTGTTTCAATTGATGAAGTGTTTTAATOTGA
CACTTCOGGTTOGTTGTTATTCCTATACTAGATTGTTAAGTTAA 3’
Reverse complement CNR (3
CH3)
5’ TTAACTTAACAATCTAGTATAGGAATAACAAOGAACOGGA
AGTGTOAGATTAAAACACTTCATCAATTGAAACAACGGGTAATTC3’
CNR (2 CH3) 5’ GAATTACCCGTTGTTTCAATTGATGAAGTGTTTTAATCTGA
CACTTCOGGTTOGTTGTTATTCCTATACTAGATTGTTAAGTTAA 3’
Reverse complement CNR (2
CH3)
5’ TTAACTTAACAATCTAGTATAGGAATAACAAOGAACOGGA
AGTGTCAGATTAAAACACTTCATCAATTGAAACAACGGGTAATTC3’
CNR (1 CH3) 5’ GAATTACCCGTTGTTTCAATTGATGAAGTGTTTTAATCTGA
CACTTCCGGTTOGTTGTTATTCCTATACTAGATTGTTAAGTTAA 3’
Reverse complement CNR (1
CH3)
5’ TTAACTTAACAATCTAGTATAGGAATAACAAOGAACCGGAA
GTGTCAGATTAAAACACTTCATCAATTGAAACAACGGGTAATTC 3’
S-4
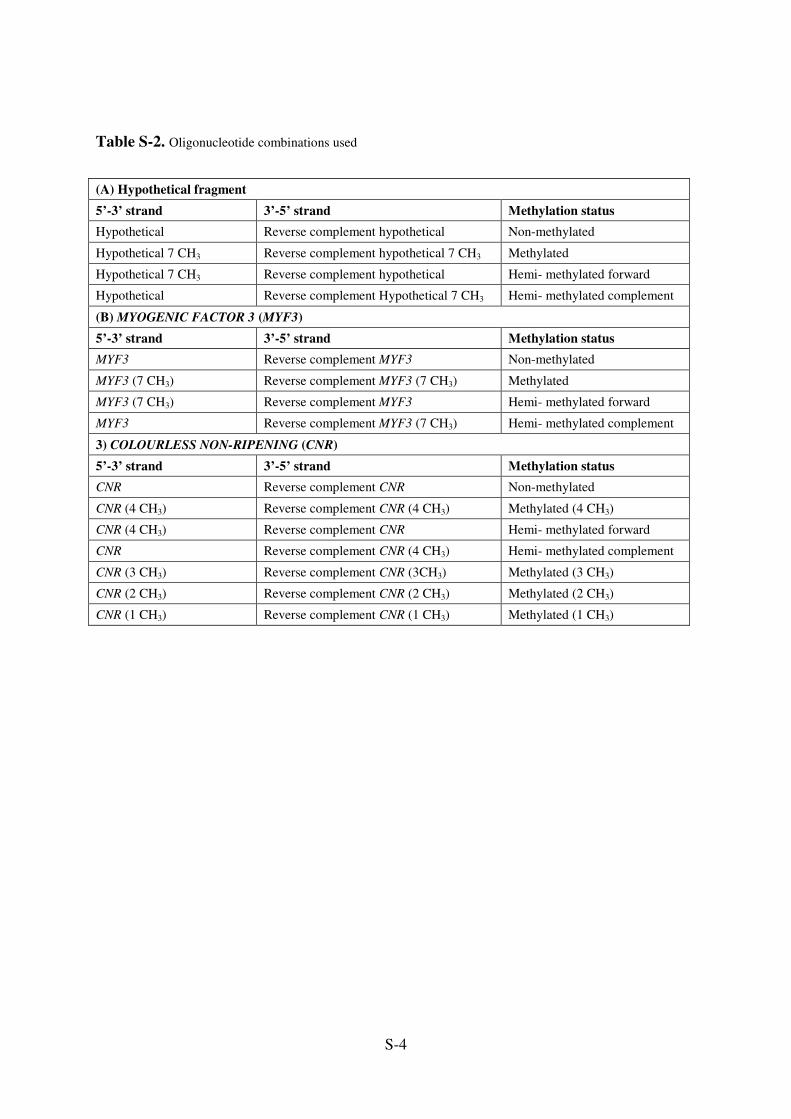
Table S-2. Oligonucleotide combinations used
(A) Hypothetical fragment
5’-3’ strand 3’-5’ strand Methylation status
Hypothetical Reverse complement hypothetical Non-methylated
Hypothetical 7 CH3 Reverse complement hypothetical 7 CH3 Methylated
Hypothetical 7 CH3 Reverse complement hypothetical Hemi- methylated forward
Hypothetical Reverse complement Hypothetical 7 CH3 Hemi- methylated complement
(B) MYOGENIC FACTOR 3 (MYF3)
5’-3’ strand 3’-5’ strand Methylation status
MYF3 Reverse complement MYF3 Non-methylated
MYF3 (7 CH3) Reverse complement MYF3 (7 CH3) Methylated
MYF3 (7 CH3) Reverse complement MYF3 Hemi- methylated forward
MYF3 Reverse complement MYF3 (7 CH3) Hemi- methylated complement
3) COLOURLESS NON-RIPENING (CNR)
5’-3’ strand 3’-5’ strand Methylation status
CNR Reverse complement CNR Non-methylated
CNR (4 CH3) Reverse complement CNR (4 CH3) Methylated (4 CH3)
CNR (4 CH3) Reverse complement CNR Hemi- methylated forward
CNR Reverse complement CNR (4 CH3) Hemi- methylated complement
CNR (3 CH3) Reverse complement CNR (3CH3) Methylated (3 CH3)
CNR (2 CH3) Reverse complement CNR (2 CH3) Methylated (2 CH3)
CNR (1 CH3) Reverse complement CNR (1 CH3) Methylated (1 CH3)
S-5
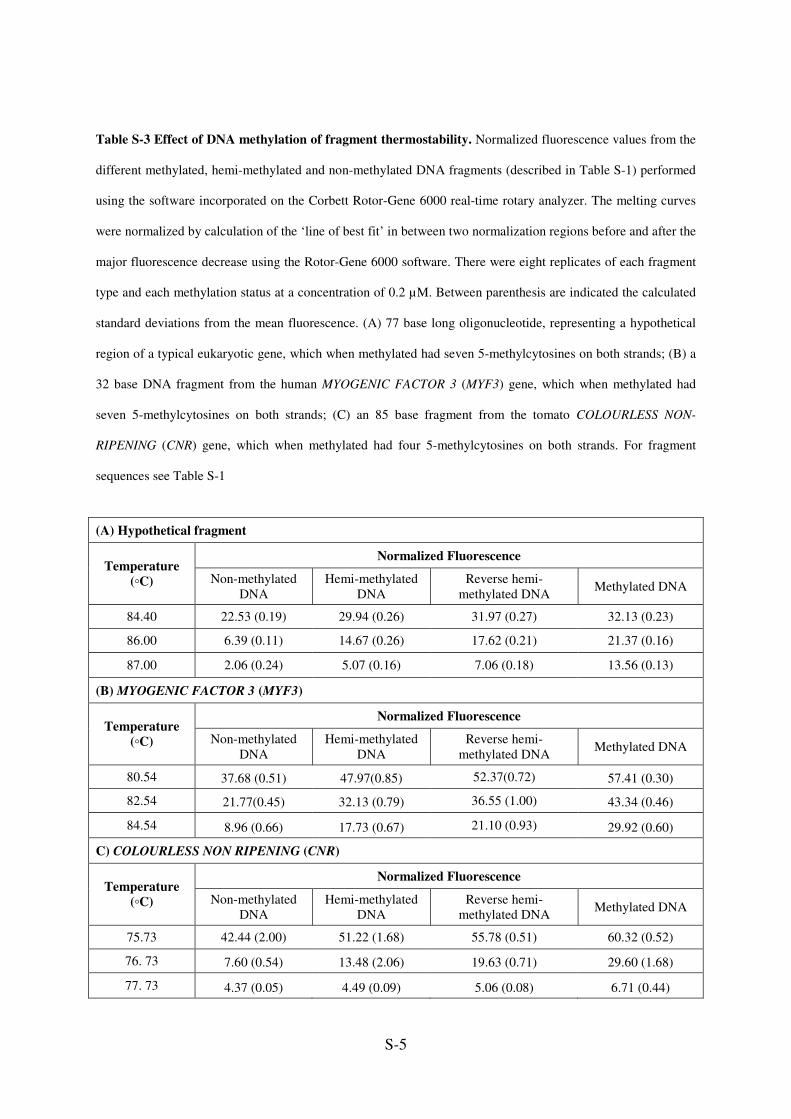
Table S-3 Effect of DNA methylation of fragment thermostability. Normalized fluorescence values from the
different methylated, hemi-methylated and non-methylated DNA fragments (described in Table S-1) performed
using the software incorporated on the Corbett Rotor-Gene 6000 real-time rotary analyzer. The melting curves
were normalized by calculation of the ‘line of best fit’ in between two normalization regions before and after the
major fluorescence decrease using the Rotor-Gene 6000 software. There were eight replicates of each fragment
type and each methylation status at a concentration of 0.2 µM. Between parenthesis are indicated the calculated
standard deviations from the mean fluorescence. (A) 77 base long oligonucleotide, representing a hypothetical
region of a typical eukaryotic gene, which when methylated had seven 5-methylcytosines on both strands; (B) a
32 base DNA fragment from the human MYOGENIC FACTOR 3 (MYF3) gene, which when methylated had
seven 5-methylcytosines on both strands; (C) an 85 base fragment from the tomato COLOURLESS NON-
RIPENING (CNR) gene, which when methylated had four 5-methylcytosines on both strands. For fragment
sequences see Table S-1
(A) Hypothetical fragment
Normalized Fluorescence Temperature
(◦C) Non-methylated
DNA
Hemi-methylated
DNA
Reverse hemi-
methylated DNA Methylated DNA
84.40 22.53 (0.19) 29.94 (0.26) 31.97 (0.27) 32.13 (0.23)
86.00 6.39 (0.11) 14.67 (0.26) 17.62 (0.21) 21.37 (0.16)
87.00 2.06 (0.24) 5.07 (0.16) 7.06 (0.18) 13.56 (0.13)
(B) MYOGENIC FACTOR 3 (MYF3)
Normalized Fluorescence Temperature
(◦C) Non-methylated
DNA
Hemi-methylated
DNA
Reverse hemi-
methylated DNA Methylated DNA
80.54 37.68 (0.51) 47.97(0.85) 52.37(0.72) 57.41 (0.30)
82.54 21.77(0.45) 32.13 (0.79) 36.55 (1.00) 43.34 (0.46)
84.54 8.96 (0.66) 17.73 (0.67) 21.10 (0.93) 29.92 (0.60)
C) COLOURLESS NON RIPENING (CNR)
Normalized Fluorescence Temperature
(◦C) Non-methylated
DNA
Hemi-methylated
DNA
Reverse hemi-
methylated DNA Methylated DNA
75.73 42.44 (2.00) 51.22 (1.68) 55.78 (0.51) 60.32 (0.52)
76. 73 7.60 (0.54) 13.48 (2.06) 19.63 (0.71) 29.60 (1.68)
77. 73 4.37 (0.05) 4.49 (0.09) 5.06 (0.08) 6.71 (0.44)
S-6
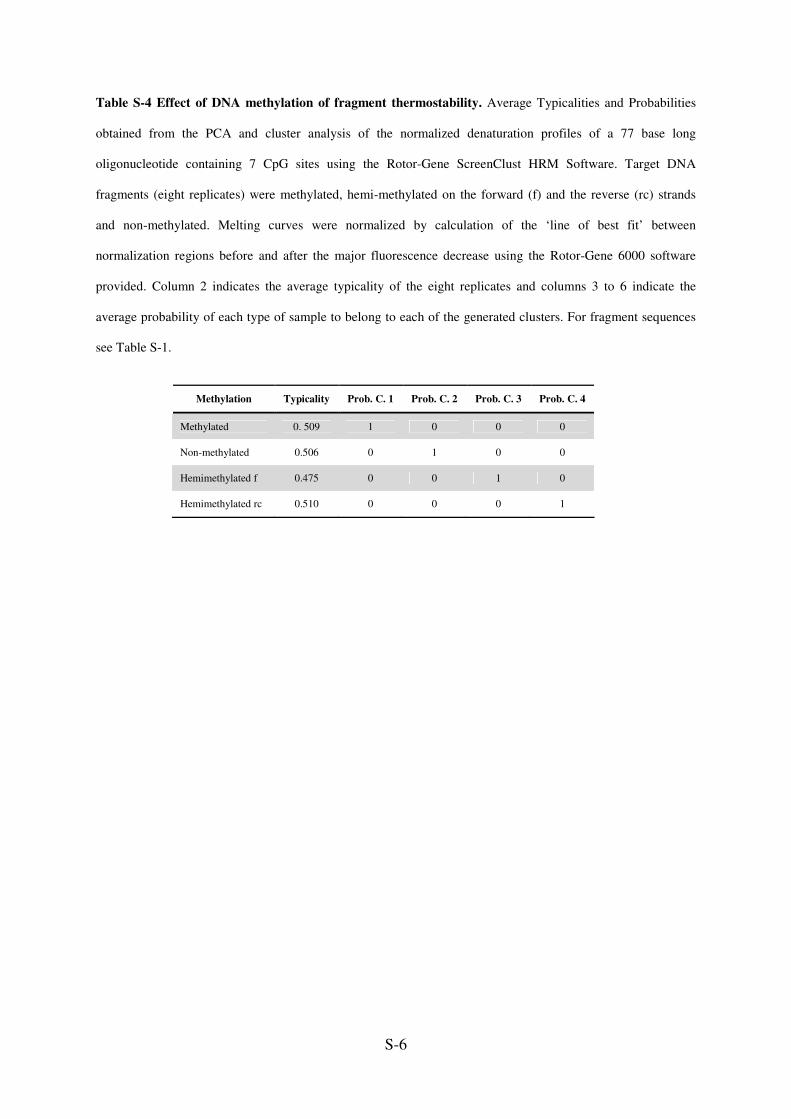
Table S-4 Effect of DNA methylation of fragment thermostability. Average Typicalities and Probabilities
obtained from the PCA and cluster analysis of the normalized denaturation profiles of a 77 base long
oligonucleotide containing 7 CpG sites using the Rotor-Gene ScreenClust HRM Software. Target DNA
fragments (eight replicates) were methylated, hemi-methylated on the forward (f) and the reverse (rc) strands
and non-methylated. Melting curves were normalized by calculation of the ‘line of best fit’ between
normalization regions before and after the major fluorescence decrease using the Rotor-Gene 6000 software
provided. Column 2 indicates the average typicality of the eight replicates and columns 3 to 6 indicate the
average probability of each type of sample to belong to each of the generated clusters. For fragment sequences
see Table S-1.
Methylation Typicality Prob. C. 1 Prob. C. 2 Prob. C. 3 Prob. C. 4
Methylated 0. 509 1 0 0 0
Non-methylated 0.506 0 1 0 0
Hemimethylated f 0.475 0 0 1 0
Hemimethylated rc 0.510 0 0 0 1
S-7
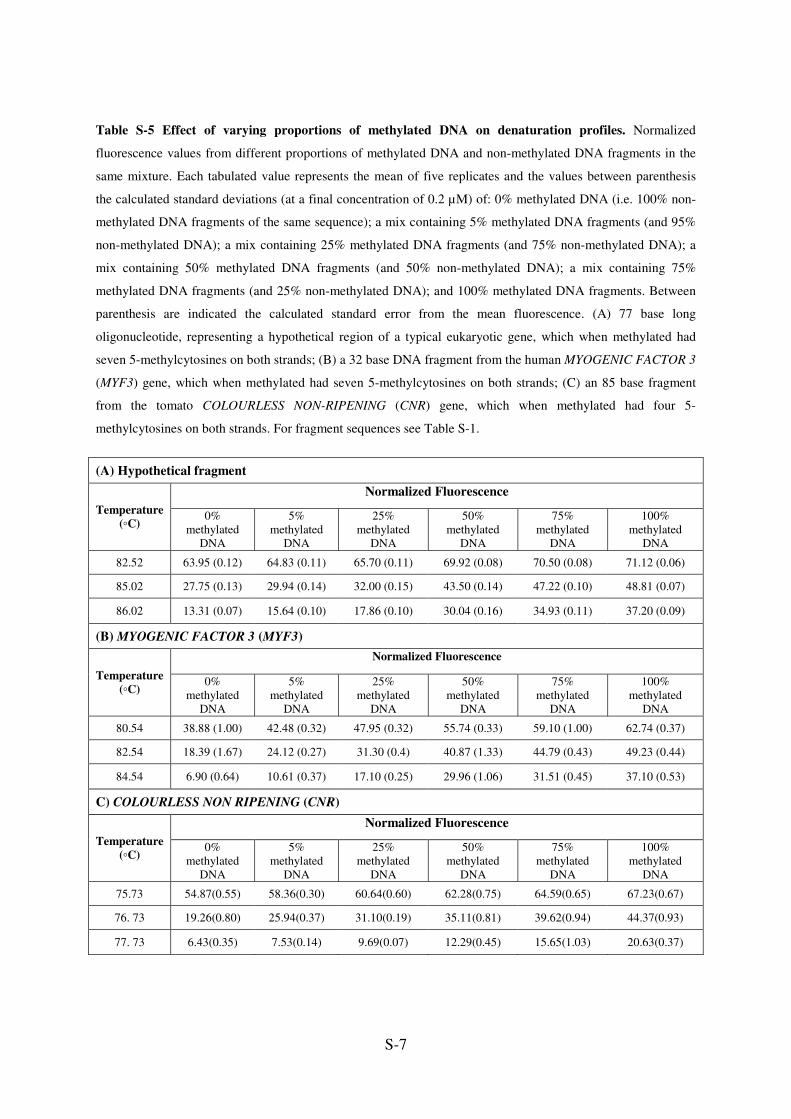
Table S-5 Effect of varying proportions of methylated DNA on denaturation profiles. Normalized
fluorescence values from different proportions of methylated DNA and non-methylated DNA fragments in the
same mixture. Each tabulated value represents the mean of five replicates and the values between parenthesis
the calculated standard deviations (at a final concentration of 0.2 µM) of: 0% methylated DNA (i.e. 100% non-
methylated DNA fragments of the same sequence); a mix containing 5% methylated DNA fragments (and 95%
non-methylated DNA); a mix containing 25% methylated DNA fragments (and 75% non-methylated DNA); a
mix containing 50% methylated DNA fragments (and 50% non-methylated DNA); a mix containing 75%
methylated DNA fragments (and 25% non-methylated DNA); and 100% methylated DNA fragments. Between
parenthesis are indicated the calculated standard error from the mean fluorescence. (A) 77 base long
oligonucleotide, representing a hypothetical region of a typical eukaryotic gene, which when methylated had
seven 5-methylcytosines on both strands; (B) a 32 base DNA fragment from the human MYOGENIC FACTOR 3
(MYF3) gene, which when methylated had seven 5-methylcytosines on both strands; (C) an 85 base fragment
from the tomato COLOURLESS NON-RIPENING (CNR) gene, which when methylated had four 5-
methylcytosines on both strands. For fragment sequences see Table S-1.
(A) Hypothetical fragment
Normalized Fluorescence
Temperature
(◦C) 0%
methylated
DNA
5%
methylated
DNA
25%
methylated
DNA
50%
methylated
DNA
75%
methylated
DNA
100%
methylated
DNA
82.52 63.95 (0.12) 64.83 (0.11) 65.70 (0.11) 69.92 (0.08) 70.50 (0.08) 71.12 (0.06)
85.02 27.75 (0.13) 29.94 (0.14) 32.00 (0.15) 43.50 (0.14) 47.22 (0.10) 48.81 (0.07)
86.02 13.31 (0.07) 15.64 (0.10) 17.86 (0.10) 30.04 (0.16) 34.93 (0.11) 37.20 (0.09)
(B) MYOGENIC FACTOR 3 (MYF3)
Normalized Fluorescence
Temperature
(◦C) 0%
methylated
DNA
5%
methylated
DNA
25%
methylated
DNA
50%
methylated
DNA
75%
methylated
DNA
100%
methylated
DNA
80.54 38.88 (1.00) 42.48 (0.32) 47.95 (0.32) 55.74 (0.33) 59.10 (1.00) 62.74 (0.37)
82.54 18.39 (1.67) 24.12 (0.27) 31.30 (0.4) 40.87 (1.33) 44.79 (0.43) 49.23 (0.44)
84.54 6.90 (0.64) 10.61 (0.37) 17.10 (0.25) 29.96 (1.06) 31.51 (0.45) 37.10 (0.53)
C) COLOURLESS NON RIPENING (CNR)
Normalized Fluorescence
Temperature
(◦C) 0%
methylated
DNA
5%
methylated
DNA
25%
methylated
DNA
50%
methylated
DNA
75%
methylated
DNA
100%
methylated
DNA
75.73 54.87(0.55) 58.36(0.30) 60.64(0.60) 62.28(0.75) 64.59(0.65) 67.23(0.67)
76. 73 19.26(0.80) 25.94(0.37) 31.10(0.19) 35.11(0.81) 39.62(0.94) 44.37(0.93)
77. 73 6.43(0.35) 7.53(0.14) 9.69(0.07) 12.29(0.45) 15.65(1.03) 20.63(0.37)
S-8
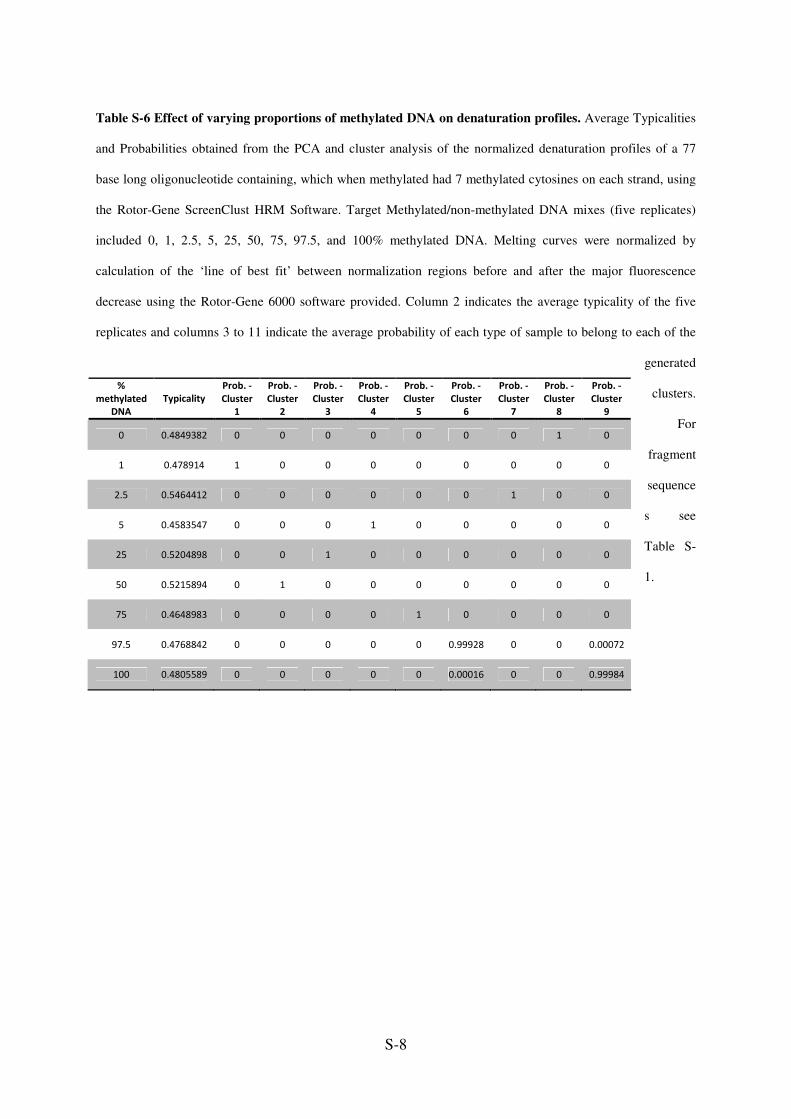
Table S-6 Effect of varying proportions of methylated DNA on denaturation profiles. Average Typicalities
and Probabilities obtained from the PCA and cluster analysis of the normalized denaturation profiles of a 77
base long oligonucleotide containing, which when methylated had 7 methylated cytosines on each strand, using
the Rotor-Gene ScreenClust HRM Software. Target Methylated/non-methylated DNA mixes (five replicates)
included 0, 1, 2.5, 5, 25, 50, 75, 97.5, and 100% methylated DNA. Melting curves were normalized by
calculation of the ‘line of best fit’ between normalization regions before and after the major fluorescence
decrease using the Rotor-Gene 6000 software provided. Column 2 indicates the average typicality of the five
replicates and columns 3 to 11 indicate the average probability of each type of sample to belong to each of the
generated
clusters.
For
fragment
sequence
s see
Table S-
1.
%
methylated
DNA
Typicality
Prob. -
Cluster
1
Prob. -
Cluster
2
Prob. -
Cluster
3
Prob. -
Cluster
4
Prob. -
Cluster
5
Prob. -
Cluster
6
Prob. -
Cluster
7
Prob. -
Cluster
8
Prob. -
Cluster
9
0 0.4849382 0 0 0 0 0 0 0 1 0
1 0.478914 1 0 0 0 0 0 0 0 0
2.5 0.5464412 0 0 0 0 0 0 1 0 0
5 0.4583547 0 0 0 1 0 0 0 0 0
25 0.5204898 0 0 1 0 0 0 0 0 0
50 0.5215894 0 1 0 0 0 0 0 0 0
75 0.4648983 0 0 0 0 1 0 0 0 0
97.5 0.4768842 0 0 0 0 0 0.99928 0 0 0.00072
100 0.4805589 0 0 0 0 0 0.00016 0 0 0.99984
S-9
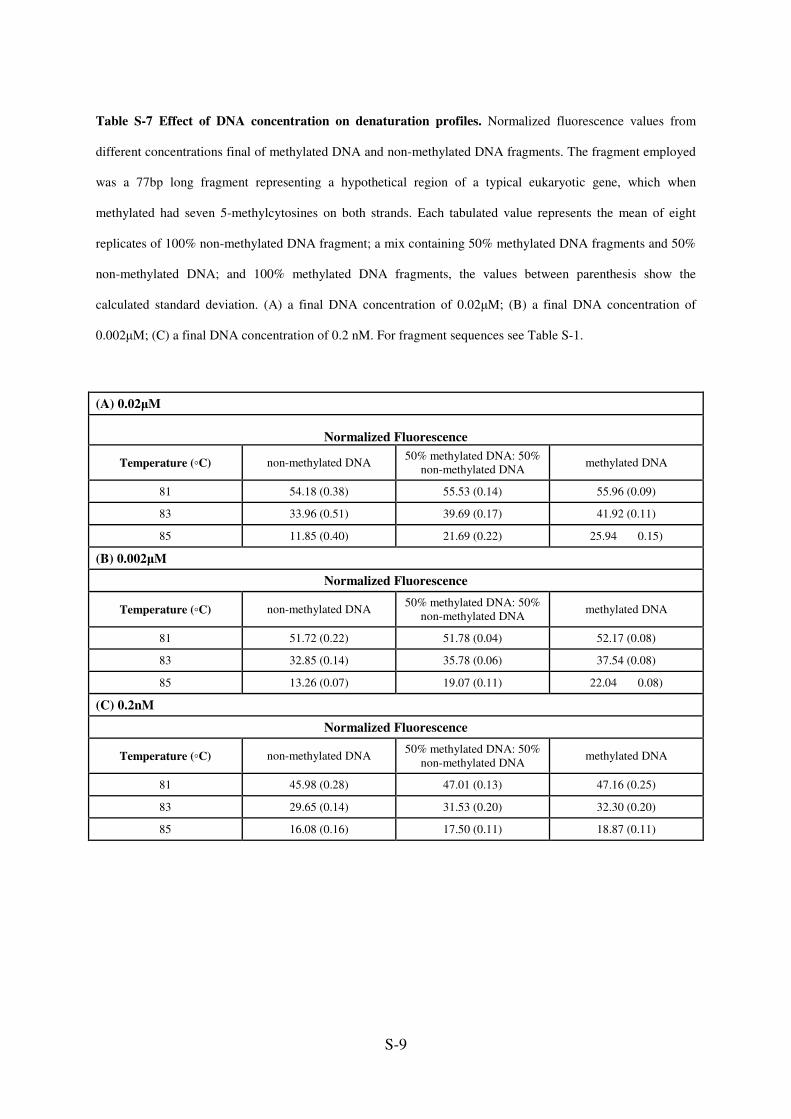
Table S-7 Effect of DNA concentration on denaturation profiles. Normalized fluorescence values from
different concentrations final of methylated DNA and non-methylated DNA fragments. The fragment employed
was a 77bp long fragment representing a hypothetical region of a typical eukaryotic gene, which when
methylated had seven 5-methylcytosines on both strands. Each tabulated value represents the mean of eight
replicates of 100% non-methylated DNA fragment; a mix containing 50% methylated DNA fragments and 50%
non-methylated DNA; and 100% methylated DNA fragments, the values between parenthesis show the
calculated standard deviation. (A) a final DNA concentration of 0.02µM; (B) a final DNA concentration of
0.002µM; (C) a final DNA concentration of 0.2 nM. For fragment sequences see Table S-1.
(A) 0.02µM
Normalized Fluorescence
Temperature (◦C) non-methylated DNA 50% methylated DNA: 50%
non-methylated DNA methylated DNA
81 54.18 (0.38) 55.53 (0.14) 55.96 (0.09)
83 33.96 (0.51) 39.69 (0.17) 41.92 (0.11)
85 11.85 (0.40) 21.69 (0.22) 25.94 0.15)
(B) 0.002µM
Normalized Fluorescence
Temperature (◦C) non-methylated DNA 50% methylated DNA: 50%
non-methylated DNA methylated DNA
81 51.72 (0.22) 51.78 (0.04) 52.17 (0.08)
83 32.85 (0.14) 35.78 (0.06) 37.54 (0.08)
85 13.26 (0.07) 19.07 (0.11) 22.04 0.08)
(C) 0.2nM
Normalized Fluorescence
Temperature (◦C) non-methylated DNA 50% methylated DNA: 50%
non-methylated DNA methylated DNA
81 45.98 (0.28) 47.01 (0.13) 47.16 (0.25)
83 29.65 (0.14) 31.53 (0.20) 32.30 (0.20)
85 16.08 (0.16) 17.50 (0.11) 18.87 (0.11)
S-10
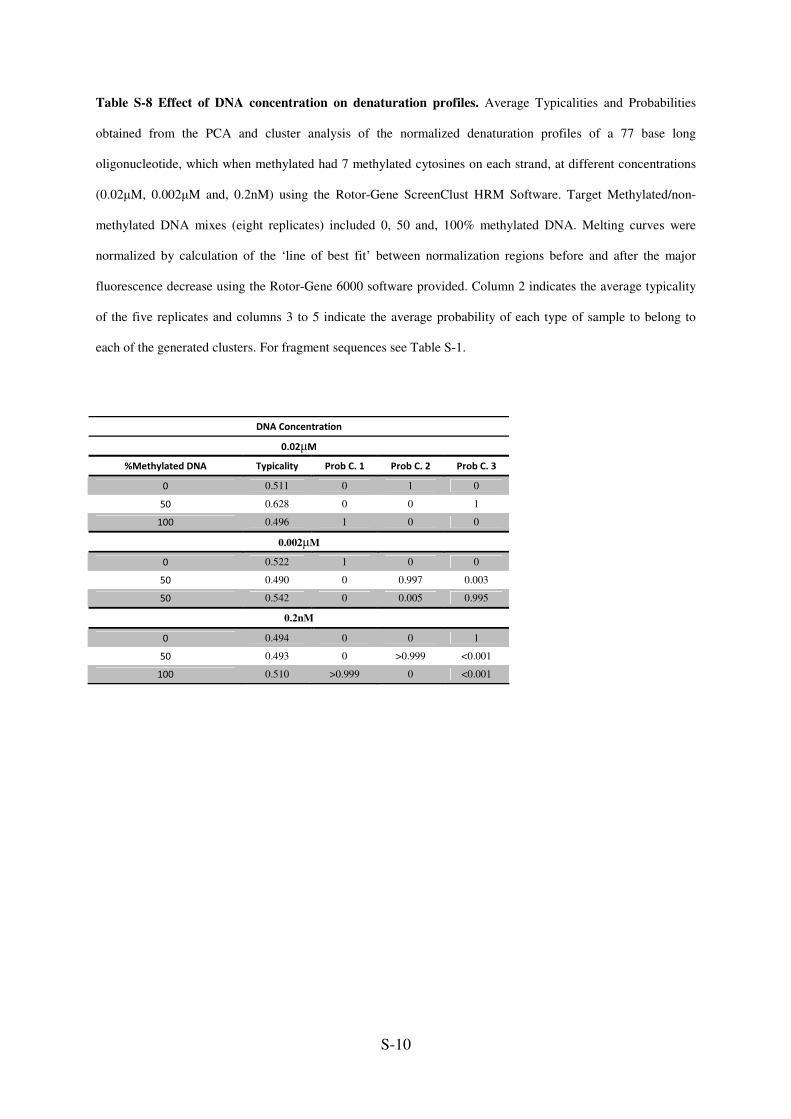
Table S-8 Effect of DNA concentration on denaturation profiles. Average Typicalities and Probabilities
obtained from the PCA and cluster analysis of the normalized denaturation profiles of a 77 base long
oligonucleotide, which when methylated had 7 methylated cytosines on each strand, at different concentrations
(0.02µM, 0.002µM and, 0.2nM) using the Rotor-Gene ScreenClust HRM Software. Target Methylated/non-
methylated DNA mixes (eight replicates) included 0, 50 and, 100% methylated DNA. Melting curves were
normalized by calculation of the ‘line of best fit’ between normalization regions before and after the major
fluorescence decrease using the Rotor-Gene 6000 software provided. Column 2 indicates the average typicality
of the five replicates and columns 3 to 5 indicate the average probability of each type of sample to belong to
each of the generated clusters. For fragment sequences see Table S-1.
DNA Concentration
0.02µM
%Methylated DNA Typicality Prob C. 1 Prob C. 2 Prob C. 3
0 0.511 0 1 0
50 0.628 0 0 1
100 0.496 1 0 0
0.002µM
0 0.522 1 0 0
50 0.490 0 0.997 0.003
50 0.542 0 0.005 0.995
0.2nM
0 0.494 0 0 1
50 0.493 0 >0.999 <0.001
100 0.510 >0.999 0 <0.001
S-11
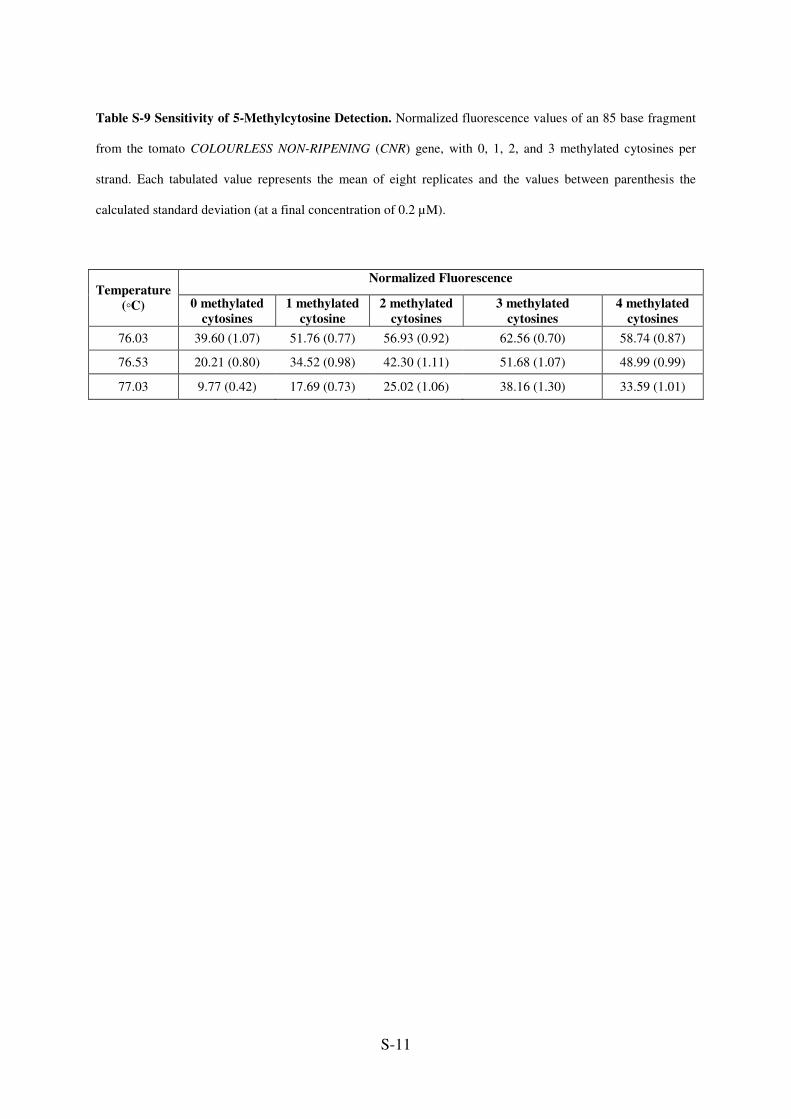
Table S-9 Sensitivity of 5-Methylcytosine Detection. Normalized fluorescence values of an 85 base fragment
from the tomato COLOURLESS NON-RIPENING (CNR) gene, with 0, 1, 2, and 3 methylated cytosines per
strand. Each tabulated value represents the mean of eight replicates and the values between parenthesis the
calculated standard deviation (at a final concentration of 0.2 µM).
Normalized Fluorescence
Temperature
(◦C) 0 methylated
cytosines
1 methylated
cytosine
2 methylated
cytosines
3 methylated
cytosines
4 methylated
cytosines
76.03 39.60 (1.07) 51.76 (0.77) 56.93 (0.92) 62.56 (0.70) 58.74 (0.87)
76.53 20.21 (0.80) 34.52 (0.98) 42.30 (1.11) 51.68 (1.07) 48.99 (0.99)
77.03 9.77 (0.42) 17.69 (0.73) 25.02 (1.06) 38.16 (1.30) 33.59 (1.01)
S-12
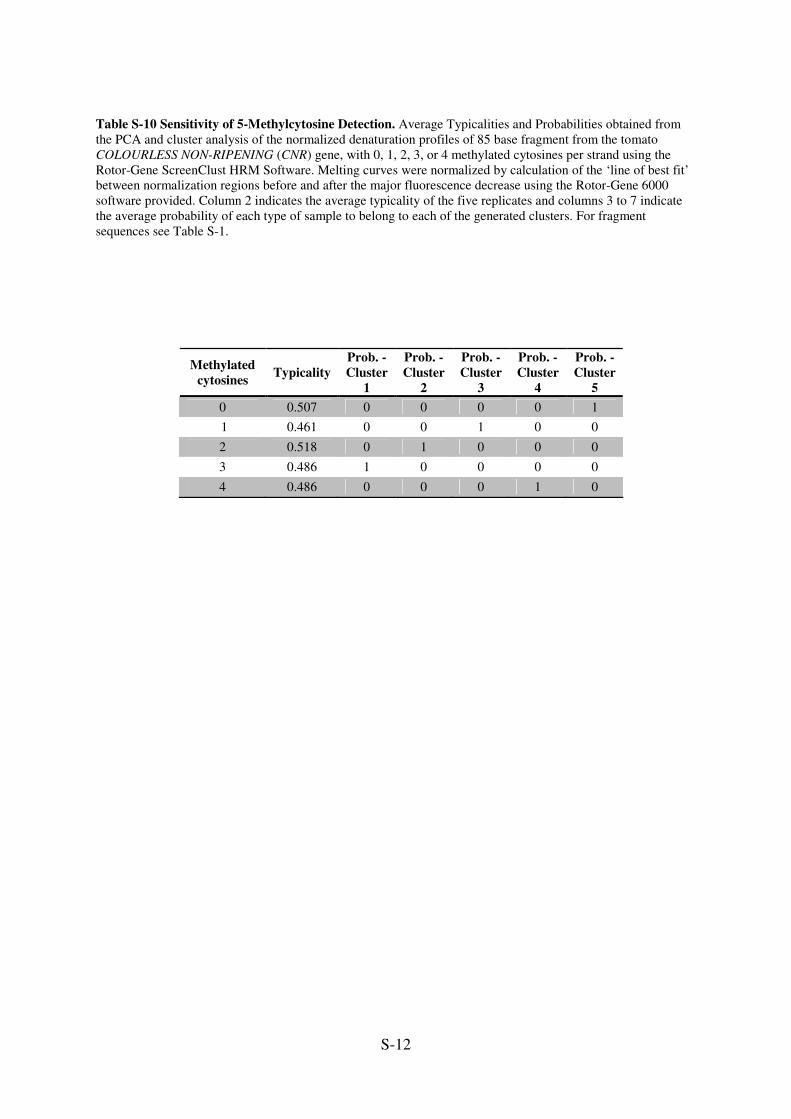
Table S-10 Sensitivity of 5-Methylcytosine Detection. Average Typicalities and Probabilities obtained from
the PCA and cluster analysis of the normalized denaturation profiles of 85 base fragment from the tomato
COLOURLESS NON-RIPENING (CNR) gene, with 0, 1, 2, 3, or 4 methylated cytosines per strand using the
Rotor-Gene ScreenClust HRM Software. Melting curves were normalized by calculation of the ‘line of best fit’
between normalization regions before and after the major fluorescence decrease using the Rotor-Gene 6000
software provided. Column 2 indicates the average typicality of the five replicates and columns 3 to 7 indicate
the average probability of each type of sample to belong to each of the generated clusters. For fragment
sequences see Table S-1.
Methylated
cytosines Typicality
Prob. -
Cluster
1
Prob. -
Cluster
2
Prob. -
Cluster
3
Prob. -
Cluster
4
Prob. -
Cluster
5
0 0.507 0 0 0 0 1
1 0.461 0 0 1 0 0
2 0.518 0 1 0 0 0
3 0.486 1 0 0 0 0
4 0.486 0 0 0 1 0
S-13
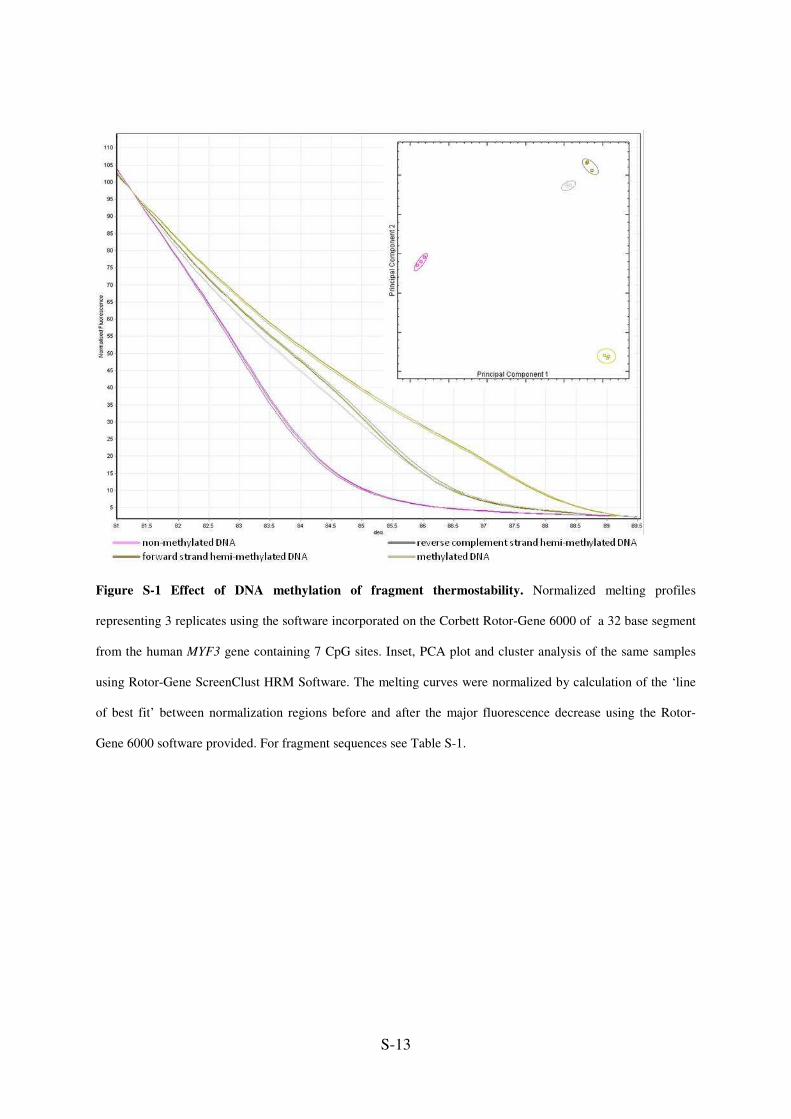
Figure S-1 Effect of DNA methylation of fragment thermostability. Normalized melting profiles
representing 3 replicates using the software incorporated on the Corbett Rotor-Gene 6000 of a 32 base segment
from the human MYF3 gene containing 7 CpG sites. Inset, PCA plot and cluster analysis of the same samples
using Rotor-Gene ScreenClust HRM Software. The melting curves were normalized by calculation of the ‘line
of best fit’ between normalization regions before and after the major fluorescence decrease using the Rotor-
Gene 6000 software provided. For fragment sequences see Table S-1.
S-14
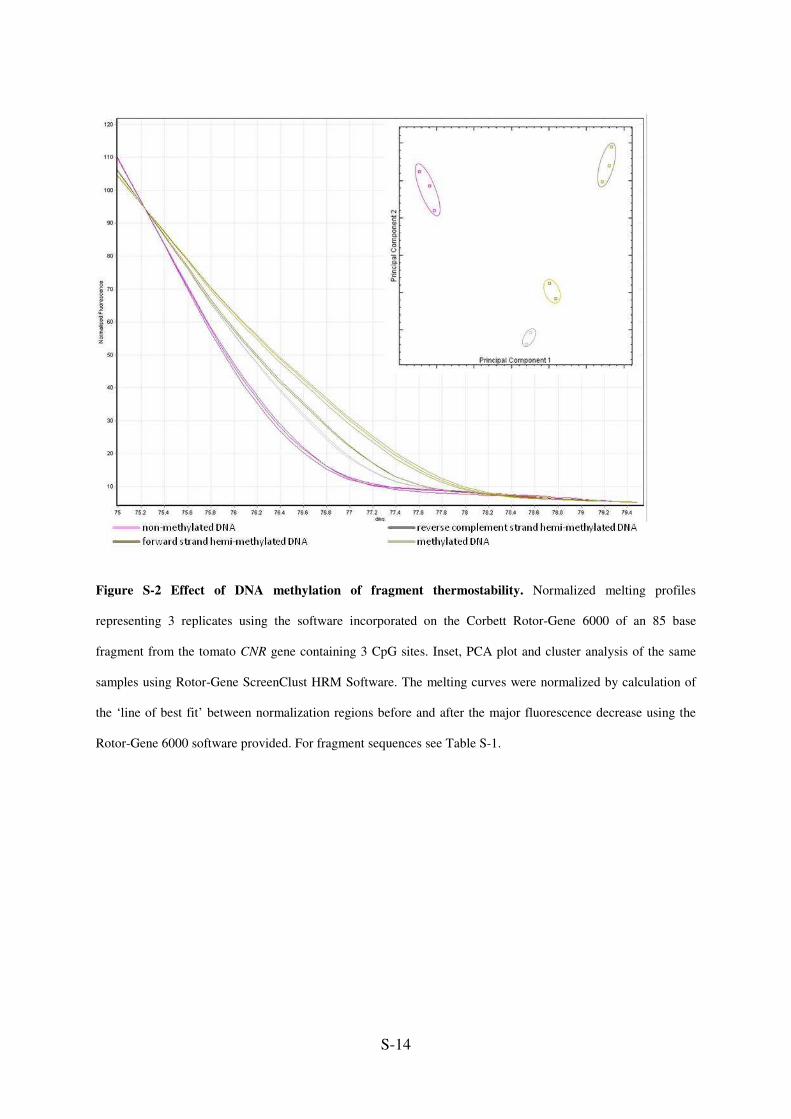
Figure S-2 Effect of DNA methylation of fragment thermostability. Normalized melting profiles
representing 3 replicates using the software incorporated on the Corbett Rotor-Gene 6000 of an 85 base
fragment from the tomato CNR gene containing 3 CpG sites. Inset, PCA plot and cluster analysis of the same
samples using Rotor-Gene ScreenClust HRM Software. The melting curves were normalized by calculation of
the ‘line of best fit’ between normalization regions before and after the major fluorescence decrease using the
Rotor-Gene 6000 software provided. For fragment sequences see Table S-1.
S-15
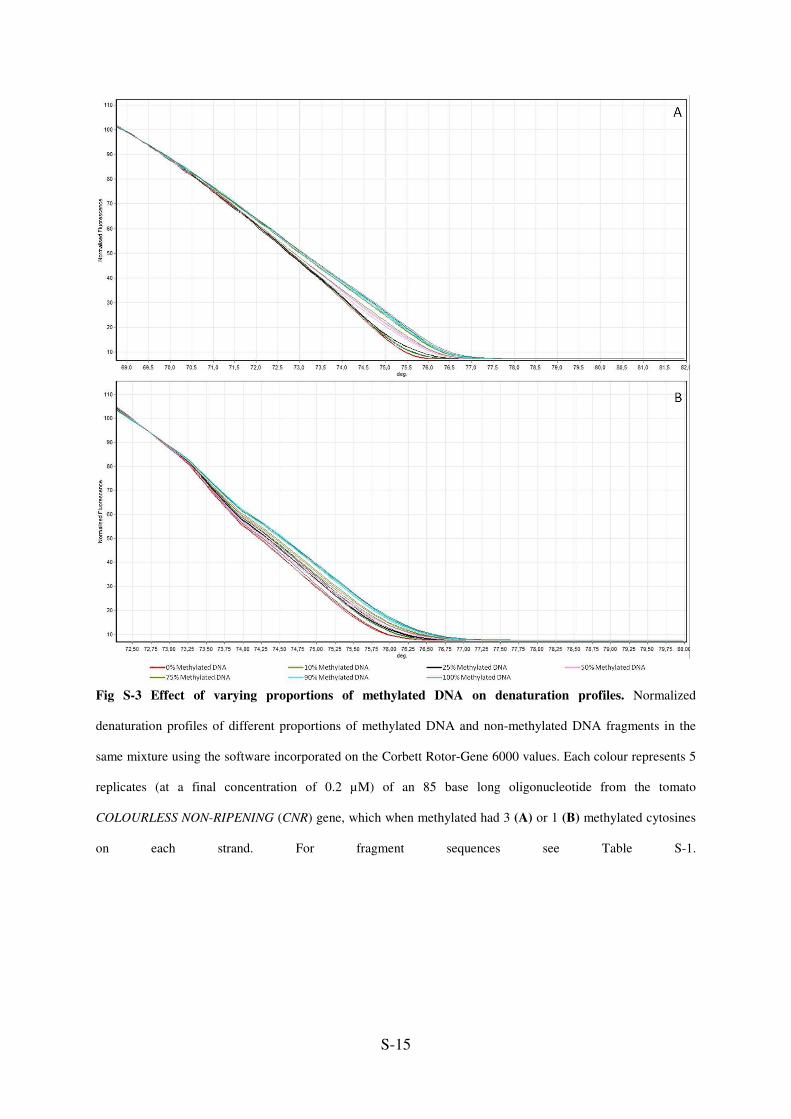
Fig S-3 Effect of varying proportions of methylated DNA on denaturation profiles. Normalized
denaturation profiles of different proportions of methylated DNA and non-methylated DNA fragments in the
same mixture using the software incorporated on the Corbett Rotor-Gene 6000 values. Each colour represents 5
replicates (at a final concentration of 0.2 µM) of an 85 base long oligonucleotide from the tomato
COLOURLESS NON-RIPENING (CNR) gene, which when methylated had 3 (A) or 1 (B) methylated cytosines
on each strand. For fragment sequences see Table S-1.
S-16
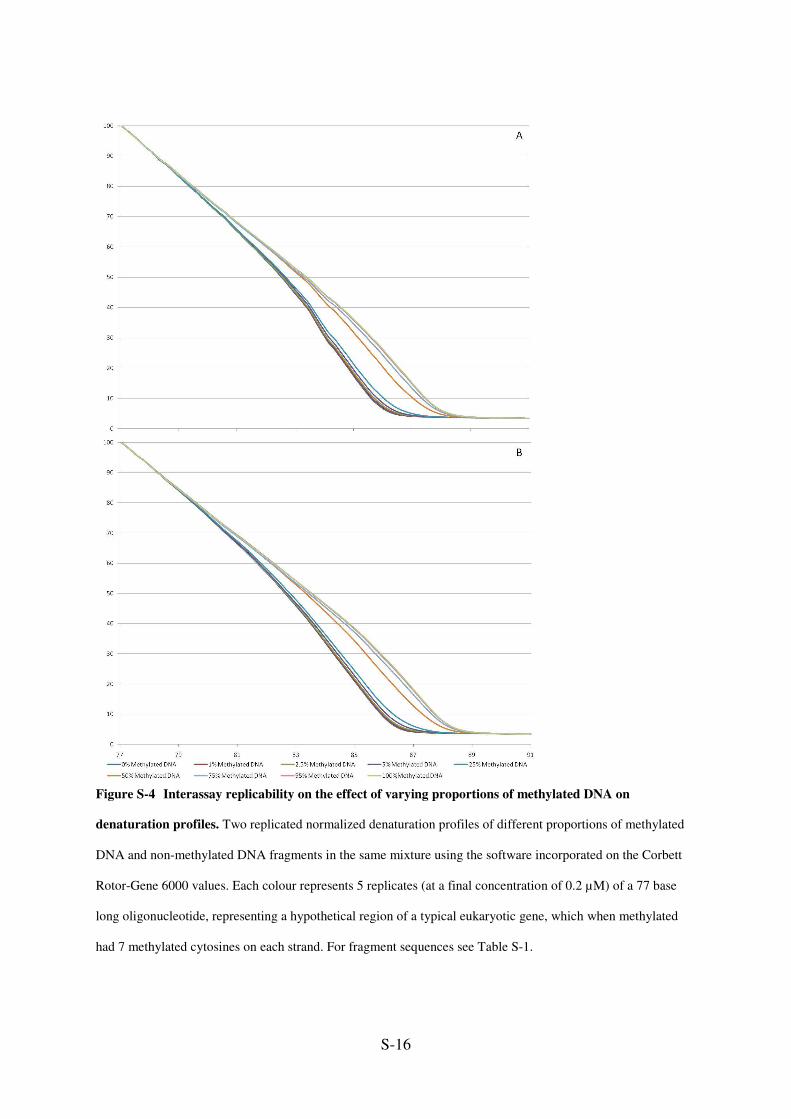
Figure S-4 Interassay replicability on the effect of varying proportions of methylated DNA on
denaturation profiles. Two replicated normalized denaturation profiles of different proportions of methylated
DNA and non-methylated DNA fragments in the same mixture using the software incorporated on the Corbett
Rotor-Gene 6000 values. Each colour represents 5 replicates (at a final concentration of 0.2 µM) of a 77 base
long oligonucleotide, representing a hypothetical region of a typical eukaryotic gene, which when methylated
had 7 methylated cytosines on each strand. For fragment sequences see Table S-1.
S-17
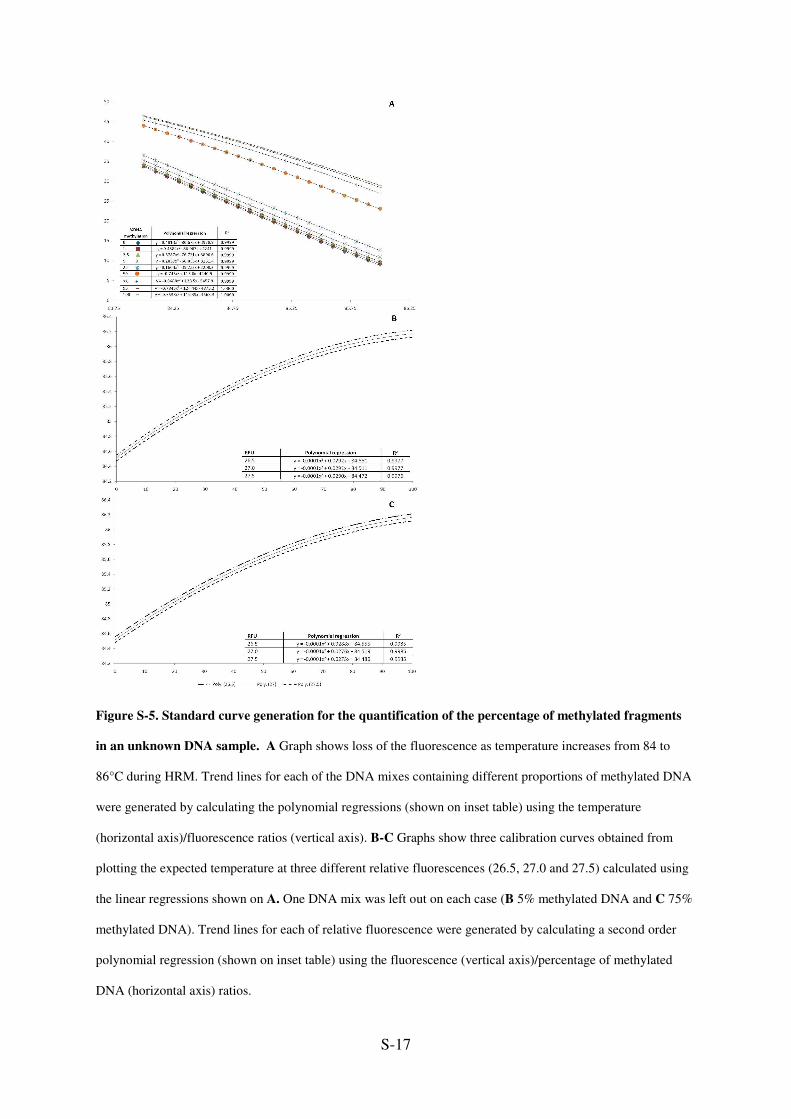
Figure S-5. Standard curve generation for the quantification of the percentage of methylated fragments
in an unknown DNA sample. A Graph shows loss of the fluorescence as temperature increases from 84 to
86°C during HRM. Trend lines for each of the DNA mixes containing different proportions of methylated DNA
were generated by calculating the polynomial regressions (shown on inset table) using the temperature
(horizontal axis)/fluorescence ratios (vertical axis). B-C Graphs show three calibration curves obtained from
plotting the expected temperature at three different relative fluorescences (26.5, 27.0 and 27.5) calculated using
the linear regressions shown on A. One DNA mix was left out on each case (B 5% methylated DNA and C 75%
methylated DNA). Trend lines for each of relative fluorescence were generated by calculating a second order
polynomial regression (shown on inset table) using the fluorescence (vertical axis)/percentage of methylated
DNA (horizontal axis) ratios.
S-18
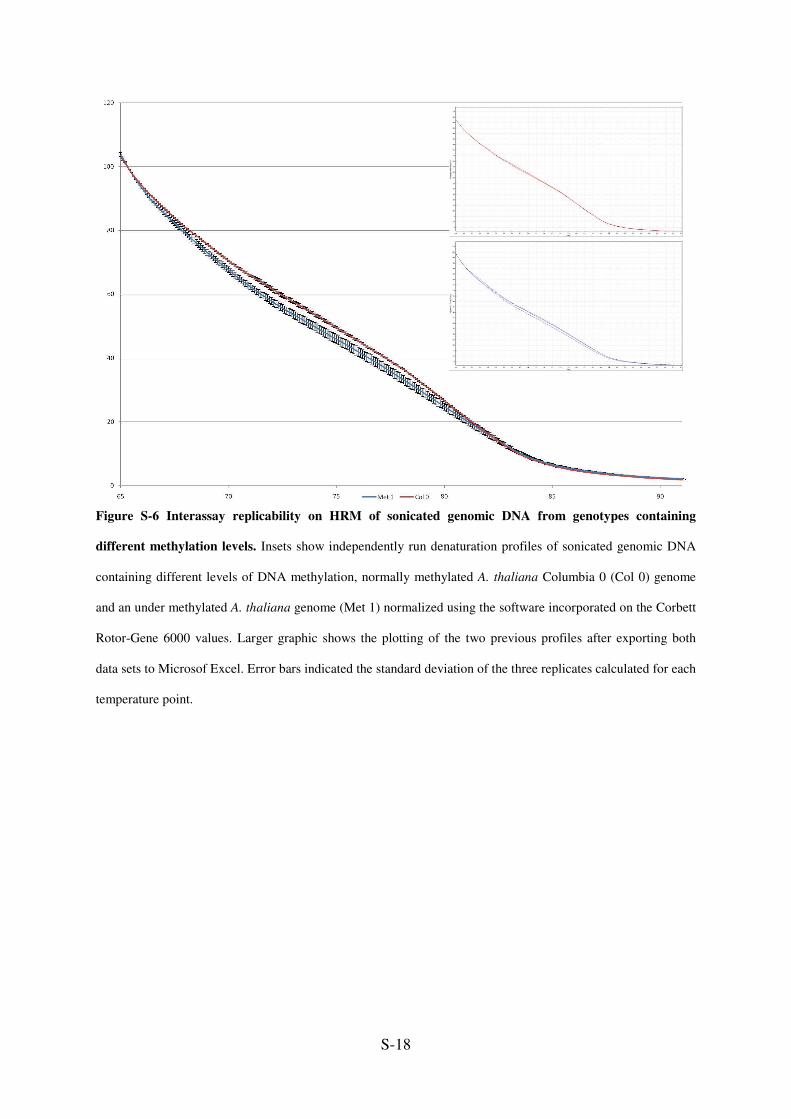
Figure S-6 Interassay replicability on HRM of sonicated genomic DNA from genotypes containing
different methylation levels. Insets show independently run denaturation profiles of sonicated genomic DNA
containing different levels of DNA methylation, normally methylated A. thaliana Columbia 0 (Col 0) genome
and an under methylated A. thaliana genome (Met 1) normalized using the software incorporated on the Corbett
Rotor-Gene 6000 values. Larger graphic shows the plotting of the two previous profiles after exporting both
data sets to Microsof Excel. Error bars indicated the standard deviation of the three replicates calculated for each
temperature point.
S-19
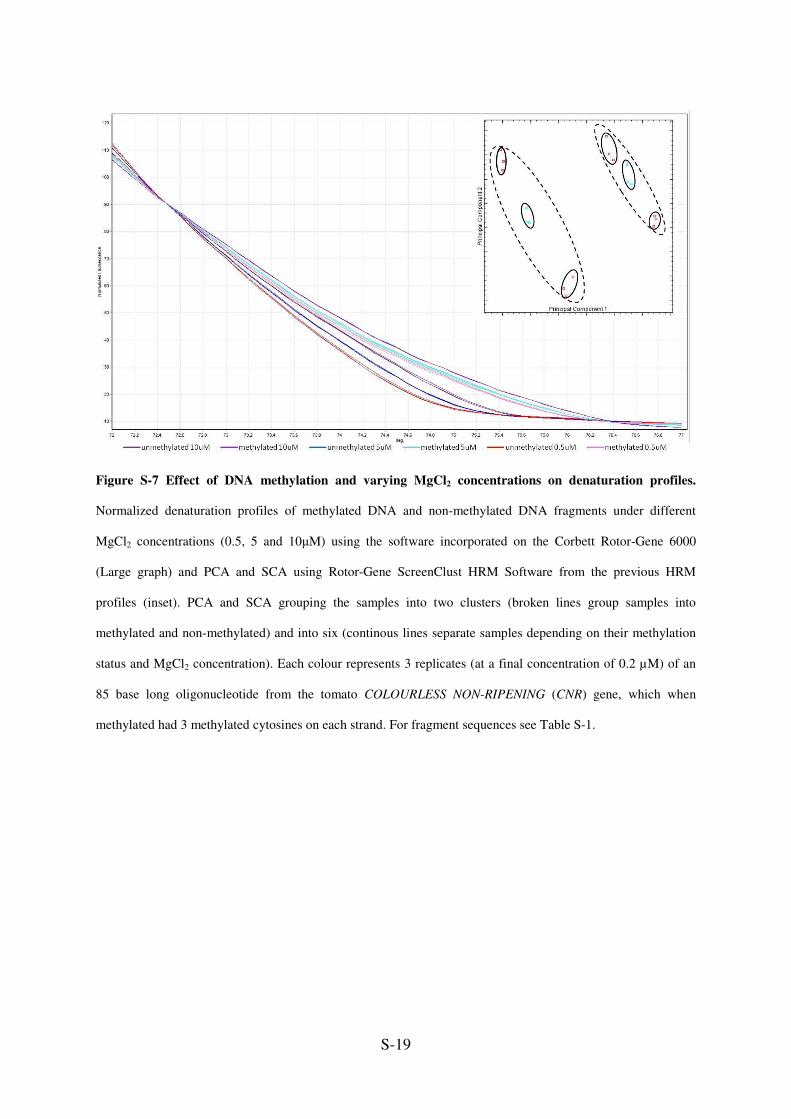
Figure S-7 Effect of DNA methylation and varying MgCl2 concentrations on denaturation profiles.
Normalized denaturation profiles of methylated DNA and non-methylated DNA fragments under different
MgCl2 concentrations (0.5, 5 and 10µM) using the software incorporated on the Corbett Rotor-Gene 6000
(Large graph) and PCA and SCA using Rotor-Gene ScreenClust HRM Software from the previous HRM
profiles (inset). PCA and SCA grouping the samples into two clusters (broken lines group samples into
methylated and non-methylated) and into six (continous lines separate samples depending on their methylation
status and MgCl2 concentration). Each colour represents 3 replicates (at a final concentration of 0.2 µM) of an
85 base long oligonucleotide from the tomato COLOURLESS NON-RIPENING (CNR) gene, which when
methylated had 3 methylated cytosines on each strand. For fragment sequences see Table S-1.