Embed Size (px)
Citation preview

Universidade de São Paulo
2012-10-31
Direct Determination of Sugar Cane Quality
Parameters by X-ray Spectrometry and
Multivariate Analysis JOURNAL OF AGRICULTURAL AND FOOD CHEMISTRY, WASHINGTON, v. 60, n. 43, pp. 10755-
10761, OCT 31, 2012http://www.producao.usp.br/handle/BDPI/33738
Downloaded from: Biblioteca Digital da Produção Intelectual - BDPI, Universidade de São Paulo
Biblioteca Digital da Produção Intelectual - BDPI
Departamento de Ciências Florestais - ESALQ/LCF Artigos e Materiais de Revistas Científicas - ESALQ/LCF
Direct Determination of Sugar Cane Quality Parameters by X‑raySpectrometry and Multivariate AnalysisF. L. Melquiades,*,†,∥ G. G. Bortoleto,‡ L. F. S. Marchiori,§ and M. I. M. S. Bueno∥
†Universidade Estadual do Centro Oeste, Rua Presidente 6 Zacarias, 875,85015-430, Guarapuava, PR, Brazil‡Faculdade de Tecnologia de Piracicaba, Centro Paula Souza, Piracicaba, Sao Paulo, Brazil§Estacao Experimental, Fazenda Areao da Escola Superior de Agricultura Luiz de Queiroz, Universidade de Sao Paulo, Piracicaba,Sao Paulo, Brazil∥Departamento de Quımica Analıtica, Universidade Estadual de Campinas, PO Box 6154,13084-862, Campinas, Sao Paulo, Brazil
ABSTRACT: Current methods for quality control of sugar cane are performed in extracted juice using several methodologies,often requiring appreciable time and chemicals (eventually toxic), making the methods not green and expensive. The presentstudy proposes the use of X-ray spectrometry together with chemometric methods as an innovative and alternative technique fordetermining sugar cane quality parameters, specifically sucrose concentration, POL, and fiber content. Measurements in stem,leaf, and juice were performed, and those applied directly in stem provided the best results. Prediction models for sugar canestem determinations with a single 60 s irradiation using portable X-ray fluorescence equipment allows estimating the % sucrose,% fiber, and POL simultaneously. Average relative deviations in the prediction step of around 8% are acceptable if consideringthat field measurements were done. These results may indicate the best period to cut a particular crop as well as for evaluating thequality of sugar cane for the sugar and alcohol industries.
KEYWORDS: portable X-ray fluorescence, multivariate calibration, sugar cane, PLS, sucrose, fiber
■ INTRODUCTION
Sugar cane is an important food crop of the tropic and sub-tropic areas, cultivated in more than 70 countries locatedbetween 40° N and 32°5′ S, encompassing approximately one-half the globe.1 Raw sugar and ethanol production have beenthe predominant commodity produced from sugar cane(Saccharum spp. hybrids). Worldwide interest in renewableenergy has focused attention in total biomass production ofenergy canes rather than sucrose yield alone.2
The maturation process of sugar cane can be defined as thephysiological process involving formation of sugars in leavesand their transportation and storage in the stem. From aneconomic point of view, the cane has to be cut when itreaches the minimum content of 13% sucrose by weight ofthe stem, which is required to be industrially feasible.3 In Sa oPaulo State, Brazil, the National Concill of Sugar caneProducers of Sa o Paulo State (CONSECANA) adopts the caneprice directly from its sucrose content; thus, the producer needs tocombine high agricultural productivity with high sucrose contentat harvest time. In this context, quality control parameters, such as% sucrose in the juice, % fiber, and POL (polarization) in sugarcane, are important pieces of information for producers as wellas in sugar refineries and food industries because of sucrosecontinuous evolution during the maturation and later fermentationprocesses.Current methods for quality control of sugar cane are per-
formed in extracted juice using several methodologies, such ascutting, milling, pressing, juice clarification, and analysis on asaccharimeter or NIR equipment. These often require appreciabletime and chemicals (eventually toxic), making the methods notgreen and expensive.
Vis/NIR spectroscopy and multivariate calibration is a con-venient combination often used for % sucrose determination.4−11
This paper proposes the use of X-ray spectrometry as an in-novative and alternative technique for sugar cane quality param-eter determination. A branch of X-ray spectrometry, calledX-ray fluorescence, is an analytical technique based primarily onthe photoelectric effect, which reveals qualitative and quantita-tive aspects of atoms contained in a sample. These aspects canbe measured with confidence when the atoms have high enoughphotoelectric X-ray absorption coefficients, that is, for high-Zelements (metals).12 Generally, when a sample contains very lightelements (Z < 11), the incident X-ray beam is mainly scatteredand poorly absorbed. However, the scattering regions of similarsamples are very informative when combined with a multivariatemathematical tool.13 This is the basis of the X-ray scatteringspectrometry (XRSS) technique,14 which not only considerscharacteristic elemental lines but also makes use of otherspectral regions including scattering peaks from Rayleigh,Compton, and Raman effects. Hence, by using the spectrumenergy interval that covers X-ray source scatter and applyingchemometrics tools on it, it has been possible to classify com-plex organic samples 15 such as vegetable oils,16 varnishes,17
plants,18 polymers,19 and teas.20 Quantitative aspects can alsobe extracted by correlations using multivariate calibrations,common sugars with degrees of sweetness,21 sucrose inversionmonitoring, sucrose content in liquid samples,11,12 energy
Received: June 7, 2012Revised: September 26, 2012Accepted: October 5, 2012Published: October 5, 2012
Article
pubs.acs.org/JAFC
© 2012 American Chemical Society 10755 dx.doi.org/10.1021/jf302471b | J. Agric. Food Chem. 2012, 60, 10755−10761
values of industrialized foods,22 and Ti concentration intoothpastes.23 Thus, XRSS and chemometrics producesexcellent results with several organic samples, is essentiallynondestructive and fast, requires minimal sample handling anddata treatment, and can be used in situ, with portable equipment,without generating any kind of chemical residuals.Portable X-ray fluorescence with homemade or commercial
equipment is actually viable, and its applications have been in-creasing in recent years.24 It has been applied in a great varietyof issues for environmental and geological interest,25−29
archaeometry, archeological,30−34 quality control monitorings,35−37
among others.The objectives of this paper are (a) to determine sugar cane
quality parameters (% sucrose in juice, % POL of cane, % fiber)using energy-dispersive X-ray fluorescence (EDXRF) togetherwith chemometric methods, allowing quantification of theseparameters simultaneously, rapidly, and nondestructively, and(b) to evaluate the best sugar cane matrix (stem, leaf, or juice)to produce this information.
■ MATERIAL AND METHODSInstrumentation. Two different EDXRF systems were used. For
field measurements, the portable InnovX system model AlphaCam wasused, provided with a Ta target X-ray tube and a Si-PIN detector.Measurement conditions were optimized for voltage, current, and filterin the X-ray tube, and the best condition was 20 kV, 20 μA, and 100 μmAl filter. In laboratory measurements, a Shimadzu EDX 700 with a RhX-ray tube and a Si(Li) detector was used with 50 kV, 100 μA, and 100 sof irradiation, in air atmosphere and no radiation filter.
For conventional analysis of juice, a miller (Dedini-Siemens), a hydrau-lic press (MA098/cana, Marconi) at 250 kgf/cm2 for 60 s, a moistureanalyzer (IV-2000, GEHAKA), a polarimeter (Propol, Anton Paar with40 mm cells), and a refratrometer (Abbe, Quimis) were used.
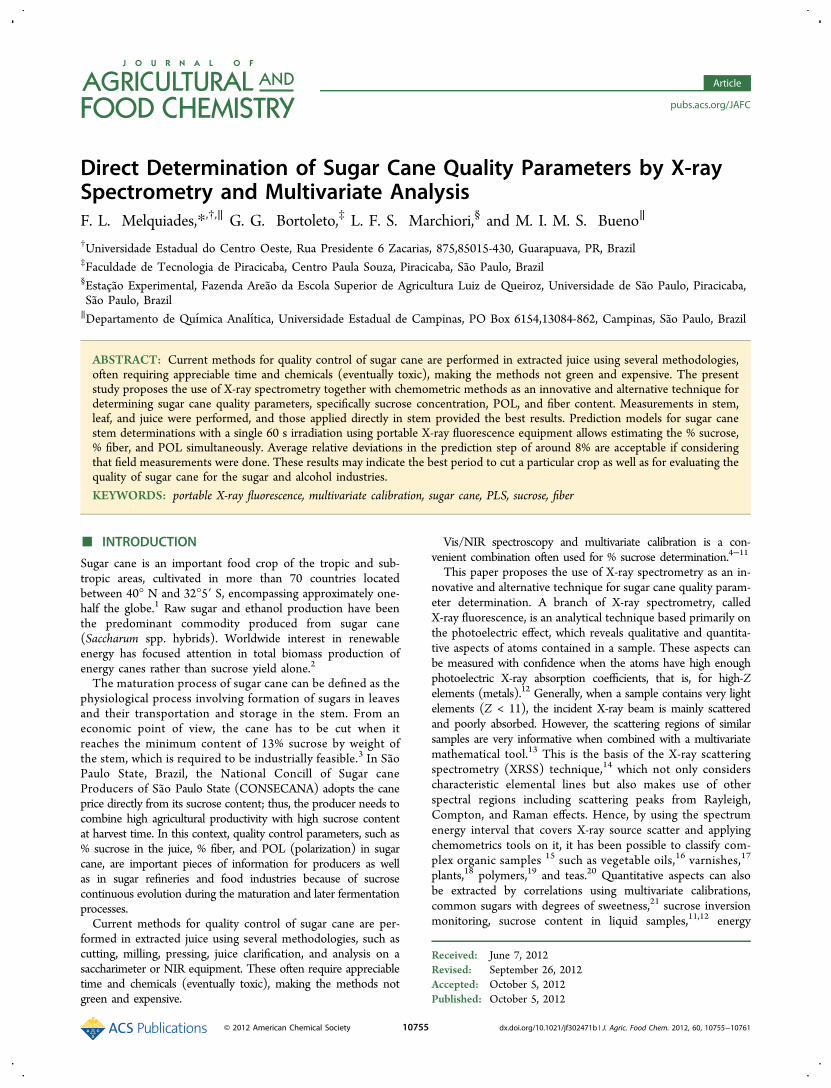
Sampling. Eleven different varieties of sugar cane from FazendaAreao of Escola Superior de Agricultura Luiz de Queiroz, University ofSao Paulo, were analyzed. Ninety seven samples were analyzed in thefield and subsequently cut for analysis by conventional methods. Therewere 22 samples collected in August, 24 in September, 26 in October,and 25 in December 2011. The varieties studied (with its codes inparentheses) were Saccharum of f icinarum (SAC), IAC SP95 5000(IAC95), RB835089 (RB89), RB 835486 (RB86), RB 867515 (RB15),SP 711406 (SP06), SP 813250 (SP50), SP 803280 (SP80), SP 803280(SP80), SP 701143 (SP43), SP 8642 (SP42).
At each sampling the team traveled to the experimental farm withthe portable EDXRF system for field measurements. In August 2011,2 stalks of each variety were cut with their leaves. After applying a PCA(principal component analysis) with these data, the necessity of moresamples from Saccharum of f icinarum was verified, whose pointsseparated sharply from the other in the scores plots.
Irradiations were performed directly in the central stem without anykind of major preparation, just cleaning the region with dry paper.Hand-held equipment was supported over the stem in order to avoidvariation in the measurement geometry. The same care was devoted tothe leaves, from which the middle front face of +3 leaf was chosen forall measurements. The first leaf from the top to the bottom of the stalkwith clearly visible dewlap is designated as +1. Downward, they receivethe numbers +2 and +3. The top visible dewlap leaf +3 is providedwith a diagnostic tissue that is frequently used in the evaluation of plantnutritional status. Initially the stem and +3 leaf samples were irradiated inthe field, directly in the grounded plant. After some tests, it was noted thatthe results were equivalent for planted samples and for up to 6 h after
Figure 1. Measurement procedure and number of spectra obtainedwith portable equipment in each measurement.
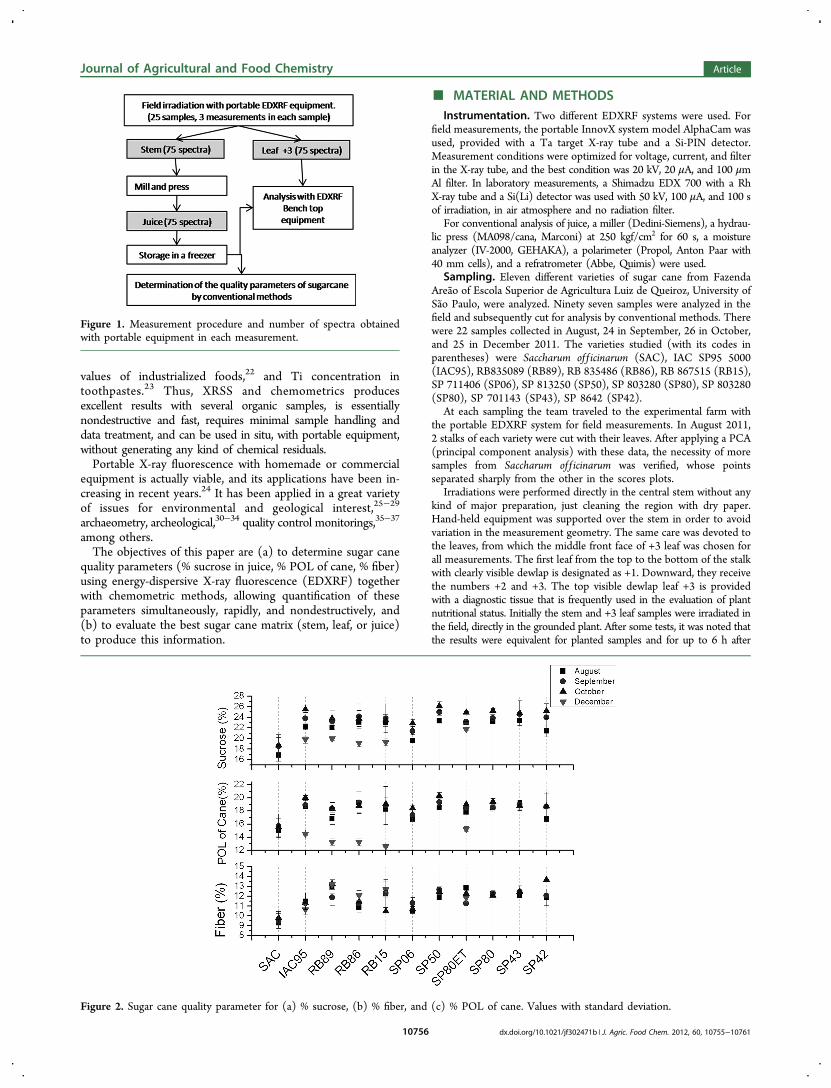
Figure 2. Sugar cane quality parameter for (a) % sucrose, (b) % fiber, and (c) % POL of cane. Values with standard deviation.
Journal of Agricultural and Food Chemistry Article
dx.doi.org/10.1021/jf302471b | J. Agric. Food Chem. 2012, 60, 10755−1076110756

cutting. Thus, the samples were cut and analyzed in the laboratory wherethe procedures of cane processing were performed. The leaves werestored in plastic bags and irradiated at the benchtop equipment in thesame day. All samples were measured 3 times by EDXRF.After EDXRF measurements, sugar cane was milled and pressed to
obtain fiber and juice for conventional laboratory analysis of sugar canequality parameters, as shown Figure 1. Juice was frozen for posterioranalysis in both EDXRF equipments, when 3 mL of the liquid was placedin XRF cells covered with a 2.5 μm thick Mylar (polyterphtalate) film.
Conventional Methodology for Quality Parameters Deter-mination. Values of % sucrose in the juice, % fiber, and % POL ofcane were first obtained by conventional methodologies following theCONSECANA guide.3 All methods described by CONSECANA arein agreement with the international rules from ICUMSA (Interna-tional Commission for Uniform Methods of Sugar Analysis),38 whichare recognized by the Codex Alimentarius, European Union, and USAChemicals Codex.
After cutting the plant, each sample was milled to break the fiberand 500 g of it was pressed to obtain the juice. The wet cake so pro-duced is weighted (PBU) and then dried at 120 °C for 10 min usingan infrared moisture analyzer.
For % sucrose (S) quantification, the juice must be clarified usinglead subacetate, which was added to 200 mL of sugar cane juice. Clarifiedjuice is analyzed using 40 mm cells at the polarimeter.
Fiber content, in %, was calculated from wet cake weight (PBU)according to the equation3
= +Fiber(F) 0.08PBU 0.876
The POL of cane (PC), in %, was calculated considering % sucrosein the juice (S) and fiber content (F) using the equation3
= −PC S(1 0.01F)C
where C = 1.0313 − 0.00575 F.Regression Models by Partial Least Squares (PLS). PLS is a
well-known factor analysis multivariate method principally applied forprediction.39,40 It requires a calibration step in which a model is con-structed from a number of significant factors that establish a relationbetween independent variables (X matrix, samples spectra, in thiscase) with physical or chemical properties (Y matrix, concentration ofthe quality parameters of sugar cane, in this case), developing amathematical model that makes possible the provision of unknownsamples. Values for Y matrices were obtained from conventional deter-mination of the sugar cane parameters. X matrices were prepared usingthe mean value of 3 measurements performed for each sample.
Models for % sucrose, % fiber, and % POL of cane (PC) were devel-oped, since these are the main parameters used by farmers and refineriesfor evaluating the degree of maturarion and quality of sugar cane.Otherwise, other parameters can be evaluated using the measured dataand equations that are given in the CONSECANA 3 rules.
PLS models were tested with different preprocessing techniques andspectrum region (number of variables in the X matrix). From the 97samples, 24 were used as external prevision samples. The Kennard−Stone algorithm41 was applied to obtain a uniform subset selection.
Figure 3. Stem, leaf, and juice sugar cane spectra for IAC95-5000variety. Dotted square refers to the portion used to calculate thedetection and quantification limits.
Table 1. Detection Limit (DL) and Quantification Limit(QL) Values for the Sugar Cane Parameters Determined byPortable EDXRF
stem leaf juice
DL QL DL QL DL QL
% sucrose 2.4 7.2 6.4 19.3 1.8 5.4% POL of cane 1.4 4.1 3.5 10.7 1.1 3.2% fiber 1.5 4.5 4.0 12.2 0.9 2.8
Table 2. PLS Model Parameters for the Set of Internal and External Validation for Stem, Leaf, and Juice of Sugarcane forPortable and Benchtop Equipmenta
sample (no. of samplesversus XRF measurement) equipment sugar cane parameter LV validation samplesb RMSEC RMSECV RMSEP R2 cal R2 pred
stem (97 × 3) portable % sucrose 6 14 0.5 2.5 0.7 0.96 0.88% fiber 6 10 0.3 1.1 0.3 0.94 0.86% POL of cane 6 10 0.1 1.5 0.3 0.99 0.92
leaf (97 × 3) portable % sucrose 8 18 0.6 2.8 1.0 0.94 0.74% fiber 8 13 0.3 1.3 0.5 0.92 0.63% POL of cane 8 15 0.4 1.6 0.6 0.95 0.69
benchtop % sucrose 8 14 0.6 2.3 1.0 0.95 0.77% fiber 8 20 0.24 1.2 0.9 0.96 0.16% POL of cane 8 16 0.4 1.6 1.1 0.95 0.49
juice (97 × 3) portable % sucrose 6 16 0.03 2.2 1.7 0.99 0.49% fiber 6 16 0.04 1.2 0.7 0.99 0.47% POL of cane 6 18 0.05 1.7 0.7 0.99 0.63
benchtop % sucrose 4 19 0.4 2.3 1.4 0.98 0.68% fiber 4 23 0.2 1.2 0.9 0.97 0.12% POL of cane 4 18 0.2 1.5 1.8 0.98 0.10
aLV: latent variable. RMSEC: root mean square error of the calibration. RMSECV: root mean squares error of cross validation. RMSECP: root meansquare error of the prediction. R2 cal: Correlation coeficient of calibration. R2pred: Correlation coeficient of prediction. bNumber of validationsamples considering 3 times RMSEC.
Journal of Agricultural and Food Chemistry Article
dx.doi.org/10.1021/jf302471b | J. Agric. Food Chem. 2012, 60, 10755−1076110757

MatLab software with PLS ToolBox version 5.8 was used to executethe multivariate calculations.Outliers are identified comparing the root mean square error of
calibration (RMSEC) with the absolute error of that sample. In thisstudy, a sample presenting a difference between its reference and itsestimate values higher than 3 times the RMSEC is considered anoutlier.42
Detection Limits and Quantification Limits in EDXRFAnalysis. To estimate the detection limits (DL) from the param-eters of interest in the portable EDXRF system, it is necessary tocalculate the blank deviation or background under the region ofinterest in the spectrum. Considering the example for the % sucrosedetermination, first, a sugar cane sample without sucrose, in its stemor juice, is not naturally available. Besides this, in the present study,% sucrose is evaluated with X-ray scattering information, i.e., thereis no sucrose peak in the obtained spectra. An alternative aproxi-mation for DL and quantification limits (QL) when multivariatecalibration is used is to select a region of the spectrum with noisesignal or scattering signal and consider it as the net analytical signal
(NAS).43,44 In this case, the final part of the spectrum often offersenough data for DL and QL calculations45
δ δ= || || =x xbDL 3 3 /SEN
δ δ= || || =x xbQL 10 3 /SEN
where δx is the standard deviation of the reference signal obtainedfrom a matrix (n, m), with n samples and m variables, ∥b∥ is thenorm regression vector from the calibration model, and SEN is thesensitivity or the inverse of b norm.
■ RESULTS AND DISCUSSION
Sugar Cane Quality Parameters. Figure 2 presents theaverage values of the sugar cane parameters, where the degreeof maturation of each variety can be evaluated. Saccharumof f icinarum presented the lowest values of % sucrose comparedwith others. In general, the varieties reached their peak of sucrosein October, and sucrose inversion to glucose and fructose was
Figure 4. Loadings graphics from all latent variables used in the PLS model for sucrose in the stem with the portable XRF equipment data.
Journal of Agricultural and Food Chemistry Article
dx.doi.org/10.1021/jf302471b | J. Agric. Food Chem. 2012, 60, 10755−1076110758
clearly noted in December. These data comprise Y matrixes usedin the PLS regression models.Detection Limits and Quantification Limits. Detection
limits for the portable EDXRF equipment were determinedusing the final part of the spectra from stem, leaves, and juice of52 samples from the calibration set. The data comprises 3matrices of (52 × 405), related to the spectral region from 12to 20 keV, as shown in Figure 3. The obtained values arepresented in Table 1, indicating that the system has enoughsensitivity to estimate the parameters of interest.PLS Model Results. After several simulations using Matlab,
distinct preprocessing methods were tested as well as severalnumber of variables in matrix data. Nevertheless, after evaluatingthese simulations, the mean centering preprocessing with thewhole spectrum (from 2 to 20 keV for portable equipment andfrom 2 to 40 keV for bench equipment) was considered thebest choice. The validation proccess used a total of 24 samples.
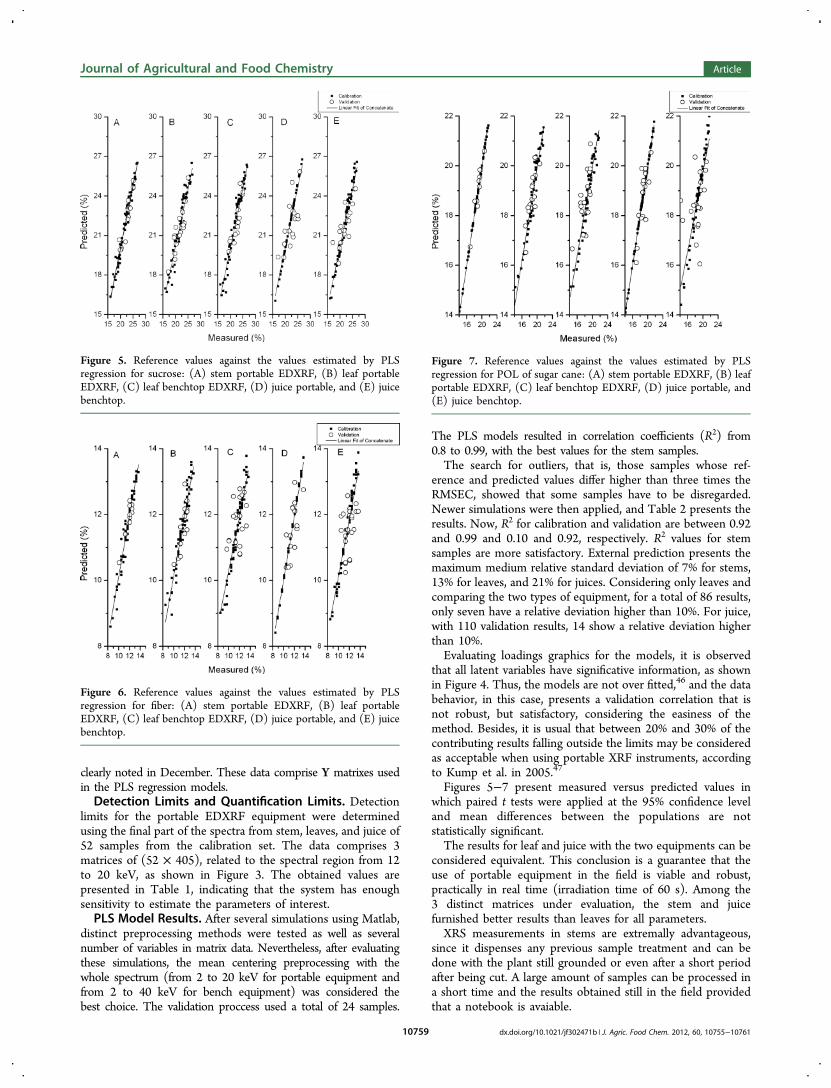
The PLS models resulted in correlation coefficients (R2) from0.8 to 0.99, with the best values for the stem samples.The search for outliers, that is, those samples whose ref-
erence and predicted values differ higher than three times theRMSEC, showed that some samples have to be disregarded.Newer simulations were then applied, and Table 2 presents theresults. Now, R2 for calibration and validation are between 0.92and 0.99 and 0.10 and 0.92, respectively. R2 values for stemsamples are more satisfactory. External prediction presents themaximum medium relative standard deviation of 7% for stems,13% for leaves, and 21% for juices. Considering only leaves andcomparing the two types of equipment, for a total of 86 results,only seven have a relative deviation higher than 10%. For juice,with 110 validation results, 14 show a relative deviation higherthan 10%.Evaluating loadings graphics for the models, it is observed
that all latent variables have significative information, as shownin Figure 4. Thus, the models are not over fitted,46 and the databehavior, in this case, presents a validation correlation that isnot robust, but satisfactory, considering the easiness of themethod. Besides, it is usual that between 20% and 30% of thecontributing results falling outside the limits may be consideredas acceptable when using portable XRF instruments, accordingto Kump et al. in 2005.47
Figures 5−7 present measured versus predicted values inwhich paired t tests were applied at the 95% confidence leveland mean differences between the populations are notstatistically significant.The results for leaf and juice with the two equipments can be
considered equivalent. This conclusion is a guarantee that theuse of portable equipment in the field is viable and robust,practically in real time (irradiation time of 60 s). Among the3 distinct matrices under evaluation, the stem and juicefurnished better results than leaves for all parameters.XRS measurements in stems are extremally advantageous,
since it dispenses any previous sample treatment and can bedone with the plant still grounded or even after a short periodafter being cut. A large amount of samples can be processed ina short time and the results obtained still in the field providedthat a notebook is avaiable.
Figure 5. Reference values against the values estimated by PLSregression for sucrose: (A) stem portable EDXRF, (B) leaf portableEDXRF, (C) leaf benchtop EDXRF, (D) juice portable, and (E) juicebenchtop.
Figure 6. Reference values against the values estimated by PLSregression for fiber: (A) stem portable EDXRF, (B) leaf portableEDXRF, (C) leaf benchtop EDXRF, (D) juice portable, and (E) juicebenchtop.
Figure 7. Reference values against the values estimated by PLSregression for POL of sugar cane: (A) stem portable EDXRF, (B) leafportable EDXRF, (C) leaf benchtop EDXRF, (D) juice portable, and(E) juice benchtop.
Journal of Agricultural and Food Chemistry Article
dx.doi.org/10.1021/jf302471b | J. Agric. Food Chem. 2012, 60, 10755−1076110759
Using the juice to acquire the same parameter values is moretroublesome but viable. To do so, it is obviously necessary toextract the juice from the sugar cane and pour it in a specificcell used for XRF irradiation, with the sample sustained on aMylar film. In such a case, irradiations were necessary to bedone in a support provided with the portable equipment. Thisis caused by the sample being a liquid; a more stable platform isrequired. In this case, irradiations done inside the laboratory aremore adequate.The mean predicted relative deviations are around 3%, an
accetable value. As a final statement, the prediction results canbe regarded as excellent, since three essential parameters forquality control of sugar cane can be estimated in a single 60 sirradiation, in the field, with a hand-portable instrument, andalso with the plant still grounded. The great profit of this studyis the aid in deciding the best time to have the sugar cane readyto be cut off, with a maximum of benefit. Alcohol and sugarfactories can also take advantage of it.
■ AUTHOR INFORMATION
Corresponding Author*Phone: 55 42 3629 8129. Fax: 55 42 3629 8102. E-mail:[email protected].
FundingThe authors express thanks to Fapesp (Project number2011_05860-2) and CNPq for financial support.
NotesThe authors declare no competing financial interest.
■ REFERENCES(1) Food and Agriculture Organization of the United Nations; FAOStatistical Yearbook: Rome, 2010.(2) Inman-Bamber, N. G.; Jackson, P. A.; Hewitt, M. Sucroseaccumulation in sugarcane stalks does not limit photosynthesis andbiomass production. Crop Pasture Sci. 2011, 62, 848−58.(3) National Concill of Sugarcane Producers of Sao Paulo State.Instruction Manual; CONSECANA-SP: Piracicaba- SP, 2006; p 112 (inportuguese).(4) Chang, W. H.; Chen, S.; Tsai, C. C. Development of a universalalgorithm for use of NIR in estimation of soluble solids in fruit juices.Trans. ASAE 1988, 41, 1739−45.(5) Salgo, A.; Nagy, J.; Miko, E. Application of near infraredspectroscopy in the sugar industry. J. Near Infrared Spectrosc. 1998, 6,A101−6.(6) Irudayaraj, J.; Xu, F.; Tewari, J. J. Rapid determination of invertcane sugar adulteration in honey using FTIR spectroscopy andmultivariate analysis. J. Food Sci. 2003, 68, 2040−5.(7) Tewari, J.; Mehrotra, R.; Irudayaraj, J. Direct near infraredanalysis of sugar cane clear juice using a fibre-optic transmittanceprobe. J. Near Infrared Spectrosc. 2003, 11, 351−6.(8) Lima, S. L. T.; Mello, C.; Poppi, R. J. PLS pruning: a newapproach to variable selection for multivariate calibration based onHessian matrix of errors. Chemometr. Intell. Lab. Syst. 2005, 76, 73−8.(9) Valderrama, P.; Braga, J. W. B.; Poppi, R. J. Validation ofmultivariate calibration models in the determination of sugar canequality parameters by near infrared spectroscopy. J. Braz. Chem. Soc.2007, 18, 259−66.(10) Valderrama, P.; Braga, J. W. B.; Poppi, R. J. Variable Selection;Outlier Detection; and Figures of Merit Estimation in a Partial Least-Squares Regression Multivariate Calibration Model. A Case Study forthe Determination of Quality Parameters in the Alcohol Industry byNear-Infrared Spectroscopy. J. Agric. Food Chem. 2007, 55, 8331−8.(11) Sorol, N.; Arancibia, E.; Bortolato, S. A.; Olivieri, A. C. Visible/near infrared-partial least-squares analysis of Brix in sugar cane juice
A test field for variable selection methods. Chemometr. Intell. Lab. Syst.2010, 102, 100−9.(12) Alexandre, T. L.; Goraieb, K.; Bueno, M. I. S. B. Quality controlof beverages using XRS allied to chemometrics: determination of fixedacidity; alcohol and sucrose contents in Brazilian cachaca and cashewjuice. X-ray Spectrom. 2010, 39, 285−90.(13) Goraieb, K.; Alexandre, T. L.; Bueno, M. I. M. S. Sucroseinversion monitored by x-ray scattering and chemometrics. X-raySpectrom. 2007, 36, 241−6.(14) Bueno, M. I. M. S.; Castro, M. T. P. O.; Souza, A. M.; Oliveira,E. B. S.; Teixeira, A. P. X-ray scattering processes and chemometricsfor differentiating complex samples using conventional EDXRFequipment. Chemom. Intell. Lab. Syst. 2005, 78, 96−101.(15) Bortoleto, G. G.; Borges, S. S. O.; Bueno, M. I. M. S. X-rayscattering and multivariate analysis for classification of organicsamples: A comparative study using Rh tube and synchrotronradiation. Anal. Chim. Acta 2007, 595, 38−42.(16) Bortoleto, G. G.; Pataca, L. C. M.; Bueno, M. I. M. S. A newapplication of X-ray scattering using principal component analysis −classification of vegetable oils. Anal. Chim. Acta 2005, 539, 283−7.(17) Verbi, F. M.; Pereira-Filho, E. R.; Bueno, M. I. M. S. Use of X-Ray Scattering for Studies with Organic Compounds: a Case StudyUsing Paints. Microchim. Acta 2005, 150, 131−6.(18) Alexandre, T. L.; Bueno, M. I. M. S. Classification of somespecies; genera and families of plants by x-ray spectrometry. X-raySpectrom. 2006, 35, 257−60.(19) Vasquez, C.; Boeykens, S.; Bonadeo, H. Total reflection X-rayfluorescence polymer spectra: classification by taxonomy statistic tools.Talanta 2002, 57, 1113−7.(20) Pereira, F. M. V.; Pereira Filho, E. R.; Bueno, M. I. M. S.Development of a Methodology for Calcium; Iron; Potassium;Magnesium; Manganese; and Zinc Quantification in Teas Using X-ray Spectroscopy and Multivariate Calibration. J. Agric. Food Chem.2006, 54, 5723−30.(21) Goraieb, K.; Alexandre, T. L.; Bueno, M. I. M. S. X-rayspectrometry and chemometrics in sugar classification; correlationwith degree of sweetness and specific rotation of polarized light. Anal.Chim. Acta 2007, 595, 170−5.(22) Terra, J.; Antunes, A. M.; Bueno, M. I. M. S.; Prado, M. A.Energy value determinations of industrialized foods: the potencial ofusing X-ray spectroscopy and partial least squares. X-ray Spectrom.2010, 39, 167−75.(23) Schwab, N. V.; Da-Col, J. A.; Terra, J.; Bueno, M. I. M. S. FastDirect Determination of Titanium Dioxide in Toothpastes by X-RayFluorescence and Multivariate Calibration. J. Braz. Chem. Soc. 2012,23, 546−54.(24) Potts, P. J. In Portable X-ray Fluorescence Spectrometry:Capabilities for In-situ Analysis; Potts, P. J., West, M., Eds.; RSCPublishing: London, 2008; pp 1−12.(25) Figueroa-Cisterna, J.; Bagur-Gonzalez, M. G.; Morales-Ruano, S;Carrillo-Rosua, J.; Martin-Peinadoe, F. The use of a combined portableX-ray fluorescence and multivariate statistical methods to assess avalidated macroscopic rock samples classification in an ore explorationsurvey. Talanta 2011, 85, 2307−15.(26) Melquiades, F. L.; Parreira, P. S.; Appoloni, C. R.; Silva, W. D.;Lopes, F. Quantification of metals in river water using a portableEDXRF system. Appl. Radiat. Isot. 2011, 69, 327−33.(27) Chou, J.; Clement, G.; Bursavich, B.; Elbers, D.; Cao, B.; Zhou,W. Rapid detection of toxic metals in non-crushed oyster shells byportable X-ray fluorescence spectrometry. Environ. Pollut. 2010, 158,2230−4.(28) Jang, M. Application of portable X-ray fluorescence (pXRF) forheavy metal analysis of soils in crop fields near abandoned mine sites.Environ. Geochem. Health 2010, 32, 207−16.(29) Radu, T.; Diamond, D. Comparison of soil pollutionconcentrations determined using AAS and portable XRF techniques.J. Hazard. Mater. 2009, 171, 1168−71.(30) Van der Snickt, G.; Janssens, K.; Schalm, O.; Aibeo, C.; Kloust,H.; Alfelda, M. James Ensor’s pigment use: artistic and material
Journal of Agricultural and Food Chemistry Article
dx.doi.org/10.1021/jf302471b | J. Agric. Food Chem. 2012, 60, 10755−1076110760
evolution studied by means of portable X-ray fluorescencespectrometry. X-ray Spectrom. 2010, 39, 103−11.(31) Nazaroff, A. J.; Prufer, K. M.; Drake, B. L. Assessing theapplicability of portable X-ray fluorescence spectrometry for obsidianprovenance research in the Maya lowlands. J. Archaeol. Sci. 2010, 37,885−95.(32) Kato, N.; Nakai, I.; Shindo, Y. Transitions in Islamic plant-ashglass vessels: on-site chemical analyses conducted at the Raya/al-Turarea on the Sinai Peninsula in Egypt. J. Archaeol. Sci. 2010, 37, 1381−95.(33) Mudronja, D.; Jaksic, M.; Fazinic, S.; Bo_zicevic, I.; Desnica, V.;Woodhead, J.; Stos-Gale, Z. A. Croatian Appoxiomenos alloycomposition and lead provenance study. J. Archaeol. Sci 2010, 37,1396−402.(34) Sawczak, M.; Kamin ska, A.; Rabczuk, G.; Ferretti, M.;Jendrzejewski, R.; liwin ski, G. S Complementary use of the Ramanand XRF techniques for non-destructive analysis of historical paintlayers. Appl. Surf. Sci. 2010, 255, 5542−5.(35) West, M.; Ellis, A. T.; Potts, P. J.; Streli, C.; Vanhoof, C.;Wegrzynek, D.; Wobrauschek, P. Atomic spectrometry update. X-Rayfluorescence spectrometry. J. Anal. At. Spectrom. 2009, 24, 1289−326.(36) Palmer, P. T.; Jacobs, R.; Baker, P. E.; Ferguson, K.; Webber, S.Use of field-portable XRF analyzers for rapid screening of toxicelements in FDA-regulated products. J. Agric. Food Chem. 2009, 57,2605−13.(37) Melquiades, F. L.; Ferreira, D. D.; Appoloni, C. R.; Lopes, F.;Lonni, A. A. G.; Oliveira, F. M.; Duarte, J. C. Titanium dioxidedetermination in sunscreen by energy dispersive X-ray fluorescencemethodology. Anal. Chim. Acta 2008, 613, 135−43.(38) ICUMSA (International Commission for Uniform Methods ofSugar Analysis); www.icumsa.org (access 05/18/2012).(39) Massart, D. L.; Vandeginste, B. G. M.; Buydens, L. M. C.; Jong,S. D.; Lewi, P. J.; Smeyers-Verbeke, J. Handbook of Chemometrics andQualimetrics; Elsevier: Amsterdam, 1997.(40) Adams, M. J. Chemometrics in Analytical Spectroscopy; The RoyalSociety of Chemistry: Wolverhanpton, 1995.(41) Daszykowski, M.; Walczak, B.; Massart, D. L. Representativesubset selection. Anal. Chim. Acta 2002, 468, 91−103.(42) Martens, H.; Naes, T. MultiVariate Calibration; John Wiley &Sons: New York, 1989.(43) Lober, A.; Faber, K.; Kowalski, B. R. Net analyte signalcalculation in multivariate calibration. Anal. Chem. 1997, 69, 1620−6.(44) Boque, R.; Faber, K.; Rius, F. X. Detection limits in classicalmultivariate calibration models. Anal. Chim. Acta 2000, 423, 41−9.(45) Valderrama, P.; Braga, J. W. B.; Poppi, R. J. Estado da arte defiguras de merito em calibracao multivariada. Quim. Nova 2009, 32,1278−87 (in portuguese).(46) Schwab, N. V.; Da-Col, J. A.; Terra, J.; Bueno, M. I. M. S. FastDirect Determination of Titanium Dioxide in Toothpastes by X-RayFluorescence and Multivariate Calibration. J. Braz. Chem. Soc. 2012,23, 546−554.(47) Kump, P.; Necemer, M.; Rupnik, P. Development of thequantification procedures for in situ XRF analysis. Report IAEA-TECDOC-1456; International Atomic Energy Agency: Viena, 2005.
Journal of Agricultural and Food Chemistry Article
dx.doi.org/10.1021/jf302471b | J. Agric. Food Chem. 2012, 60, 10755−1076110761