Embed Size (px)
Citation preview
Direct Frequency Comb Spectroscopy for the Study of Molecular Dynamics in
the Infrared Fingerprint Region
Adam J. Fleisher, Bryce Bjork, Kevin C. Cossel, Jun YeJILA|NIST and University of Colorado - Boulder
Lora Nugent-Glandorf, Florian Adler, Tyler Neely, Scott A. DiddamsNational Institute of Standards and Technology
Tim DinneenPrecision Photonics
FA 11The 67th OSU International Symposium on Molecular Spectroscopy – June 22, 2012
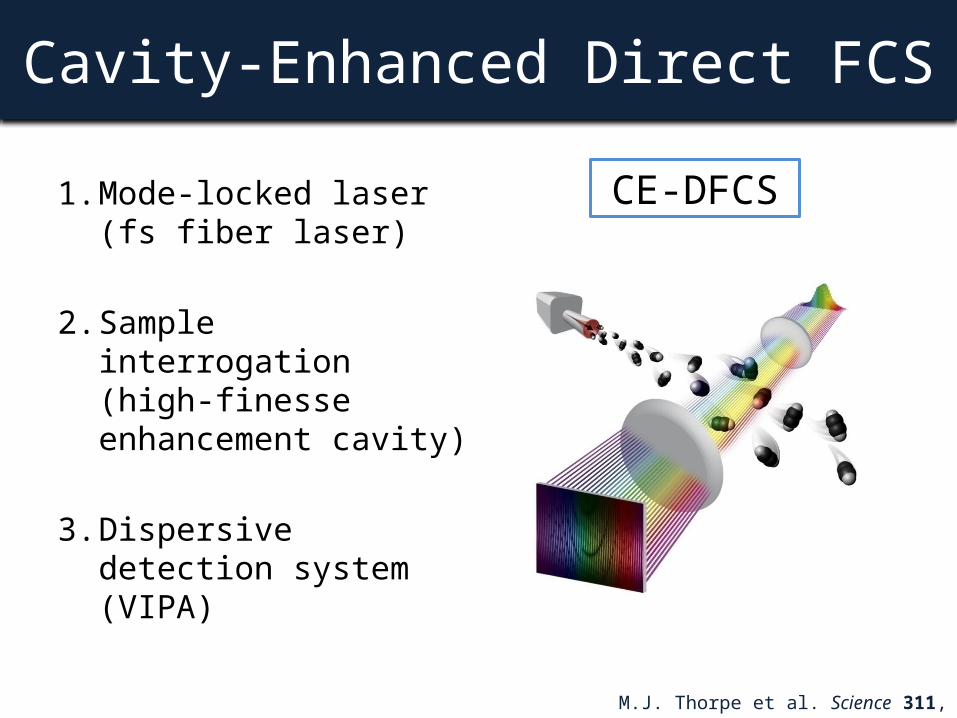
Cavity-Enhanced Direct FCS
1. Mode-locked laser (fs fiber laser)
2. Sample interrogation (high-finesse enhancement cavity)
3. Dispersive detection system (VIPA)
M.J. Thorpe et al. Science 311, 1595 (2006).
CE-DFCS
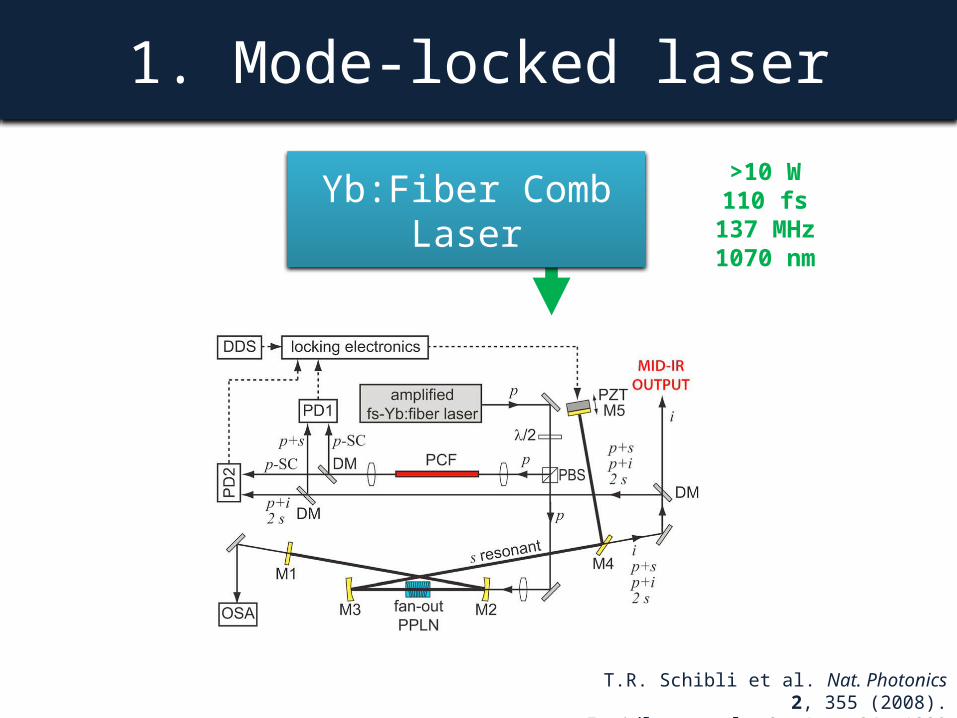
1. Mode-locked laser
T.R. Schibli et al. Nat. Photonics 2, 355 (2008).F. Adler et al. Opt. Lett. 34, 1330 (2009).
>10 W110 fs
137 MHz1070 nm
Yb:Fiber Comb Laser
1. Mode-locked laser
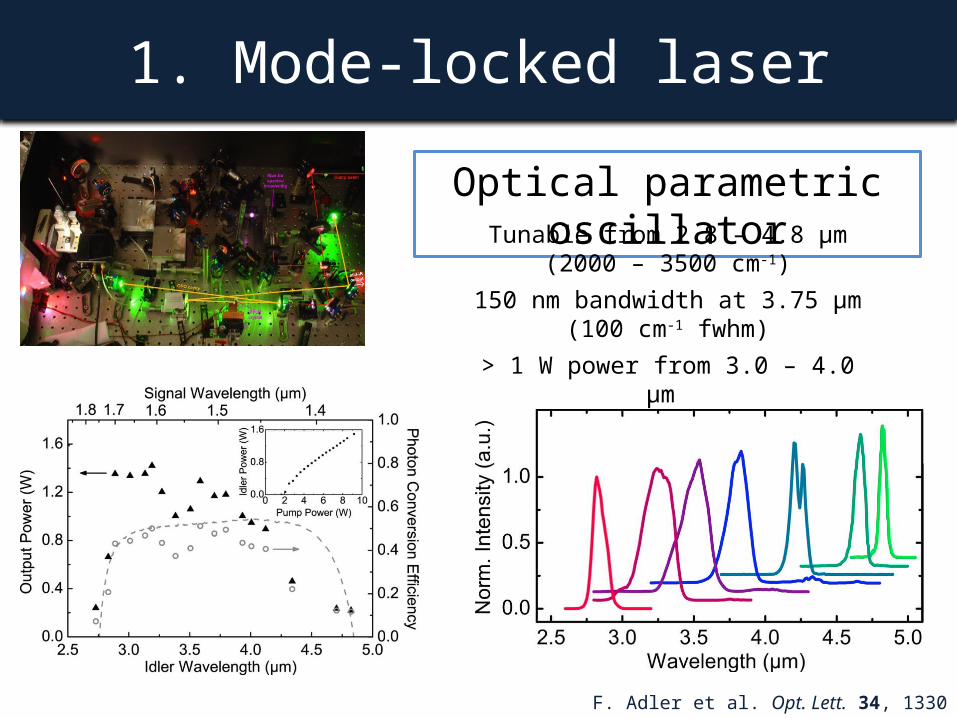
F. Adler et al. Opt. Lett. 34, 1330 (2009).
Optical parametric oscillatorTunable from 2.8 – 4.8 μm
(2000 – 3500 cm-1)
150 nm bandwidth at 3.75 μm(100 cm-1 fwhm)
> 1 W power from 3.0 – 4.0 μm
2. Sample Interrogation
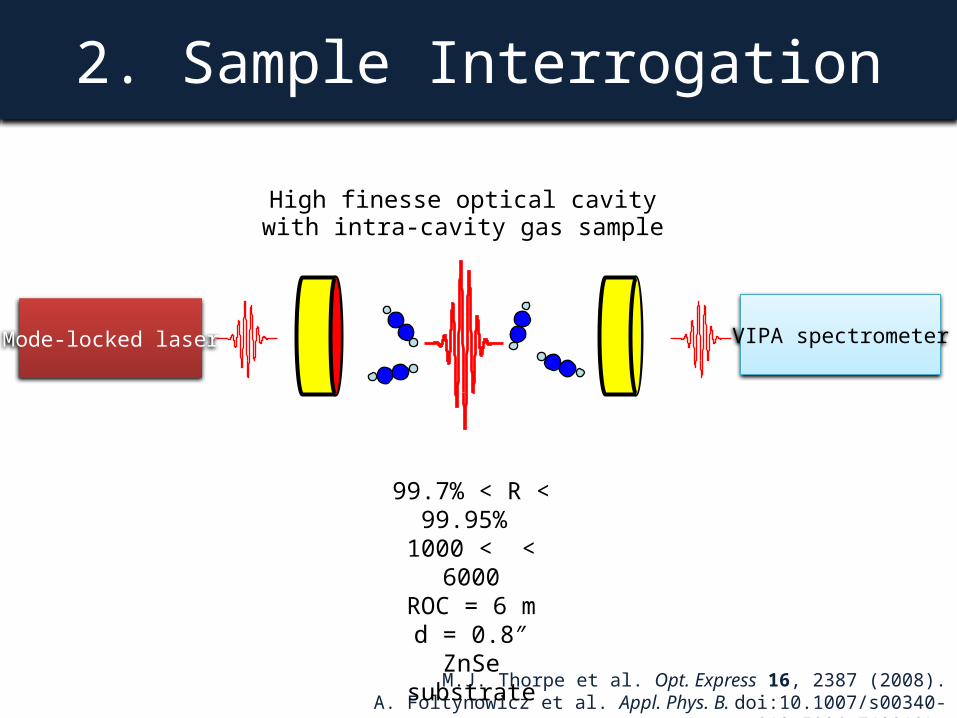
M.J. Thorpe et al. Opt. Express 16, 2387 (2008).A. Foltynowicz et al. Appl. Phys. B. doi:10.1007/s00340-012-5024-7(2012).
Mode-locked laser VIPA spectrometer
High finesse optical cavitywith intra-cavity gas sample
99.7% < R < 99.95% 1000 < < 6000
ROC = 6 md = 0.8″
ZnSe substrate
3. Dispersive detector
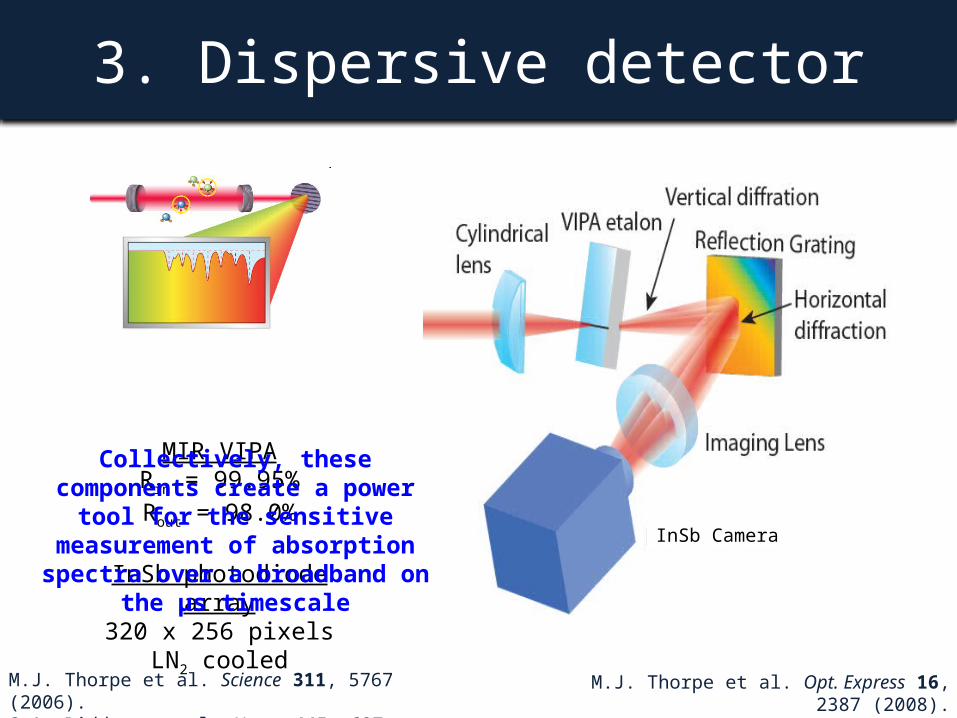
InSb Camera
M.J. Thorpe et al. Opt. Express 16, 2387 (2008).M.J. Thorpe and J. Ye, Appl. Phys. B 91, 397 (2008).
M.J. Thorpe et al. Science 311, 5767 (2006).S.A. Diddams et al. Nature 445, 627 (2007).
MIR VIPARin = 99.95%Rout = 98.0%
InSb photodiode array320 x 256 pixels
LN2 cooled
Collectively, these components create a power tool for the sensitive
measurement of absorption spectra over a broadband on the μs timescale
VIPA Characterization and Spectroscopy
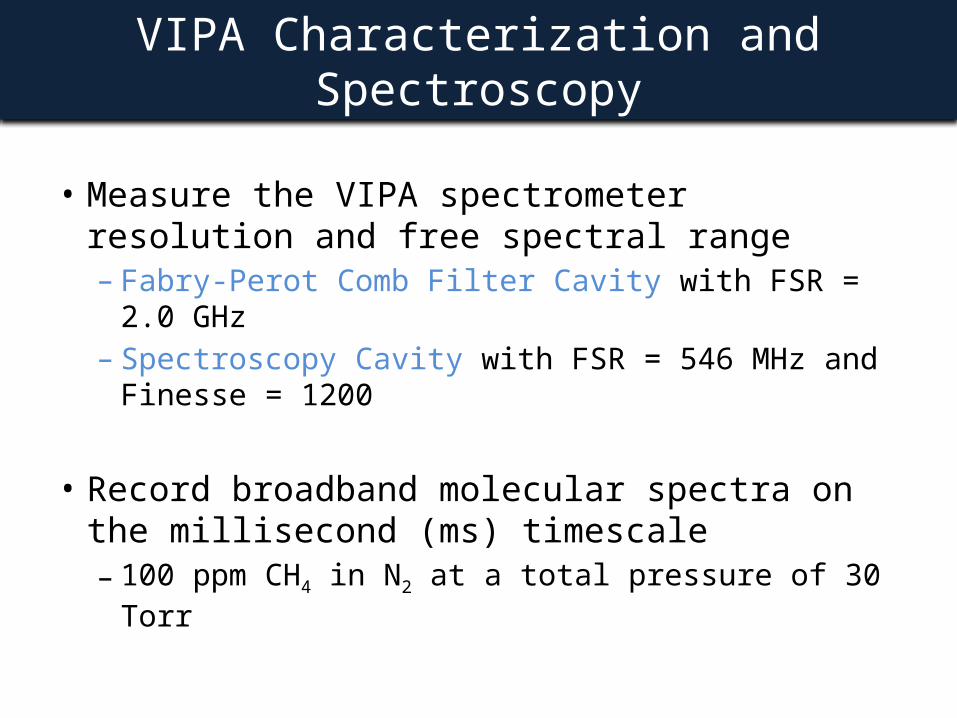
• Measure the VIPA spectrometer resolution and free spectral range– Fabry-Perot Comb Filter Cavity with FSR = 2.0 GHz– Spectroscopy Cavity with FSR = 546 MHz and
Finesse = 1200
• Record broadband molecular spectra on the millisecond (ms) timescale– 100 ppm CH4 in N2 at a total pressure of 30 Torr
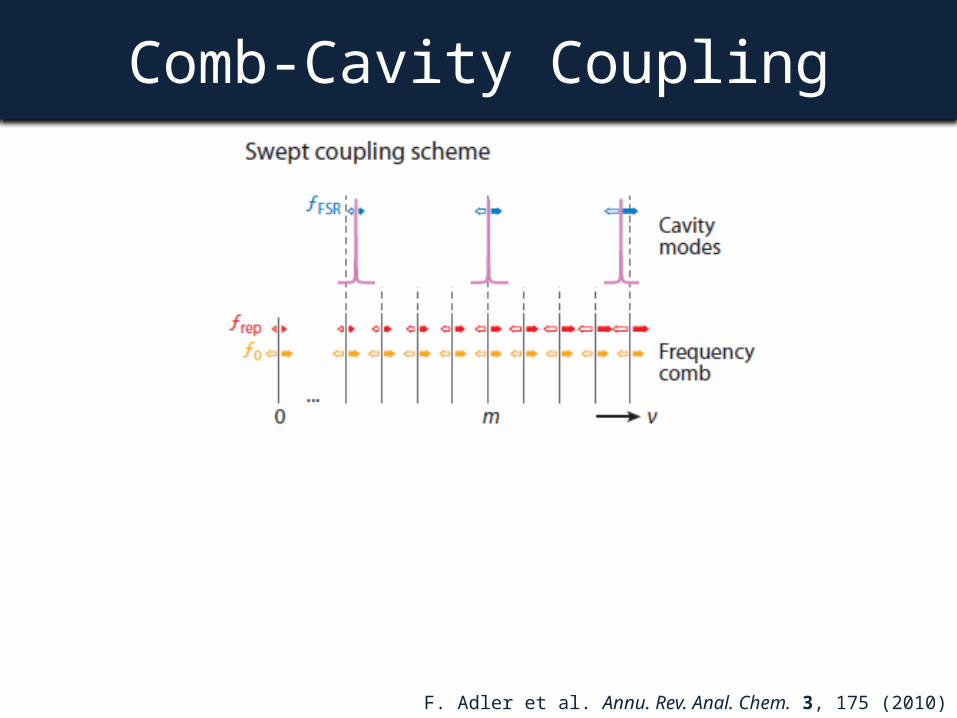
Comb-Cavity Coupling
F. Adler et al. Annu. Rev. Anal. Chem. 3, 175 (2010)
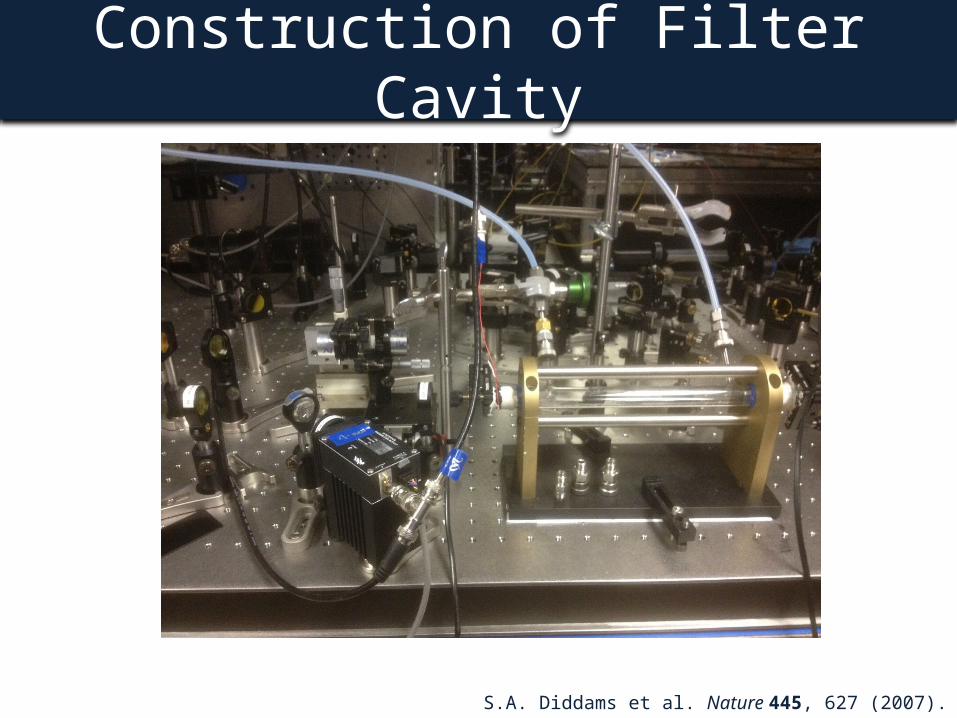
Construction of Filter Cavity
S.A. Diddams et al. Nature 445, 627 (2007).
n FSR (GHz) L (cm)
14 1.91 7.8
15 2.05 7.3
16 2.19 6.9
Exact n value must be know to precisely determine the filtered comb mode spacing required for VIPA calibration.
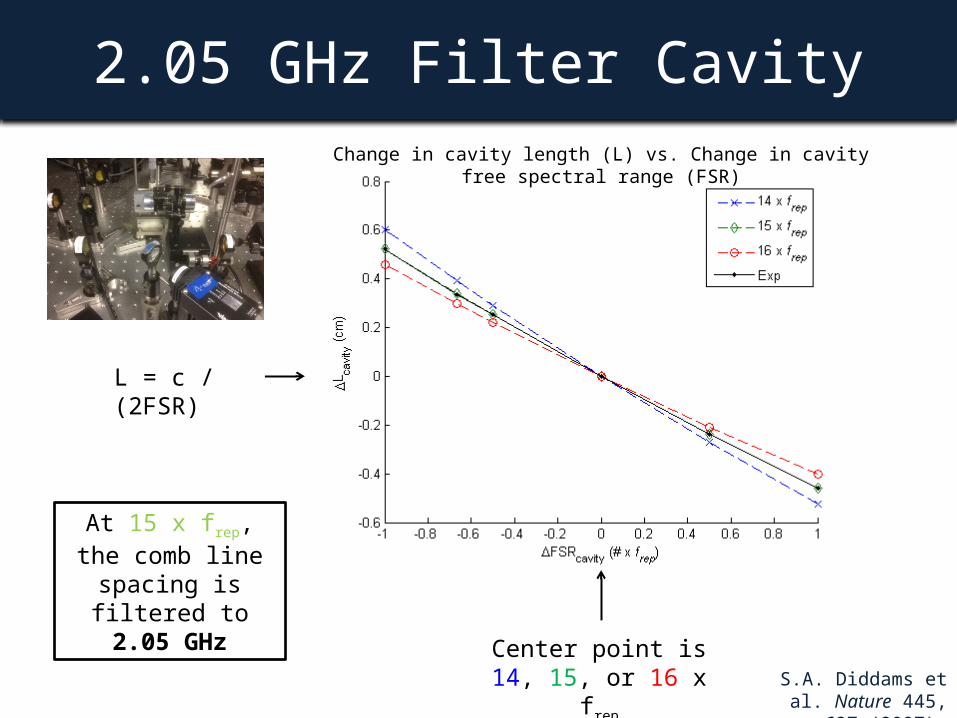
2.05 GHz Filter Cavity
S.A. Diddams et al. Nature 445, 627 (2007).
Change in cavity length (L) vs. Change in cavity free spectral range (FSR)
Center point is14, 15, or 16 x frep
L = c / (2FSR)
At 15 x frep, the comb line spacing is filtered
to 2.05 GHz
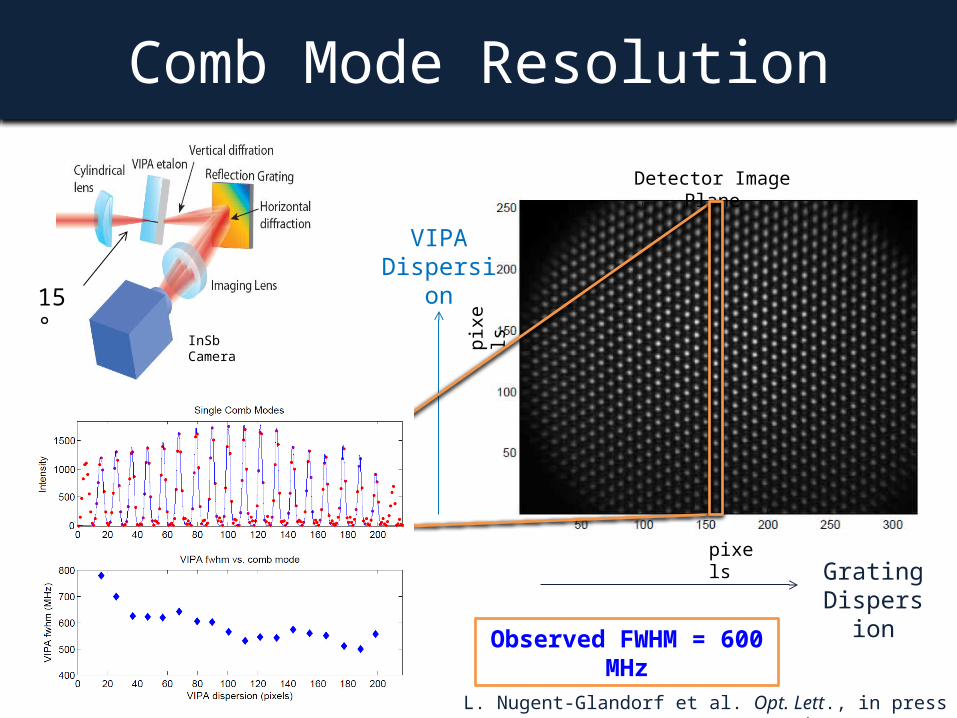
Comb Mode Resolution
L. Nugent-Glandorf et al. Opt. Lett., in press (2012). arXiv: 1206.1316
pixe
ls
pixels
Detector Image Plane
Grating Dispersion
VIPADispersion
InSb Camera
Observed FWHM = 600 MHz
15°
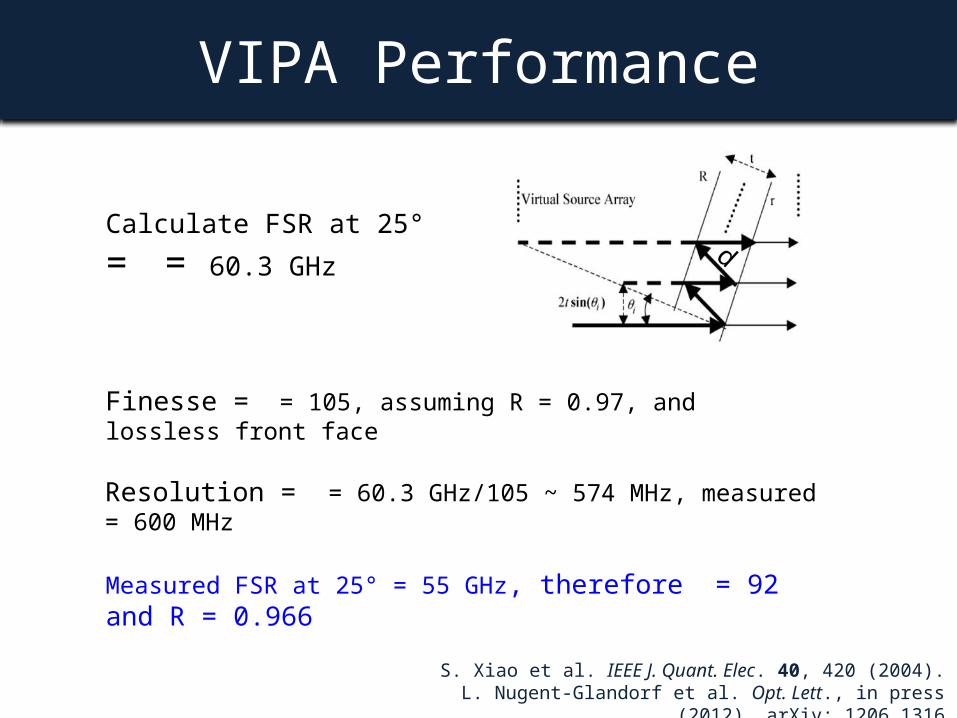
VIPA Performance
S. Xiao et al. IEEE J. Quant. Elec. 40, 420 (2004).L. Nugent-Glandorf et al. Opt. Lett., in press (2012). arXiv: 1206.1316
Measured FSR at 25° = 55 GHz, therefore = 92 and R = 0.966
Calculate FSR at 25°
= = 60.3 GHz
Finesse = = 105, assuming R = 0.97, and lossless front face
Resolution = = 60.3 GHz/105 ~ 574 MHz, measured = 600 MHz
d
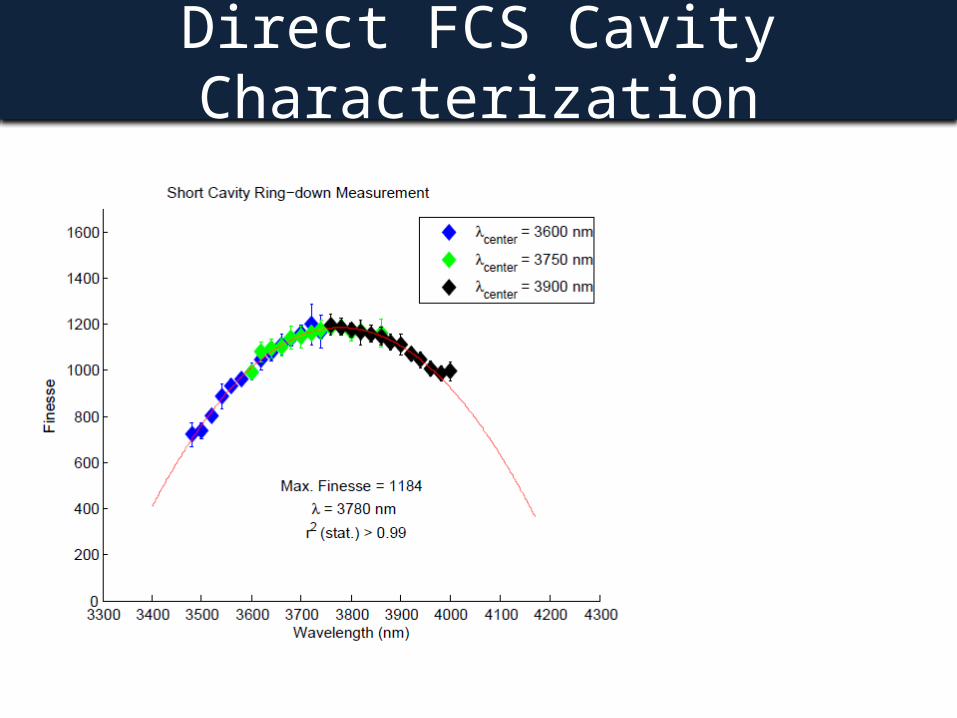
Direct FCS Cavity Characterization
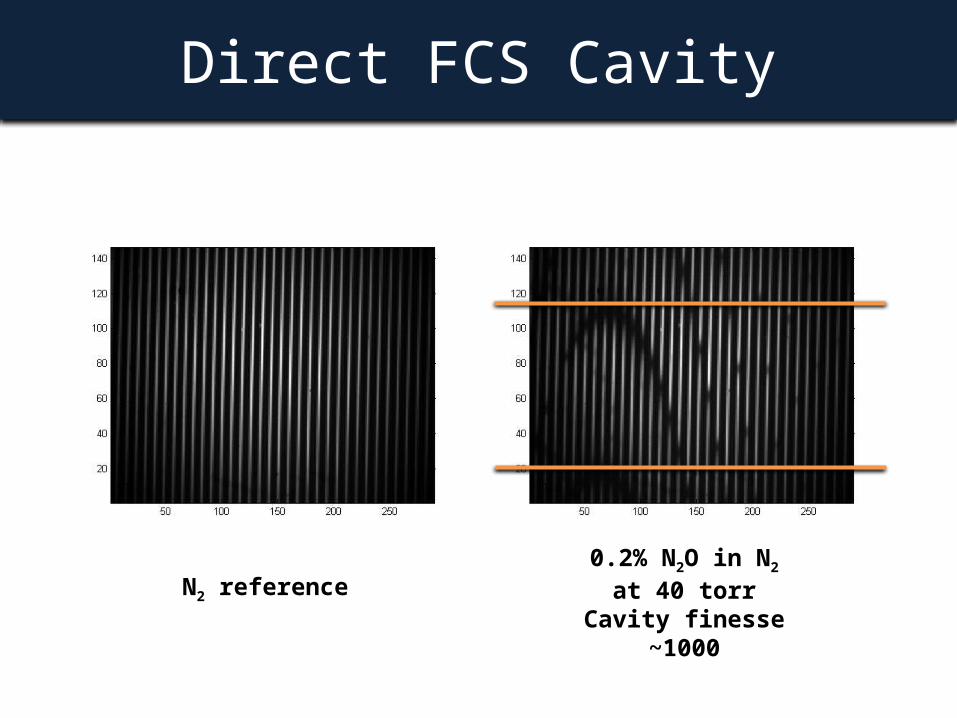
Direct FCS Cavity
N2 reference0.2% N2O in N2
at 40 torrCavity finesse ~1000
Direct FCS Cavity
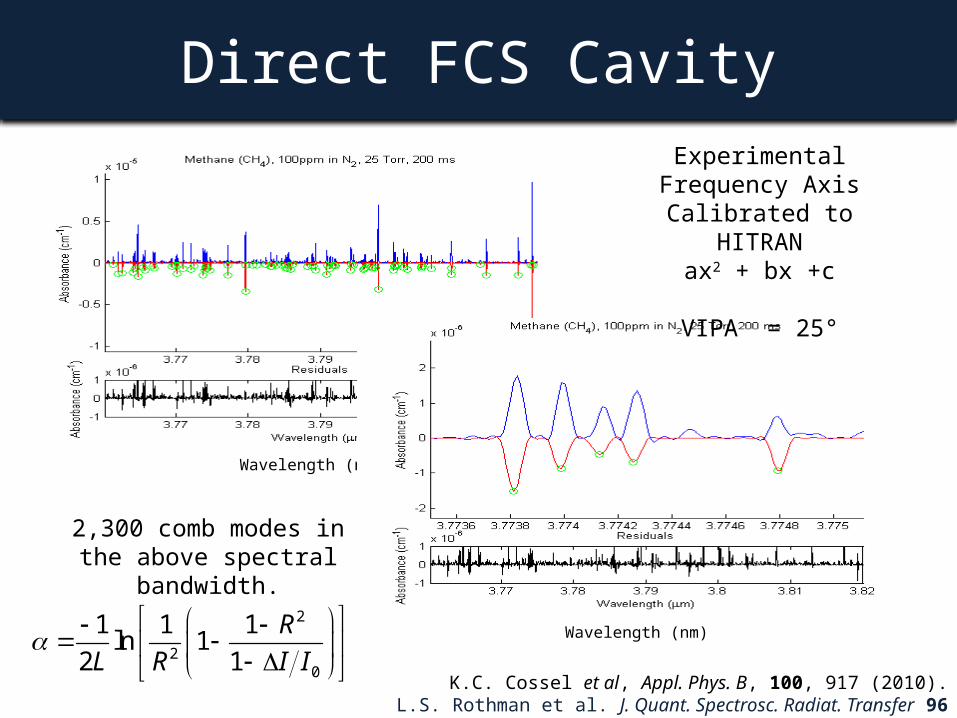
K.C. Cossel et al, Appl. Phys. B, 100, 917 (2010).L.S. Rothman et al. J. Quant. Spectrosc. Radiat. Transfer 96 139 (2005).
Wavelength (nm)
2,300 comb modes in the above spectral bandwidth.
Wavelength (nm)
Experimental Frequency Axis Calibrated to HITRAN
ax2 + bx +c
VIPA = 25°
2
20
1 1 1ln 1
2 1
R
L R I I
Molecular Gas Dynamics
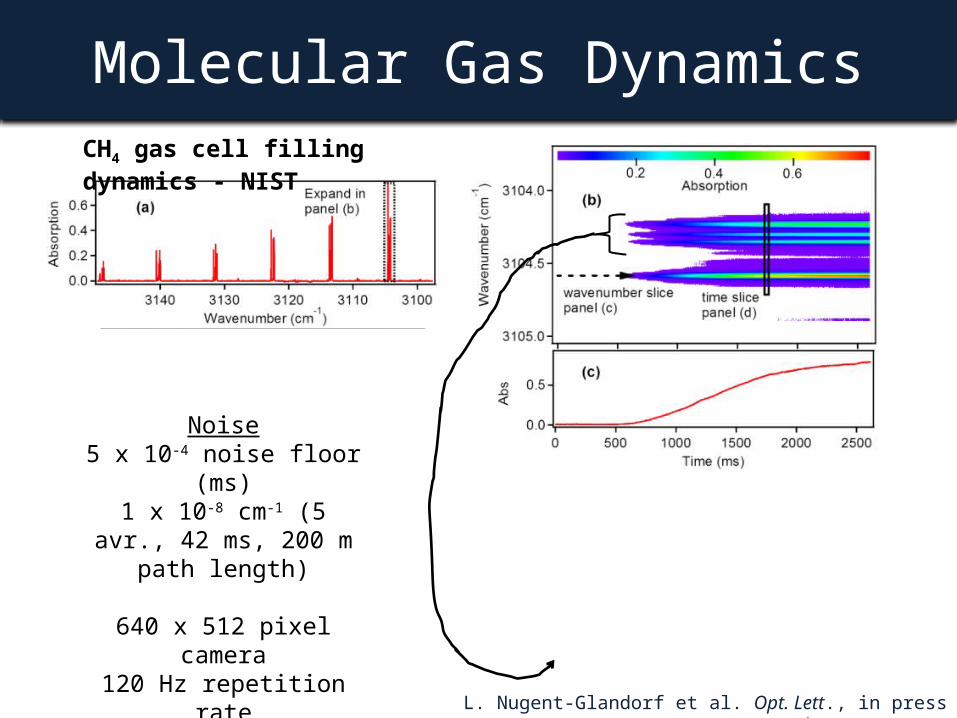
L. Nugent-Glandorf et al. Opt. Lett., in press (2012). arXiv: 1206.1316
Noise5 x 10-4 noise floor (ms)
1 x 10⁻⁸ cm-1 (5 avr., 42 ms, 200 m path length)
640 x 512 pixel camera120 Hz repetition rate
CH4 gas cell filling dynamics - NIST
Future: MIR Reaction Dynamics
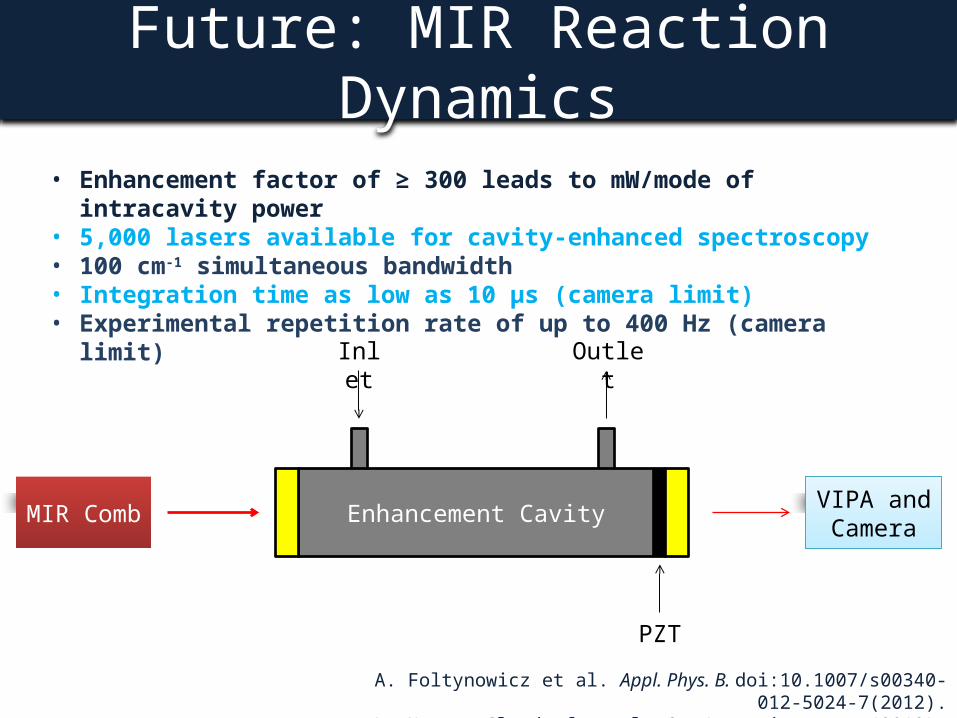
A. Foltynowicz et al. Appl. Phys. B. doi:10.1007/s00340-012-5024-7(2012).L. Nugent-Glandorf et al. Opt. Lett., in press (2012). arXiv: 1206.1316
• Enhancement factor of ≥ 300 leads to mW/mode of intracavity power• 5,000 lasers available for cavity-enhanced spectroscopy• 100 cm-1 simultaneous bandwidth• Integration time as low as 10 μs (camera limit)• Experimental repetition rate of up to 400 Hz (camera limit)
MIR Comb VIPA and Camera
Inlet
Enhancement Cavity
PZT
Outlet
AcknowledgementsBryce Bjork, Kevin C. Cossel, Jun Ye
JILA|NIST and CULora Nugent-Glandorf, Florian Adler, Tyler Neely, Scott A. Diddams
National Institute of Standards and TechnologyTim Dinneen
Precision Photonics
L. Nugent-Glandorf et al. Optics Letters (2012).
arXiv: 1206.1316
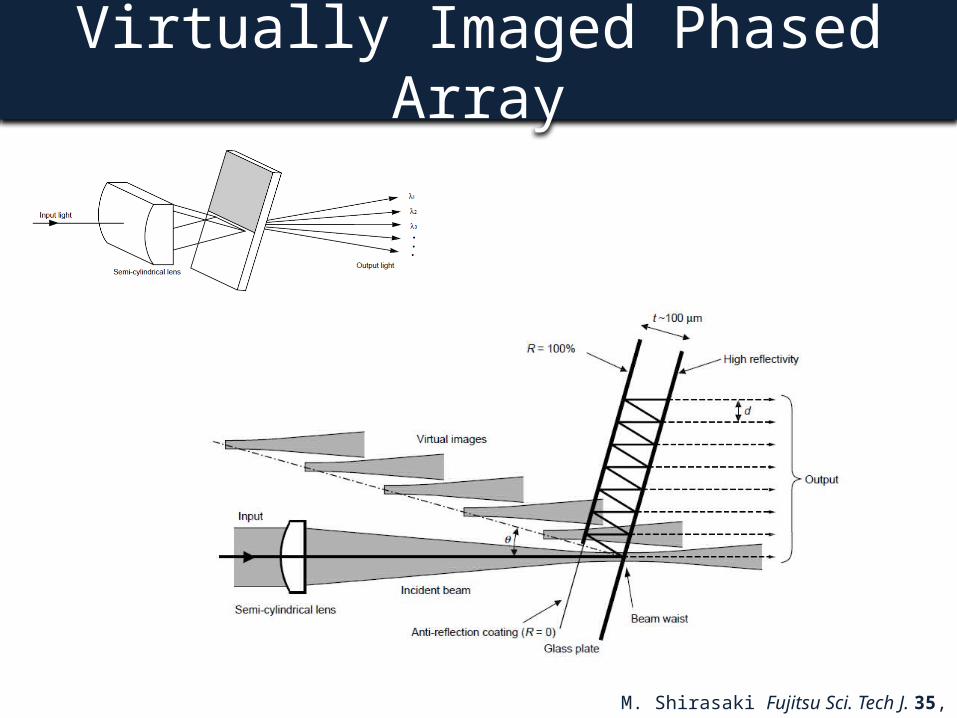
Virtually Imaged Phased Array
M. Shirasaki Fujitsu Sci. Tech J. 35, 113 (1999).
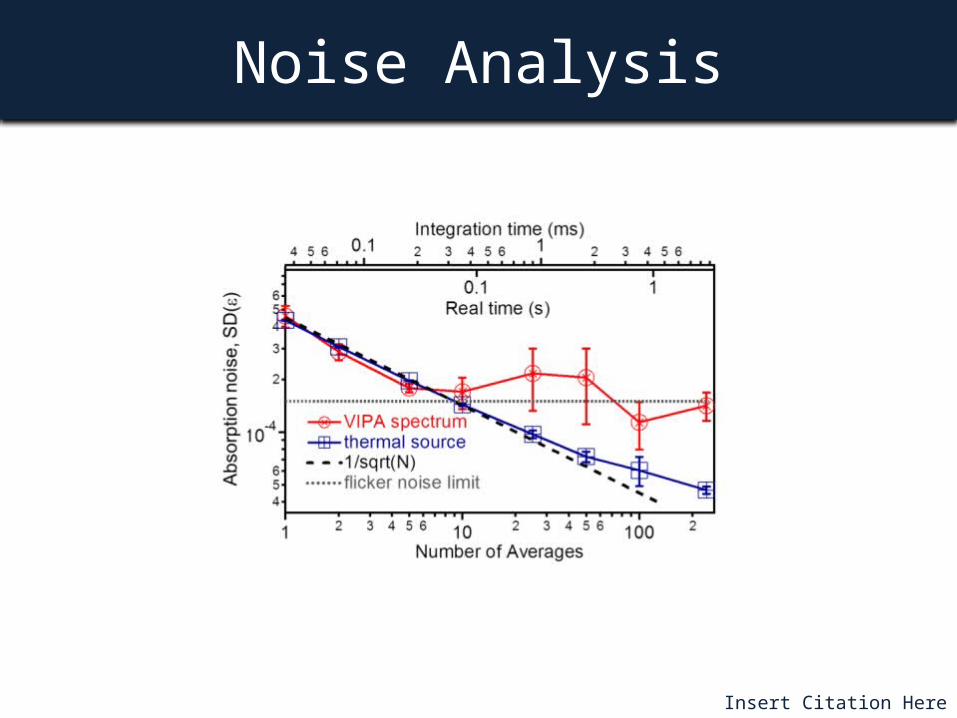
Noise Analysis
Insert Citation Here
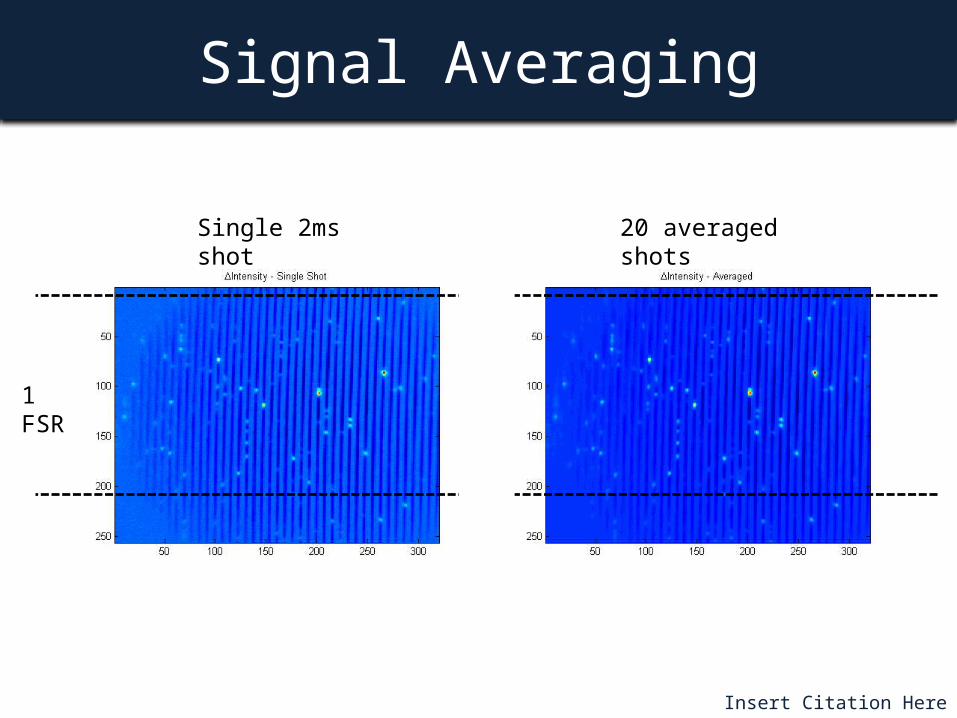
Signal Averaging
Insert Citation Here
1 FSR
Single 2ms shot 20 averaged shots
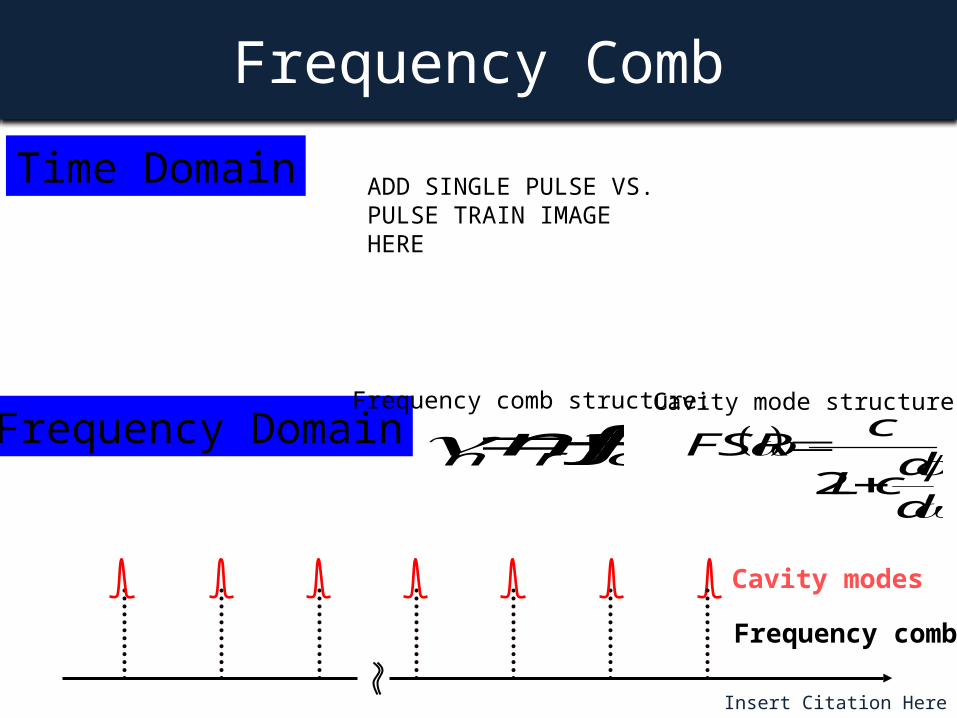
Frequency Comb
Insert Citation Here
Frequency Domain
Frequency comb
Cavity modes
ddcL
cFSR
2
Cavity mode structure:Frequency comb structure:
orn fnf
Time Domain ADD SINGLE PULSE VS. PULSE TRAIN IMAGE HERE
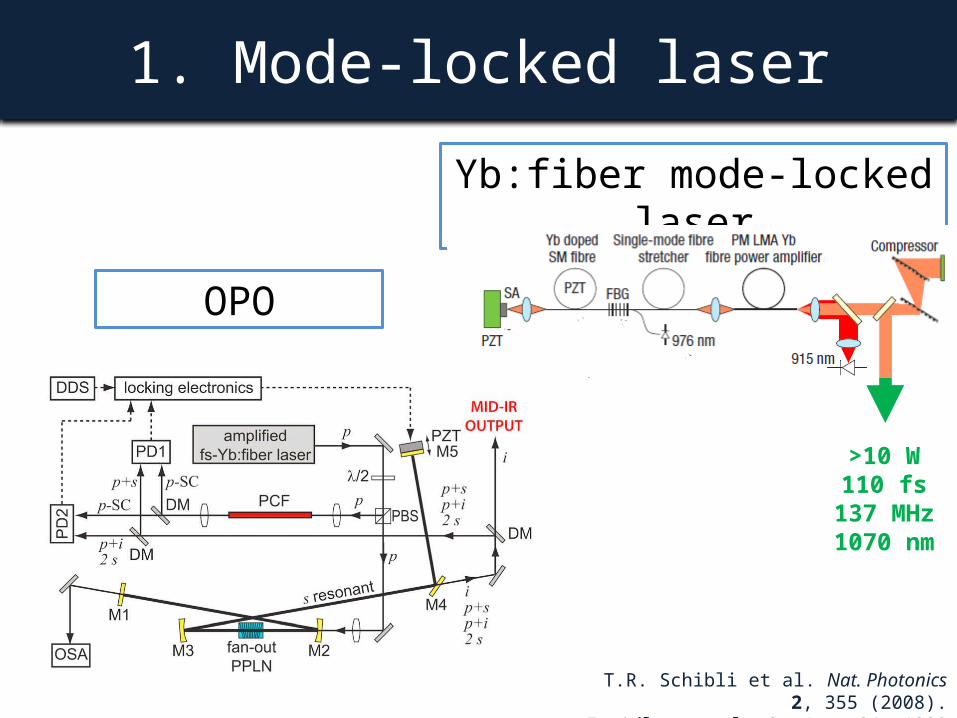
1. Mode-locked laser
T.R. Schibli et al. Nat. Photonics 2, 355 (2008).F. Adler et al. Opt. Lett. 34, 1330 (2009).
Yb:fiber mode-locked laser
>10 W110 fs
137 MHz1070 nm
OPO