Embed Size (px)
Citation preview
Direct Investment 2015

Direct Investment 2015
Volume 16

Direct Investment 2015 3
Contents
Page 1 Summary of direct investment in 2015 4
2 Swiss direct investment abroad 6 Capital transactions 6 Capital stocks 8 Investment income 10 3 Foreign direct investment in Switzerland 12 Capital transactions 12 Capital stocks 14 Investment income 17
4 Operational data on Swiss subsidiaries abroad 18
5 Operational data on foreign subsidiaries in Switzerland 20 Numberofstaff 20 Number of companies 21
6 Operational data on parent companies in Switzerland 22
Direct Investment 20154
SwiSS direct inveStment abroad
Companies domiciled in Switzerland invested CHF 100 billion abroad, compared with disinvestment of CHF 1 billion the year before. Thus, Swiss direct investment abroad was significantly above the average for the past ten years. At CHF 54 billion, over half of the investment was made by finance and holding companies (2014: CHF 3 billion). Substantial fluctuations in direct investment by this category are not unusual and can often be attributed to group reorganisation, as was also the case in the year under review. Companies in the trade category invested CHF 27 billion abroad, primarily in the form of loans to affiliated companies. Direct investment by manufacturing amounted to CHF 12 billion, which was mainly attributable to the companies concerned reinvesting profits in their subsidiaries abroad. Manufacturing also made considerable acquisitions abroad, though withdrew similar amounts from subsidiaries in the same period.
Companies in Switzerland invested CHF 77 billion in Europe. As in 2014, investment flowed into the EU holding locations of Ireland, the Netherlands and Luxembourg, but also into France. Outside Europe, Asia was the most important investment destination. Domestic companies also invested in Australia, North America and Africa. Capital was withdrawn from Central and South America, however.
Stocks of direct investment abroad increased by CHF 47 billion (4%) to CHF 1,121 billion.1 The increase arising from transactions was offset by exchange rate losses following the discontinuation of the minimum exchange rate by the Swiss National Bank (SNB). At CHF 393 billion, finance and holding companies reported the highest capital stocks abroad by far, followed by chemicals and plastics, at CHF 169 billion.
Income from direct investment abroad continued to increase – from CHF 83 billion to CHF 92 billion – driven mainly by higher income from finance and holding company subsidiaries. Investment income from subsidiaries in manufacturing attained the same level as the previous year.
1 Measured in capital stocks, Switzerland is one of the world’s largest direct investors (source: IMF, http://cdis.imf.org).
Foreign direct inveStment in Switzerland
Foreign countries invested CHF 68 billion in companies in Switzerland (2014: CHF 7 billion), CHF 44 billion of which flowed into finance and holding companies. CHF 13 billion was invested in manufacturing and the same amount in companies in the trade category. In the case of finance and holding companies and the trade category, a considerable number of transactions were related to group reorganisation, while acquisitions were of particular importance in manufacturing. Domestic investment took the form of equity capital and reinvested earnings. By contrast, foreign investors withdrew funds from subsidiary companies in Switzerland in the form of intragroup lending.
Stocks of foreign direct investment in Switzerland climbed by CHF 62 billion, or 8%, to CHF 833 billion. A breakdown by immediate investor shows that 78% of the capital stocks originate from investors in the EU and 12% from investors in the US. The breakdown by immediate investor, however, only partially shows the countries of origin for investors which control companies in Switzerland. This is due to the fact that the stocks of foreign direct investment in Switzerland are largely held via intermediate companies controlled by groups headquartered in a third country. For this reason, the SNB publishes an alternative breakdown of capital stocks by country of origin of the ultimate beneficial owner. This breakdown reveals that investors from the EU and the US controlled 42% and 37% of capital stocks respectively.
Investment income from foreign direct investment in Switzerland fell from CHF 67 billion to CHF 61 billion. The decisive factor in this decrease was the lower earnings for finance and holding companies as well as for banks.
1 Summary of direct investment in 2015
Direct Investment 2015 5
operational data on multinational companieS
In their subsidiaries abroad, Swiss companies employed a total of 2,015,000 people, of whom 853,000 (42%) were in Europe and 538,000 (27%) were in Asia. The number of people employed advanced by 51,000, or 3%, compared with the previous year. The increase in Europe is roughly in line with the average for the last ten years; it is above average in America and Africa and considerably lower in Asia.
In 2015, 457,000 people were employed by foreign-controlled companies in Switzerland, approximately 1,000 fewer than the year before. This is around 9% of all people employed in the manufacturing and services sectors in Switzerland. These employees were spread across approximately 11,600 foreign-controlled companies, corresponding to slightly more than 2% of all companies in the manufacturing and services sectors.2 A total of 73% of these companies were controlled by investors from the EU, with Germany being by far the most important country of origin (22%).
2 Sources: Structural Business Statistics (STATENT) published by the Swiss Federal Statistical Office (SFSO), Neuchâtel, and employment statistics published by the Office of Statistics, Vaduz (as at end-2014: 527,000 companies).
availability and reviSion oF data
Comprehensive tables on direct investment and operational data for multinational companies are available on the SNB’s data portal (data.snb.ch) under ‘International economic affairs’. The data can be accessed in the form of configurable tables and are currently available for 1998 to 2015. Following a one-year interruption to the series, the publication of the Direct Investment report for 2015 means that operational data for domestic parent companies as well as the number of companies with foreign majority participation are now available again. Both tables will be published on the data portal for the first time. Information on methods used is also available under ‘Notes – International economic affairs’.
The publication of the Direct Investment report for 2015 contains the usual revision of the previous year’s figures (for 2014) as well as a revision of figures from 2011 to 2013. These revisions are usually as a result of relevant data on business transactions or group structures concerning the respondent companies only becoming available after the previous year’s report has gone to press. Of the revisions made to the 2014 figures, capital stocks in finance and holding companies (both investment directions) as well as the other manufacturing and construction category (foreign) and trade category (domestic) were the most affected.
Table 1
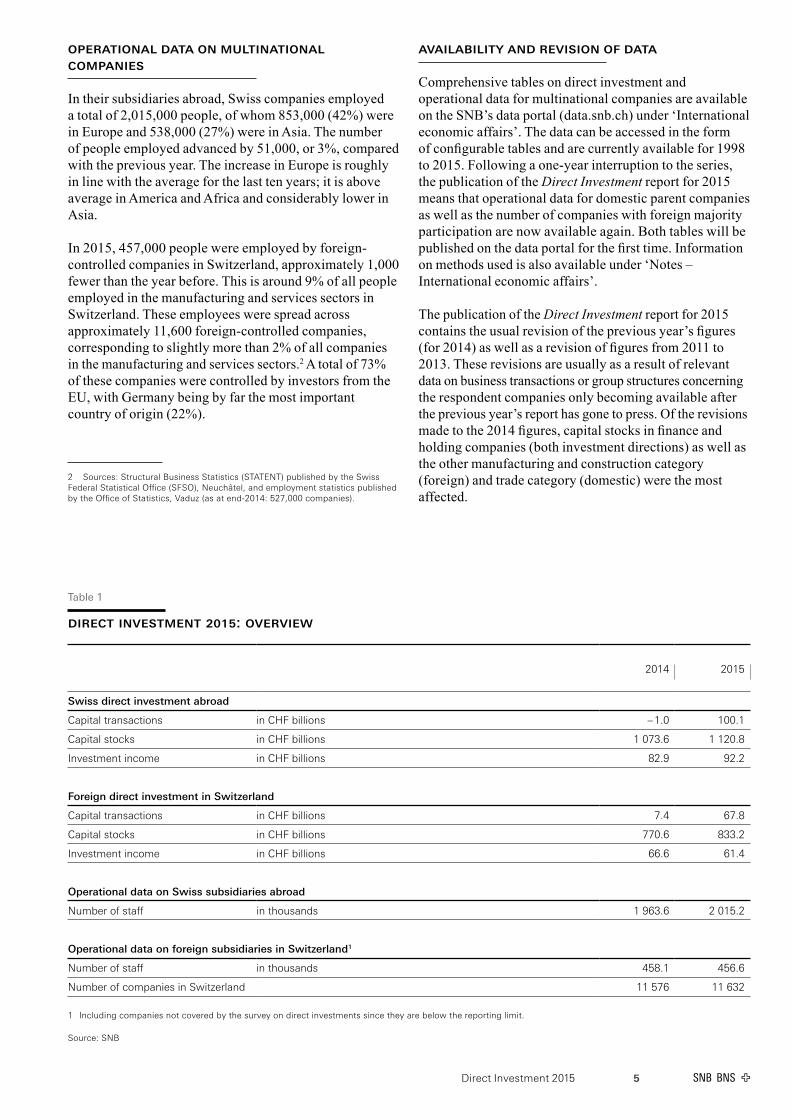
direct inveStment 2015: overview
2014 2015
Swiss direct investment abroad
Capital transactions in CHF billions – 1.0 100.1
Capital stocks in CHF billions 1 073.6 1 120.8
Investment income in CHF billions 82.9 92.2
Foreign direct investment in Switzerland
Capital transactions in CHF billions 7.4 67.8
Capital stocks in CHF billions 770.6 833.2
Investment income in CHF billions 66.6 61.4
Operational data on Swiss subsidiaries abroad
Number of staff in thousands 1 963.6 2 015.2
Operational data on foreign subsidiaries in Switzerland1
Number of staff in thousands 458.1 456.6
Number of companies in Switzerland 11 576 11 632
1 Including companies not covered by the survey on direct investments since they are below the reporting limit.
Source: SNB
Direct Investment 20156
capital tranSactionS
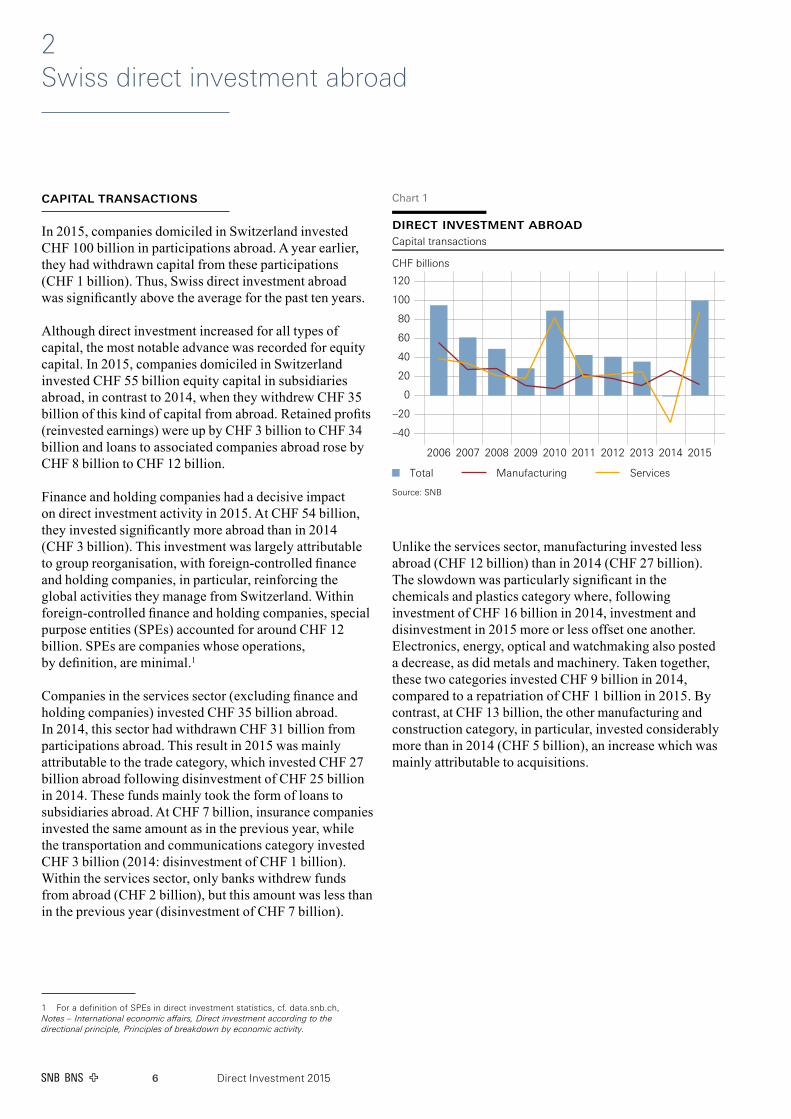
In 2015, companies domiciled in Switzerland invested CHF 100 billion in participations abroad. A year earlier, they had withdrawn capital from these participations (CHF 1 billion). Thus, Swiss direct investment abroad was significantly above the average for the past ten years.
Although direct investment increased for all types of capital, the most notable advance was recorded for equity capital. In 2015, companies domiciled in Switzerland invested CHF 55 billion equity capital in subsidiaries abroad, in contrast to 2014, when they withdrew CHF 35 billion of this kind of capital from abroad. Retained profits (reinvested earnings) were up by CHF 3 billion to CHF 34 billion and loans to associated companies abroad rose by CHF 8 billion to CHF 12 billion.
Finance and holding companies had a decisive impact on direct investment activity in 2015. At CHF 54 billion, they invested significantly more abroad than in 2014 (CHF 3 billion). This investment was largely attributable to group reorganisation, with foreign-controlled finance and holding companies, in particular, reinforcing the global activities they manage from Switzerland. Within foreign-controlled finance and holding companies, special purpose entities (SPEs) accounted for around CHF 12 billion. SPEs are companies whose operations, by definition, are minimal.1
Companies in the services sector (excluding finance and holding companies) invested CHF 35 billion abroad. In 2014, this sector had withdrawn CHF 31 billion from participations abroad. This result in 2015 was mainly attributable to the trade category, which invested CHF 27 billion abroad following disinvestment of CHF 25 billion in 2014. These funds mainly took the form of loans to subsidiaries abroad. At CHF 7 billion, insurance companies invested the same amount as in the previous year, while the transportation and communications category invested CHF 3 billion (2014: disinvestment of CHF 1 billion). Within the services sector, only banks withdrew funds from abroad (CHF 2 billion), but this amount was less than in the previous year (disinvestment of CHF 7 billion).
1 For a definition of SPEs in direct investment statistics, cf. data.snb.ch, Notes – International economic affairs, Direct investment according to the directional principle, Principles of breakdown by economic activity.
Unlike the services sector, manufacturing invested less abroad (CHF 12 billion) than in 2014 (CHF 27 billion). The slowdown was particularly significant in the chemicals and plastics category where, following investment of CHF 16 billion in 2014, investment and disinvestment in 2015 more or less offset one another. Electronics, energy, optical and watchmaking also posted a decrease, as did metals and machinery. Taken together, these two categories invested CHF 9 billion in 2014, compared to a repatriation of CHF 1 billion in 2015. By contrast, at CHF 13 billion, the other manufacturing and construction category, in particular, invested considerably more than in 2014 (CHF 5 billion), an increase which was mainly attributable to acquisitions.
2 Swiss direct investment abroad
Chart 1
direct investment abroadCapital transactions
CHF billions
–40
–20
0
20
40
60
80
100
120
2006 2007 2008 2009 2010 2011 2012 2013 2014 2015
Total Manufacturing Services
Source: SNB
Direct Investment 2015 7
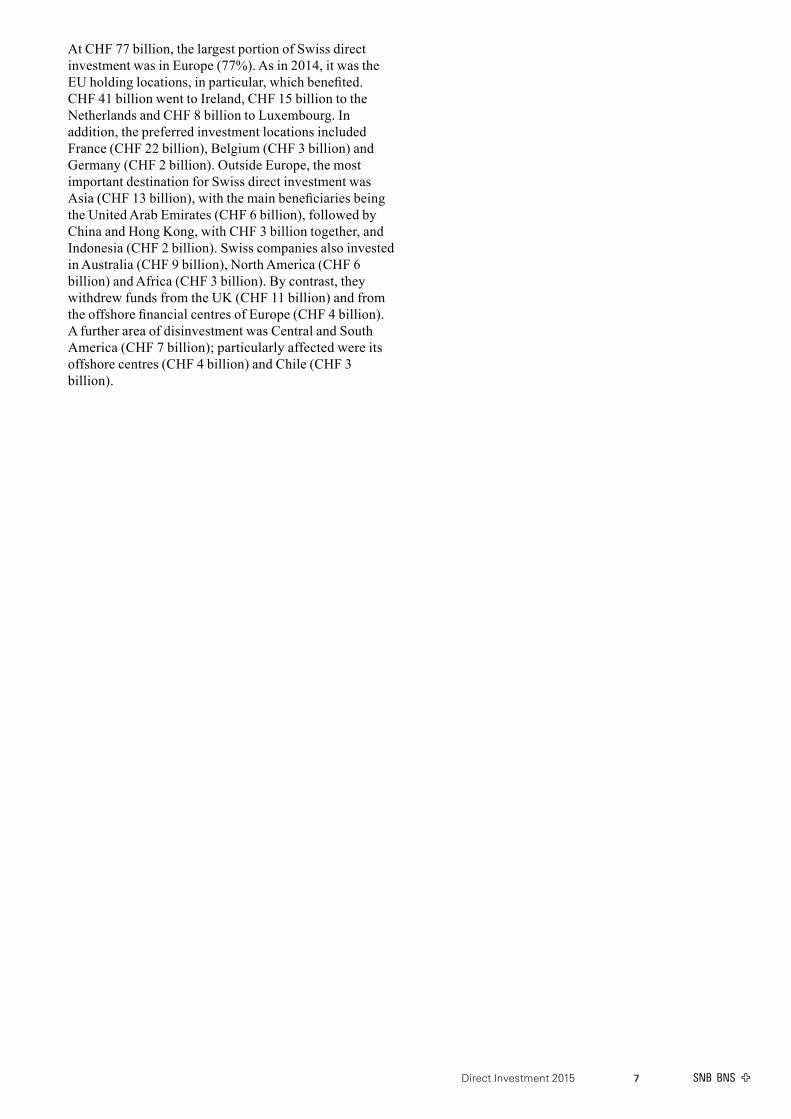
At CHF 77 billion, the largest portion of Swiss direct investment was in Europe (77%). As in 2014, it was the EU holding locations, in particular, which benefited. CHF 41 billion went to Ireland, CHF 15 billion to the Netherlands and CHF 8 billion to Luxembourg. In addition, the preferred investment locations included France (CHF 22 billion), Belgium (CHF 3 billion) and Germany (CHF 2 billion). Outside Europe, the most important destination for Swiss direct investment was Asia (CHF 13 billion), with the main beneficiaries being the United Arab Emirates (CHF 6 billion), followed by China and Hong Kong, with CHF 3 billion together, and Indonesia (CHF 2 billion). Swiss companies also invested in Australia (CHF 9 billion), North America (CHF 6 billion) and Africa (CHF 3 billion). By contrast, they withdrew funds from the UK (CHF 11 billion) and from the offshore financial centres of Europe (CHF 4 billion). A further area of disinvestment was Central and South America (CHF 7 billion); particularly affected were its offshore centres (CHF 4 billion) and Chile (CHF 3 billion).
Direct Investment 20158
capital StockS
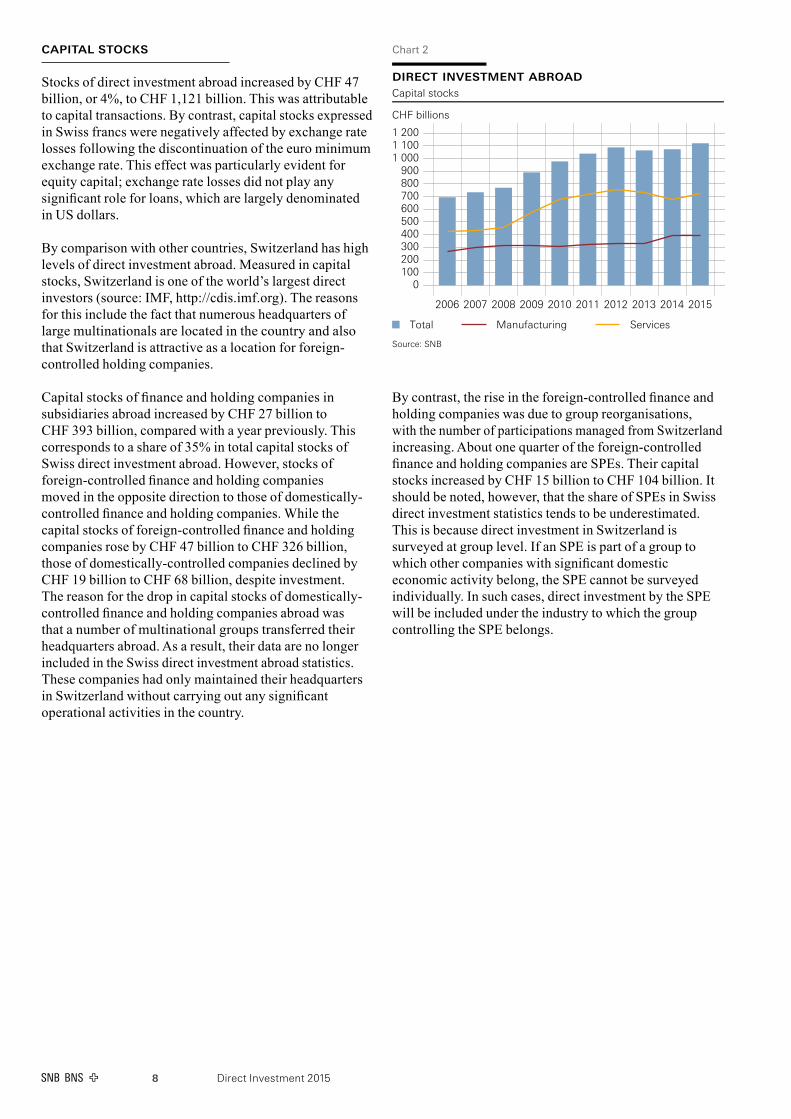
Stocks of direct investment abroad increased by CHF 47 billion, or 4%, to CHF 1,121 billion. This was attributable to capital transactions. By contrast, capital stocks expressed in Swiss francs were negatively affected by exchange rate losses following the discontinuation of the euro minimum exchange rate. This effect was particularly evident for equity capital; exchange rate losses did not play any significant role for loans, which are largely denominated in US dollars.
By comparison with other countries, Switzerland has high levels of direct investment abroad. Measured in capital stocks, Switzerland is one of the world’s largest direct investors (source: IMF, http://cdis.imf.org). The reasons for this include the fact that numerous headquarters of large multinationals are located in the country and also that Switzerland is attractive as a location for foreign-controlled holding companies.
Capital stocks of finance and holding companies in subsidiaries abroad increased by CHF 27 billion to CHF 393 billion, compared with a year previously. This corresponds to a share of 35% in total capital stocks of Swiss direct investment abroad. However, stocks of foreign-controlled finance and holding companies moved in the opposite direction to those of domestically-controlled finance and holding companies. While the capital stocks of foreign-controlled finance and holding companies rose by CHF 47 billion to CHF 326 billion, those of domestically-controlled companies declined by CHF 19 billion to CHF 68 billion, despite investment. The reason for the drop in capital stocks of domestically-controlled finance and holding companies abroad was that a number of multinational groups transferred their headquarters abroad. As a result, their data are no longer included in the Swiss direct investment abroad statistics. These companies had only maintained their headquarters in Switzerland without carrying out any significant operational activities in the country.
By contrast, the rise in the foreign-controlled finance and holding companies was due to group reorganisations, with the number of participations managed from Switzerland increasing. About one quarter of the foreign-controlled finance and holding companies are SPEs. Their capital stocks increased by CHF 15 billion to CHF 104 billion. It should be noted, however, that the share of SPEs in Swiss direct investment statistics tends to be underestimated. This is because direct investment in Switzerland is surveyed at group level. If an SPE is part of a group to which other companies with significant domestic economic activity belong, the SPE cannot be surveyed individually. In such cases, direct investment by the SPE will be included under the industry to which the group controlling the SPE belongs.
direct investment abroadCapital stocks
CHF billions
0100200300400500600700800900
1 0001 1001 200
2006 2007 2008 2009 2010 2011 2012 2013 2014 2015
Total Manufacturing Services
Source: SNB
Chart 2
Direct Investment 2015 9
Capital stocks in manufacturing abroad totalled CHF 395 billion, as in 2014. At an unchanged level of CHF 169 billion, the chemicals and plastics category once again recorded the highest capital stocks within this sector. By contrast, capital stocks for the services sector, excluding finance and holding companies, rose by CHF 19 billion to CHF 332 billion. The decisive factor in this increase was the trade category, which once again showed the strongest growth within the services sector (up CHF 19 billion to CHF 130 billion). Over the course of the past ten years, the share of the trade category in services sector capital stocks abroad has risen from 10% to almost 40%. In the same period, the share of banks and insurance companies has declined from 80% to below 50%. This trend continued in 2015, when capital stocks abroad of banks were down by CHF 4 billion to CHF 81 billion, despite those of insurance companies increasing by CHF 3 billion to CHF 75 billion.
From a geographical point of view, subsidiaries in Europe recorded by far the biggest growth in capital stocks, advancing by CHF 63 billion to CHF 572 billion. At the same time, Europe’s share in capital stocks rose from 48% to 52%. This was mainly due to the holding locations, with capital stocks in Luxembourg up by CHF 11 billion to CHF 137 billion, and those in the Netherlands up by the same amount, to CHF 122 billion. However, capital stocks in Ireland increased even more sharply, by CHF 42 billion to CHF 71 billion, thereby exceeding those in the UK for the first time, where capital stocks decreased by CHF 10 billion to CHF 51 billion. Furthermore, capital stocks in France rose significantly, by CHF 13 billion to CHF 47 billion, while increases were also recorded in Germany and Belgium, both by CHF 2 billion to CHF 38 billion and CHF 15 billion respecitvely. By contrast, capital stocks of Swiss subsidiaries in most of the other countries of Europe stagnated or even declined slightly.
Outside Europe, capital stocks advanced most sharply in North America, by CHF 18 billion to CHF 247 billion. In Asia, they were up by CHF 7 billion to CHF 114 billion. The United Arab Emirates accounted for a major part of this growth with capital stocks growing by CHF 6 billion to CHF 26 billion, thereby exceeding even those in China. Finally, capital stocks increased by CHF 3 billion to CHF 14 billion in Africa, and by CHF 2 billion to CHF 18 billion in Oceania. Thus Central and South America was the only region with lower capital stocks. The relatively sharp decline by CHF 44 billion to CHF 150 billion was attributable to multinational groups which transferred their domicile away from Switzerland to another country. This means that their participations are no longer included in the Swiss direct investment statistics.
Direct Investment 201510
inveStment income
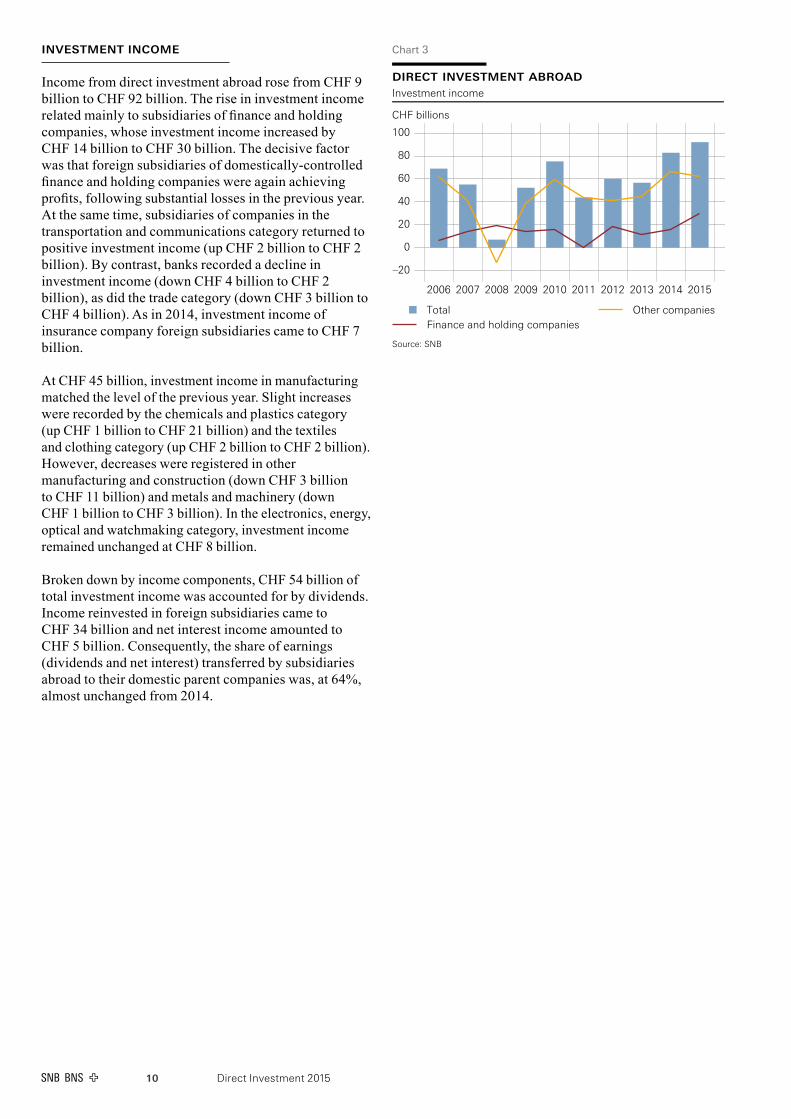
Income from direct investment abroad rose from CHF 9 billion to CHF 92 billion. The rise in investment income related mainly to subsidiaries of finance and holding companies, whose investment income increased by CHF 14 billion to CHF 30 billion. The decisive factor was that foreign subsidiaries of domestically-controlled finance and holding companies were again achieving profits, following substantial losses in the previous year. At the same time, subsidiaries of companies in the transportation and communications category returned to positive investment income (up CHF 2 billion to CHF 2 billion). By contrast, banks recorded a decline in investment income (down CHF 4 billion to CHF 2 billion), as did the trade category (down CHF 3 billion to CHF 4 billion). As in 2014, investment income of insurance company foreign subsidiaries came to CHF 7 billion.
At CHF 45 billion, investment income in manufacturing matched the level of the previous year. Slight increases were recorded by the chemicals and plastics category (up CHF 1 billion to CHF 21 billion) and the textiles and clothing category (up CHF 2 billion to CHF 2 billion). However, decreases were registered in other manufacturing and construction (down CHF 3 billion to CHF 11 billion) and metals and machinery (down CHF 1 billion to CHF 3 billion). In the electronics, energy, optical and watchmaking category, investment income remained unchanged at CHF 8 billion.
Broken down by income components, CHF 54 billion of total investment income was accounted for by dividends. Income reinvested in foreign subsidiaries came to CHF 34 billion and net interest income amounted to CHF 5 billion. Consequently, the share of earnings (dividends and net interest) transferred by subsidiaries abroad to their domestic parent companies was, at 64%, almost unchanged from 2014.
Chart 3
direct investment abroadInvestment income
CHF billions
–20
0
20
40
60
80
100
2006 2007 2008 2009 2010 2011 2012 2013 2014 2015
TotalFinance and holding companies
Other companies
Source: SNB

Direct Investment 201512
3 Foreign direct investment in Switzerland
capital tranSactionS
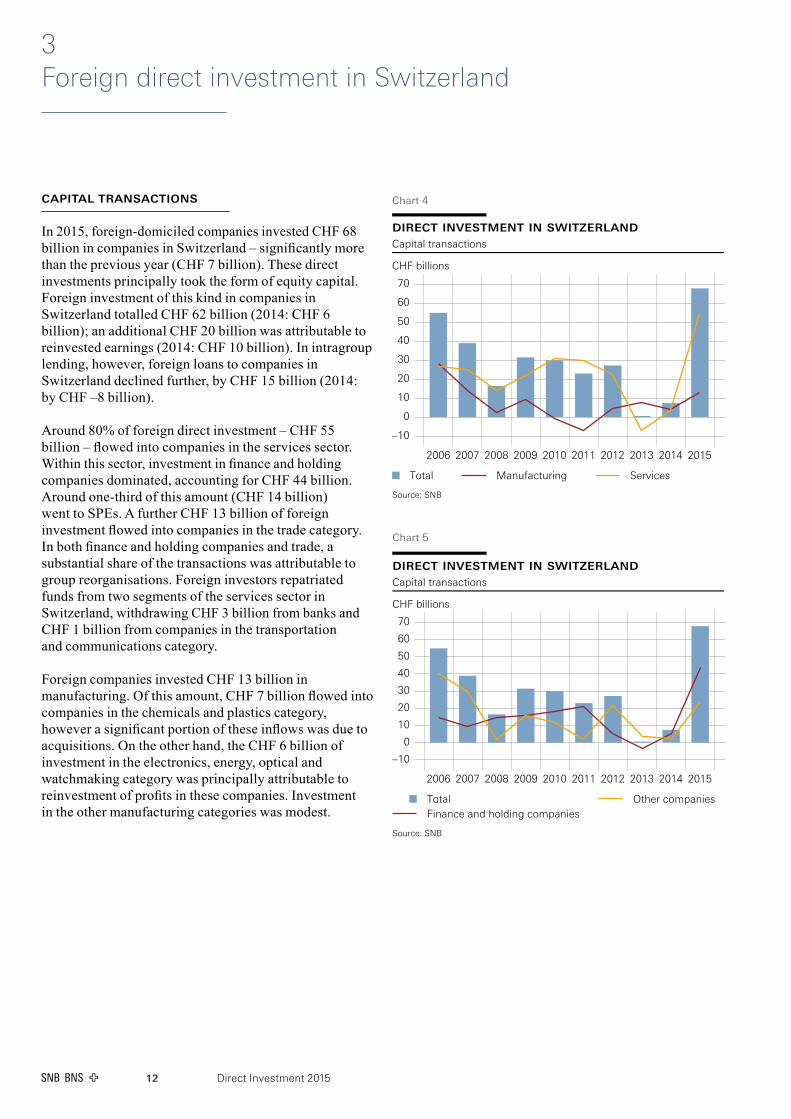
In 2015, foreign-domiciled companies invested CHF 68 billion in companies in Switzerland – significantly more than the previous year (CHF 7 billion). These direct investments principally took the form of equity capital. Foreign investment of this kind in companies in Switzerland totalled CHF 62 billion (2014: CHF 6 billion); an additional CHF 20 billion was attributable to reinvested earnings (2014: CHF 10 billion). In intragroup lending, however, foreign loans to companies in Switzerland declined further, by CHF 15 billion (2014: by CHF –8 billion).
Around 80% of foreign direct investment – CHF 55 billion – flowed into companies in the services sector. Within this sector, investment in finance and holding companies dominated, accounting for CHF 44 billion. Around one-third of this amount (CHF 14 billion) went to SPEs. A further CHF 13 billion of foreign investment flowed into companies in the trade category. In both finance and holding companies and trade, a substantial share of the transactions was attributable to group reorganisations. Foreign investors repatriated funds from two segments of the services sector in Switzerland, withdrawing CHF 3 billion from banks and CHF 1 billion from companies in the transportation and communications category.
Foreign companies invested CHF 13 billion in manufacturing. Of this amount, CHF 7 billion flowed into companies in the chemicals and plastics category, however a significant portion of these inflows was due to acquisitions. On the other hand, the CHF 6 billion of investment in the electronics, energy, optical and watchmaking category was principally attributable to reinvestment of profits in these companies. Investment in the other manufacturing categories was modest.
Chart 4
direct investment in switzerlandCapital transactions
CHF billions
–10
0
10
20
30
40
50
60
70
2006 2007 2008 2009 2010 2011 2012 2013 2014 2015
Total Manufacturing Services
Source: SNB
Chart 5
direct investment in switzerlandCapital transactions
CHF billions
–10
0
10
20
30
40
50
60
70
2006 2007 2008 2009 2010 2011 2012 2013 2014 2015
TotalFinance and holding companies
Other companies
Source: SNB
Direct Investment 2015 13
The bulk of the investment, CHF 51 billion, originated in Europe, with more than half of the total coming from investors in the holding locations of Luxembourg (CHF 14 billion), the Netherlands (CHF 9 billion) and Austria (CHF 4 billion). These were followed by the UK, which was the single largest European investor in Switzerland (CHF 14 billion). Other investment originated from companies in Sweden and Belgium (CHF 2 billion each) as well as Germany and France (CHF 1 billion each). By contrast, investors from Denmark and European countries outside the EU withdrew CHF 3 billion and CHF 4 billion respectively, from companies in Switzerland. Thus, 2015 is the fourth consecutive year in which the non-EU countries have repatriated funds from Switzerland.
Of the non-European investment, the contribution of companies in Central and South America, totalling CHF 20 billion, was particularly important. However, these investments came almost exclusively from offshore financial centres and were mainly attributable to group reorganisations. Investors from North America effected numerous capital transactions with their subsidiaries in Switzerland, however inflows and outflows largely balanced out. Investors from Asia, Africa and Oceania, on the other hand, repatriated CHF 5 billion from companies in Switzerland.
Direct Investment 201514
capital StockS
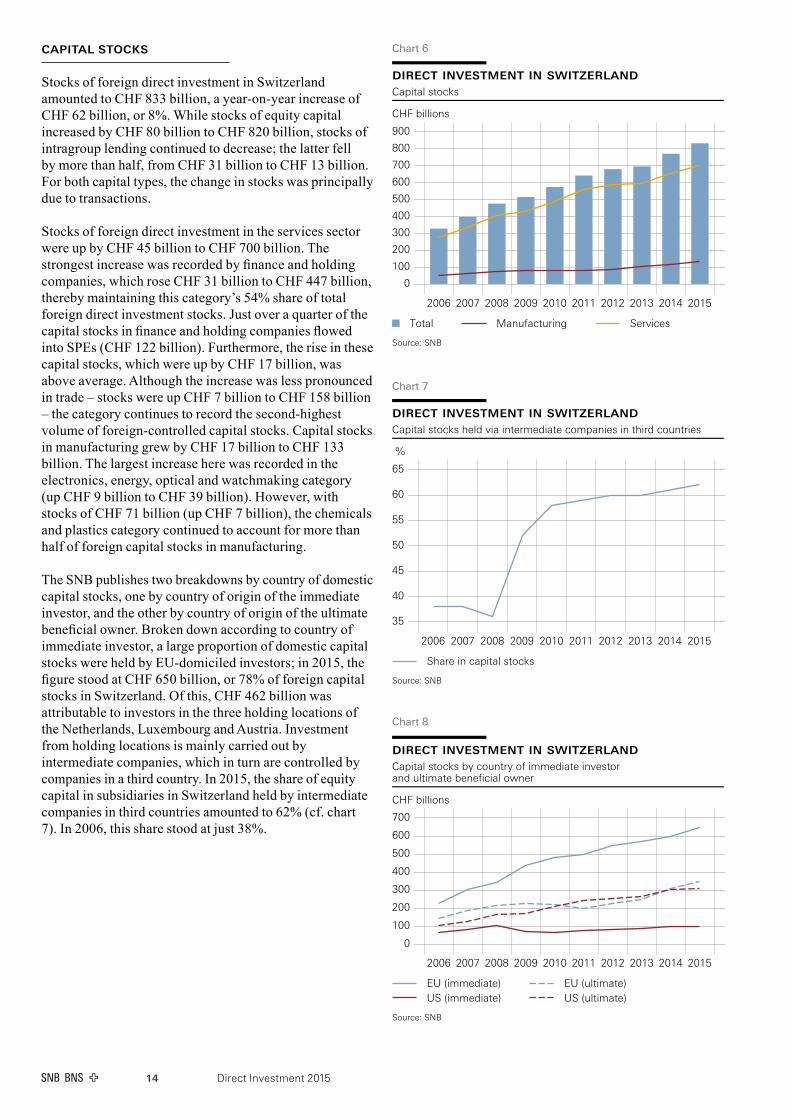
Stocks of foreign direct investment in Switzerland amounted to CHF 833 billion, a year-on-year increase of CHF 62 billion, or 8%. While stocks of equity capital increased by CHF 80 billion to CHF 820 billion, stocks of intragroup lending continued to decrease; the latter fell by more than half, from CHF 31 billion to CHF 13 billion. For both capital types, the change in stocks was principally due to transactions.
Stocks of foreign direct investment in the services sector were up by CHF 45 billion to CHF 700 billion. The strongest increase was recorded by finance and holding companies, which rose CHF 31 billion to CHF 447 billion, thereby maintaining this category’s 54% share of total foreign direct investment stocks. Just over a quarter of the capital stocks in finance and holding companies flowed into SPEs (CHF 122 billion). Furthermore, the rise in these capital stocks, which were up by CHF 17 billion, was above average. Although the increase was less pronounced in trade – stocks were up CHF 7 billion to CHF 158 billion – the category continues to record the second-highest volume of foreign-controlled capital stocks. Capital stocks in manufacturing grew by CHF 17 billion to CHF 133 billion. The largest increase here was recorded in the electronics, energy, optical and watchmaking category (up CHF 9 billion to CHF 39 billion). However, with stocks of CHF 71 billion (up CHF 7 billion), the chemicals and plastics category continued to account for more than half of foreign capital stocks in manufacturing.
The SNB publishes two breakdowns by country of domestic capital stocks, one by country of origin of the immediate investor, and the other by country of origin of the ultimate beneficial owner. Broken down according to country of immediate investor, a large proportion of domestic capital stocks were held by EU-domiciled investors; in 2015, the figure stood at CHF 650 billion, or 78% of foreign capital stocks in Switzerland. Of this, CHF 462 billion was attributable to investors in the three holding locations of the Netherlands, Luxembourg and Austria. Investment from holding locations is mainly carried out by intermediate companies, which in turn are controlled by companies in a third country. In 2015, the share of equity capital in subsidiaries in Switzerland held by intermediate companies in third countries amounted to 62% (cf. chart 7). In 2006, this share stood at just 38%.
Chart 8
direct investment in switzerlandCapital stocks by country of immediate investorand ultimate beneficial owner
CHF billions
0
100
200
300
400
500
600
700
2006 2007 2008 2009 2010 2011 2012 2013 2014 2015
EU (immediate)US (immediate)
EU (ultimate)US (ultimate)
Source: SNB
Chart 6
direct investment in switzerlandCapital stocks
CHF billions
0
100
200
300
400
500
600
700
800
900
2006 2007 2008 2009 2010 2011 2012 2013 2014 2015
Total Manufacturing Services
Source: SNB
Chart 7
direct investment in switzerlandCapital stocks held via intermediate companies in third countries
%
35
40
45
50
55
60
65
2006 2007 2008 2009 2010 2011 2012 2013 2014 2015
Share in capital stocks
Source: SNB
Direct Investment 2015 15
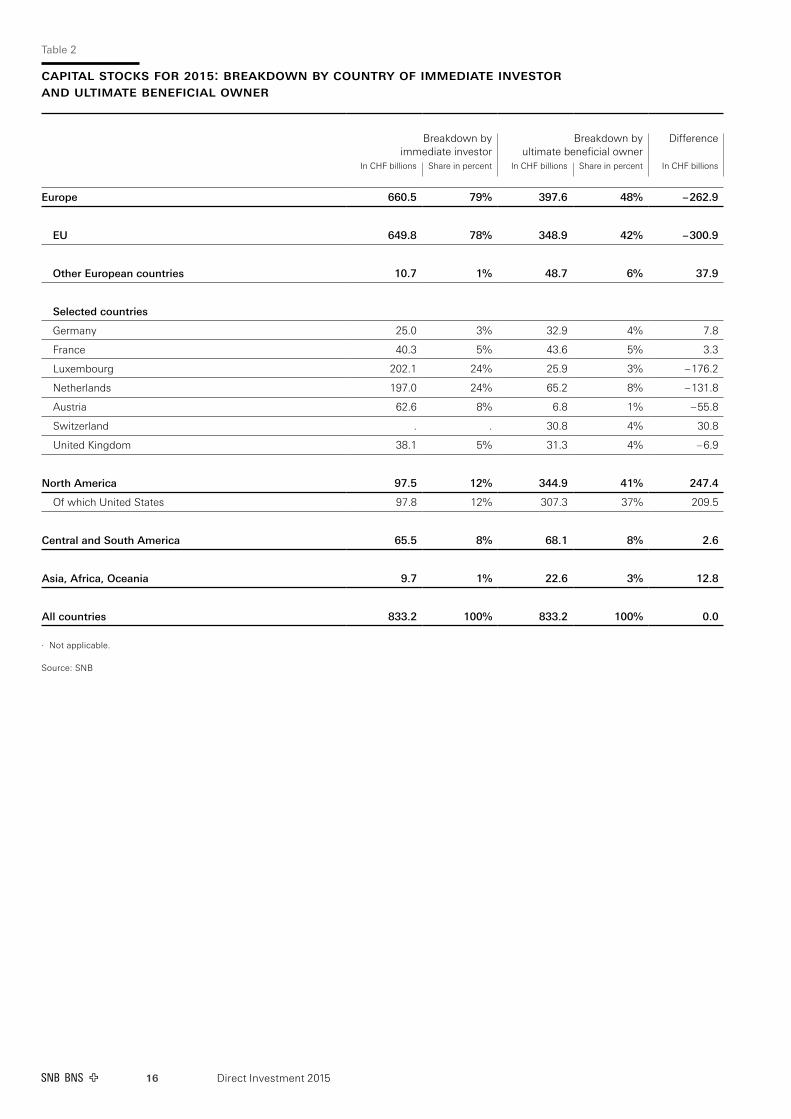
Because of the resulting differences in country breakdown, the SNB also provides a breakdown of capital stocks by country of origin of the ultimate beneficial owner. Using this approach, the US, in particular, had significantly higher capital stocks (CHF 307 billion) than when assessed according to immediate investor (CHF 98 billion). This shows that US investors mainly invest in companies in Switzerland via third countries. The same applies to investors from other European countries, as well as investors from Central and South America domiciled outside the offshore financial centres located there. The European holding locations of Luxembourg, the Netherlands and Austria were the most important of these third countries. According to the evaluation by ultimate beneficial owner, capital stocks of Luxembourg investors amounted to CHF 26 billion, only a fraction of the level according to the evaluation by immediate investor (CHF 202 billion). For the Netherlands and Austria, the figures were CHF 65 billion compared to CHF 197 billion, and CHF 7 billion compared to CHF 63 billion, respectively.
Switzerland is also listed as a country of origin of ultimate beneficial owner. This means that direct investors from Switzerland also invest in companies in Switzerland via intermediate companies in third countries. This is a practice referred to as ‘round tripping’, whereby capital originating in a country is reinvested back into that country in the form of foreign direct investment. In 2015, the capital stock invested in this way amounted to CHF 31 billion (2014: CHF 24 billion).
Direct Investment 201516
Table 2
capital StockS For 2015: breakdown by country oF immediate inveStor and ultimate beneFicial owner
Breakdown by immediate investor
Breakdown by ultimate beneficial owner
Difference
In CHF billions Share in percent In CHF billions Share in percent In CHF billions
Europe 660.5 79% 397.6 48% – 262.9
EU 649.8 78% 348.9 42% – 300.9
Other European countries 10.7 1% 48.7 6% 37.9
Selected countries
Germany 25.0 3% 32.9 4% 7.8
France 40.3 5% 43.6 5% 3.3
Luxembourg 202.1 24% 25.9 3% – 176.2
Netherlands 197.0 24% 65.2 8% – 131.8
Austria 62.6 8% 6.8 1% – 55.8
Switzerland . . 30.8 4% 30.8
United Kingdom 38.1 5% 31.3 4% – 6.9
North America 97.5 12% 344.9 41% 247.4
Of which United States 97.8 12% 307.3 37% 209.5
Central and South America 65.5 8% 68.1 8% 2.6
Asia, Africa, Oceania 9.7 1% 22.6 3% 12.8
All countries 833.2 100% 833.2 100% 0.0
∙ Not applicable.
Source: SNB
Direct Investment 2015 17
inveStment income
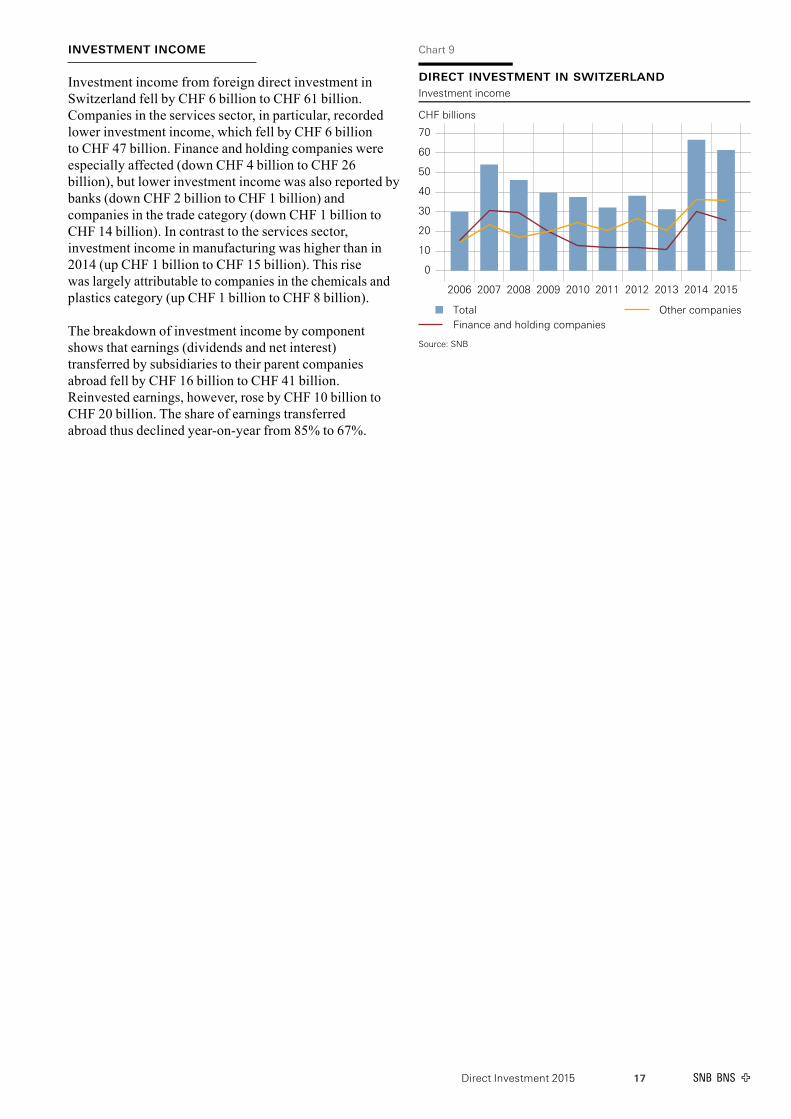
Investment income from foreign direct investment in Switzerland fell by CHF 6 billion to CHF 61 billion. Companies in the services sector, in particular, recorded lower investment income, which fell by CHF 6 billion to CHF 47 billion. Finance and holding companies were especially affected (down CHF 4 billion to CHF 26 billion), but lower investment income was also reported by banks (down CHF 2 billion to CHF 1 billion) and companies in the trade category (down CHF 1 billion to CHF 14 billion). In contrast to the services sector, investment income in manufacturing was higher than in 2014 (up CHF 1 billion to CHF 15 billion). This rise was largely attributable to companies in the chemicals and plastics category (up CHF 1 billion to CHF 8 billion).
The breakdown of investment income by component shows that earnings (dividends and net interest) transferred by subsidiaries to their parent companies abroad fell by CHF 16 billion to CHF 41 billion. Reinvested earnings, however, rose by CHF 10 billion to CHF 20 billion. The share of earnings transferred abroad thus declined year-on-year from 85% to 67%.
Chart 9
direct investment in switzerlandInvestment income
CHF billions
0
10
20
30
40
50
60
70
2006 2007 2008 2009 2010 2011 2012 2013 2014 2015
TotalFinance and holding companies
Other companies
Source: SNB
Direct Investment 201518
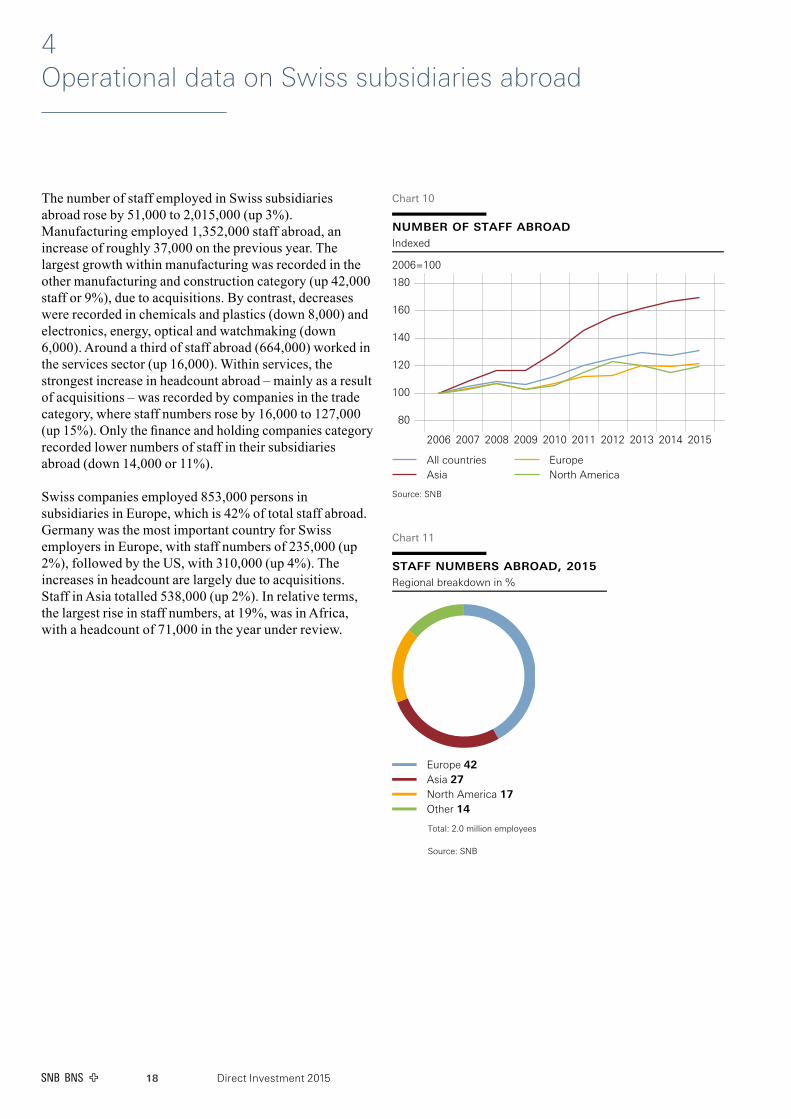
The number of staff employed in Swiss subsidiaries abroad rose by 51,000 to 2,015,000 (up 3%). Manufacturing employed 1,352,000 staff abroad, an increase of roughly 37,000 on the previous year. The largest growth within manufacturing was recorded in the other manufacturing and construction category (up 42,000 staff or 9%), due to acquisitions. By contrast, decreases were recorded in chemicals and plastics (down 8,000) and electronics, energy, optical and watchmaking (down 6,000). Around a third of staff abroad (664,000) worked in the services sector (up 16,000). Within services, the strongest increase in headcount abroad – mainly as a result of acquisitions – was recorded by companies in the trade category, where staff numbers rose by 16,000 to 127,000 (up 15%). Only the finance and holding companies category recorded lower numbers of staff in their subsidiaries abroad (down 14,000 or 11%).
Swiss companies employed 853,000 persons in subsidiaries in Europe, which is 42% of total staff abroad. Germany was the most important country for Swiss employers in Europe, with staff numbers of 235,000 (up 2%), followed by the US, with 310,000 (up 4%). The increases in headcount are largely due to acquisitions. Staff in Asia totalled 538,000 (up 2%). In relative terms, the largest rise in staff numbers, at 19%, was in Africa, with a headcount of 71,000 in the year under review.
4 Operational data on Swiss subsidiaries abroad
staff numbers abroad, 2015Regional breakdown in %
Europe 42Asia 27North America 17Other 14
Total: 2.0 million employees
Source: SNB
Chart 11
Chart 10
number of staff abroadIndexed
2006=100
80
100
120
140
160
180
2006 2007 2008 2009 2010 2011 2012 2013 2014 2015
All countriesAsia
EuropeNorth America
Source: SNB
Direct Investment 2015 19
Table3
number oF StaFF abroad 1,2
In thousands
2011 2012 2013 2014 2015 ShareIn percent
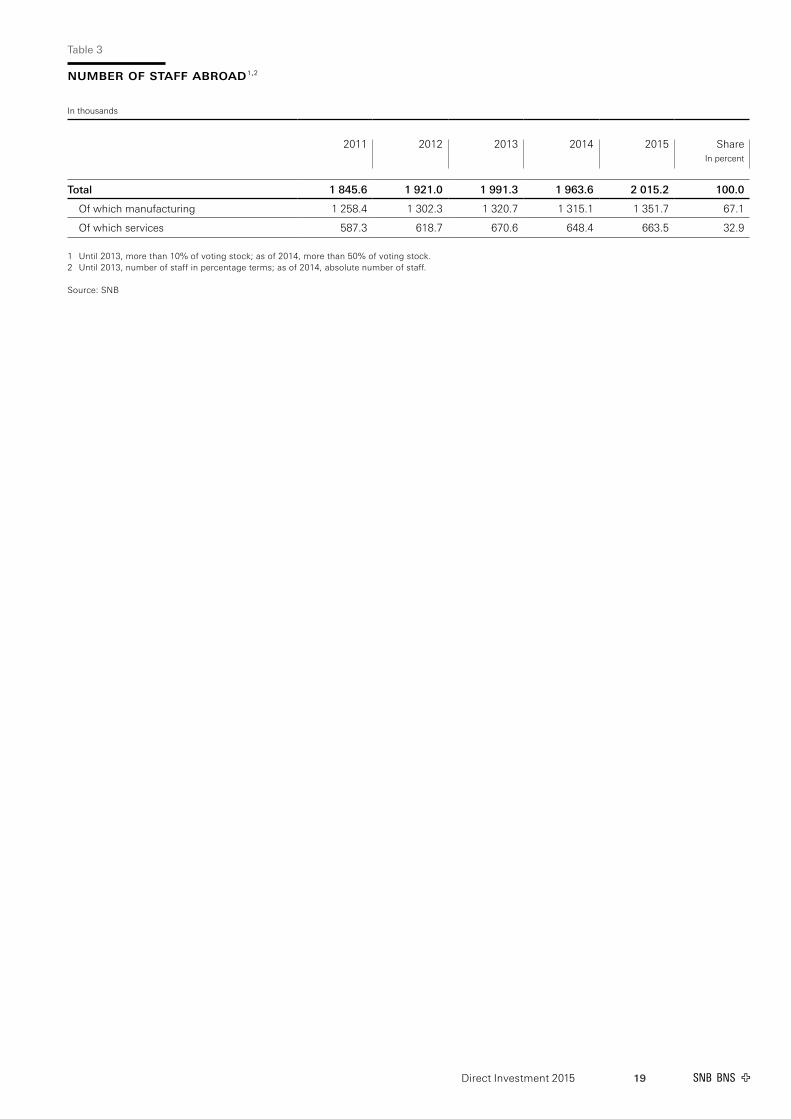
Total 1 845.6 1 921.0 1 991.3 1 963.6 2 015.2 100.0
Of which manufacturing 1 258.4 1 302.3 1 320.7 1 315.1 1 351.7 67.1
Of which services 587.3 618.7 670.6 648.4 663.5 32.9
1 Until 2013, more than 10% of voting stock; as of 2014, more than 50% of voting stock.2 Until 2013, number of staff in percentage terms; as of 2014, absolute number of staff.
Source: SNB
Direct Investment 201520
number oF StaFF1
In 2015, companies with foreign majority participations employed 457,000 staff in Switzerland (down 1,000). This represents 9% of all staff in the domestic manufacturing and services sectors.2 Of these, 235,000 worked in companies which were included in the SNB’s surveys. The remaining 221,000 persons worked in foreign-controlled companies in Switzerland which were not covered by SNB surveys.
Two-thirds of employees in companies with foreign majority participations worked in the services sector (307,000), primarily in the trade (116,000) and other services (108,000) categories. Compared to the previous
1 Data are obtained in cooperation with the SFSO. Companies excluded from the SNB survey (i.e. with capital stocks below CHF 10 million) are also taken into account.2 Sources: Employment statistics published by the SFSO, Neuchâtel, and by the Office of Statistics, Vaduz.
year, foreign-controlled companies in the banks, finance and holding companies and trade categories employed fewer staff in Switzerland. This was partly due to the sale of subsidiaries to domestic companies, as a consequence of which their staff are no longer included in these statistics. By contrast, higher headcounts were recorded in the transport and communications as well as the other services categories (up 1,000 each). Manufacturing saw a slight decrease in staff numbers to 150,000 (down 1,000), which was mainly attributable to the electronics, energy, optical and watchmaking category.
Two-thirds of staff in foreign subsidiaries work at companies ultimately controlled by investors from the EU (300,000). This was 17,000 less than a year earlier. The most important country of origin of investors continued to be Germany (121,000), followed by the US (91,000) and France (56,000). Headcounts in subsidiaries controlled from Asia, Africa and Oceania rose by 5,000 to 43,000, while those in subsidiaries with majority participations from Central and South America were up 6,000 to 13,000.
Table 4
number oF StaFF in Switzerland
In thousands
2014 2015 ShareIn percent
Number of staff in Switzerland 1 4 887.3 4 933.3 100.0
Of which in companies with foreign investors 458.1 456.6 9.3
Of which in companies which are covered in the SNB survey 2 243.6 235.3 4.8
Of which in companies which are not covered in the SNB survey 1 214.6 221.4 4.5
1 Sources: The Business and Enterprise Register (BER) (STATENT corporate structure statistics, Profiling, Profiling Light, ERST update survey) published by the SFSO, Neuchâtel, and employment statistics published by the Office of Statistics, Vaduz.
2 Source: SNB.
5 Operational data on foreign subsidiaries in Switzerland1
Direct Investment 2015 21
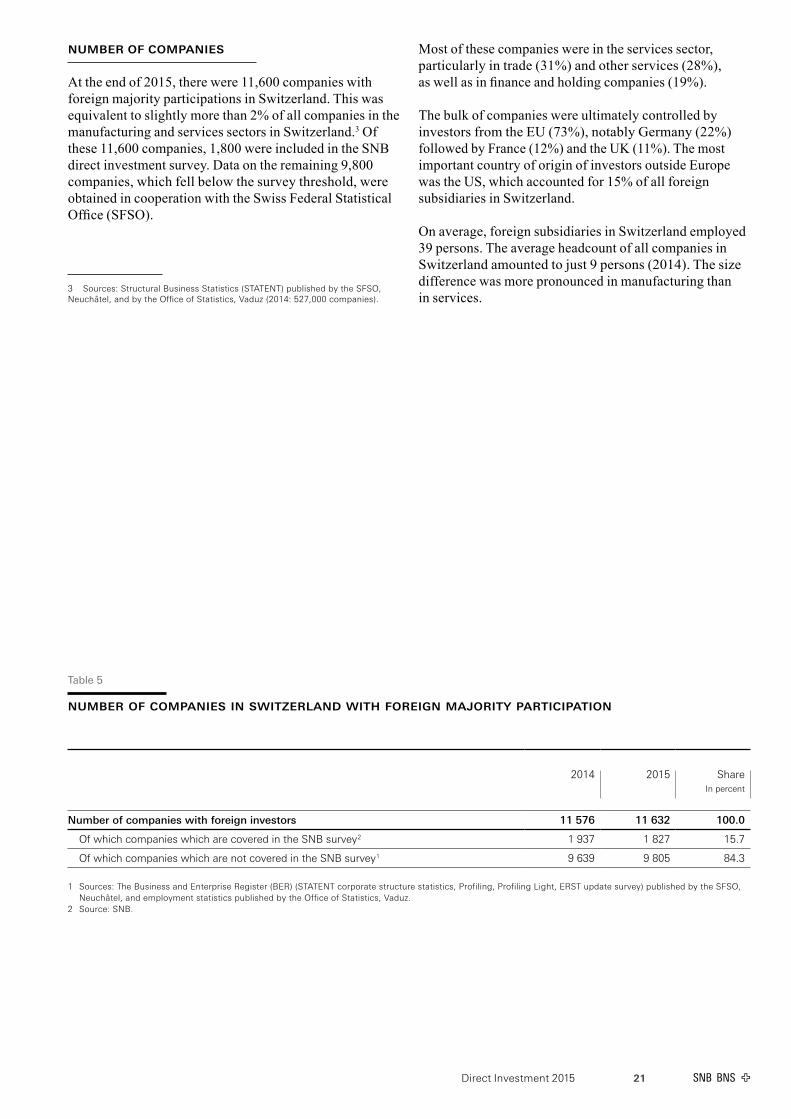
number oF companieS
At the end of 2015, there were 11,600 companies with foreign majority participations in Switzerland. This was equivalent to slightly more than 2% of all companies in the manufacturing and services sectors in Switzerland.3 Of these 11,600 companies, 1,800 were included in the SNB direct investment survey. Data on the remaining 9,800 companies, which fell below the survey threshold, were obtained in cooperation with the Swiss Federal Statistical Office (SFSO).
3 Sources: Structural Business Statistics (STATENT) published by the SFSO, Neuchâtel, and by the Office of Statistics, Vaduz (2014: 527,000 companies).
Most of these companies were in the services sector, particularly in trade (31%) and other services (28%), as well as in finance and holding companies (19%).
The bulk of companies were ultimately controlled by investors from the EU (73%), notably Germany (22%) followed by France (12%) and the UK (11%). The most important country of origin of investors outside Europe was the US, which accounted for 15% of all foreign subsidiaries in Switzerland.
On average, foreign subsidiaries in Switzerland employed 39 persons. The average headcount of all companies in Switzerland amounted to just 9 persons (2014). The size difference was more pronounced in manufacturing than in services.
Table5
number oF companieS in Switzerland witH Foreign maJority participation
2014 2015 ShareIn percent
Number of companies with foreign investors 11 576 11 632 100.0
Of which companies which are covered in the SNB survey 2 1 937 1 827 15.7
Of which companies which are not covered in the SNB survey 1 9 639 9 805 84.3
1 Sources: The Business and Enterprise Register (BER) (STATENT corporate structure statistics, Profiling, Profiling Light, ERST update survey) published by the SFSO, Neuchâtel, and employment statistics published by the Office of Statistics, Vaduz.
2 Source: SNB.
Direct Investment 201522
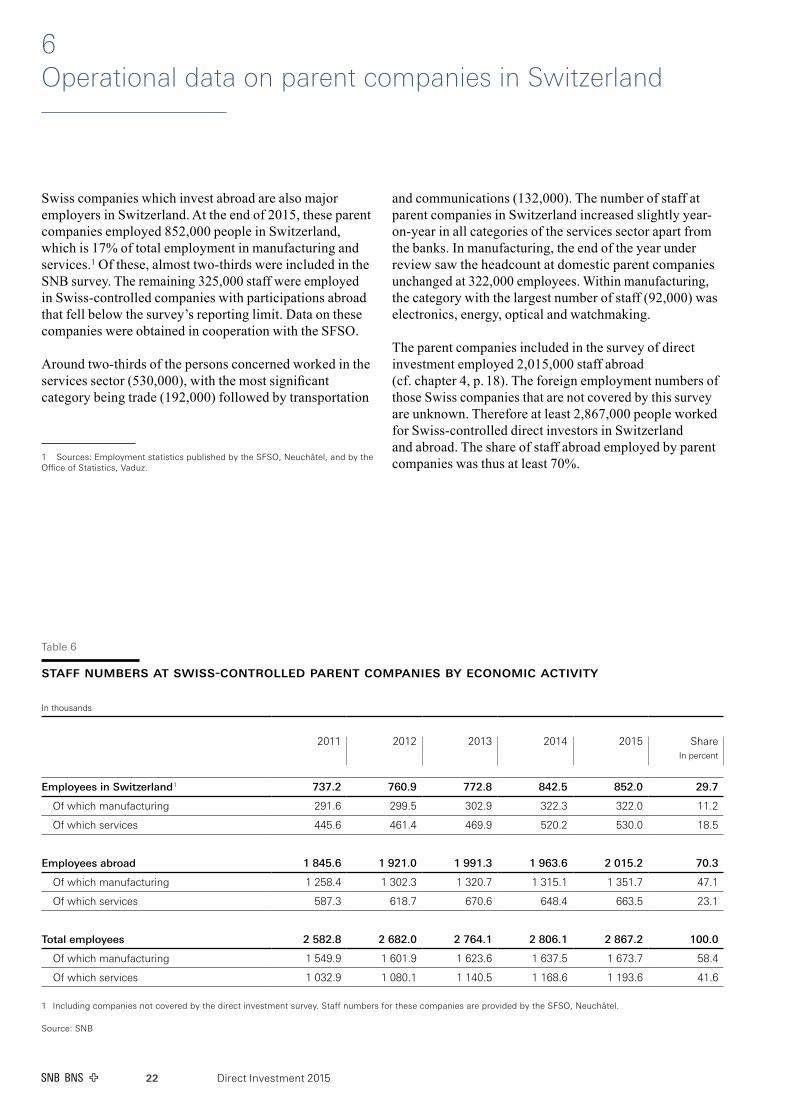
Swiss companies which invest abroad are also major employers in Switzerland. At the end of 2015, these parent companies employed 852,000 people in Switzerland, which is 17% of total employment in manufacturing and services.1 Of these, almost two-thirds were included in the SNB survey. The remaining 325,000 staff were employed in Swiss-controlled companies with participations abroad that fell below the survey’s reporting limit. Data on these companies were obtained in cooperation with the SFSO.
Around two-thirds of the persons concerned worked in the services sector (530,000), with the most significant category being trade (192,000) followed by transportation
1 Sources: Employment statistics published by the SFSO, Neuchâtel, and by the Office of Statistics, Vaduz.
6 Operational data on parent companies in Switzerland
and communications (132,000). The number of staff at parent companies in Switzerland increased slightly year-on-year in all categories of the services sector apart from the banks. In manufacturing, the end of the year under review saw the headcount at domestic parent companies unchanged at 322,000 employees. Within manufacturing, the category with the largest number of staff (92,000) was electronics, energy, optical and watchmaking.
The parent companies included in the survey of direct investment employed 2,015,000 staff abroad (cf. chapter 4, p. 18). The foreign employment numbers of those Swiss companies that are not covered by this survey are unknown. Therefore at least 2,867,000 people worked for Swiss-controlled direct investors in Switzerland and abroad. The share of staff abroad employed by parent companies was thus at least 70%.
Table 6
StaFF numberS at SwiSS-controlled parent companieS by economic activity
In thousands
2011 2012 2013 2014 2015 ShareIn percent
Employees in Switzerland 1 737.2 760.9 772.8 842.5 852.0 29.7
Of which manufacturing 291.6 299.5 302.9 322.3 322.0 11.2
Of which services 445.6 461.4 469.9 520.2 530.0 18.5
Employees abroad 1 845.6 1 921.0 1 991.3 1 963.6 2 015.2 70.3
Of which manufacturing 1 258.4 1 302.3 1 320.7 1 315.1 1 351.7 47.1
Of which services 587.3 618.7 670.6 648.4 663.5 23.1
Total employees 2 582.8 2 682.0 2 764.1 2 806.1 2 867.2 100.0
Of which manufacturing 1 549.9 1 601.9 1 623.6 1 637.5 1 673.7 58.4
Of which services 1 032.9 1 080.1 1 140.5 1 168.6 1 193.6 41.6
1 Including companies not covered by the direct investment survey. Staff numbers for these companies are provided by the SFSO, Neuchâtel.
Source: SNB

Published by Swiss National Bank Statistics P.O. Box, CH-8022 Zurich Telephone +41 58 631 00 00
Further [email protected]
LanguagesGerman, French and English
DesignInterbrand Ltd, Zurich
Printed byNeidhart + Schön AG, Zurich
Date of publicationDecember 2016
ISSN 1662-4327 (printed version) ISSN 1661-1586 (online version)
Accessing SNB publicationsSwiss National Bank publications are available at www.snb.ch, Publications.
Publication dates are listed at www.snb.ch, Media, Time schedule.
Many of the publications are available in printed form, either as single copies or in subscription, from: Swiss National Bank, Library P.O. Box, CH-8022 Zurich Telephone +41 58 631 11 50 Fax +41 58 631 50 48 E-mail: [email protected]
Copyright ©The Swiss National Bank (SNB) respects all third-party rights, in particular rights relating to works protected by copyright (information or data, wordings and depictions, to the extent that these are of an individual character).
SNB publications containing a reference to a copyright (© Swiss National Bank/SNB, Zurich/year, or similar) may, under copyright law, only be used (reproduced, used via the internet, etc.) for non-commercial purposes and provided that the source is mentioned. Their use for commercial purposes is only permitted with the prior express consent of the SNB.
General information and data published without reference to a copyright may be used without mentioning the source.
To the extent that the information and data clearly derive from outside sources, the users of such information and data are obliged to respect any existing copyrights and to obtain the right of use from the relevant outside source themselves.
Limitation of liabilityThe SNB accepts no responsibility for any information it provides. Under no circumstances will it accept any liability for losses or damage which may result from the use of such information. This limitation of liability applies, in particular, to the topicality, accuracy, validity and availability of the information.
© Swiss National Bank, Zurich/Berne 2016