Embed Size (px)
Citation preview
A RT I C L E S
A monolayer of highly attenuated endothelial cells (ECs) lines all bloodvessels to form a physiologically vital interface between the circulatingblood and the underlying cells inside the tissue. This blood-tissue inter-face plays an important role in controlling the passage of blood mole-cules and cells into the tissue and in many physiological functions,including vasoregulation, coagulation and inflammation, as well as tis-sue nutrition, growth, survival, repair and overall organ homeostasisand function1. Disruption of the vascular endothelium and its normalbarrier function can lead rapidly to tissue edema, hypoxia, pathologyand even organ death2.
Although the microenvironment of the tissue surrounding the bloodvessels clearly influences EC phenotype3–8, little molecular informationis available regarding vascular endothelium as it exists in native tissue.This is in large part because of technical limitations in molecular profil-ing of a cell type that represents such a small percentage of the cells in thetissue. Past approaches have analyzed endothelial cells isolated from tis-sue by enzymatic digestion and sorting of the released single cells usingEC markers9–12. Although the study of isolated and even cultured ECs invitro has yielded much functional and molecular information, bothenzymatic and mechanical tissue disassembly and growth in culturecontribute to phenotypic changes that result in morphological alter-ations as well as loss of native function and protein expression3.Although expected to be substantial, the molecular differences betweenECs in vivo and in vitro are unknown. The reported ability of cells andphage-displayed peptides to home to specific tissues of the body afterintravenous injection also provides indirect evidence supporting themolecular heterogeneity of the endothelial cell surface amongorgans13,14 but has not yet facilitated global mapping of EC surface pro-teins in vivo.
Here, we report our initial efforts to provide a large-scale mapping ofthe cell-surface proteome of microvascular endothelium as it exists inrat lung tissue in vivo and in cultured rat lung ECs.
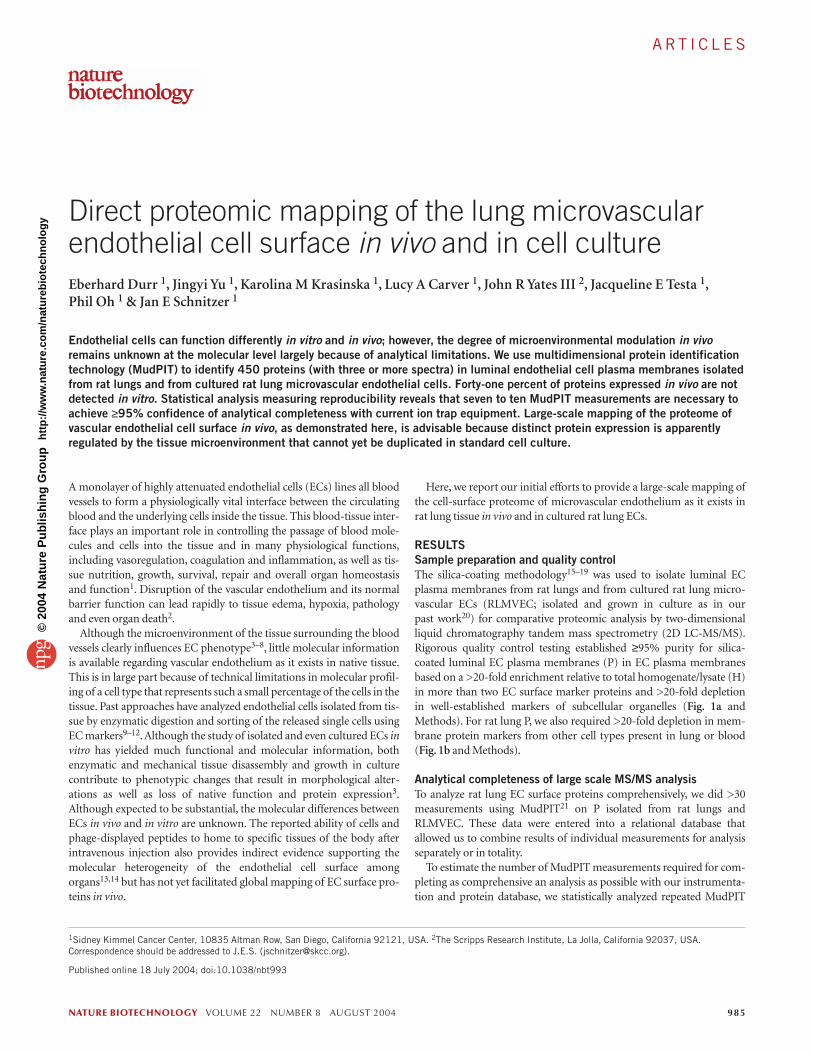
RESULTSSample preparation and quality controlThe silica-coating methodology15–19 was used to isolate luminal ECplasma membranes from rat lungs and from cultured rat lung micro-vascular ECs (RLMVEC; isolated and grown in culture as in our past work20) for comparative proteomic analysis by two-dimensionalliquid chromatography tandem mass spectrometry (2D LC-MS/MS).Rigorous quality control testing established ≥95% purity for silica-coated luminal EC plasma membranes (P) in EC plasma membranesbased on a >20-fold enrichment relative to total homogenate/lysate (H)in more than two EC surface marker proteins and >20-fold depletion in well-established markers of subcellular organelles (Fig. 1a andMethods). For rat lung P, we also required >20-fold depletion in mem-brane protein markers from other cell types present in lung or blood(Fig. 1b and Methods).
Analytical completeness of large scale MS/MS analysisTo analyze rat lung EC surface proteins comprehensively, we did >30measurements using MudPIT21 on P isolated from rat lungs andRLMVEC. These data were entered into a relational database thatallowed us to combine results of individual measurements for analysisseparately or in totality.
To estimate the number of MudPIT measurements required for com-pleting as comprehensive an analysis as possible with our instrumenta-tion and protein database, we statistically analyzed repeated MudPIT
1Sidney Kimmel Cancer Center, 10835 Altman Row, San Diego, California 92121, USA. 2The Scripps Research Institute, La Jolla, California 92037, USA.Correspondence should be addressed to J.E.S. ([email protected]).
Published online 18 July 2004; doi:10.1038/nbt993
Direct proteomic mapping of the lung microvascularendothelial cell surface in vivo and in cell cultureEberhard Durr 1, Jingyi Yu 1, Karolina M Krasinska 1, Lucy A Carver 1, John R Yates III 2, Jacqueline E Testa 1,Phil Oh 1 & Jan E Schnitzer 1
Endothelial cells can function differently in vitro and in vivo; however, the degree of microenvironmental modulation in vivoremains unknown at the molecular level largely because of analytical limitations. We use multidimensional protein identificationtechnology (MudPIT) to identify 450 proteins (with three or more spectra) in luminal endothelial cell plasma membranes isolatedfrom rat lungs and from cultured rat lung microvascular endothelial cells. Forty-one percent of proteins expressed in vivo are notdetected in vitro. Statistical analysis measuring reproducibility reveals that seven to ten MudPIT measurements are necessary toachieve ≥95% confidence of analytical completeness with current ion trap equipment. Large-scale mapping of the proteome ofvascular endothelial cell surface in vivo, as demonstrated here, is advisable because distinct protein expression is apparently regulated by the tissue microenvironment that cannot yet be duplicated in standard cell culture.
NATURE BIOTECHNOLOGY VOLUME 22 NUMBER 8 AUGUST 2004 985
©20
04 N
atur
e P
ublis
hing
Gro
up
http
://w
ww
.nat
ure.
com
/nat
ureb
iote
chno
logy
A RT I C L E S
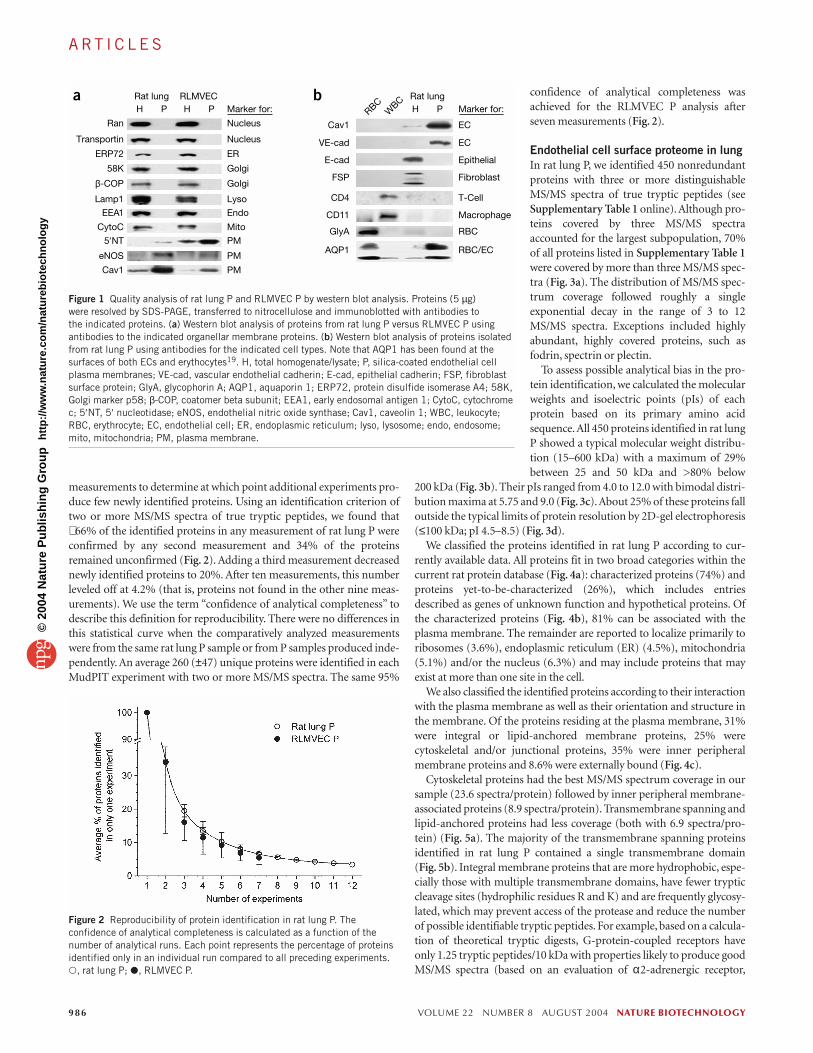
measurements to determine at which point additional experiments pro-duce few newly identified proteins. Using an identification criterion oftwo or more MS/MS spectra of true tryptic peptides, we found that∼ 66% of the identified proteins in any measurement of rat lung P wereconfirmed by any second measurement and 34% of the proteinsremained unconfirmed (Fig. 2). Adding a third measurement decreasednewly identified proteins to 20%. After ten measurements, this numberleveled off at 4.2% (that is, proteins not found in the other nine meas-urements). We use the term “confidence of analytical completeness” todescribe this definition for reproducibility. There were no differences inthis statistical curve when the comparatively analyzed measurementswere from the same rat lung P sample or from P samples produced inde-pendently. An average 260 (±47) unique proteins were identified in eachMudPIT experiment with two or more MS/MS spectra. The same 95%
confidence of analytical completeness wasachieved for the RLMVEC P analysis afterseven measurements (Fig. 2).
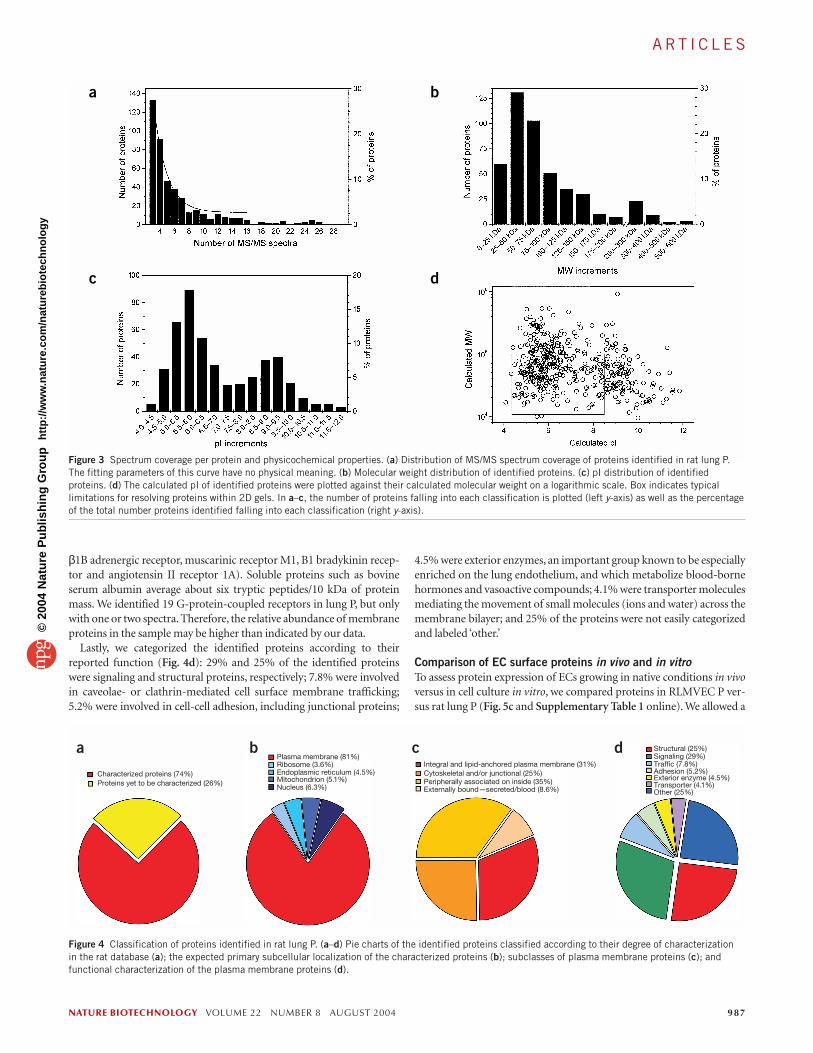
Endothelial cell surface proteome in lungIn rat lung P, we identified 450 nonredundantproteins with three or more distinguishableMS/MS spectra of true tryptic peptides (seeSupplementary Table 1 online). Although pro-teins covered by three MS/MS spectraaccounted for the largest subpopulation, 70%of all proteins listed in Supplementary Table 1were covered by more than three MS/MS spec-tra (Fig. 3a). The distribution of MS/MS spec-trum coverage followed roughly a singleexponential decay in the range of 3 to 12MS/MS spectra. Exceptions included highlyabundant, highly covered proteins, such asfodrin, spectrin or plectin.
To assess possible analytical bias in the pro-tein identification, we calculated the molecularweights and isoelectric points (pIs) of eachprotein based on its primary amino acidsequence.All 450 proteins identified in rat lungP showed a typical molecular weight distribu-tion (15–600 kDa) with a maximum of 29%between 25 and 50 kDa and >80% below
200 kDa (Fig. 3b). Their pIs ranged from 4.0 to 12.0 with bimodal distri-bution maxima at 5.75 and 9.0 (Fig. 3c).About 25% of these proteins falloutside the typical limits of protein resolution by 2D-gel electrophoresis(≤100 kDa; pI 4.5–8.5) (Fig. 3d).
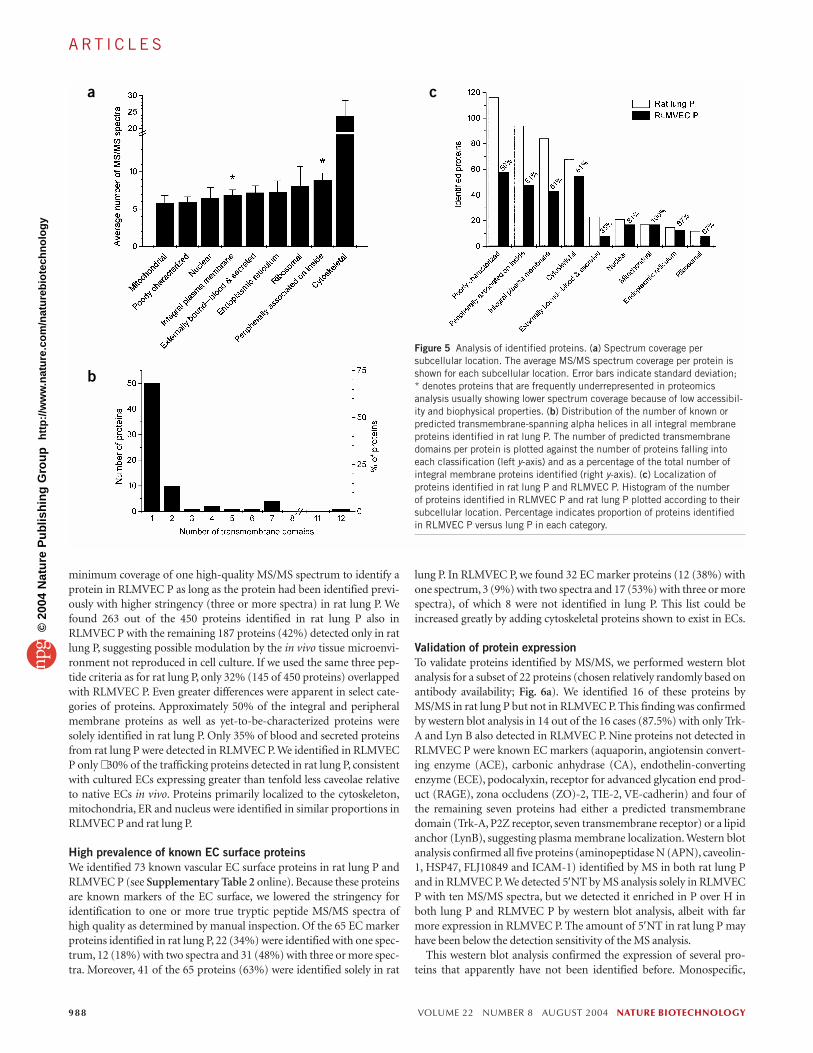
We classified the proteins identified in rat lung P according to cur-rently available data. All proteins fit in two broad categories within thecurrent rat protein database (Fig. 4a): characterized proteins (74%) andproteins yet-to-be-characterized (26%), which includes entriesdescribed as genes of unknown function and hypothetical proteins. Ofthe characterized proteins (Fig. 4b), 81% can be associated with theplasma membrane. The remainder are reported to localize primarily toribosomes (3.6%), endoplasmic reticulum (ER) (4.5%), mitochondria(5.1%) and/or the nucleus (6.3%) and may include proteins that mayexist at more than one site in the cell.
We also classified the identified proteins according to their interactionwith the plasma membrane as well as their orientation and structure inthe membrane. Of the proteins residing at the plasma membrane, 31%were integral or lipid-anchored membrane proteins, 25% werecytoskeletal and/or junctional proteins, 35% were inner peripheralmembrane proteins and 8.6% were externally bound (Fig. 4c).
Cytoskeletal proteins had the best MS/MS spectrum coverage in oursample (23.6 spectra/protein) followed by inner peripheral membrane-associated proteins (8.9 spectra/protein). Transmembrane spanning andlipid-anchored proteins had less coverage (both with 6.9 spectra/pro-tein) (Fig. 5a). The majority of the transmembrane spanning proteinsidentified in rat lung P contained a single transmembrane domain (Fig. 5b). Integral membrane proteins that are more hydrophobic, espe-cially those with multiple transmembrane domains, have fewer trypticcleavage sites (hydrophilic residues R and K) and are frequently glycosy-lated, which may prevent access of the protease and reduce the numberof possible identifiable tryptic peptides. For example, based on a calcula-tion of theoretical tryptic digests, G-protein-coupled receptors haveonly 1.25 tryptic peptides/10 kDa with properties likely to produce goodMS/MS spectra (based on an evaluation of α2-adrenergic receptor,
986 VOLUME 22 NUMBER 8 AUGUST 2004 NATURE BIOTECHNOLOGY
Ran
Transportin
ERP72
58K
β-COP
Lamp1
EEA1
CytoC
5′NT
eNOS
Cav1
Nucleus
Nucleus
ER
Golgi
Golgi
Lyso
Endo
Mito
PM
PM
PM
Rat lung RLMVECH P
Rat lungH PH P Marker for:
EC
EC
Epithelial
Fibroblast
T-Cell
Macrophage
RBC
RBC/EC
Cav1
VE-cad
E-cad
FSP
CD4
CD11
GlyA
AQP1
Marker for:a b
RBCW
BC
Figure 1 Quality analysis of rat lung P and RLMVEC P by western blot analysis. Proteins (5 µg) were resolved by SDS-PAGE, transferred to nitrocellulose and immunoblotted with antibodies to the indicated proteins. (a) Western blot analysis of proteins from rat lung P versus RLMVEC P usingantibodies to the indicated organellar membrane proteins. (b) Western blot analysis of proteins isolatedfrom rat lung P using antibodies for the indicated cell types. Note that AQP1 has been found at thesurfaces of both ECs and erythocytes19. H, total homogenate/lysate; P, silica-coated endothelial cellplasma membranes; VE-cad, vascular endothelial cadherin; E-cad, epithelial cadherin; FSP, fibroblastsurface protein; GlyA, glycophorin A; AQP1, aquaporin 1; ERP72, protein disulfide isomerase A4; 58K,Golgi marker p58; β-COP, coatomer beta subunit; EEA1, early endosomal antigen 1; CytoC, cytochromec; 5′NT, 5′ nucleotidase; eNOS, endothelial nitric oxide synthase; Cav1, caveolin 1; WBC, leukocyte;RBC, erythrocyte; EC, endothelial cell; ER, endoplasmic reticulum; lyso, lysosome; endo, endosome;mito, mitochondria; PM, plasma membrane.
Figure 2 Reproducibility of protein identification in rat lung P. Theconfidence of analytical completeness is calculated as a function of thenumber of analytical runs. Each point represents the percentage of proteinsidentified only in an individual run compared to all preceding experiments.�, rat lung P; �, RLMVEC P.
©20
04 N
atur
e P
ublis
hing
Gro
up
http
://w
ww
.nat
ure.
com
/nat
ureb
iote
chno
logy
A RT I C L E S
β1B adrenergic receptor, muscarinic receptor M1, B1 bradykinin recep-tor and angiotensin II receptor 1A). Soluble proteins such as bovineserum albumin average about six tryptic peptides/10 kDa of proteinmass. We identified 19 G-protein-coupled receptors in lung P, but onlywith one or two spectra. Therefore, the relative abundance of membraneproteins in the sample may be higher than indicated by our data.
Lastly, we categorized the identified proteins according to theirreported function (Fig. 4d): 29% and 25% of the identified proteinswere signaling and structural proteins, respectively; 7.8% were involvedin caveolae- or clathrin-mediated cell surface membrane trafficking;5.2% were involved in cell-cell adhesion, including junctional proteins;
4.5% were exterior enzymes, an important group known to be especiallyenriched on the lung endothelium, and which metabolize blood-bornehormones and vasoactive compounds; 4.1% were transporter moleculesmediating the movement of small molecules (ions and water) across themembrane bilayer; and 25% of the proteins were not easily categorizedand labeled ‘other.’
Comparison of EC surface proteins in vivo and in vitroTo assess protein expression of ECs growing in native conditions in vivoversus in cell culture in vitro, we compared proteins in RLMVEC P ver-sus rat lung P (Fig. 5c and Supplementary Table 1 online). We allowed a
NATURE BIOTECHNOLOGY VOLUME 22 NUMBER 8 AUGUST 2004 987
a b
c d
Figure 3 Spectrum coverage per protein and physicochemical properties. (a) Distribution of MS/MS spectrum coverage of proteins identified in rat lung P.The fitting parameters of this curve have no physical meaning. (b) Molecular weight distribution of identified proteins. (c) pI distribution of identifiedproteins. (d) The calculated pI of identified proteins were plotted against their calculated molecular weight on a logarithmic scale. Box indicates typicallimitations for resolving proteins within 2D gels. In a–c, the number of proteins falling into each classification is plotted (left y-axis) as well as the percentageof the total number proteins identified falling into each classification (right y-axis).
Characterized proteins (74%)
Plasma membrane (81%)Ribosome (3.6%)Endoplasmic reticulum (4.5%)Mitochondrion (5.1%)Nucleus (6.3%)
Structural (25%)Signaling (29%)Traffic (7.8%)Adhesion (5.2%)Exterior enzyme (4.5%)Transporter (4.1%)Other (25%)
Proteins yet to be characterized (26%)
Integral and lipid-anchored plasma membrane (31%)Cytoskeletal and/or junctional (25%)Peripherally associated on inside (35%)Externally bound—secreted/blood (8.6%)
a b c d
Figure 4 Classification of proteins identified in rat lung P. (a–d) Pie charts of the identified proteins classified according to their degree of characterization in the rat database (a); the expected primary subcellular localization of the characterized proteins (b); subclasses of plasma membrane proteins (c); andfunctional characterization of the plasma membrane proteins (d).
©20
04 N
atur
e P
ublis
hing
Gro
up
http
://w
ww
.nat
ure.
com
/nat
ureb
iote
chno
logy
A RT I C L E S
minimum coverage of one high-quality MS/MS spectrum to identify aprotein in RLMVEC P as long as the protein had been identified previ-ously with higher stringency (three or more spectra) in rat lung P. Wefound 263 out of the 450 proteins identified in rat lung P also inRLMVEC P with the remaining 187 proteins (42%) detected only in ratlung P, suggesting possible modulation by the in vivo tissue microenvi-ronment not reproduced in cell culture. If we used the same three pep-tide criteria as for rat lung P, only 32% (145 of 450 proteins) overlappedwith RLMVEC P. Even greater differences were apparent in select cate-gories of proteins. Approximately 50% of the integral and peripheralmembrane proteins as well as yet-to-be-characterized proteins weresolely identified in rat lung P. Only 35% of blood and secreted proteinsfrom rat lung P were detected in RLMVEC P. We identified in RLMVECP only ∼ 30% of the trafficking proteins detected in rat lung P, consistentwith cultured ECs expressing greater than tenfold less caveolae relativeto native ECs in vivo. Proteins primarily localized to the cytoskeleton,mitochondria, ER and nucleus were identified in similar proportions inRLMVEC P and rat lung P.
High prevalence of known EC surface proteinsWe identified 73 known vascular EC surface proteins in rat lung P andRLMVEC P (see Supplementary Table 2 online). Because these proteinsare known markers of the EC surface, we lowered the stringency foridentification to one or more true tryptic peptide MS/MS spectra ofhigh quality as determined by manual inspection. Of the 65 EC markerproteins identified in rat lung P, 22 (34%) were identified with one spec-trum, 12 (18%) with two spectra and 31 (48%) with three or more spec-tra. Moreover, 41 of the 65 proteins (63%) were identified solely in rat
lung P. In RLMVEC P, we found 32 EC marker proteins (12 (38%) withone spectrum, 3 (9%) with two spectra and 17 (53%) with three or morespectra), of which 8 were not identified in lung P. This list could beincreased greatly by adding cytoskeletal proteins shown to exist in ECs.
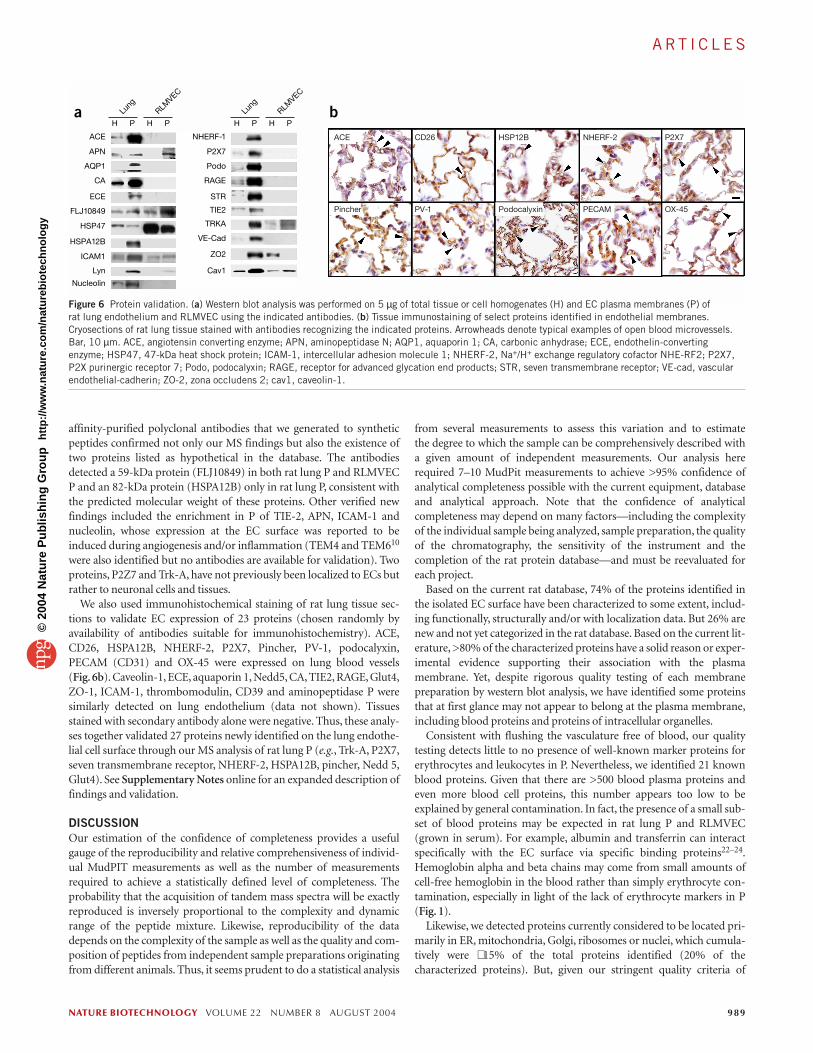
Validation of protein expressionTo validate proteins identified by MS/MS, we performed western blotanalysis for a subset of 22 proteins (chosen relatively randomly based onantibody availability; Fig. 6a). We identified 16 of these proteins byMS/MS in rat lung P but not in RLMVEC P. This finding was confirmedby western blot analysis in 14 out of the 16 cases (87.5%) with only Trk-A and Lyn B also detected in RLMVEC P. Nine proteins not detected inRLMVEC P were known EC markers (aquaporin, angiotensin convert-ing enzyme (ACE), carbonic anhydrase (CA), endothelin-convertingenzyme (ECE), podocalyxin, receptor for advanced glycation end prod-uct (RAGE), zona occludens (ZO)-2, TIE-2, VE-cadherin) and four ofthe remaining seven proteins had either a predicted transmembranedomain (Trk-A, P2Z receptor, seven transmembrane receptor) or a lipidanchor (LynB), suggesting plasma membrane localization. Western blotanalysis confirmed all five proteins (aminopeptidase N (APN), caveolin-1, HSP47, FLJ10849 and ICAM-1) identified by MS in both rat lung Pand in RLMVEC P. We detected 5′NT by MS analysis solely in RLMVECP with ten MS/MS spectra, but we detected it enriched in P over H inboth lung P and RLMVEC P by western blot analysis, albeit with farmore expression in RLMVEC P. The amount of 5′NT in rat lung P mayhave been below the detection sensitivity of the MS analysis.
This western blot analysis confirmed the expression of several pro-teins that apparently have not been identified before. Monospecific,
988 VOLUME 22 NUMBER 8 AUGUST 2004 NATURE BIOTECHNOLOGY
a
b
c
Figure 5 Analysis of identified proteins. (a) Spectrum coverage persubcellular location. The average MS/MS spectrum coverage per protein isshown for each subcellular location. Error bars indicate standard deviation; * denotes proteins that are frequently underrepresented in proteomicsanalysis usually showing lower spectrum coverage because of low accessibil-ity and biophysical properties. (b) Distribution of the number of known orpredicted transmembrane-spanning alpha helices in all integral membraneproteins identified in rat lung P. The number of predicted transmembranedomains per protein is plotted against the number of proteins falling intoeach classification (left y-axis) and as a percentage of the total number ofintegral membrane proteins identified (right y-axis). (c) Localization ofproteins identified in rat lung P and RLMVEC P. Histogram of the number of proteins identified in RLMVEC P and rat lung P plotted according to theirsubcellular location. Percentage indicates proportion of proteins identified in RLMVEC P versus lung P in each category.
©20
04 N
atur
e P
ublis
hing
Gro
up
http
://w
ww
.nat
ure.
com
/nat
ureb
iote
chno
logy
A RT I C L E S
affinity-purified polyclonal antibodies that we generated to syntheticpeptides confirmed not only our MS findings but also the existence oftwo proteins listed as hypothetical in the database. The antibodiesdetected a 59-kDa protein (FLJ10849) in both rat lung P and RLMVECP and an 82-kDa protein (HSPA12B) only in rat lung P, consistent withthe predicted molecular weight of these proteins. Other verified newfindings included the enrichment in P of TIE-2, APN, ICAM-1 andnucleolin, whose expression at the EC surface was reported to beinduced during angiogenesis and/or inflammation (TEM4 and TEM610
were also identified but no antibodies are available for validation). Twoproteins, P2Z7 and Trk-A, have not previously been localized to ECs butrather to neuronal cells and tissues.
We also used immunohistochemical staining of rat lung tissue sec-tions to validate EC expression of 23 proteins (chosen randomly byavailability of antibodies suitable for immunohistochemistry). ACE,CD26, HSPA12B, NHERF-2, P2X7, Pincher, PV-1, podocalyxin,PECAM (CD31) and OX-45 were expressed on lung blood vessels (Fig. 6b). Caveolin-1, ECE, aquaporin 1, Nedd5, CA, TIE2, RAGE, Glut4,ZO-1, ICAM-1, thrombomodulin, CD39 and aminopeptidase P weresimilarly detected on lung endothelium (data not shown). Tissuesstained with secondary antibody alone were negative. Thus, these analy-ses together validated 27 proteins newly identified on the lung endothe-lial cell surface through our MS analysis of rat lung P (e.g., Trk-A, P2X7,seven transmembrane receptor, NHERF-2, HSPA12B, pincher, Nedd 5,Glut4). See Supplementary Notes online for an expanded description offindings and validation.
DISCUSSIONOur estimation of the confidence of completeness provides a usefulgauge of the reproducibility and relative comprehensiveness of individ-ual MudPIT measurements as well as the number of measurementsrequired to achieve a statistically defined level of completeness. Theprobability that the acquisition of tandem mass spectra will be exactlyreproduced is inversely proportional to the complexity and dynamicrange of the peptide mixture. Likewise, reproducibility of the datadepends on the complexity of the sample as well as the quality and com-position of peptides from independent sample preparations originatingfrom different animals. Thus, it seems prudent to do a statistical analysis
from several measurements to assess this variation and to estimate the degree to which the sample can be comprehensively described with a given amount of independent measurements. Our analysis hererequired 7–10 MudPit measurements to achieve >95% confidence ofanalytical completeness possible with the current equipment, databaseand analytical approach. Note that the confidence of analytical completeness may depend on many factors—including the complexityof the individual sample being analyzed, sample preparation, the qualityof the chromatography, the sensitivity of the instrument and the completion of the rat protein database—and must be reevaluated foreach project.
Based on the current rat database, 74% of the proteins identified inthe isolated EC surface have been characterized to some extent, includ-ing functionally, structurally and/or with localization data. But 26% arenew and not yet categorized in the rat database. Based on the current lit-erature, >80% of the characterized proteins have a solid reason or exper-imental evidence supporting their association with the plasmamembrane. Yet, despite rigorous quality testing of each membranepreparation by western blot analysis, we have identified some proteinsthat at first glance may not appear to belong at the plasma membrane,including blood proteins and proteins of intracellular organelles.
Consistent with flushing the vasculature free of blood, our qualitytesting detects little to no presence of well-known marker proteins forerythrocytes and leukocytes in P. Nevertheless, we identified 21 knownblood proteins. Given that there are >500 blood plasma proteins andeven more blood cell proteins, this number appears too low to beexplained by general contamination. In fact, the presence of a small sub-set of blood proteins may be expected in rat lung P and RLMVEC(grown in serum). For example, albumin and transferrin can interactspecifically with the EC surface via specific binding proteins22–24.Hemoglobin alpha and beta chains may come from small amounts ofcell-free hemoglobin in the blood rather than simply erythrocyte con-tamination, especially in light of the lack of erythrocyte markers in P(Fig. 1).
Likewise, we detected proteins currently considered to be located pri-marily in ER, mitochondria, Golgi, ribosomes or nuclei, which cumula-tively were ∼ 15% of the total proteins identified (20% of thecharacterized proteins). But, given our stringent quality criteria of
NATURE BIOTECHNOLOGY VOLUME 22 NUMBER 8 AUGUST 2004 989
H P H P
NHERF-1
P2X7
Podo
RAGE
STR
TIE2
TRKA
VE-Cad
ACE
APN
AQP1
CA
ECE
FLJ10849
HSP47
HSPA12B
ZO2
Cav1
ICAM1
Lyn
Nucleolin
Lung
RLMVEC
H P H PLu
ngRLM
VEC
ACE CD26 HSP12B NHERF-2 P2X7
Pincher PV-1 Podocalyxin PECAM OX-45
a b
Figure 6 Protein validation. (a) Western blot analysis was performed on 5 µg of total tissue or cell homogenates (H) and EC plasma membranes (P) of rat lung endothelium and RLMVEC using the indicated antibodies. (b) Tissue immunostaining of select proteins identified in endothelial membranes.Cryosections of rat lung tissue stained with antibodies recognizing the indicated proteins. Arrowheads denote typical examples of open blood microvessels.Bar, 10 µm. ACE, angiotensin converting enzyme; APN, aminopeptidase N; AQP1, aquaporin 1; CA, carbonic anhydrase; ECE, endothelin-convertingenzyme; HSP47, 47-kDa heat shock protein; ICAM-1, intercellular adhesion molecule 1; NHERF-2, Na+/H+ exchange regulatory cofactor NHE-RF2; P2X7,P2X purinergic receptor 7; Podo, podocalyxin; RAGE, receptor for advanced glycation end products; STR, seven transmembrane receptor; VE-cad, vascularendothelial-cadherin; ZO-2, zona occludens 2; cav1, caveolin-1.
©20
04 N
atur
e P
ublis
hing
Gro
up
http
://w
ww
.nat
ure.
com
/nat
ureb
iote
chno
logy
A RT I C L E S
≥20-fold enrichment of EC markers and ≥20-fold depletion of specificmarkers of these subcellular organelles, we may expect ≤5% contami-nants. Thus, general contamination of membranes from theseorganelles seems remote, even more so if one considers the few some-times low-abundance proteins identified (∼ 15 average per organelle)relative to the many hundreds of proteins in each organelle. Of course, itis possible that polycationic proteins, such as histones and ribosomalsubunit proteins, released by tissue homogenization can adsorb electro-statically to the polyanionic polyacrylic acid crosslinker of the silica-coated membranes. But it seems more likely that most of these proteinssimply reside in more than one subcellular location. It is not unusual forproteins initially categorized as organelle-specific to later be discoveredelsewhere in the cell. So far, four proteins identified here are examples ofthis. Nucleolin is a well-characterized nuclear protein but is expressedalso at the cell surface25. Elongation factor-1 alpha is known primarily asa component of the protein synthesis machinery but has a less well-known function in cytoskeletal reorganization26. Protein disulfide iso-merase, commonly classified as an ER protein, has recently beendetected at the plasma membrane of platelets and liver27. Hsp47 was ini-tially assigned to the ER, but later discovered to be transported to theplasma membrane28. Thus, this analysis may provide, for some proteins,the first evidence of a secondary localization at the plasma membrane.Protein-protein interactions may further explain the presence of selectproteins (see Supplementary Note online). Considering all of theseissues, our list of identified proteins seems rather consistent with ourquality control data showing ≥95% purity of the isolated membranes.
Comparative proteomic analysis of EC surface membranes isolatedfrom rat lung versus cultured RLMVEC revealed striking differences.Only ∼ 51% of the integral membrane proteins and plasma mem-brane–associated proteins identified were expressed in commonbetween rat lung P and RLMVEC P. Interestingly, 65 of 73 (89%) totalknown EC marker proteins detected in this study were found in rat lungP versus only 32 (43.8%) in RLMVEC P (see Supplementary Table 2online). We detected 41 known markers, such as ACE and ECE, in ratlung P but not in RLMVEC P. Overall, more than 180 (41%) proteinswere detected in rat lung P in vivo but not at all in RLMVEC P in vitro(see Supplementary Note online for additional discussion).
It is quite apparent through studying vasculogenesis, angiogenesisand the modulation of EC phenotype in culture and in vivo that ECmorphology, protein expression and function are affected greatly byphysical and molecular cues from the basement membrane, perivascularcells, circulating blood and even other cells deeper within the tis-sue3,10,17,29. EC isolation as well as standard, albeit limited, cell cultureconditions seem not to maintain the expression of proteins found invivo, which may have functional consequences. Here, we provide aglimpse of how wide the microenvironment-induced molecular differ-ences between ECs in vivo and in vitro can be. Of course, some of thesedifferences may relate to the derivation of the RLMVEC from one seg-ment of the pulmonary microvasculature (arterioles, capillaries andvenules) whereas rat lung P is primarily EC plasma membranes from allmicrovessel segments, which constitute >90% of the total vascular sur-face area. Obviously, more sophisticated culturing conditions areneeded to maintain proteins expressed in native tissue. Towards this end,our results begin to identify a set of promising tissue-modulated ECmarkers that can now be used to monitor future attempts to reproducenative EC phenotype in vitro and may contribute to a deeper under-standing of how the tissue environment controls EC phenotype.
We have described a large-scale proteomic analysis of in vivo vascularendothelium—more specifically, the luminal EC surface in lung tissue.Our identification of 450 proteins using rigorous criteria (more thanthree peptides) is an improvement over many proteomic analyses that
found similar numbers of proteins in whole cells, bacteria, yeast and tis-sue preparations but usually with less demanding selection criteria (oneto two peptides)30. Moreover, two MS analyses of whole cultured ECsrecently identified less than 60 proteins, including only a few proteinsfound here: hemoglobin, albumin, heat shock proteins, actin, nucle-ophosmin, vimentin and tubulins11,12. These studies did not identifyany cell surface enzymes or transmembrane proteins.
A more detailed understanding of the proteome of specialized celltypes may help elucidate how cells fulfill their biological function in asystems biological context. Differences in protein expression patternsbetween differentiated cells as well as changes occurring during diseaseare of great interest in experimental medicine for diagnosis and treat-ment. Cell surface mapping of normal lung endothelium in vivo and invitro is a necessary prelude to understanding the extent to which the tis-sue microenvironment can modulate EC function and protein expres-sion not only in normal tissues but also perhaps in diseases. Thisspecialized proteome may have value clinically because proteinsexpressed at this blood-tissue interface are accessible to the circulatingblood and may serve as targets for tissue-specific drug and gene deliveryin vivo29,31,32. The technology described here may help exploit such pos-sibilities in the future.
METHODSMaterials. Standard laboratory chemicals were high-performance liquid chro-matography (HPLC) grade or higher if available and purchased from VWRunless otherwise noted. Tris (2-carboxyethyl)-phosphine hydrochloride (TCEP)was obtained from Pierce. Iodoacetamide was obtained from Aldrich. Porozymebulk–immobilized trypsin was purchased from Applied Biosystems.Endoproteinase Lys-C was purchased from Roche Diagnostics. 3× cell lysis buffer(CLB) contains 6 M Urea, 0.5 M Trisbase, 9 mM EDTA, 3.6% β-mercaptoethanoland 9% SDS.
We obtained antibodies against the following: ACE, APN, caveolin-1,E-cadherin, Tie 2, PECAM and VE-cadherin from Santa Cruz Biotechnology;aquaporin-1, cytochrome C, ERp72, EEA1, eNOS, Lamp1, Lyn, P2X7, Ran,Transportin, CD26 and ZO-2 from BD Biosciences/Pharmingen; β-COP, fibrob-last surface protein, glycophorin A and p58K from Sigma; CD4 and CD11 fromSerotech; HSP47 from Stressgen Biotechnologies; RAGE from AffinityBioreagents; ECE from Zymed Lab; Trk-A from ABcam nucleolin from LeincoTechnologies. Antibodies against the following were kind gifts: carbonic anhy-drase IV from W.S. Sly, St. Louis University; NHERF-2 from E.J. Weinman,University of Maryland Hospital33; 5′ nucleotidase from Paul Luzio (Cambridge,England); seven transmembrane protein (Ig-hepta) from Shigehisa Hirose,Tokyo Institute of Technology (Yokohama, Japan)34; OX-45 from Neil Barclay,University of Oxford (Oxford, UK)35; Pincher from Simon Haleguola, StateUniversity of New York (Stony Brook, NY); podocalyxin, PV-1 and ICAM-1 wereproduced in house.
Animals. Sprague-Dawley male rats (150–250 g; Charles River Laboratories)were used unless otherwise indicated. Animal experiments were done in accor-dance with federal guidelines following review and approval by the InstitutionalAnimal Care and Use Committee.
Cell culture. Rat lung microvascular ECs (RLMVEC) were isolated and grown asdescribed originally36.
SDS page and western blot analysis. SDS PAGE and western blot analysis weredone as described previously18.
Tissue immunostaining. Frozen rat lung tissue was cut (5 µm) on a MicromHM505E cryomicrotome. Sections were fixed with neutral buffered formalin for5 min at 25 °C then incubated for 1 h at 25 °C in blocking solution (5% FBS, 0.1%Tween 20 in PBS). After a 2-h incubation at room temperature in primary anti-bodies (diluted in blocking solution), the sections were washed, treated with the biotin-conjugated secondary antibody (KPL Laboratories) for 1 h at 25 °C,washed again and treated with a streptavidin-conjugated horseradish peroxidase
990 VOLUME 22 NUMBER 8 AUGUST 2004 NATURE BIOTECHNOLOGY
©20
04 N
atur
e P
ublis
hing
Gro
up
http
://w
ww
.nat
ure.
com
/nat
ureb
iote
chno
logy
A RT I C L E S
(KPL Laboratories) for 1 h at 25 °C. Immune complexes were detected using aLiquid DAB staining kit from BioGenex. Sections were counterstained withhematoxylin, dehydrated, mounted in Permount (Fisher Scientific) and imageddigitally by light microscopy using a Nikon Eclipse E800 equipped with a Nikondigital camera DXM1200.
Production of polyclonal antibodies. Antigenicity predictions for HSPA12B andseptin homolog FLJ10849 were done with Lasergene (DNAStar) using the predic-tion methods of Margalite and Berzofsky, Rothbard and Taylor and JamesonWolf. Polyclonal antibodies in rabbit were produced for HSPA12B against thepeptide Ac-CGYTARDYYHDLDPEEAR-CONH2 and for FLJ10849 against thepeptide Ac-CQLLQSQAQQSGAQQTKKD-CONH2 by Biosource.
Isolation of luminal EC plasma membranes from rat lungs and RLMVEC. Theluminal EC plasma membranes were isolated directly from rat lung tissue or cellculture using a silica-coating procedure as described15,16. Briefly, a solution ofcationic colloidal silica particles was used to selectively coat the EC surface eitherby perfusing the lung vasculature via the pulmonary artery in situ or by overlay-ing RLMVEC confluent monolayers. After electrostatic cross-linking andquenching with polyacrylic acid to form a stable membrane pellicle, the tissue orcells were homogenized and the sheets of P are sedimented by two rounds ofultracentrifugation through high-density media away from all the other muchless dense tissue component in the lung homogenate or the total RLMVEC lysate(H). This subfractionation yielded a membrane pellet highly enriched in EC surface markers and markedly depleted of markers of other cell types and subcel-lular organelles15–19.
To ensure that we use consistently high-quality material, each lot of H and isolated P was subjected to rigorous quality control testing before analysis.Using standard immunoblotting, we required the purity level of plasma mem-branes in P relative to H to be at least 20-fold enriched in at least two EC surfacemarker proteins, such as caveolin, 5′-nucleotidase (5′NT), VE-cadherin-1,angiotensin converting enzyme (ACE) or endothelial nitric oxide synthase(eNOS). In addition, P had to be depleted by >20-fold relative to H in well-established organellar membrane markers, including nuclear (ran, transportin),endosomal (early endosome antigen 1 (EEA1)), Golgi (p58, β-COP), lysosomal(lamp1), mitochondrial (cytochrome c) and endoplasmic reticulum (ERp72).For rat lung P, we also required a >20-fold depletion in protein markers ofmembranes from other cell types present in lung or blood, including epithelialcells (E-cadherin), fibroblasts (FSP), white blood cells (CD11, CD4) and redblood cells (glycophorin A).
Preparation of enzymatic digest of protein mixtures for mass spectrometricanalysis. The proteins in P were solubilized using CLB before vortexing and boil-ing for 5 min. The protein concentration was determined by the micro BCA assayfrom Pierce. Silica particles were sedimented by centrifugation to collect the solu-bilized proteins in the supernatant, which was then precipitated with chloro-form/methanol and resolubilized in 8 M urea adjusted to pH 8.5 with 100 mMammonium bicarbonate. Protein disulfide bonds were reduced with 2.5 mM Tris(2-carboxyethyl)-phosphine hydrochloride (TCEP) for 15 min at 60 °C; car-boxyamidomethylated with 3.75 mM iodo acetamide for 15 min at 25 °C in thedark; digested by a first-site-specific enzymatic digestion with endoproteinaselys-C for 4 h at 37 °C, 1:100 (wt/wt); digested for a second time. After the proteinmixture was diluted to 1.6 M urea with 100 mM ammonium bicarbonate, pH 8.5,it was digested a second time with poroszyme-immobilized trypsin (10 µl/100 µgprotein) overnight at 37 °C (with agitation). The immobilized trypsin was thenremoved by centrifugation and the peptides in the supernatant concentrated bysolid phase extraction with SPEC-PLUS PTC18 cartridges (Ansys Diagnostics)following the manufacturer’s instructions. After lyophilizing the peptide mixtureto near dryness the samples were stored in sample buffer (5% acetonitrile, 0.3%formic acid) at a concentration of 5 µg/µl (calculated from the initial amount ofprotein) at –20 °C before mass spectrometric analysis.
MudPIT. In each experiment approximately 150 µg of complex peptide mixturewas separated by 2D LC. The first dimension was based on strong cationexchange and the second dimension on C18 reversed-phase hydrophobic interac-tion chromatography. Both chromatographic materials were packed seamlesslyinto a frittless microcolumn. A 5-µm tip was pulled on a fused-silica microcapil-
lary (100 µm inner dimension (i.d.) × 365 µm outer dimension (o.d.)) using aModel P-2000 laser puller (Sutter Instrument). The microcolumn was thenpacked with three phases of chromatographic material as follows: 8.5 cm of 5 µmC18 reversed-phase material (Polaris C18-A, Metachem), then 4 cm of 5 µm,300-Å strong cation exchanger (PolyLC) and lastly 3.5 cm of C18 material using ahelium pressure cell operated at 600–900 p.s.i. (Mass Evolution). After equilibrat-ing the microcapillary column with sample buffer, 30 µl of the complex peptidemixture (150 µg) was loaded off-line onto the microcapillary column which wasthen mounted onto a microcross (Upchurch Scientific) and placed in-line withan Agilent 1100 quaternary HPLC. Peptides were directly eluted into the massspectrometer using 2D LC with 18 step-elutions from the strong cation exchangerfollowed by a gradient elution of the reversed-phase material30. The buffer solu-tions used were: buffer A, 5% (vol/vol) acetonitrile and 0.1% (vol/vol) formicacid; buffer B, 80% (vol/vol) acetonitrile and 0.1 % (vol/vol) formic acid; bufferC, 500 mM ammonium acetate, 5% (vol/vol) acetonitrile and 0.1% (vol/vol)formic acid. Step 1 consisted of a 110-min gradient from 0 to 100% buffer B andwas followed by steps 2–18. Each step consisted of a 135-min gradient includingpregradient salt steps with increasing concentrations of ammonium acetate. Theprofile of steps 2–18 was: 5 min 100% buffer A; 3 min x% buffer C (x% corre-sponding to: 25, 37.5, 50, 58.5, 67, 75, 83.5, 91.5, 100, 125, 150, 175, 200, 225, 250and 500 mM ammonium acetate); 5 min 100% buffer A; a 5-min gradient to 15%buffer B; a 60-min gradient to 45% buffer B; a 32-min gradient to 100% buffer B;5 min 100% buffer B; a 10-min gradient to 100% buffer A; and 10 min isocraticre-equilibration at 100% buffer A. The 100 µl/min flow rate at the HPLC wasreduced 400-fold by a fused silica capillary (50 µm i.d., 365 µm o.d.) splitterplaced on the microcross.
Mass spectrometric measurements were done on a LCQ Deca XP ion trapmass spectrometer (ThermoFinnigan) equipped with a modified microelectro-spray ionization source from Mass Evolution. A spray voltage of 2.0 kV wasapplied precolumn at the liquid junction of the microcross as described37.Operation of the quaternary Agilent 1100 HPLC pump and the mass spectrome-ter was fully automated during the entire procedure using the Excalibur 1.2 datasystem (ThermoFinnigan). Continuous cycles of one full scan (m/z 400 to 1400)followed by three data-dependent MS/MS measurements at 35% normalized col-lision energy were done. MS/MS measurements were allowed for the three mostintense precursor ions with an enabled exclusion list of 25 m/z values (±1.5 Da) ora maximum time limit of 5 min. The zoom scan function to determine the chargestate was disabled to increase the duty cycle of the instrument.
Database search and analysis of tandem mass spectra. MS/MS spectra wereextracted from raw files requiring a minimum of 21 signals with an intensity of atleast 7.5 × 10⁴ arbitrary units. Extracted MS/MS spectra were automaticallyassigned to the best matching peptide sequence using the SEQUEST algorithm38
and the Sequest Browser software package (ThermoFinnigan). SEQUESTsearches were done on independent dual processor (2.0–2.6 GHz) personal com-puters against a rat protein database containing 40,800 protein sequences down-loaded as FASTA-formatted sequences from Entrez (NCBI; http://www.ncbi.nlm.nih.gov/entrez). Sequence redundancies were removed using Perl script. Toincrease the search speed the protein database was preprocessed to create a binarydatabase containing all possible tryptic peptides of the searched database. Anystatic and dynamic modifications that would account for post-translational andchemical modifications were neglected. The peptide mass search tolerance wasset to 3 Da. Spectral matches were retained with a minimal cross-correlationscore (XCorr) of 1.5, 2.2 and 3.3 for charge states +1, +2 and +3 respectively.DeltaCN (top match’s XCorr minus the second-best match’s XCorr divided bytop match’s XCorr) had to be ≥0.07. Retained spectral matches were filtered andreassigned to proteins using DTASelect39. DTASelect outputs of independentmeasurements were entered into Accessible Vascular Targets database (AVATAR).AVATAR was designed to store a large amount of mass spectrometric data and toprovide tools to analyze the data to extract valuable information. We used rela-tional models for database design based on Entity-Relationship and implemen-ted the database in the MySQL relational database management system to supportdatabase query and management. This relational database plus Perl-based user-friendly interface have greatly improved data organization, data consistency andintegrity, and facilitated data comparison and information retrieval. To increasecoverage of known EC markers in some of the analysis, we also used a larger data-base containing over 200,000 protein sequences (human, mouse and rat).
NATURE BIOTECHNOLOGY VOLUME 22 NUMBER 8 AUGUST 2004 991
©20
04 N
atur
e P
ublis
hing
Gro
up
http
://w
ww
.nat
ure.
com
/nat
ureb
iote
chno
logy
A RT I C L E S
Removal of protein redundancy. AVATAR allowed a detailed analysis of parame-ters such as reproducibility and combined sequence coverage. The final proteinlist created from all peptide sequences obtained by MS/MS was compiled usingAVATAR to retrieve the minimum number of proteins identified by three or morepeptide spectra. If multiple entries of the same protein from different species(that is, mouse and human) other than rat were present only the species with thebetter spectrum coverage was manually retained. If it was not unambiguouslypossible to distinguish multiple isoforms or splice variants of a protein beingassigned to the same set of peptides from each other, we manually reduced thislist to one primary entry.
Analysis of the reproducibility of MudPIT measurements. Twelve independent18-step MudPIT experiments of rat lung P sample were statistically analyzed toevaluate the benefit of repetitive MudPIT measurements. After each additionalexperiment we determined the fraction of proteins that were represented in atleast two experiments and the percentages of proteins that were present in onlyone single experiment. Because this analysis can depend on the sequence bywhich the experiments are analyzed, we limited potential bias from any particularorder of experiments by analyzing 12 different experiment sequences where theorder of the experiments was systematically permutated by shifting the firstexperiment to the last position.
In silico protein analysis. The molecular weights and pIs of each protein based onits primary amino acid sequence were calculated using the Expasy web server(http://us.expasy.org/tools/pi_tool.html). The actual molecular weights and pIsmay differ slightly from the calculated values because post-translational modifi-cations are not considered by the program at this time. SwissProt(http://us.expasy.org/sprot/sprot-top.html) and the National Center Biotech-nology Information (NCBI; http://www.ncbi.nlm.nih.gov/entrez/query.fcgi)protein and literature databases were used to classify proteins according to theircurrently known predominant subcellular location. Known or predicted trans-membrane-spanning alpha helices were determined through the literature or byusing the web-based prediction program TMHMM v2.0 (provided by the Centerfor Biological Sequence Analysis of the Technical University in Denmark,http://www.cbs.dtu.dk/services/TMHMM-2.0). Only 100% probabilities weretaken into consideration. Searches for protein families and hidden Markov mod-els were done using pfam (http://www.sanger.ac.uk/software/pfam/index.html).
Note: Supplementary information is available on the Nature Biotechnology website.
ACKNOWLEDGMENTSWe thank Michelle Bourne, Lisa Randall and Traci Smith for technical assistance;David Tabb for help setting up DTASelect; and Yan Li for helpful discussion. Thisresearch was supported by grants to J.E.S from the National Institutes of Health(Heart, Lung and Blood nos. R01 HL52766, R01 HL58216), National CancerInstitute (no. R01 CA83989, R24 CA095893, R33 CA97528), Sidney Kimmel,Schutz Foundation, California Tobacco-related Disease Research Program (no.11RT-0167) and California Breast Cancer Research Program (no. 8WB-00114).
COMPETING INTERESTS STATEMENTThe authors declare that they have no competing financial interests.
Received 19 December 2003; accepted 13 May 2004Published online at http://www.nature.com/naturebiotechnology/
1. Schnitzer, J.E. Update on the cellular and molecular basis of capillary permeability.Trends Cardiovasc. Med. 3, 124–130 (1993).
2. Michiels, C. Endothelial cell functions. J. Cell. Physiol. 196, 430–443 (2003).3. Madri, J.A. & Williams, S.K. Capillary endothelial cell culture: Phenotype modulation
by matrix components. J. Cell Biol. 97, 153–165 (1983).4. Goerdt, S. et al. Characterization and differential expression of an endothelial cell-
specific surface antigen in continuous and sinusoidal endothelial, in skin vascularlesions and in vitro. Exp. Cell Biol. 57, 185–192 (1989).
5. Gumkowski, F., Kaminska, G., Kaminski, M., Morrissey, L.W. & Auerbach, R.Heterogeneity of mouse vascular endothelium. Blood Vessels 24, 11–23 (1987).
6. Aird, W.C. et al. Vascular bed-specific expression of an endothelial cell gene is pro-grammed by the tissue microenvironment. J. Cell Biol. 138, 1117–1124 (1997).
7. Janzer, R.C. & Raff, M.C. Astrocytes induce blood-brain barrier properties in endothe-lial cells. Nature 325, 253–257 (1987).
8. Stewart, P.A. & Wiley, M.J. Developing nervous tissue induces formation of blood-brain barrier characteristics in invading endothelial cells: a study using quail-chicktransplantation chimeras. Dev. Biol. 84, 183–192 (1981).
9. Auerbach, R., Alby, L., Morrissey, L.W., Tu, M. & Joseph, J. Expression of organ-spe-cific antigens on capillary endothelial cells. Microvasc. Res. 29, 401–411 (1985).
10. St. Croix, B. et al. Genes expressed in human tumor endothelium. Science 289,1197–1202 (2000).
11. Obermeyer, N., Janson, N., Bergmann, J., Buck, F. & Ito, W.D. Proteome analysis ofmigrating versus nonmigrating rat heart endothelial cells reveals distinct expressionpatterns. Endothelium 10, 167–178 (2003).
12. Bruneel, A. et al. Proteomic study of human umbilical vein endothelial cells in cul-ture. Proteomics 3, 714–723 (2003).
13. Pasqualini, R. & Ruoslahti, E. Organ targeting in vivo using phage display peptidelibraries. Nature 380, 364–366 (1996).
14. Rajotte, D. et al. Molecular heterogeneity of the vascular endothelium revealed by invivo phage display. J. Clin. Invest. 102, 430–437 (1998).
15. Schnitzer, J.E., McIntosh, D.P., Dvorak, A.M., Liu, J. & Oh, P. Separation of caveolaefrom associated microdomains of GPI-anchored proteins. Science 269, 1435–1439(1995).
16. Oh, P. & Schnitzer, J. E. Isolation and subfractionation of plasma membranes topurify caveolae seperately from glycosyl-phosphatidylinositol-anchored proteinmicrodomain in Cell Biology: A Laboratory Handbook, vol. 2 (ed. Celis, J..) 34–45(Academic Press, Orlando, 1998).
17. Rizzo, V., Morton, C., DePaola, N., Schnitzer, J.E. & Davies, P.F. Recruitment ofendothelial caveolae into mechanotransduction pathways by flow conditioning invitro. Am. J. Physiol. Heart Circ. Physiol. 285, H1720–H1729 (2003).
18. Schnitzer, J.E., Liu, J. & Oh, P. Endothelial caveolae have the molecular transportmachinery for vesicle budding, docking, and fusion including VAMP, NSF, SNAP,annexins, and GTPases. J. Biol. Chem. 270, 14399–14404 (1995).
19. Schnitzer, J.E. & Oh, P. Aquaporin-1 in plasma membrane and caveolae providesmercury-sensitive water channels across lung endothelium. Am. J. Physiol. 270,H416–H422 (1996).
20. Schnitzer, J.E. & Oh, P. Antibodies to SPARC inhibit albumin binding to SPARC,gp60, and microvascular endothelium. Am. J. Physiol. 263, H1872–H1879 (1992).
21. Wolters, D.A., Washburn, M.P. & Yates, J.R., III. An automated multidimensional pro-tein identification technology for shotgun proteomics. Anal. Chem. 73, 5683–5690(2001).
22. Jeffries, W.A. et al. Transferrin receptor on endothelium of brain capillaries. Nature312, 162–163 (1984).
23. Schnitzer, J.E. & Oh, P. Albondin-mediated capillary permeability to albumin.Differential role of receptors in endothelial transcytosis and endocytosis of native andmodified albumins. J. Biol. Chem. 269, 6072–6082 (1994).
24. Schnitzer, J.E. gp60 is an albumin-binding glycoprotein expressed by continuousendothelium involved in albumin transcytosis. Am. J. Physiol. 262, H246–H254(1992).
25. Christian, S. et al. Nucleolin expressed at the cell surface is a marker of endothelialcells in angiogenic blood vessels. J. Cell Biol. 163, 871–878 (2003).
26. Negrutskii, B.S. & El’skaya, A.V. Eukaryotic translation elongation factor 1 alpha:structure, expression, functions, and possible role in aminoacyl-tRNA channeling.Prog. Nucleic Acid Res. Mol. Biol. 60, 47–78 (1998).
27. Honscha, W., Ottallah, M., Kistner, A., Platte, H. & Petzinger, E. A membrane-boundform of protein disulfide isomerase (PDI) and the hepatic uptake of organic anions.Biochim. Biophys. Acta 1153, 175–183 (1993).
28. Hebert, C. et al. Cell surface colligin/Hsp47 associates with tetraspanin protein CD9in epidermoid carcinoma cell lines. J. Cell. Biochem. 73, 248–258 (1999).
29. Schnitzer, J. The endothelial cell surface and caveolae in health and disease. inVascular Endothelium: Physiology, Pathology and Therapeutic Opportunities (eds.Born, G.V.R. & Schwartz, C.J.) 77–95 (1997).
30. Washburn, M.P., Wolters, D. & Yates, J.R. III. Large-scale analysis of the yeast pro-teome by multidimensional protein identification technology. Nat. Biotechnol. 19,242–247 (2001).
31. McIntosh, D.P., Tan, X.Y., Oh, P. & Schnitzer, J.E. Targeting endothelium and itsdynamic caveolae for tissue-specific transcytosis in vivo: a pathway to overcome cellbarriers to drug and gene delivery. Proc. Natl. Acad. Sci. USA 99, 1996–2001(2002).
32. Carver, L.A. & Schnitzer, J.E. Caveolae: mining little caves for new cancer targets.Nat. Rev. Cancer 3, 571–581 (2003).
33. Weinman, E.J., Steplock, D. & Shenolikar, S. Acute regulation of NHE3 by proteinkinase A requires a multiprotein signal complex. Kidney Int. 60, 450–454 (2001).
34. Abe, J., Suzuki, H., Notoya, M., Yamamoto, T. & Hirose, S. Ig-hepta, a novel memberof the G protein-coupled hepta-helical receptor (GPCR) family that has immunoglob-ulin-like repeats in a long N-terminal extracellular domain and defines a new subfam-ily of GPCRs. J. Biol. Chem. 274, 19957–19964 (1999).
35. van der Merwe, P.A. et al. The NH2-terminal domain of rat CD2 binds rat CD48 witha low affinity and binding does not require glycosylation of CD2. Eur. J. Immunol. 23,1373–1377 (1993).
36. Magee, J.C., Stone, A.E., Oldham, K.T. & Guice, K.S. Isolation, culture, and charac-terization of rat lung microvascular endothelial cells. Am. J. Physiol. 267,L433–L441 (1994).
37. Link, A.J. et al. Direct analysis of protein complexes using mass spectrometry. Nat.Biotechnol. 17, 676–682 (1999).
38. Eng, J. & McCormac, A. & Yates, J.R. An approach to correlate tandem mass spectraldata of peptides with amino acid sequences in a protein database. J. Am. Soc. MassSpectrom. 5, 976–989 (1994).
39. Tabb, D.L., McDonald, W.H. & Yates, J.R. III. DTASelect and Contrast: tools forassembling and comparing protein identifications from shotgun proteomics. J.Proteome Res. 1, 21–26 (2002).
992 VOLUME 22 NUMBER 8 AUGUST 2004 NATURE BIOTECHNOLOGY
©20
04 N
atur
e P
ublis
hing
Gro
up
http
://w
ww
.nat
ure.
com
/nat
ureb
iote
chno
logy