Embed Size (px)
Citation preview

1
DIRECT TESTIMONY OF
MATTHEW W. TANNER, Ph.D.
ON BEHALF OF
SOUTH CAROLINA ELECTRIC & GAS COMPANY
DOCKET NO. 2019-2-E
TABLE OF CONTENTS 1
Description Starting Page No. 2
Introduction 2 3
Purpose and Summary of Testimony 4 4
Variable Integration Cost Study Background 5 5
Variable Integration Cost Study Results Summary 10 6
Variable Integration Cost Study Methodology 11 7
Variable Integration Cost Study Conclusions 22 8
9
Exhibits 10
Resume of Dr. Matthew W. Tanner MWT-1 11
Cost of Variable Integration for SCE&G Study MWT-2 12
ELECTR
ONICALLY
FILED-2019
February84:03
PM-SC
PSC-D
ocket#2019-2-E
-Page1of62

2
INTRODUCTION 1
Q. PLEASE STATE YOUR NAME, POSITION, AND BUSINESS 2
ADDRESS. 3
A. My name is Matthew W. Tanner. I have been employed by Navigant 4
Consulting Inc. (“Navigant”) since 2012, where I currently am a Director in 5
the company’s Energy Practice. My business address is 1200 19th St. NW, 6
Suite 700, Washington, DC 20036. 7
8
Q. PLEASE SUMMARIZE YOUR EDUCATION AND EXPERIENCE. 9
A. After graduating from Princeton University in 2004 with a Bachelor 10
of Science in Engineering degree in Operations Research and Financial 11
Engineering, I earned a Ph.D. in Industrial Engineering from Texas A&M 12
University in 2009. I have over 10 years’ experience in power systems 13
modeling, economic analysis, utility resource planning, and Monte-Carlo 14
simulation, which is a method to test a large number of random scenarios to 15
evaluate the risk of an event occurring. My experience also includes 16
evaluation of conventional and variable energy resources across North 17
America and internationally, and the impact of these sources on electric 18
reliability and cost of supply. A copy of my curriculum vitae listing my 19
professional credentials and experience is attached as Exhibit No. ___ 20
(MWT-1). 21
ELECTR
ONICALLY
FILED-2019
February84:03
PM-SC
PSC-D
ocket#2019-2-E
-Page2of62

3
At Navigant, I lead our Wholesale Energy Markets group within our 1
Energy & Capital Markets offering. I am responsible for advising utilities, 2
state regulatory commissions, Independent System Operators (“ISOs”), 3
developers, and other market participants on resource planning and strategy 4
under uncertainty. I also have led and supported multiple projects helping 5
utilities and ISOs understand the challenges and changing requirements for 6
power system resources as variable energy resource penetration increases. 7
Navigant regularly consults for electric municipal and cooperative utilities, 8
in addition to state and federal agencies. As a matter of practice, Navigant is 9
committed to maintaining an independent and unbiased approach to its 10
engagements. 11
12
Q. HAVE YOU PREVIOUSLY TESTIFIED AS AN EXPERT WITNESS 13
BEFORE REGULATORY COMMISSIONS? 14
A. Yes. Although I have not previously testified before the Public 15
Service Commission of South Carolina (“Commission”), I have testified as 16
an expert witness before regulatory commissions in other states on topics 17
including variable energy resource integration and load variability. 18
19
ELECTR
ONICALLY
FILED-2019
February84:03
PM-SC
PSC-D
ocket#2019-2-E
-Page3of62

4
PURPOSE AND SUMMARY OF TESTIMONY 1
Q. WHAT IS THE SCOPE AND PURPOSE OF YOUR TESTIMONY? 2
A. The purpose of my testimony is to provide background and discuss 3
the findings and conclusions contained in the February 2019 Navigant study 4
titled “Cost of Variable Integration” (the “Study”) that was prepared on 5
behalf of South Carolina Electric & Gas Company (“SCE&G” or the 6
“Company”). A copy of the Study is attached to my testimony as Exhibit No. 7
__ (MWT-2). 8
9
Q. HOW HAVE YOU ORGANIZED YOUR TESTIMONY? 10
A. My testimony is organized as follows: 11
• First, I provide background on the key concepts and definitions that 12
are useful to understanding the operating challenges that variable 13
generation causes for utilities and how mitigating those challenges 14
adds costs. 15
• Next, I summarize the results of the Study. 16
• I then explain the methodology Navigant used to develop the 17
estimates of variable generation uncertainty, the analysis of the 18
additional required reserves, and the forecast of the additional system 19
cost from maintaining these reserves. 20
• Finally, I explain in greater detail the results of the Study and how 21
Navigant developed the conclusions. 22
ELECTR
ONICALLY
FILED-2019
February84:03
PM-SC
PSC-D
ocket#2019-2-E
-Page4of62

5
VARIABLE INTEGRATION COST STUDY BACKGROUND 1
Q. ARE THERE CERTAIN TERMS AND CONCEPTS THAT ARE 2
USEFUL TO UNDERSTAND THE OPERATING CHALLENGES 3
AND COSTS FOR INTEGRATING VARIABLE GENERATION ON 4
THE SCE&G SYSTEM? 5
A. Yes. As part of my testimony, I use certain terms and concepts based 6
upon the below descriptions and definitions: 7
• “Operating Reserves” means the capability of the electric system to 8
quickly increase generation either by turning on quick-start electric 9
generating units or ramping up the generating output of units that are 10
currently online but not operating at full capacity. Available operating 11
reserves are calculated in terms of how much additional generation is 12
available in a given period of time. Operating reserves are needed by 13
an electric system in order to respond to unexpected drops in 14
generation or unexpected increases in load. 15
• “Variable Integration Cost” is the increase in costs to an electric 16
system as a result of the need to react to unexpected changes in 17
renewable generation. 18
• “Renewable Forecast Error” is the variance between the planned 19
renewable generation and the actual renewable generation. 20
• “Plant Cycling” is the act of turning an electric generating plant on 21
and off in response to the need to meet load. 22
ELECTR
ONICALLY
FILED-2019
February84:03
PM-SC
PSC-D
ocket#2019-2-E
-Page5of62

6
• “Quick-start Resource” is an electric generating plant that can turn on 1
quickly allowing it to provide operating reserves even when offline. 2
• “Ramp Up/Down” is the act of increasing or decreasing generation at 3
an electric generating plant. 4
• “Production Cost Model” is a class of energy system models designed 5
to simulate detailed system operation and costs over time. 6
7
Q. WHAT IS THE SCOPE AND PURPOSE OF THE STUDY? 8
A. Navigant conducted the Study in order to estimate the impacts that 9
solar installations will have on SCE&G’s system operations and to determine 10
the resulting incremental costs. The Study evaluated the Variable Integration 11
Costs for three different scenarios of solar generation installed on the system. 12
These scenario assumptions were developed to generally correspond to the 13
potential nameplate facility rating of solar facilities interconnected with or to 14
be interconnected with the Company’s system, as described by Company 15
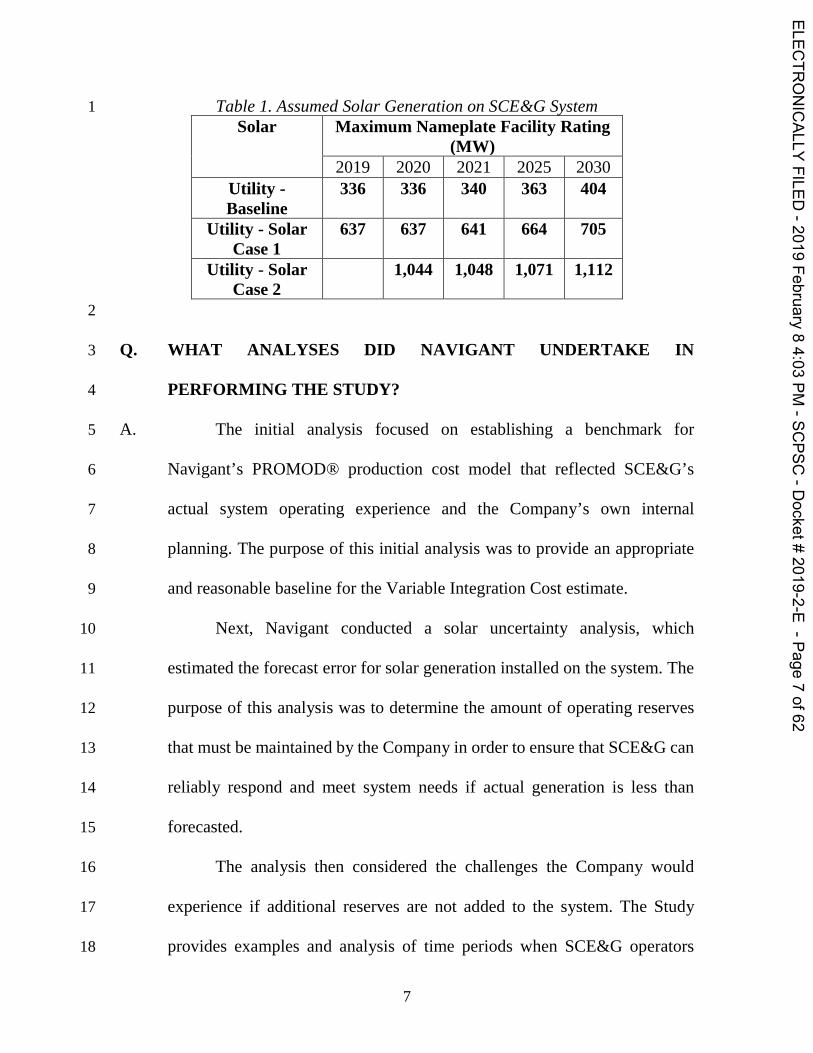
Witness Eric Bell.1 The specifics of the Study scenarios are shown in Table 16
1 below: 17
18
1 As discussed later in my direct testimony, the baseline scenario is conservative as more solar generation than assumed is already installed on the SCE&G system by December 31, 2018. In addition, based on the amount of additional utility-scale solar generation under construction and under contract with the Company, the amount of additional utility-scale solar generation SCE&G anticipates will be interconnected with its system by the end of 2019 and 2020 exceed the estimates used for analyzing Solar Case 1 and Solar Case 2.
ELECTR
ONICALLY
FILED-2019
February84:03
PM-SC
PSC-D
ocket#2019-2-E
-Page6of62
7
Table 1. Assumed Solar Generation on SCE&G System 1 Solar Maximum Nameplate Facility Rating
(MW) 2019 2020 2021 2025 2030
Utility - Baseline
336 336 340 363 404
Utility - Solar Case 1
637 637 641 664 705
Utility - Solar Case 2
1,044 1,048 1,071 1,112
2
Q. WHAT ANALYSES DID NAVIGANT UNDERTAKE IN 3
PERFORMING THE STUDY? 4
A. The initial analysis focused on establishing a benchmark for 5
Navigant’s PROMOD® production cost model that reflected SCE&G’s 6
actual system operating experience and the Company’s own internal 7
planning. The purpose of this initial analysis was to provide an appropriate 8
and reasonable baseline for the Variable Integration Cost estimate. 9
Next, Navigant conducted a solar uncertainty analysis, which 10
estimated the forecast error for solar generation installed on the system. The 11
purpose of this analysis was to determine the amount of operating reserves 12
that must be maintained by the Company in order to ensure that SCE&G can 13
reliably respond and meet system needs if actual generation is less than 14
forecasted. 15
The analysis then considered the challenges the Company would 16
experience if additional reserves are not added to the system. The Study 17
provides examples and analysis of time periods when SCE&G operators 18
ELECTR
ONICALLY
FILED-2019
February84:03
PM-SC
PSC-D
ocket#2019-2-E
-Page7of62
8
would experience insufficient amounts of resources that would be needed to 1
maintain system reliability. 2
Finally, the Study estimated the Company’s cost to maintain 3
additional reserves necessary to integrate the variable energy generated by 4
solar facilities. It also includes an analysis of the potential and cost to add 5
new resources to the system as an alternative mitigation option. 6
7
Q. HOW DOES THE VARIABILITY OF SOLAR GENERATION 8
CAUSE ADDITIONAL OPERATING ISSUES FOR SCE&G? 9
A. The amount of solar energy that can be generated is significantly 10
impacted by and dependent on the weather. Therefore, there is inherent 11
uncertainty in how much electricity is actually generated by solar generating 12
facilities. In order to operate a safe and reliable electric system, SCE&G 13
operators must closely match generation and load at all times. If there is 14
forecast error and less solar generation than expected, then SCE&G must 15
have the ability to ramp up other generating facilities to replace the lost solar 16
energy. 17
This ability to ramp up generation over a given time period is a 18
component of operating reserves. Operating reserves are maintained either 19
by keeping generators online but operating at less than their full capacity or 20
by maintaining quick-start generating resources. SCE&G operators also have 21
ELECTR
ONICALLY
FILED-2019
February84:03
PM-SC
PSC-D
ocket#2019-2-E
-Page8of62

9
to balance the need to meet its load and to maintain sufficient operating 1
reserves with the goal of operating its system at a reasonable minimum cost. 2
3
Q. HOW DOES SOLAR GENERATION RESULT IN ADDITIONAL 4
COST TO SCE&G’S SYSTEM? 5
A. When solar generation is added to the system, SCE&G’s operators 6
must maintain additional operating reserves in order to ensure that if less 7
solar generates than expected, the system can respond. This adds cost by one 8
of two mechanisms: 9
• The system operation must be changed from its previous minimum 10
cost schedule and operate less efficiently so that additional operating 11
reserves are available to meet unanticipated changes in solar 12
generation, thereby increasing variable operating costs. 13
• The Company must add new resources to its system to maintain 14
sufficient operating reserves to meet these needs, resulting in 15
additional capital cost expenditures. 16
17
Q. HOW ARE THESE COSTS DIFFERENT FROM THOSE 18
ESTIMATED IN THE PR-1 AND PR-2 AVOIDED COST 19
CALCULATIONS? 20
A. The PR-1 and PR-2 avoided cost calculations described in Company 21
Witness James Neely’s testimony reflect the change in SCE&G’s costs from 22
ELECTR
ONICALLY
FILED-2019
February84:03
PM-SC
PSC-D
ocket#2019-2-E
-Page9of62
10
adding solar to the system as if the solar generation forecast was 100% 1
reliable. By comparison, the Navigant Study evaluates the additional 2
integration costs incurred by SCE&G to ensure the Company can reliably 3
operate its system considering the potential for solar forecast error. In this 4
Study, Navigant was careful to design the Study methodology and analysis 5
to be consistent with the PR-1 and PR-2 avoided cost methodology and 6
prevent double counting of SCE&G costs. 7
8
Q. HAVE OTHER UTILITIES ESTIMATED THE INTEGRATION 9
COST FOR VARIABLE GENERATION? 10
A. Yes. In recent years, other utilities including Duke Energy Progress, 11
Duke Energy Carolinas, PacifiCorp, and Idaho Power, have estimated 12
variable integration costs on their systems. Additionally, ISOs such as 13
NYISO and PJM have conducted variable integration studies to understand 14
what operation impacts (such as additional ancillary service procurement) 15
might be needed to ensure reliability given increasing levels of variable 16
generation on the system. 17
18
VARIABLE INTEGRATION COST STUDY RESULTS SUMMARY 19
Q. WHAT ARE THE STUDY’S FINDINGS AND CONCLUSIONS? 20
A. Navigant’s findings and conclusions can be summarized as follows: 21
ELECTR
ONICALLY
FILED-2019
February84:03
PM-SC
PSC-D
ocket#2019-2-E
-Page10
of62

11
• The solar generation being added to SCE&G’s system is a variable 1
resource and adds uncertainty to the generation needed from the rest 2
of the system. 3
• SCE&G needs to maintain additional operating reserves in order to 4
ensure that load and current reserve obligations are met. Without these 5
additional operating reserves, there will be an unacceptable number 6
of hours where SCE&G will face a shortfall in its available operating 7
reserves. 8
• The levelized cost of maintaining additional operating reserves is 9
$3.96/MWh for Solar Case 2. 10
• Adding additional resources such as battery storage or quick-start gas 11
combustion turbines will not reduce integration costs for solar due to 12
the additional capital cost currently required for these facilities. 13
14
VARIABLE INTEGRATION COST STUDY METHODOLOGY 15
Q. WHAT APPROACH DID NAVIGANT FOLLOW TO DERIVE ITS 16
FINDINGS AND CONCLUSIONS? 17
A. A detailed description of the Study assumptions and methodology are 18
provided in the report attached to my testimony as Exhibit No. ___ (MWT-19
2). The key aspects of the approach are summarized as follows: 20
1. Navigant benchmarked its PROMOD® production cost model to 21
SCE&G’s system using information provided by the Company in 22
ELECTR
ONICALLY
FILED-2019
February84:03
PM-SC
PSC-D
ocket#2019-2-E
-Page11
of62

12
order to provide a baseline for the analysis. The baseline for each solar 1
penetration scenario reflects system operation without requiring any 2
additional reserves to be maintained. 3
2. The solar forecast uncertainty was estimated by comparing solar 4
forecasts with actual solar generation from the National Renewable 5
Energy Lab’s solar integration dataset. Solar forecast uncertainty was 6
calculated as the variance of the 15-minute average of actual solar 7
generation from the 4 hour-ahead forecast. Using this information, 8
Navigant calculated the probability of how much less than expected 9
solar facilities actually generate, which varies depending on the 10
forecasted level of solar generation. 11
3. Navigant forecasted the challenges to SCE&G system operation as a 12
result of this variability in solar generation by determining the hours 13
in which system operators would be unable to maintain the current 14
required level of reserves if solar missed its forecast by the amount 15
estimated in step 2 described above. The hours demonstrate that 16
SCE&G needs to maintain additional reserves to safely and reliably 17
operate its electric system in light of the variability in solar generation. 18
4. The level of additional reserves that SCE&G needs to maintain was 19
calculated as the maximum amount per day that solar could 20
underproduce the forecasted amount. 21
ELECTR
ONICALLY
FILED-2019
February84:03
PM-SC
PSC-D
ocket#2019-2-E
-Page12
of62

13
5. Using PROMOD®, Navigant simulated system operation and 1
production costs with additional reserves maintained by SCE&G. The 2
difference in production costs is the integration costs attributable to 3
the solar generation. Navigant then levelized the solar generation 4
integration costs to create a $/MWh value. 5
6. Navigant evaluated the effect of adding battery storage and gas 6
combustion turbines to SCE&G’s system as alternative mitigation 7
options in order to determine whether adding these types of resources 8
could reduce the Company’s system costs instead of simply 9
maintaining operating reserves based on SCE&G’s current resource 10
mix. 11
12
Q. PLEASE DESCRIBE PROMOD®. 13
A. PROMOD® is a widely-used industry-standard production cost 14
model developed and licensed by ABB Ventyx. The PROMOD® modeling 15
software is programmed to develop a low-cost energy supply solution for 16
system load while also providing the required level of operating reserves and 17
regulation. PROMOD® then simulates the balancing of resources to load on 18
an hourly basis in order to generate a time-series optimized portfolio or unit 19
commitment and dispatch optimization. In this manner, PROMOD® is able 20
to simulate varying levels of resources, loads, or reserve requirements and to 21
examine the cost impact of each change. 22
ELECTR
ONICALLY
FILED-2019
February84:03
PM-SC
PSC-D
ocket#2019-2-E
-Page13
of62
14
As part of this analysis, PROMOD® also considers physical 1
constraints of generation and fuel, emissions constraints, and reserve 2
requirements. The software takes into account the operational advantages 3
and disadvantages of each generation type and quantifies the cost impact of 4
forcing operation away from the most economical way in which to operate 5
the system. 6
7
Q. WHAT ASSUMPTIONS DID NAVIGANT USE REGARDING THE 8
AMOUNT OF SOLAR GENERATION ON SCE&G’S SYSTEM? 9
A. In conducting the Study, Navigant considered three different 10
scenarios which represent potential amounts of solar penetration that, at the 11
time the Study was commissioned and as further described in the direct 12
testimony of Company Witness Eric Bell, SCE&G expected it would 13
experience on its system over the next few years. 14
The Baseline scenario is based on an estimate of the level of solar 15
generation expected to be installed on the Company’s system by the end of 16
2018. The Solar Case 1 is based on the solar facilities expected under the 17
Baseline scenario as well as solar facilities currently under construction and 18
anticipated to come online by the end of 2019. The Solar Case 2 is based on 19
the amount of solar expected under the Baseline scenario, Solar Case 1, and 20
the amount of solar generation that currently is not under construction but is 21
ELECTR
ONICALLY
FILED-2019
February84:03
PM-SC
PSC-D
ocket#2019-2-E
-Page14
of62
15
expected to be added to SCE&G’s system by the end of 2020 pursuant to 1
signed power purchase agreements. 2
3
Q. HOW DO THE ASSUMPTIONS USED BY NAVIGANT IN 4
CONDUCTING THE STUDY COMPARE TO SCE&G’s ACTUAL 5
EXPERIENCE? 6
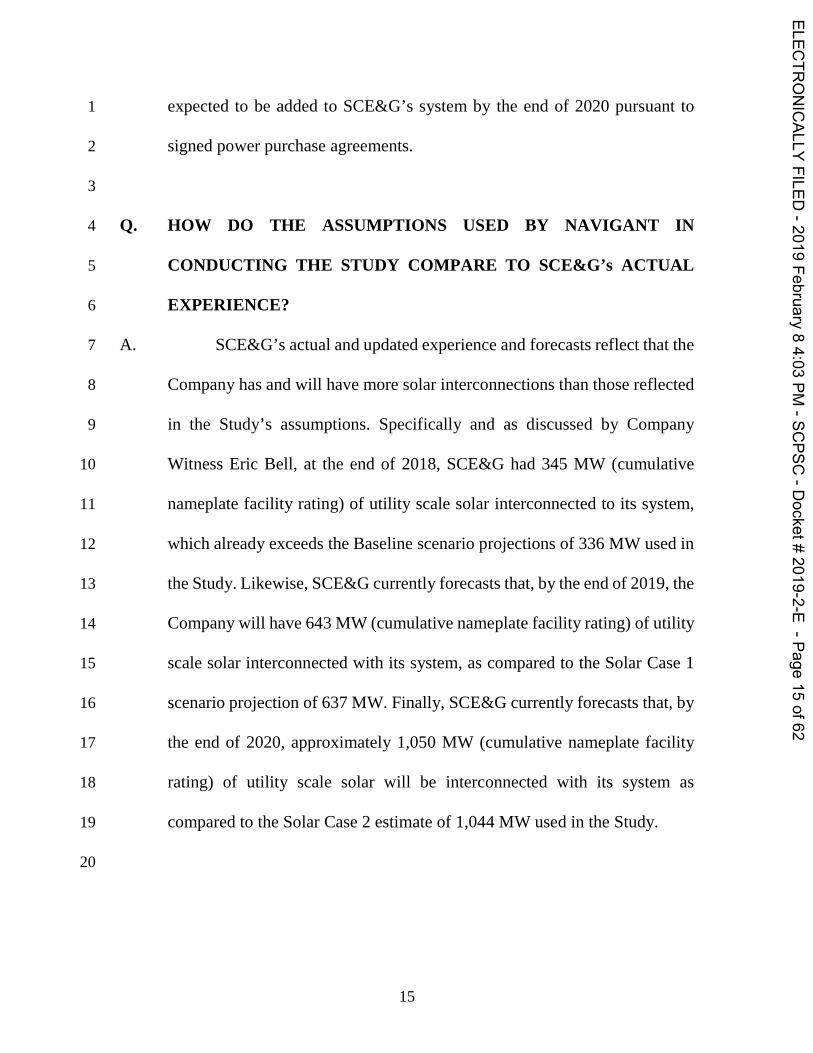
A. SCE&G’s actual and updated experience and forecasts reflect that the 7
Company has and will have more solar interconnections than those reflected 8
in the Study’s assumptions. Specifically and as discussed by Company 9
Witness Eric Bell, at the end of 2018, SCE&G had 345 MW (cumulative 10
nameplate facility rating) of utility scale solar interconnected to its system, 11
which already exceeds the Baseline scenario projections of 336 MW used in 12
the Study. Likewise, SCE&G currently forecasts that, by the end of 2019, the 13
Company will have 643 MW (cumulative nameplate facility rating) of utility 14
scale solar interconnected with its system, as compared to the Solar Case 1 15
scenario projection of 637 MW. Finally, SCE&G currently forecasts that, by 16
the end of 2020, approximately 1,050 MW (cumulative nameplate facility 17
rating) of utility scale solar will be interconnected with its system as 18
compared to the Solar Case 2 estimate of 1,044 MW used in the Study. 19
20
ELECTR
ONICALLY
FILED-2019
February84:03
PM-SC
PSC-D
ocket#2019-2-E
-Page15
of62
16
Q. HOW DOES THIS GREATER AMOUNT OF SOLAR GENERATION 1
CURRENTLY INTERCONNECTED AND FORECASTED TO BE 2
INTERCONNECTED WITH THE COMPANY’S SYSTEM IMPACT 3
THE RESULTS OF THE STUDY? 4
A. As more solar generation is interconnected with the Company’s 5
system, SCE&G will experience an increasing amount of Variable 6
Integration Costs. Accordingly, the Variable Integration Costs estimated in 7
the Study are lower than SCE&G will actually experience based upon the 8
amount of solar generation currently interconnected and expected to be 9
interconnected with its system. Therefore, the Variable Integration Costs 10
estimated in the Study are conservative. 11
12
Q. PLEASE DESCRIBE THE IMPACT OF GEOGRAPHIC DIVERSITY 13
OF RENEWABLE RESOURCES AND THE IMPORTANCE OF 14
INCLUDING IT IN THE STUDY. 15
A. The concept of geographic diversity recognizes that solar generation 16
is not located in a single area, but in different places throughout a system. 17
Since weather can vary significantly between locations, even within a 18
relatively compact service territory, geographic diversity means that there is 19
variability in how different solar installations can change their generation 20
output at any given time. 21
ELECTR
ONICALLY
FILED-2019
February84:03
PM-SC
PSC-D
ocket#2019-2-E
-Page16
of62
17
It is critical to incorporate geographic diversity in an integration cost 1
study because it has the effect of reducing the total amount of uncertainty 2
facing SCE&G. Without considering geographic diversity, the estimated 3
integration costs would be too high. 4
5
Q. WHAT LEVELS OF OPERATING RESERVES DID NAVIGANT 6
STUDY FOR EACH OF THE SOLAR PENETRATION SCENARIOS 7
AND WHY? 8
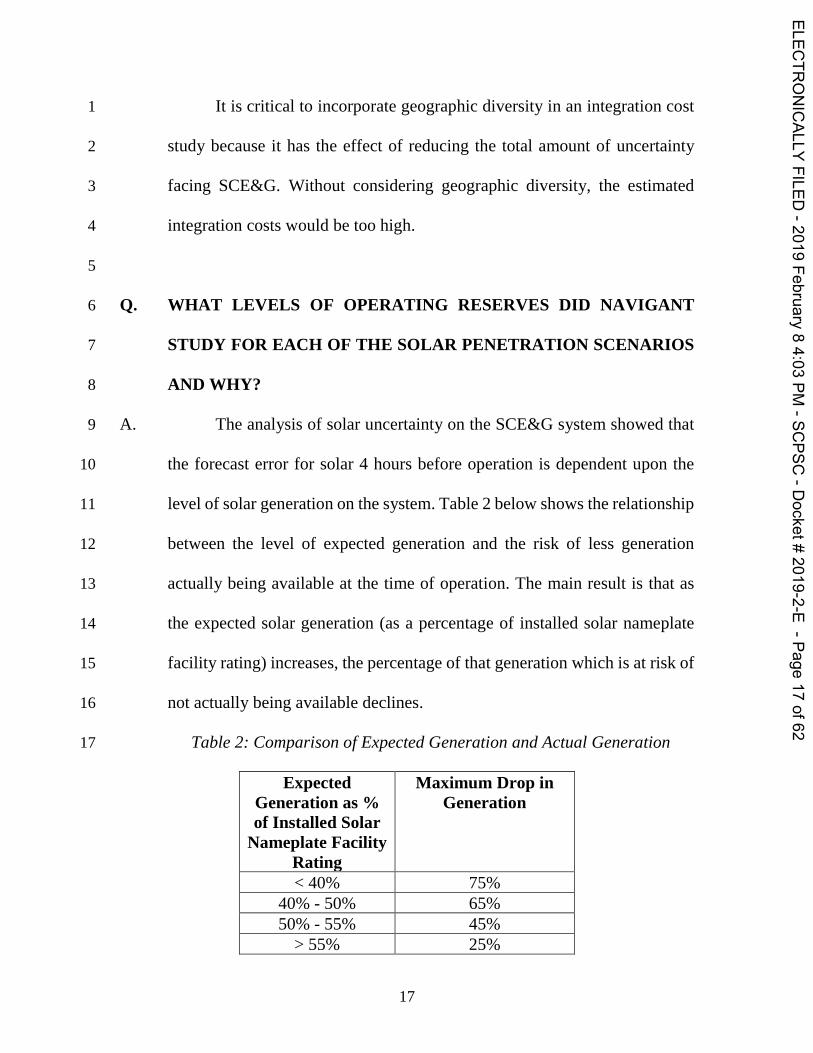
A. The analysis of solar uncertainty on the SCE&G system showed that 9
the forecast error for solar 4 hours before operation is dependent upon the 10
level of solar generation on the system. Table 2 below shows the relationship 11
between the level of expected generation and the risk of less generation 12
actually being available at the time of operation. The main result is that as 13
the expected solar generation (as a percentage of installed solar nameplate 14
facility rating) increases, the percentage of that generation which is at risk of 15
not actually being available declines. 16
Table 2: Comparison of Expected Generation and Actual Generation 17
Expected Generation as % of Installed Solar
Nameplate Facility Rating
Maximum Drop in Generation
< 40% 75% 40% - 50% 65% 50% - 55% 45%
> 55% 25%
ELECTR
ONICALLY
FILED-2019
February84:03
PM-SC
PSC-D
ocket#2019-2-E
-Page17
of62
18
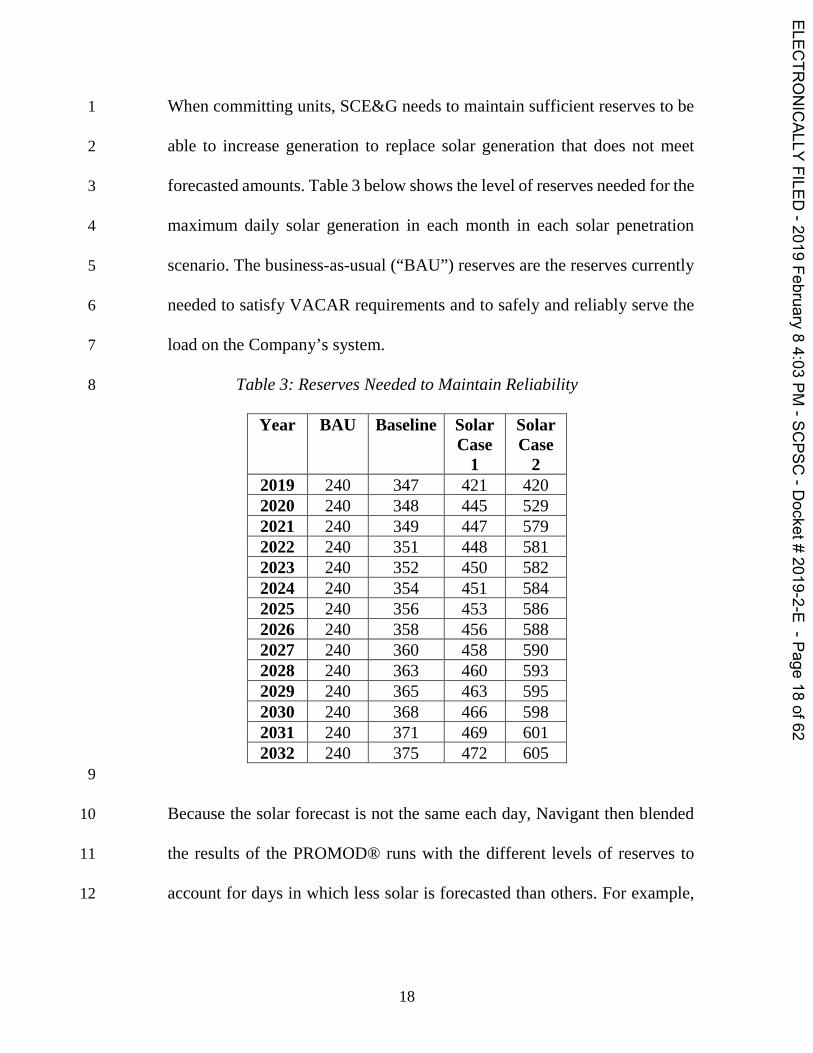
When committing units, SCE&G needs to maintain sufficient reserves to be 1
able to increase generation to replace solar generation that does not meet 2
forecasted amounts. Table 3 below shows the level of reserves needed for the 3
maximum daily solar generation in each month in each solar penetration 4
scenario. The business-as-usual (“BAU”) reserves are the reserves currently 5
needed to satisfy VACAR requirements and to safely and reliably serve the 6
load on the Company’s system. 7
Table 3: Reserves Needed to Maintain Reliability 8
Year BAU Baseline Solar Case
1
Solar Case
2 2019 240 347 421 420 2020 240 348 445 529 2021 240 349 447 579 2022 240 351 448 581 2023 240 352 450 582 2024 240 354 451 584 2025 240 356 453 586 2026 240 358 456 588 2027 240 360 458 590 2028 240 363 460 593 2029 240 365 463 595 2030 240 368 466 598 2031 240 371 469 601 2032 240 375 472 605
9
Because the solar forecast is not the same each day, Navigant then blended 10
the results of the PROMOD® runs with the different levels of reserves to 11
account for days in which less solar is forecasted than others. For example, 12
ELECTR
ONICALLY
FILED-2019
February84:03
PM-SC
PSC-D
ocket#2019-2-E
-Page18
of62
19
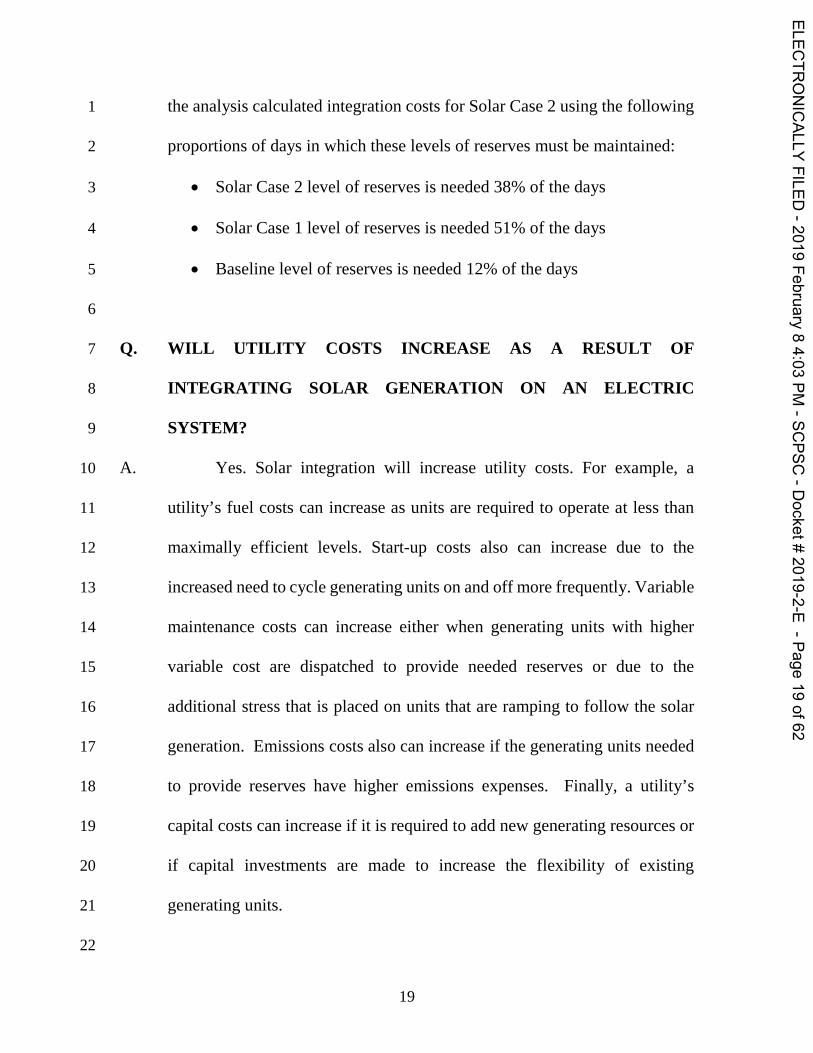
the analysis calculated integration costs for Solar Case 2 using the following 1
proportions of days in which these levels of reserves must be maintained: 2
• Solar Case 2 level of reserves is needed 38% of the days 3
• Solar Case 1 level of reserves is needed 51% of the days 4
• Baseline level of reserves is needed 12% of the days 5
6
Q. WILL UTILITY COSTS INCREASE AS A RESULT OF 7
INTEGRATING SOLAR GENERATION ON AN ELECTRIC 8
SYSTEM? 9
A. Yes. Solar integration will increase utility costs. For example, a 10
utility’s fuel costs can increase as units are required to operate at less than 11
maximally efficient levels. Start-up costs also can increase due to the 12
increased need to cycle generating units on and off more frequently. Variable 13
maintenance costs can increase either when generating units with higher 14
variable cost are dispatched to provide needed reserves or due to the 15
additional stress that is placed on units that are ramping to follow the solar 16
generation. Emissions costs also can increase if the generating units needed 17
to provide reserves have higher emissions expenses. Finally, a utility’s 18
capital costs can increase if it is required to add new generating resources or 19
if capital investments are made to increase the flexibility of existing 20
generating units. 21
22
ELECTR
ONICALLY
FILED-2019
February84:03
PM-SC
PSC-D
ocket#2019-2-E
-Page19
of62
20
Q. DOES THE STUDY CONSIDER SYSTEM COSTS FOR SCENARIOS 1
WITH DIFFERENT LEVELS OF OPERATING RESERVES? 2
A. Yes. The Study calculates operating reserve levels as the maximum 3
daily potential forecast error of solar generation at each level of solar 4
penetration. This maximum was fairly constant by month but varied day-to-5
day. For days in which solar generation is forecasted to be low, the level of 6
reserves that the utility needs to maintain are less than the overall monthly 7
maximum. 8
If the maximum operating reserve increases were assumed to be 9
maintained every day, the estimate of integration costs would be too high. 10
PROMOD® does not allow operating reserve levels to change day-to-day. 11
Therefore, in order to incorporate the days with lower requirements, 12
Navigant calculated the costs using varying levels of operating reserves and 13
then blended those costs using weightings tied to the proportion of days with 14
the appropriate level of solar uncertainty. This blending ensures that the 15
study does not overestimate costs. 16
17
Q. HOW DID NAVIGANT ENSURE THAT THERE WAS NO DOUBLE 18
COUNTING OF COSTS WITH THE RESULTS OF THIS STUDY 19
AND THE PR-1 AND PR-2 AVOIDED COST STUDY? 20
A. The avoided costs for solar reflected in the PR-1 and PR-2 Rates 21
included the following cost increases from solar penetration: 22
ELECTR
ONICALLY
FILED-2019
February84:03
PM-SC
PSC-D
ocket#2019-2-E
-Page20
of62
21
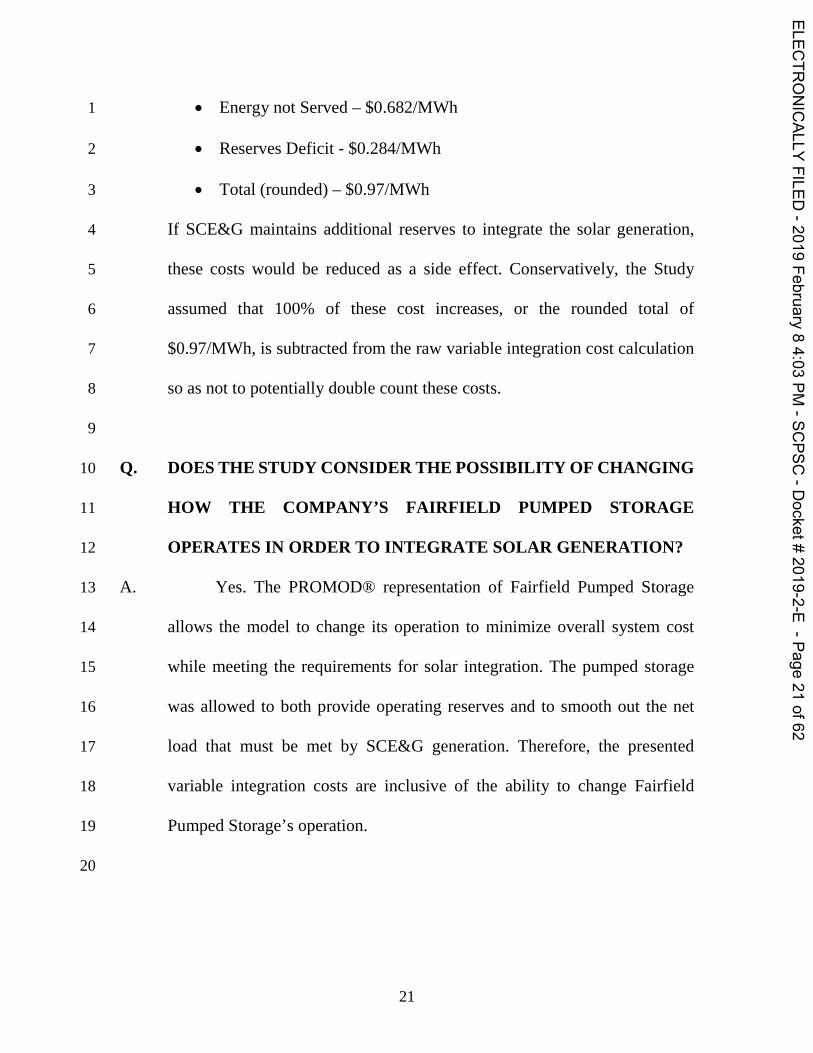
• Energy not Served – $0.682/MWh 1
• Reserves Deficit - $0.284/MWh 2
• Total (rounded) – $0.97/MWh 3
If SCE&G maintains additional reserves to integrate the solar generation, 4
these costs would be reduced as a side effect. Conservatively, the Study 5
assumed that 100% of these cost increases, or the rounded total of 6
$0.97/MWh, is subtracted from the raw variable integration cost calculation 7
so as not to potentially double count these costs. 8
9
Q. DOES THE STUDY CONSIDER THE POSSIBILITY OF CHANGING 10
HOW THE COMPANY’S FAIRFIELD PUMPED STORAGE 11
OPERATES IN ORDER TO INTEGRATE SOLAR GENERATION? 12
A. Yes. The PROMOD® representation of Fairfield Pumped Storage 13
allows the model to change its operation to minimize overall system cost 14
while meeting the requirements for solar integration. The pumped storage 15
was allowed to both provide operating reserves and to smooth out the net 16
load that must be met by SCE&G generation. Therefore, the presented 17
variable integration costs are inclusive of the ability to change Fairfield 18
Pumped Storage’s operation. 19
20
ELECTR
ONICALLY
FILED-2019
February84:03
PM-SC
PSC-D
ocket#2019-2-E
-Page21
of62
22
VARIABLE INTEGRATION COST STUDY CONCLUSIONS 1
Q. BASED ON THE STUDY, WHAT IS THE INTEGRATION COST 2
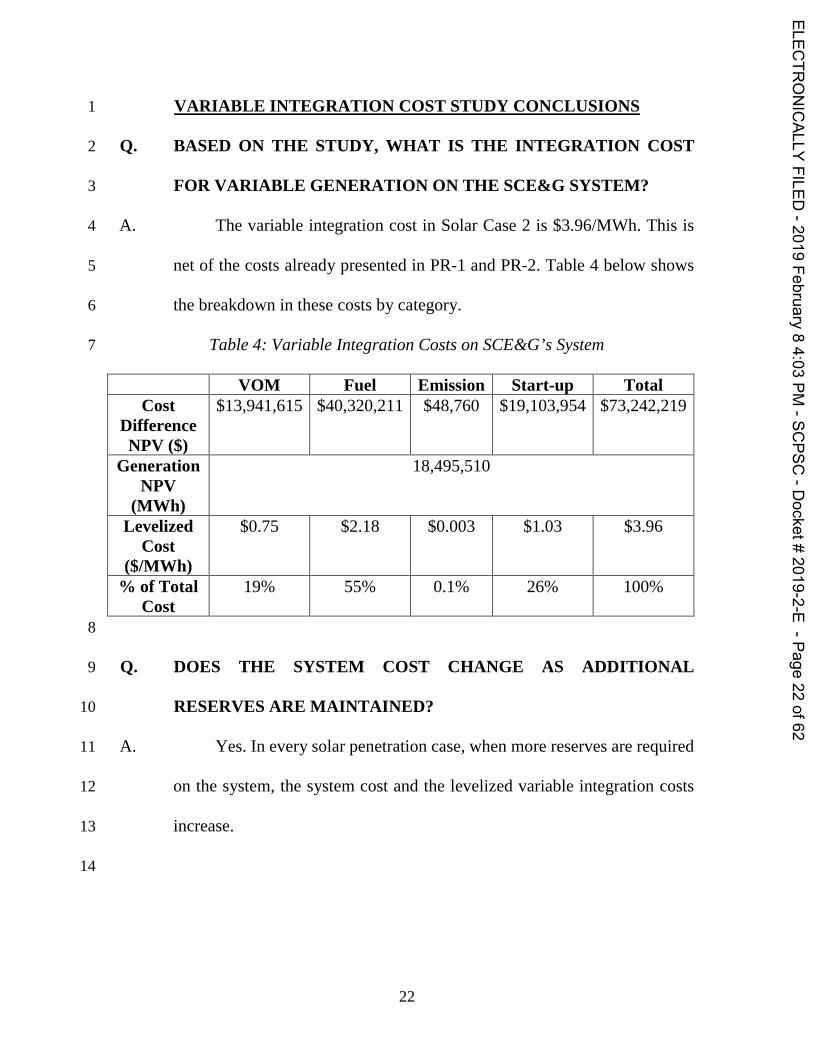
FOR VARIABLE GENERATION ON THE SCE&G SYSTEM? 3
A. The variable integration cost in Solar Case 2 is $3.96/MWh. This is 4
net of the costs already presented in PR-1 and PR-2. Table 4 below shows 5
the breakdown in these costs by category. 6
Table 4: Variable Integration Costs on SCE&G’s System 7
VOM Fuel Emission Start-up Total Cost
Difference NPV ($)
$13,941,615 $40,320,211 $48,760 $19,103,954 $73,242,219
Generation NPV
(MWh)
18,495,510
Levelized Cost
($/MWh)
$0.75 $2.18 $0.003 $1.03 $3.96
% of Total Cost
19% 55% 0.1% 26% 100%
8
Q. DOES THE SYSTEM COST CHANGE AS ADDITIONAL 9
RESERVES ARE MAINTAINED? 10
A. Yes. In every solar penetration case, when more reserves are required 11
on the system, the system cost and the levelized variable integration costs 12
increase. 13
14
ELECTR
ONICALLY
FILED-2019
February84:03
PM-SC
PSC-D
ocket#2019-2-E
-Page22
of62
23
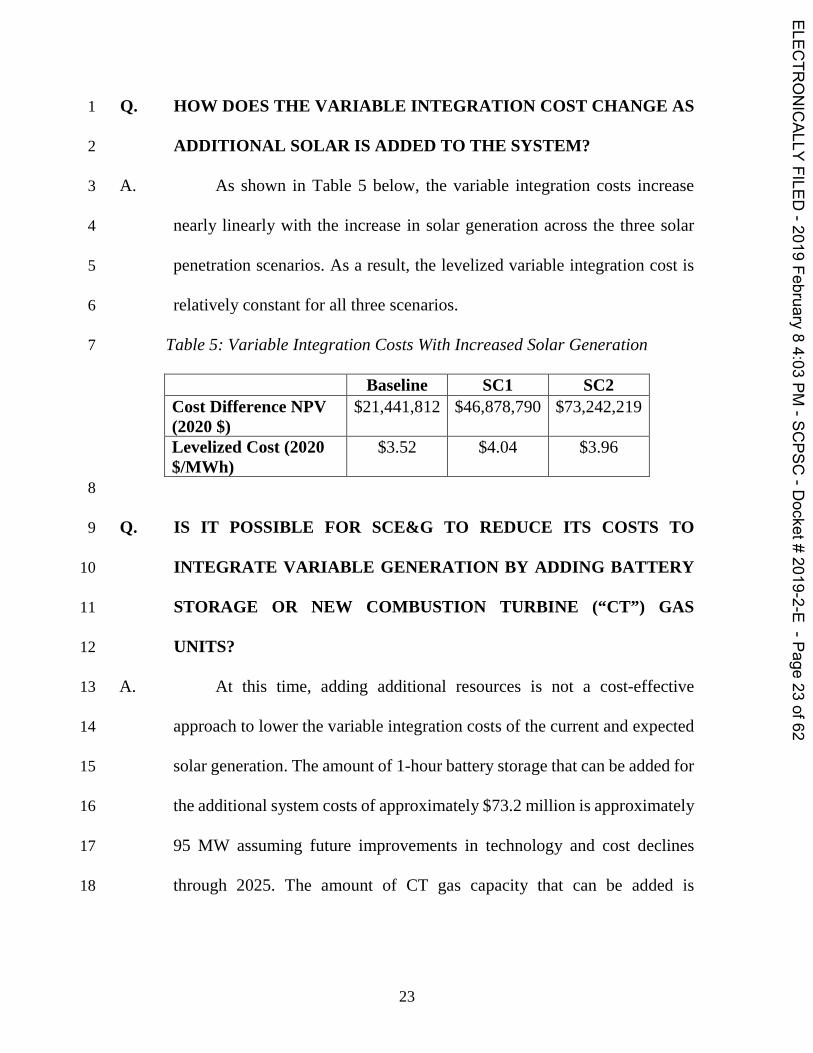
Q. HOW DOES THE VARIABLE INTEGRATION COST CHANGE AS 1
ADDITIONAL SOLAR IS ADDED TO THE SYSTEM? 2
A. As shown in Table 5 below, the variable integration costs increase 3
nearly linearly with the increase in solar generation across the three solar 4
penetration scenarios. As a result, the levelized variable integration cost is 5
relatively constant for all three scenarios. 6
Table 5: Variable Integration Costs With Increased Solar Generation 7
Baseline SC1 SC2 Cost Difference NPV (2020 $)
$21,441,812 $46,878,790 $73,242,219
Levelized Cost (2020 $/MWh)
$3.52 $4.04 $3.96
8
Q. IS IT POSSIBLE FOR SCE&G TO REDUCE ITS COSTS TO 9
INTEGRATE VARIABLE GENERATION BY ADDING BATTERY 10
STORAGE OR NEW COMBUSTION TURBINE (“CT”) GAS 11
UNITS? 12
A. At this time, adding additional resources is not a cost-effective 13
approach to lower the variable integration costs of the current and expected 14
solar generation. The amount of 1-hour battery storage that can be added for 15
the additional system costs of approximately $73.2 million is approximately 16
95 MW assuming future improvements in technology and cost declines 17
through 2025. The amount of CT gas capacity that can be added is 18
ELECTR
ONICALLY
FILED-2019
February84:03
PM-SC
PSC-D
ocket#2019-2-E
-Page23
of62

24
approximately 110 MW. Neither of these capacities is sufficient to provide 1
the reserves needed to integrate the solar generation. 2
3
Q. DOES THIS CONCLUDE YOUR TESTIMONY? 4
A. Yes. 5
ELECTR
ONICALLY
FILED-2019
February84:03
PM-SC
PSC-D
ocket#2019-2-E
-Page24
of62
Exhibit No. __ (MWT-1) Page 1 of 4
Matthew Tanner, PhD Director
©2018 Navigant Consulting, Inc. All rights reserved. Navigant is not a certified public accounting firm and does not provide attest or public accounting services. See navigant.com/about/legal for a complete listing of private investigator licenses. This document is confidential and proprietary in its entirety. It may be copied and distributed solely for the purpose of evaluation.
1
[email protected] Washington, DC Direct: 202 973-2439
Professional Summary
Matt is a director in Navigant’s Energy and Capital Markets group. He supports market participants in understanding and planning for the changing dynamics of energy markets and the overall power industry. With over 10 years’ experience in integrated resource planning, energy market strategy, and risk analysis, he focuses on developing and providing highly analytical and creative approaches for utilities, investors, independent power producers, and other market participants to evaluate emerging market opportunities and adapt their business models to the changing markets across North America. Matt is an expert in helping clients understand the underlying drivers of Navigant’s wholesale market forecasts as well as potential changes that can drive risk both on the upside and downside. For utility clients, Matt ensures that they understand their changing requirements and technology options to meet those requires. He supports them in ensuring that they can operate their systems reliably and at the lowest cost.
Areas of Expertise
• Utility Strategy and Resource Planning. Guides utilities throughout North America in their resource planning and developing their strategy in response to the changing power system. Specializes in developing novel approaches for utilities to evaluate emerging issues such as integration of variable energy resources, the economics of decarbonization, and business opportunities with new technologies and distributed energy resources.
• Wholesale Market Forecasting and Business Strategy. Leads and contributes to a wide variety of energy planning projects both at the wholesale and distribution level. Focuses on scenario analysis of asset value, wholesale power market price forecasting, benefit/cost analysis, and asset decision analysis for existing and emerging technologies. Has strong experience evaluating and developing business models for battery and bulk storage stacking applications in energy, ancillary services, and capacity.
• Wholesale Market Design and Participation. Strategic support of ISOs and system operators as they are developing, reforming, or determining whether to join organized energy markets. Works on the key challenges and opportunities that are arising due to zero marginal cost generation and the rising need and value of flexibility in the system.
ELECTR
ONICALLY
FILED-2019
February84:03
PM-SC
PSC-D
ocket#2019-2-E
-Page25
of62
NRVIGANT

Exhibit No. __ (MWT-1) Page 2 of 4
Matthew Tanner, PhD Director
©2018 Navigant Consulting, Inc. All rights reserved. Navigant is not a certified public accounting firm and does not provide attest or public accounting services. See navigant.com/about/legal for a complete listing of private investigator licenses. This document is confidential and proprietary in its entirety. It may be copied and distributed solely for the purpose of evaluation.
2
Relevant Experience
Utility Strategy and Resource Planning
• Once-Through-Cooling Retirement Analysis, LADWP, 2017 - 2018. Leading the economic analysis of LADWP’s strategy regarding retirement of its once-through-cooling units.
• IRP Support, FortisBC, 2016-2018. Supported FortisBC as an expert in IRP modelling and the Northwest US power market.
• Variable Generation Study, NorthWestern, 2017 – 2018. Led project to estimate increased needs for renewable integration support for NorthWestern with rising wind and solar penetration. Testified on results.
• IRP Support, SaskPower, 2016. Supporting SaskPower in redesigning its planning process including definitions of scenarios, resource options, and risk analysis.
• Development of Short-Term Asset Risk Model, J-Power, 2016. Led the effort and designed a short-term market forecasting model to support J-Power in understanding upcoming market risks.
• Monte-Carlo Analysis of Transmission Project Costs, Exelon, 2016. Developed a Monte-Carlo model that supported the response to an RFP by providing a simulated range of costs for a transmission project.
• Review of Resource Plan, Austin Energy, 2015. Project manager to review Austin Energy’s resource plan and presented results to city council.
• Renewable Integration Analysis, LADWP, 2015. Task lead to evaluate the ability of LADWP to integrate high levels of renewable power into its system from a production cost planning framework.
• Evaluation of Best Practices Incorporating Distributed Energy Resources (DER) into IRP, DTE, 2015. Led project to survey utilities on best practices in incorporating DER and wrote report.
• Integrated Resource Planning Model, Northwest Power and Conservation Council, 2014-2015. Helped redevelop the RPM integrated resource planning model that the council uses in the Northwest.
• Developed Simulation of Power Plant Outages and Penalties Under Contract, TransCanada, 2015. Developed a Monte-Carlo simulation of unit outages and the implications for penalties under the plant PPA to support contract negotiations.
Wholesale Market Forecasting and Business Strategy
• Evaluation of Portfolio of Renewable Assets, John Hancock, 2018. Led the market forecasting for a portfolio of renewable assets including basis and congestion risk.
ELECTR
ONICALLY
FILED-2019
February84:03
PM-SC
PSC-D
ocket#2019-2-E
-Page26
of62
NRVIGANT
Exhibit No. __ (MWT-1) Page 3 of 4
Matthew Tanner, PhD Director
©2018 Navigant Consulting, Inc. All rights reserved. Navigant is not a certified public accounting firm and does not provide attest or public accounting services. See navigant.com/about/legal for a complete listing of private investigator licenses. This document is confidential and proprietary in its entirety. It may be copied and distributed solely for the purpose of evaluation.
3
• Post-PPA Valuation of Assets in Ontario and Quebec, Enbridge, 2018. Led the estimation and valuation of renewable assets in Ontario and Quebec that are coming off of PPAs in the next 15 years.
• Economic Analysis of SOO Green Renewable Rail Project, SOO Green, 2017. Led the arbitrage analysis of a potential high voltage direct current transmission line from Iowa to Illinois.
• Economic Analysis of PJM Battery Project, SGEM, 2017. Led the forecasting regulation prices and valuation of a battery project in PJM.
• Economic Analysis of San Vicente Pumped Storage, San Diego Water Authority, 2016. For SDWA, led the modelling task to evaluate the economics of the pumped storage facility within the California ISO (CAISO) market.
• Ancillary Service Market Dynamics and Price Forecasting, E.ON, 2016. For E.ON. led project to develop a report explain A/S market prices and the key drivers.
• Pennsylvania-New Jersey-Maryland Interconnection (PJM) Hydro Transaction, PSP, 2015. Forecasted market value for a hydro asset and advised on market rules and changes in PJM to support a potential transaction.
• Renewable Power Transactions, Korean Electric Power (KEPCO), 2015. Supported KEPCO in valuating renewable plants in US and advised on impacts of market drivers and regulatory changes.
• Modelling of New York ISO (NYISO) Frequency Market Drivers, US Department of Energy, 2015. Reviewed and modelling the key market drivers for the NYISO frequency regulation to forecast prices.
• Analysis of Value of Fast Dispatch in Electric Reliability Council of Texas (ERCOT), Investor, 2015. Modelled dispatch of a fast-start resource in ERCOT operating in real-time market.
Wholesale Market Design and Participation
• Strategic Support of Market Renewal, Independent Electricity System Operator (IESO), 2017-2018. Project manager for Navigant’s strategic supporting role for IESO’s market renewal effort. Helping stakeholders understand cross-cutting issues and the needs of the changing power system.
• Market Renewal Workshops, IESO, 2016-2017. Created and presented a set of workshops to internal and external stakeholders to educate on market renewal.
• Analysis of Economic Impacts of RTO Membership, LADWP, 2016. Led economic analysis task to support LADWP to understand the impacts of potential RTO membership.
• Evaluation of Joint Economic Dispatch in Florida, 2016. Led the economic modelling of joint economic dispatch within the FRCC territory.
ELECTR
ONICALLY
FILED-2019
February84:03
PM-SC
PSC-D
ocket#2019-2-E
-Page27
of62
NRVIGANT
Exhibit No. __ (MWT-1) Page 4 of 4
Matthew Tanner, PhD Director
©2018 Navigant Consulting, Inc. All rights reserved. Navigant is not a certified public accounting firm and does not provide attest or public accounting services. See navigant.com/about/legal for a complete listing of private investigator licenses. This document is confidential and proprietary in its entirety. It may be copied and distributed solely for the purpose of evaluation.
4
• Calculation of Default Emissions Factor, Ontario Ministry of Energy, 2016 - 2017. Modelled the marginal resources for markets exporting to Ontario and calculated the emissions factors that should be applied to be consistent with Ontario carbon policy.
Work History
Director, Navigant Consulting, Inc. Operations Research Analyst, US Information Administration
Education
PhD, Industrial Engineering Texas A&M University BSE, Operations Research and Financial Engineering
Princeton University
ELECTR
ONICALLY
FILED-2019
February84:03
PM-SC
PSC-D
ocket#2019-2-E
-Page28
of62
NRVIGANT
Exhibit No. __ (MWT-2) Page 1 of 35
Cost of Variable Integration
Confidential and Proprietary Page i ©2019 Navigant Consulting, Inc. Do not distribute or copy
Cost of Variable Integration Prepared for South Carolina Electric & Gas Company
Submitted by: Navigant Consulting, Inc. 1200 19th Street, NW Suite 700 Washington, DC 20036 202.973.2400 navigant.com February 2019
ELECTR
ONICALLY
FILED-2019
February84:03
PM-SC
PSC-D
ocket#2019-2-E
-Page29
of62
NAVIGANT
SCE%G is becoming
~~ Dominione~e Energy'
Exhibit No. __ (MWT-2) Page 2 of 35
Cost of Variable Integration
Confidential and Proprietary Page ii ©2019 Navigant Consulting, Inc. Do not distribute or copy
TABLE OF CONTENTS
Disclaimer ..................................................................................................................... iii Executive Summary ...................................................................................................... 4
Study Approach ................................................................................................................................... 4 Renewable Uncertainty and Need for Additional Reserves ................................................................ 5 Conclusions ......................................................................................................................................... 6
1. Impact of Solar on SCE&G Operation ..................................................................... 8
1.1 The SCE&G Power System .......................................................................................................... 8 1.2 Changes to System Operation with Solar ..................................................................................... 9
2. Study Methodology ................................................................................................. 14
2.1 Key Study Assumptions .............................................................................................................. 14 2.1.1 System Load ................................................................................................................... 14 2.1.2 SCE&G Generating Resources ...................................................................................... 15 2.1.3 Solar Penetration Scenarios ........................................................................................... 16
2.2 Modeling the SCE&G System with PROMOD ............................................................................ 17 2.3 Forecasting Requirements to Integrate Solar ............................................................................. 18 2.4 Estimating Integration Costs ....................................................................................................... 19
3. Solar Generation Variability in SCE&G Service Territory .................................... 20
3.1 Data Sources ............................................................................................................................... 20 3.2 Detailed Approach ....................................................................................................................... 21 3.3 Solar Generation Variability Results ........................................................................................... 21 3.4 Geographic Diversity ................................................................................................................... 23
4. Demonstrating the Need for Additional Reserves ................................................ 24
4.1 Reliability Challenges without Adding Reserves for Variable Integration ................................... 24 4.2 Calculating the Additional Reserve Requirements ...................................................................... 25
5. Mitigation Options and Integration Costs ............................................................. 28
5.1 Potential Mitigation Options......................................................................................................... 28 5.2 System Impacts of Holding Additional Reserves ........................................................................ 28 5.3 Cost of Holding Additional Reserves without Other Changes..................................................... 29 5.4 Screening the Potential to Mitigate with Additional Resources ................................................... 31
Market Modeling Process ................................................................... A-1
A.1 Electric Market Simulation ........................................................................................................ A-1
ELECTR
ONICALLY
FILED-2019
February84:03
PM-SC
PSC-D
ocket#2019-2-E
-Page30
of62
NAVIGANT
Appendix A.
Exhibit No. __ (MWT-2) Page 3 of 35
Cost of Variable Integration
Confidential and Proprietary Page iii ©2019 Navigant Consulting, Inc. Do not distribute or copy
DISCLAIMER NOTICE This report was prepared by Navigant Consulting, Inc. (Navigant) for South Carolina Electric & Gas Company (SCE&G). The work presented in this report represents Navigant’s professional judgment based on the information available at the time this report was prepared. Navigant is not responsible for the reader’s use of, or reliance upon, the report, nor any decisions based on the report. NAVIGANT MAKES NO REPRESENTATIONS OR WARRANTIES, EXPRESSED OR IMPLIED. Readers of the report are advised that they assume all liabilities incurred by them, or third parties, as a result of their reliance on the report, or the data, information, findings and opinions contained in the report.
ELECTR
ONICALLY
FILED-2019
February84:03
PM-SC
PSC-D
ocket#2019-2-E
-Page31
of62

Exhibit No. __ (MWT-2) Page 4 of 35
Cost of Variable Integration
Confidential and Proprietary Page 4 ©2019 Navigant Consulting, Inc. Do not distribute or copy
EXECUTIVE SUMMARY This study was commissioned by SCE&G in order to estimate the impacts that solar installations will have on system operation and the resulting incremental costs. The study considers the variable integration costs for 3 different scenarios of solar generation installed on the system. Due to the variable nature of solar generation, SCE&G needs to ensure that there are sufficient reserves on the system to be able to meet load when less solar is generated than was forecasted. This study evaluates the uncertainty in the solar generation, the resulting reserve requirement for SCE&G, and the added operating costs from holding those reserves. The study also considers whether alternative mitigation options such as adding new battery storage or gas combustion turbine units can reduce this cost. SCE&G’s challenge is that the utility combines both a large proportion of inflexible baseload (coal and nuclear) generation with high penetration of solar installations. This causes operational challenges due to the limits of the baseload generation for ramping up or ramping down in response to solar generation.
Study Approach
For this analysis, Navigant first benchmarked its PROMOD model to SCE&G’s system to create a baseline. Three solar penetration scenarios were then run to analyze the impacts that various levels of solar would have on the system. Each scenario included different amounts of solar and is described below.
• Baseline Scenario (Baseline)– 336 megawatts (MW) of solar generation interconnected with SCE&G’s system by the end of 2018.1
• Solar Case 1 (SC1)– 637 MW of solar generation interconnected with SCE&G’s system by the end of 2019.
• Solar Case 2 (SC2)– 1,044 MW of solar generation interconnected with SCE&G’s system by the end of 2020.
The following methodology was used to evaluate the impacts of solar generation and the variable integration costs:
1. PROMOD production cost software was benchmarked to the existing SCE&G system to provide a baseline of system operation in each of the solar penetration scenarios.
2. Solar generation uncertainty and forecast error was estimated.
3. The additional reserves needed to integrate the solar generation was calculated.
4. PROMOD was used to calculate the production costs with additional reserves required and the resulting levelized variable integration costs.
1 This is a conservative case. Actual installations by the end of 2018 already exceed this amount.
ELECTR
ONICALLY
FILED-2019
February84:03
PM-SC
PSC-D
ocket#2019-2-E
-Page32
of62
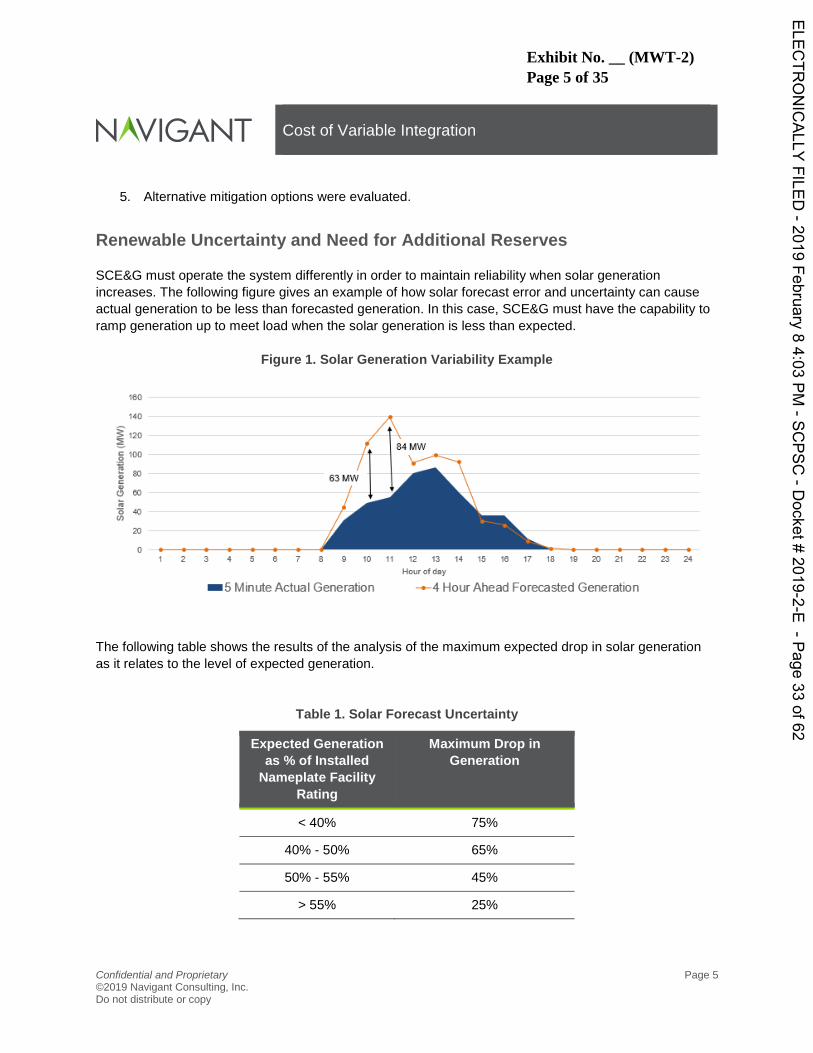
Exhibit No. __ (MWT-2) Page 5 of 35
Cost of Variable Integration
Confidential and Proprietary Page 5 ©2019 Navigant Consulting, Inc. Do not distribute or copy
5. Alternative mitigation options were evaluated.
Renewable Uncertainty and Need for Additional Reserves
SCE&G must operate the system differently in order to maintain reliability when solar generation increases. The following figure gives an example of how solar forecast error and uncertainty can cause actual generation to be less than forecasted generation. In this case, SCE&G must have the capability to ramp generation up to meet load when the solar generation is less than expected.
Figure 1. Solar Generation Variability Example
The following table shows the results of the analysis of the maximum expected drop in solar generation as it relates to the level of expected generation.
Table 1. Solar Forecast Uncertainty
Expected Generation as % of Installed
Nameplate Facility Rating
Maximum Drop in Generation
< 40% 75%
40% - 50% 65%
50% - 55% 45%
> 55% 25%
ELECTR
ONICALLY
FILED-2019
February84:03
PM-SC
PSC-D
ocket#2019-2-E
-Page33
of62
NAVIGANT
140
K 420
Dc 100
I50
'6 4040
63 MW
84 MW
I 2 3 ~ 5 5 7 0 0 10 11 12 13 14 15 15 17 16 19 20 21 22 23 24
140Uf 01 447
~5 Minute Actual Generation 4 Hour Ahead Forecasted Generation
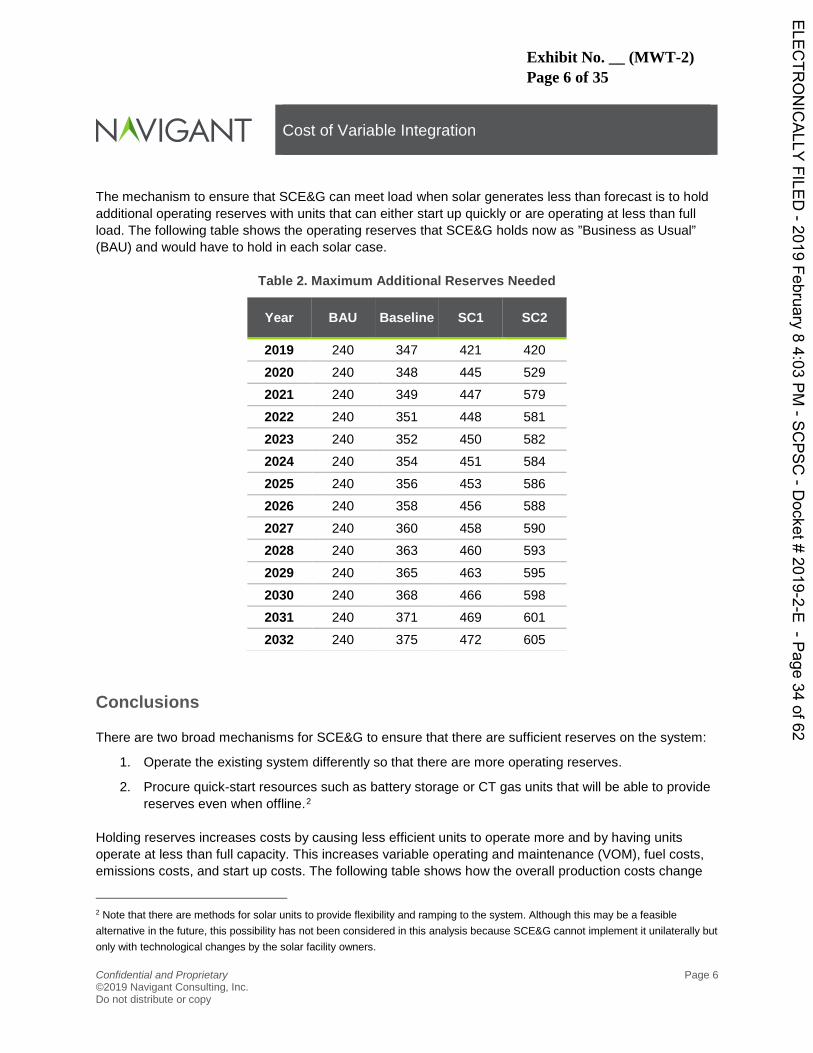
Exhibit No. __ (MWT-2) Page 6 of 35
Cost of Variable Integration
Confidential and Proprietary Page 6 ©2019 Navigant Consulting, Inc. Do not distribute or copy
The mechanism to ensure that SCE&G can meet load when solar generates less than forecast is to hold additional operating reserves with units that can either start up quickly or are operating at less than full load. The following table shows the operating reserves that SCE&G holds now as ”Business as Usual” (BAU) and would have to hold in each solar case.
Table 2. Maximum Additional Reserves Needed
Year BAU Baseline SC1 SC2
2019 240 347 421 420 2020 240 348 445 529 2021 240 349 447 579 2022 240 351 448 581 2023 240 352 450 582 2024 240 354 451 584 2025 240 356 453 586 2026 240 358 456 588 2027 240 360 458 590 2028 240 363 460 593 2029 240 365 463 595 2030 240 368 466 598 2031 240 371 469 601 2032 240 375 472 605
Conclusions
There are two broad mechanisms for SCE&G to ensure that there are sufficient reserves on the system:
1. Operate the existing system differently so that there are more operating reserves.
2. Procure quick-start resources such as battery storage or CT gas units that will be able to provide reserves even when offline.2
Holding reserves increases costs by causing less efficient units to operate more and by having units operate at less than full capacity. This increases variable operating and maintenance (VOM), fuel costs, emissions costs, and start up costs. The following table shows how the overall production costs change
2 Note that there are methods for solar units to provide flexibility and ramping to the system. Although this may be a feasible alternative in the future, this possibility has not been considered in this analysis because SCE&G cannot implement it unilaterally but only with technological changes by the solar facility owners.
ELECTR
ONICALLY
FILED-2019
February84:03
PM-SC
PSC-D
ocket#2019-2-E
-Page34
of62
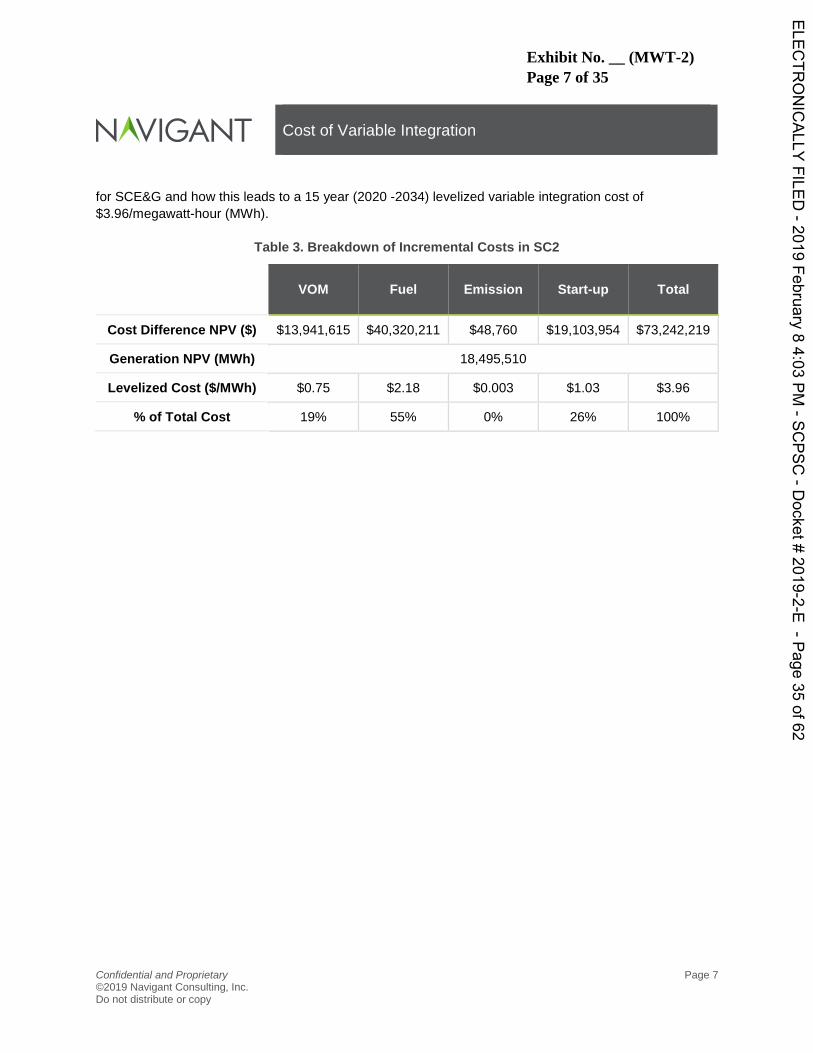
Exhibit No. __ (MWT-2) Page 7 of 35
Cost of Variable Integration
Confidential and Proprietary Page 7 ©2019 Navigant Consulting, Inc. Do not distribute or copy
for SCE&G and how this leads to a 15 year (2020 -2034) levelized variable integration cost of $3.96/megawatt-hour (MWh).
Table 3. Breakdown of Incremental Costs in SC2
VOM Fuel Emission Start-up Total
Cost Difference NPV ($) $13,941,615 $40,320,211 $48,760 $19,103,954 $73,242,219
Generation NPV (MWh) 18,495,510
Levelized Cost ($/MWh) $0.75 $2.18 $0.003 $1.03 $3.96
% of Total Cost 19% 55% 0% 26% 100%
ELECTR
ONICALLY
FILED-2019
February84:03
PM-SC
PSC-D
ocket#2019-2-E
-Page35
of62

Exhibit No. __ (MWT-2) Page 8 of 35
Cost of Variable Integration
Confidential and Proprietary Page 8 ©2019 Navigant Consulting, Inc. Do not distribute or copy
1. IMPACT OF SOLAR ON SCE&G OPERATION
1.1 The SCE&G Power System
SCE&G provides electric services for a large portion of South Carolina, with forecasted hourly demand typically ranging from approximately 2,000 to 5,000 MW, and forecasted monthly peak demand between approximately 3,500 and 5,000MW depending on the year and before accounting for demand-side resources. SCE&G experiences both winter and summer peaks, as shown in Figure 2, with the highest demand occurring during January and August. This trend is expected to remain consistent over time.
Figure 2. Monthly SCE&G Peak Demand3
SCE&G operators must ensure that both system load and operating reserves are met in all normal conditions. SCE&G is required to hold 200 MW of reserves at all times to meet their requirements within VACAR to be able to respond to the loss of the single-largest unit on the system.4 An additional 40 MW of reserves are held for load-following. Due to the need for self-sufficiency, SCE&G must rely on its own generators to meet generation and reserves, and cannot rely on external sources. Reserve requirements are met by operating the system in a manner to maintain the capability to increase generation quickly up to the level of reserves that are required. For example, many of SCE&G’s combustion turbine (CT) units are able to start within 15 minutes. These units provide reserves even
3 Not including demand-side resources. 4 VACAR is the balancing authority that SCE&G is a part of. VACAR must maintain NERC reliability standards including holding sufficient contingency reserves in order to respond to the single largest contingency on the system. The 200 MW of reserves for SCE&G is its share of these contingency reserves.
ELECTR
ONICALLY
FILED-2019
February84:03
PM-SC
PSC-D
ocket#2019-2-E
-Page36
of62
NAVIGANT
6,000
5,000
5 4,000
EI 3,000
Ora 2,000
1 2 3 4 5 6 7 8 9 10 11 12
2020 2025 2030
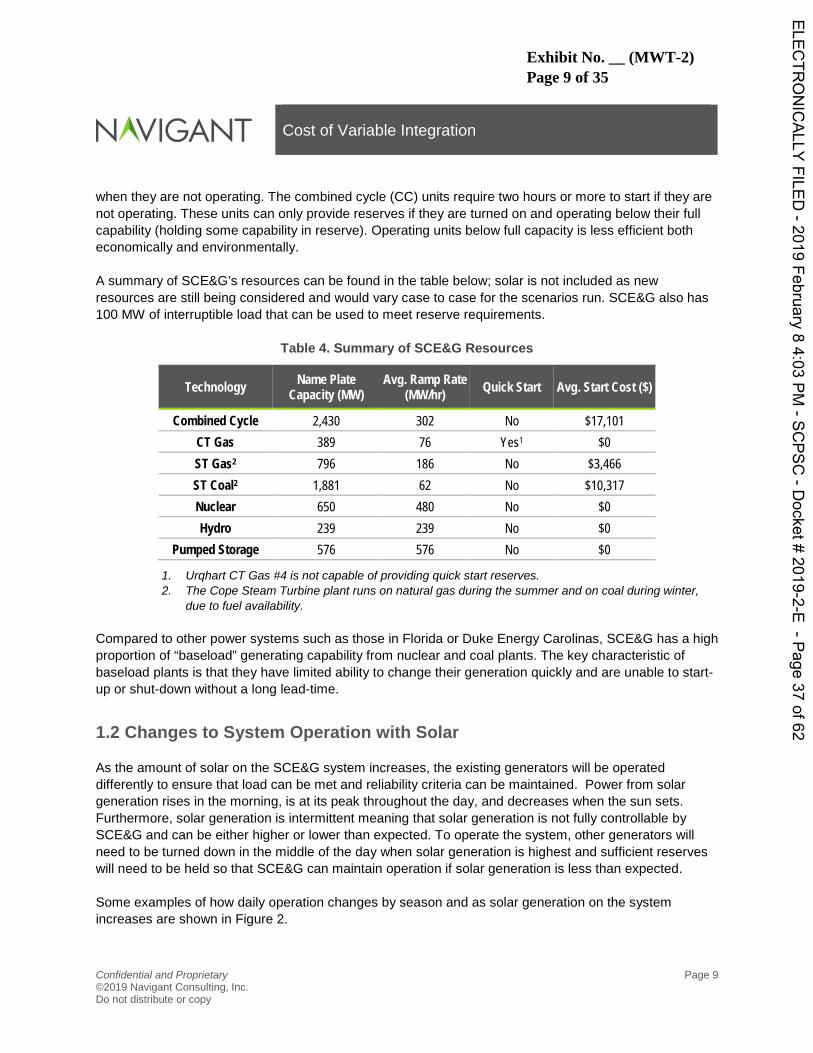
Exhibit No. __ (MWT-2) Page 9 of 35
Cost of Variable Integration
Confidential and Proprietary Page 9 ©2019 Navigant Consulting, Inc. Do not distribute or copy
when they are not operating. The combined cycle (CC) units require two hours or more to start if they are not operating. These units can only provide reserves if they are turned on and operating below their full capability (holding some capability in reserve). Operating units below full capacity is less efficient both economically and environmentally. A summary of SCE&G’s resources can be found in the table below; solar is not included as new resources are still being considered and would vary case to case for the scenarios run. SCE&G also has 100 MW of interruptible load that can be used to meet reserve requirements.
Table 4. Summary of SCE&G Resources
Technology Name Plate Capacity (MW)
Avg. Ramp Rate (MW/hr) Quick Start Avg. Start Cost ($)
Combined Cycle 2,430 302 No $17,101 CT Gas 389 76 Yes1 $0 ST Gas2 796 186 No $3,466 ST Coal2 1,881 62 No $10,317 Nuclear 650 480 No $0 Hydro 239 239 No $0
Pumped Storage 576 576 No $0
1. Urqhart CT Gas #4 is not capable of providing quick start reserves. 2. The Cope Steam Turbine plant runs on natural gas during the summer and on coal during winter,
due to fuel availability. Compared to other power systems such as those in Florida or Duke Energy Carolinas, SCE&G has a high proportion of “baseload” generating capability from nuclear and coal plants. The key characteristic of baseload plants is that they have limited ability to change their generation quickly and are unable to start-up or shut-down without a long lead-time.
1.2 Changes to System Operation with Solar
As the amount of solar on the SCE&G system increases, the existing generators will be operated differently to ensure that load can be met and reliability criteria can be maintained. Power from solar generation rises in the morning, is at its peak throughout the day, and decreases when the sun sets. Furthermore, solar generation is intermittent meaning that solar generation is not fully controllable by SCE&G and can be either higher or lower than expected. To operate the system, other generators will need to be turned down in the middle of the day when solar generation is highest and sufficient reserves will need to be held so that SCE&G can maintain operation if solar generation is less than expected. Some examples of how daily operation changes by season and as solar generation on the system increases are shown in Figure 2.
ELECTR
ONICALLY
FILED-2019
February84:03
PM-SC
PSC-D
ocket#2019-2-E
-Page37
of62
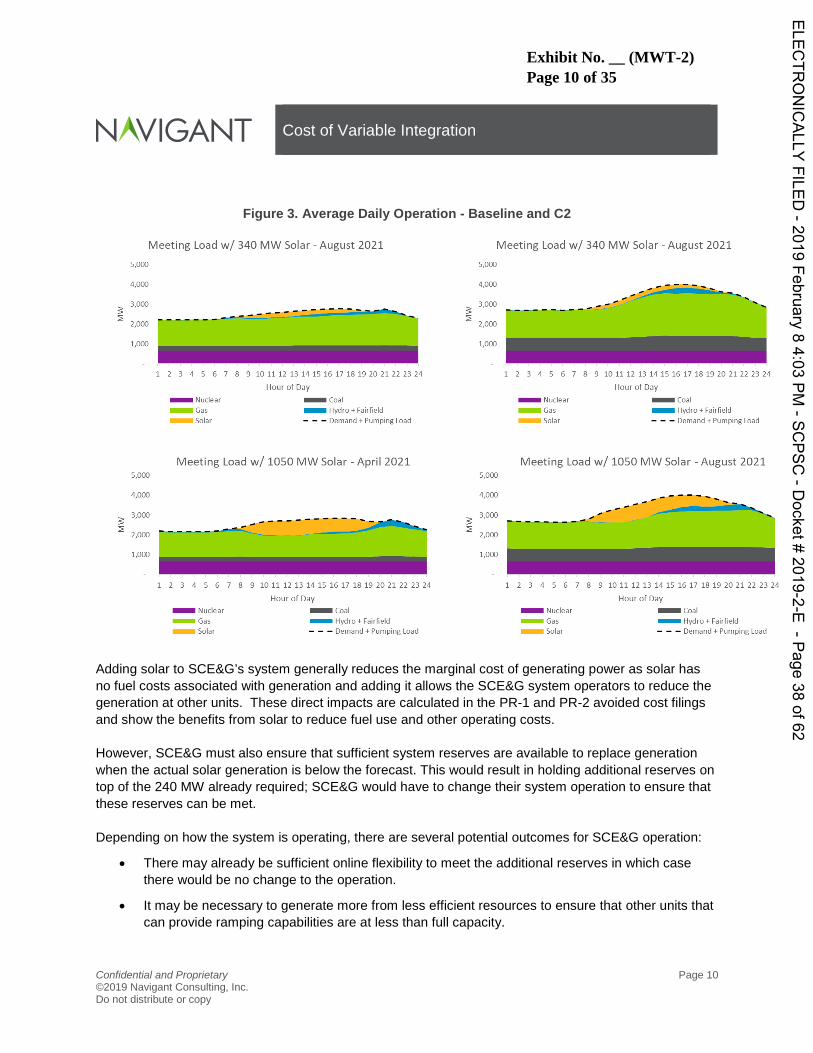
Exhibit No. __ (MWT-2) Page 10 of 35
Cost of Variable Integration
Confidential and Proprietary Page 10 ©2019 Navigant Consulting, Inc. Do not distribute or copy
Figure 3. Average Daily Operation - Baseline and C2
Adding solar to SCE&G’s system generally reduces the marginal cost of generating power as solar has no fuel costs associated with generation and adding it allows the SCE&G system operators to reduce the generation at other units. These direct impacts are calculated in the PR-1 and PR-2 avoided cost filings and show the benefits from solar to reduce fuel use and other operating costs. However, SCE&G must also ensure that sufficient system reserves are available to replace generation when the actual solar generation is below the forecast. This would result in holding additional reserves on top of the 240 MW already required; SCE&G would have to change their system operation to ensure that these reserves can be met. Depending on how the system is operating, there are several potential outcomes for SCE&G operation:
• There may already be sufficient online flexibility to meet the additional reserves in which case there would be no change to the operation.
• It may be necessary to generate more from less efficient resources to ensure that other units that can provide ramping capabilities are at less than full capacity.
ELECTR
ONICALLY
FILED-2019
February84:03
PM-SC
PSC-D
ocket#2019-2-E
-Page38
of62
NAVIGANT
Meeting Load w/ 340 MW Solar - August 2021 Meeting Load w/ 340 MW Solar - August 2021
4,000 4,000
37100
2280
3,0CO
2,0CO
I 2 3 4 5 6 7 8 9 10 11 12 13 14 15 16 17 18 19 20 21 22 23 24 I 2 3 4 5 6 7 8 9 10 11 12 13 14 15 16 17 18 19 20 21 22 23 24
~ Nuclear~G~ Sole
Hour of Day~ Coal~ Hyd + F m Id— — — Demand ~ P p ng Load
~ Nuclear~G~ Sole
Hour of Day~ Coal~ Hyd o+ F m Id— — — Demand ~ P mp ng Load
S,OCO
Meeting Load w/1050 MW Solar — April 2021 Meeting Load w/1050 MW Solar — August 2021
4,0CO 4,000
3,0CO
27100
3,000
2,000
I,OCO
I 2 3 4 5 6 7 8 9 10 11 12 13 14 15 16 17 18 19 20 21 22 23 24
Hour of Day~ Coal~ Hydro ~ Fairfield— — — Demand + Pumping Load
1 2 3 4 5 6 7 8 9 10 11 12 13 14 15 16 17 18 19 20 21 22 23 24
~ Nuclear~ Gas~ Solar
~ Nuclear~ Gas~ Solar
Hour of Day~ Coal~ Hydro + Fairfiel— — — Demand + Pump mg Load
Exhibit No. __ (MWT-2) Page 11 of 35
Cost of Variable Integration
Confidential and Proprietary Page 11 ©2019 Navigant Consulting, Inc. Do not distribute or copy
• It may be necessary to start-up less efficient generation in order to be able to provide the reserves.
The costs to ensure this flexibility is what is estimated in this study and are separate from the system costs calculated in the PR-1 and PR-2 avoided cost filings. The following two examples shows how system operation can change when additional reserves are required. With the current amount of reserves that SCE&G holds, the lowest cost way to operate the system is to have the CC units generate at almost full capacity while providing few reserves. Most of the system reserves are provided by Saluda Hydro and the CT gas units. When additional reserves are needed, the operators must turn down the CC units to provide reserves and turn up Steam Turbine (ST) Coal units to provide energy. This increases the cost to operate the system.
ELECTR
ONICALLY
FILED-2019
February84:03
PM-SC
PSC-D
ocket#2019-2-E
-Page39
of62
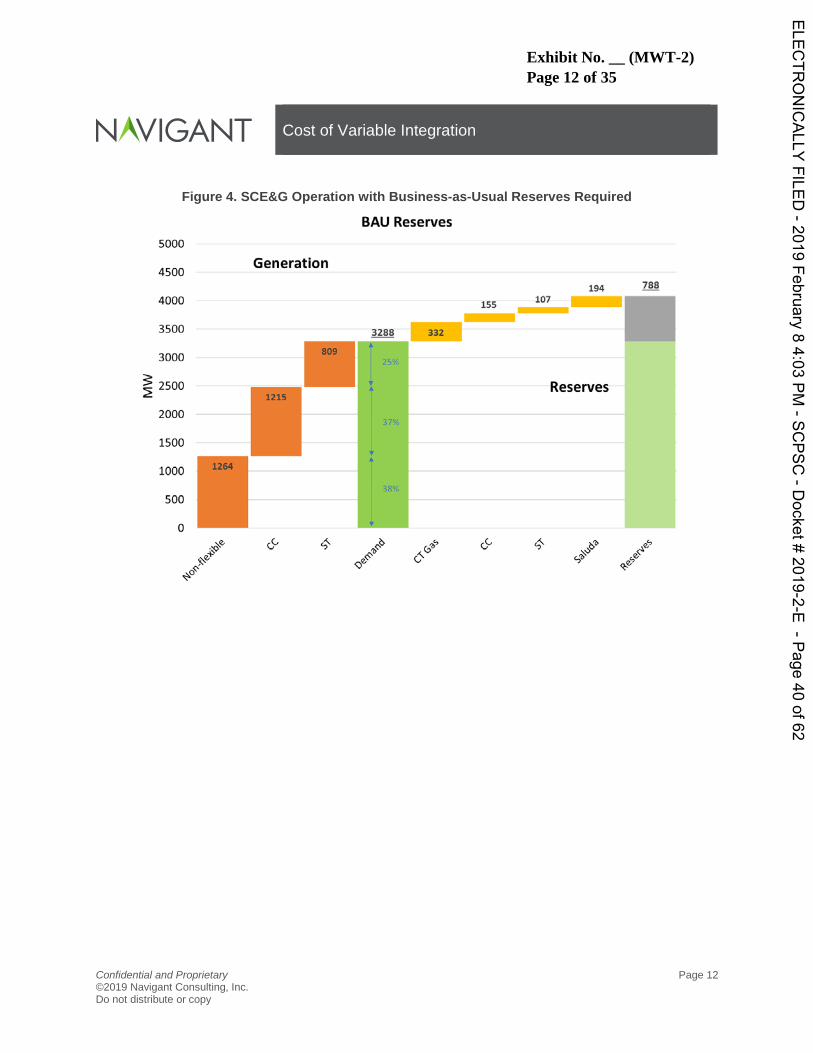
Exhibit No. __ (MWT-2) Page 12 of 35
Cost of Variable Integration
Confidential and Proprietary Page 12 ©2019 Navigant Consulting, Inc. Do not distribute or copy
Figure 4. SCE&G Operation with Business-as-Usual Reserves Required
ELECTR
ONICALLY
FILED-2019
February84:03
PM-SC
PSC-D
ocket#2019-2-E
-Page40
of62
NAVIGANT
5000
4500
4000
3500
3000
~ 2500
Generation
BAU Reserves
194
133107
3288 ~332
Reserves
788
2000
1500
1000
500
ge9
98 &4, eeeC'e1

Exhibit No. __ (MWT-2) Page 13 of 35
Cost of Variable Integration
Confidential and Proprietary Page 13 ©2019 Navigant Consulting, Inc. Do not distribute or copy
Figure 5. SCE&G Operation with Additional Reserves
ELECTR
ONICALLY
FILED-2019
February84:03
PM-SC
PSC-D
ocket#2019-2-E
-Page41
of62
NAVIGANT
5000
4500Generation
Full Reserves
164 1267
177
4000
3500
3000
~ 2500
2288 ~zzz
Reserves
2000
1500
1000
500
yC
gO
Exhibit No. __ (MWT-2) Page 14 of 35
Cost of Variable Integration
Confidential and Proprietary Page 14 ©2019 Navigant Consulting, Inc. Do not distribute or copy
2. STUDY METHODOLOGY As discussed in Section 1, operating SCE&G’s system with increasing solar installations will require the utility operators to maintain sufficient operating reserves and ensure that load can be served even when actual solar generation is less than expected generation. Mechanically, this means that SCE&G operators will need to maintain sufficient operating reserves (the ability to ramp units up) to both meet VACAR requirements and to cover any unexpected shortfall of solar generation. The general approach to calculate the costs of this additional requirement is to simulate system operation with and without the additional operating reserves, compare system costs in the two scenarios, and evaluate if there are any other potential mitigation alternatives that could result in lowered system costs. The study forecasts system integration costs for 15 years from 2020 -2034. The following describes the full study methodology and assumptions in detail.
2.1 Key Study Assumptions
As a baseline, this study uses the same assumptions as SCE&G’s Integrated Resource Plan (IRP). The key assumptions of the IRP include the forecasted system load and the existing and new resources needed to meet this load requirement.
2.1.1 System Load
The following chart shows the forecasted annual system peak load5 for the study period of 2019 to 2032. Annual load grows at a constant and relatively low rate, with a CAGR of approximately 0.8% over the study period.
5 The system was simulated hourly and the forecasted load is used on an hourly basis.
ELECTR
ONICALLY
FILED-2019
February84:03
PM-SC
PSC-D
ocket#2019-2-E
-Page42
of62
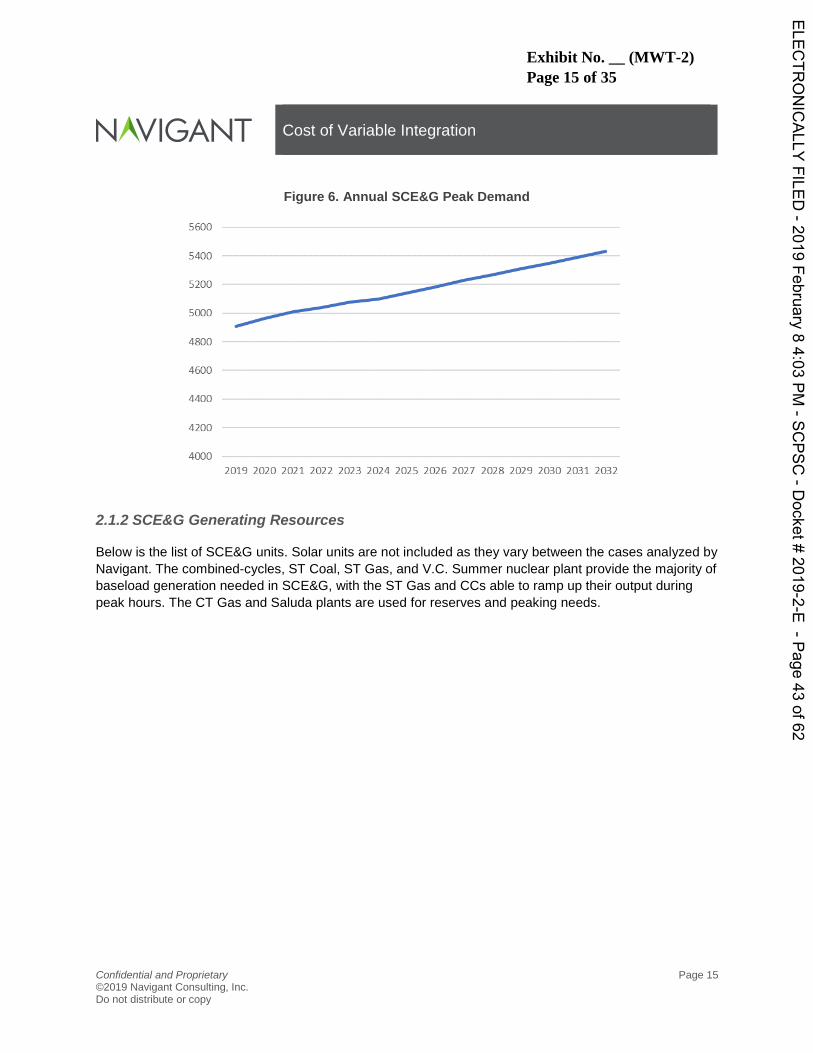
Exhibit No. __ (MWT-2) Page 15 of 35
Cost of Variable Integration
Confidential and Proprietary Page 15 ©2019 Navigant Consulting, Inc. Do not distribute or copy
Figure 6. Annual SCE&G Peak Demand
2.1.2 SCE&G Generating Resources
Below is the list of SCE&G units. Solar units are not included as they vary between the cases analyzed by Navigant. The combined-cycles, ST Coal, ST Gas, and V.C. Summer nuclear plant provide the majority of baseload generation needed in SCE&G, with the ST Gas and CCs able to ramp up their output during peak hours. The CT Gas and Saluda plants are used for reserves and peaking needs.
ELECTR
ONICALLY
FILED-2019
February84:03
PM-SC
PSC-D
ocket#2019-2-E
-Page43
of62
NAVIGANT
5600
5400
5200
5000
4800
4600
4400
4200
40002019 2020 2021 2022 2023 2024 2025 2026 2027 2028 2029 2030 2031 2032
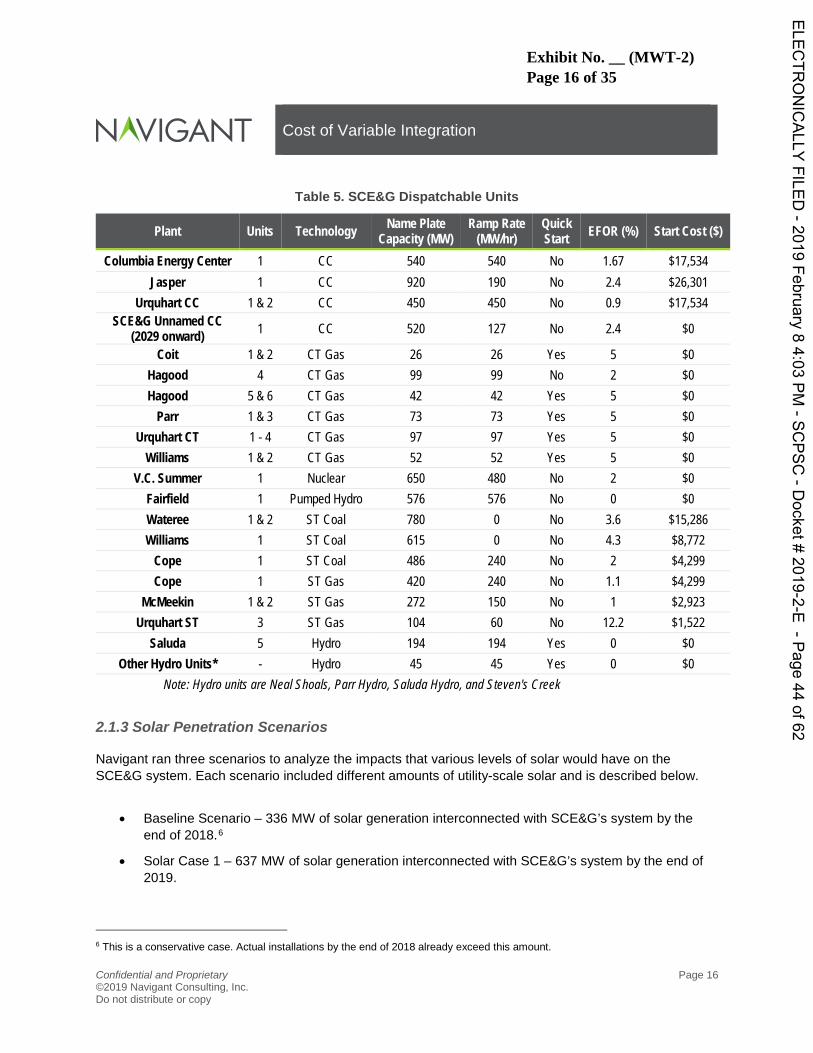
Exhibit No. __ (MWT-2) Page 16 of 35
Cost of Variable Integration
Confidential and Proprietary Page 16 ©2019 Navigant Consulting, Inc. Do not distribute or copy
Table 5. SCE&G Dispatchable Units
Plant Units Technology Name Plate Capacity (MW)
Ramp Rate (MW/hr)
Quick Start EFOR (%) Start Cost ($)
Columbia Energy Center 1 CC 540 540 No 1.67 $17,534 Jasper 1 CC 920 190 No 2.4 $26,301
Urquhart CC 1 & 2 CC 450 450 No 0.9 $17,534 SCE&G Unnamed CC
(2029 onward) 1 CC 520 127 No 2.4 $0
Coit 1 & 2 CT Gas 26 26 Yes 5 $0 Hagood 4 CT Gas 99 99 No 2 $0 Hagood 5 & 6 CT Gas 42 42 Yes 5 $0
Parr 1 & 3 CT Gas 73 73 Yes 5 $0 Urquhart CT 1 - 4 CT Gas 97 97 Yes 5 $0
Williams 1 & 2 CT Gas 52 52 Yes 5 $0 V.C. Summer 1 Nuclear 650 480 No 2 $0
Fairfield 1 Pumped Hydro 576 576 No 0 $0 Wateree 1 & 2 ST Coal 780 0 No 3.6 $15,286 Williams 1 ST Coal 615 0 No 4.3 $8,772
Cope 1 ST Coal 486 240 No 2 $4,299 Cope 1 ST Gas 420 240 No 1.1 $4,299
McMeekin 1 & 2 ST Gas 272 150 No 1 $2,923 Urquhart ST 3 ST Gas 104 60 No 12.2 $1,522
Saluda 5 Hydro 194 194 Yes 0 $0 Other Hydro Units* - Hydro 45 45 Yes 0 $0
Note: Hydro units are Neal Shoals, Parr Hydro, Saluda Hydro, and Steven's Creek
2.1.3 Solar Penetration Scenarios
Navigant ran three scenarios to analyze the impacts that various levels of solar would have on the SCE&G system. Each scenario included different amounts of utility-scale solar and is described below.
• Baseline Scenario – 336 MW of solar generation interconnected with SCE&G’s system by the end of 2018.6
• Solar Case 1 – 637 MW of solar generation interconnected with SCE&G’s system by the end of 2019.
6 This is a conservative case. Actual installations by the end of 2018 already exceed this amount.
ELECTR
ONICALLY
FILED-2019
February84:03
PM-SC
PSC-D
ocket#2019-2-E
-Page44
of62
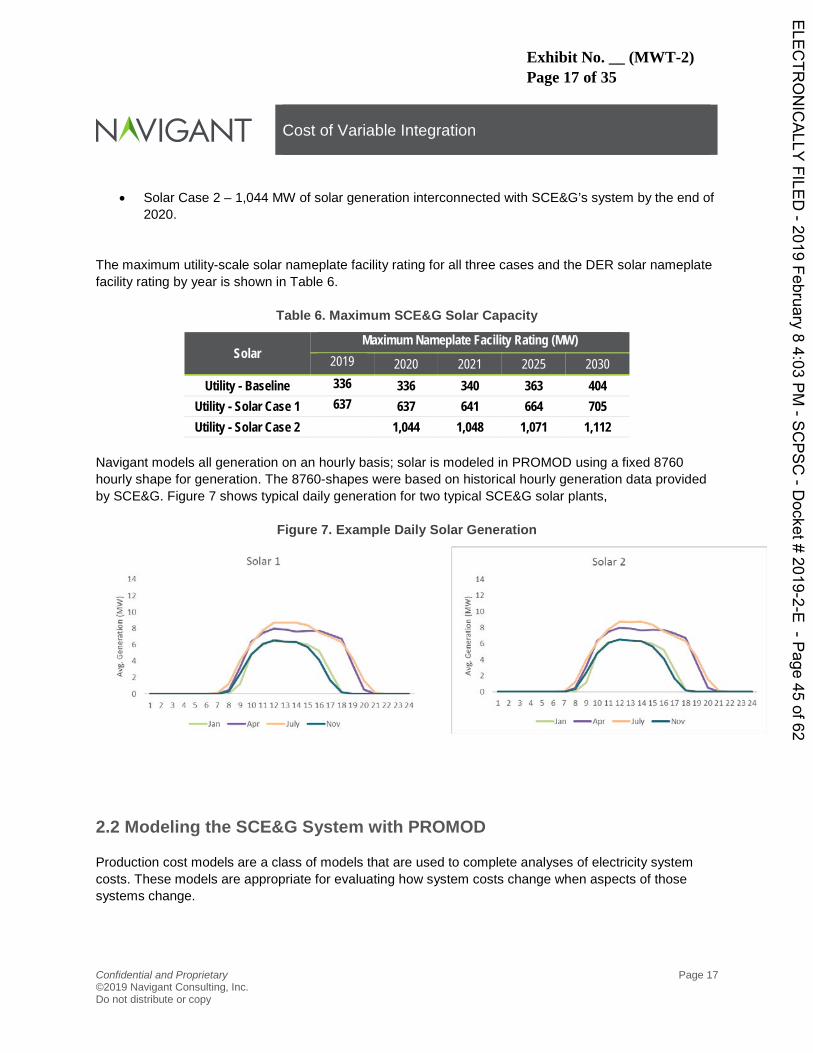
Exhibit No. __ (MWT-2) Page 17 of 35
Cost of Variable Integration
Confidential and Proprietary Page 17 ©2019 Navigant Consulting, Inc. Do not distribute or copy
• Solar Case 2 – 1,044 MW of solar generation interconnected with SCE&G’s system by the end of 2020.
The maximum utility-scale solar nameplate facility rating for all three cases and the DER solar nameplate facility rating by year is shown in Table 6.
Table 6. Maximum SCE&G Solar Capacity
Solar Maximum Nameplate Facility Rating (MW)
2019 2020 2021 2025 2030 Utility - Baseline 336 336 340 363 404
Utility - Solar Case 1 637 637 641 664 705 Utility - Solar Case 2 1,044 1,048 1,071 1,112
Navigant models all generation on an hourly basis; solar is modeled in PROMOD using a fixed 8760 hourly shape for generation. The 8760-shapes were based on historical hourly generation data provided by SCE&G. Figure 7 shows typical daily generation for two typical SCE&G solar plants,
Figure 7. Example Daily Solar Generation
2.2 Modeling the SCE&G System with PROMOD
Production cost models are a class of models that are used to complete analyses of electricity system costs. These models are appropriate for evaluating how system costs change when aspects of those systems change.
ELECTR
ONICALLY
FILED-2019
February84:03
PM-SC
PSC-D
ocket#2019-2-E
-Page45
of62
NAVIGANT
— Il
a 1049 6
6
0 4
Solar 2
14
12
a 10
9 6
6
U 4
Solar 2
7 3 4 5 6 7 6 'I lo'lll711141516171A'l97021777374
740 Apr IUN Nov
2 3 4 5 6 7 8 9 101112131415161718192021222324
l44 Apr luly Nov

Exhibit No. __ (MWT-2) Page 18 of 35
Cost of Variable Integration
Confidential and Proprietary Page 18 ©2019 Navigant Consulting, Inc. Do not distribute or copy
For this study, PROMOD was used. PROMOD is a widely licensed Production Cost Model used by many utilities and ISOs including PJM and MISO. There are other available Production Cost Models and consistent results can be expected if a different model was used for the study. Like all production cost models, PROMOD simulates system operation hourly to minimize the total operating cost while ensuring that generation and load are matched and that operating reserve requirements are met. The model also takes into account generator operating limits and transmission constraints. The key outputs of the system simulation are the hourly details of system operation including generation by unit and the hourly operating costs. From PROMOD, the production costs can be calculated by summing:
• Fuel costs
• Variable operating costs
• Start-up costs
• Emissions costs
In this study, SCE&G is modeled as a mostly isolated system without dynamic transmission connections to surrounding systems. This is appropriate for a planning study as it captures the requirement for SCE&G to maintain self-sufficiency in planning. As SCE&G does have the ability to contract for external power, emergency power imports were allowed at a cost of $300/MWh.
2.3 Forecasting Requirements to Integrate Solar
The necessary additional operating reserves that are needed with solar on the system are estimated using data sets providing by the National Renewable Energy Lab (NREL) specifically for solar integration studies.7 These data sets provide forecasted and real-time solar generation data at sites across South Carolina. In the future, as SCE&G gains experience operating with solar generation, the solar uncertainty analysis can be updated with actual operating data rather than the data provided by NREL. The operating reserve requirements from solar are driven by the level of forecast uncertainty in solar generation. The NREL dataset provides the 4 hour-ahead forecast of hourly solar generation. This is the forecast that SCE&G system operators would use to schedule their units and determine which generators are required to be line. The forecasted solar is compared to the real-time solar generation dataset to calculate the generation variance from the forecast. SCE&G needs to hold sufficient reserves to be able to respond to the worst-case downward variance of solar generation while maintain their reserve requirements. An outcome of the solar uncertainty analysis, described in more detail in Section 3, is that the level of solar generation uncertainty depends on the level of solar generation. The amount of reserves that need to be held by SCE&G for variable integration depend on the level of forecasted solar generation. This 7 https://www.nrel.gov/grid/solar-integration-data.html
ELECTR
ONICALLY
FILED-2019
February84:03
PM-SC
PSC-D
ocket#2019-2-E
-Page46
of62
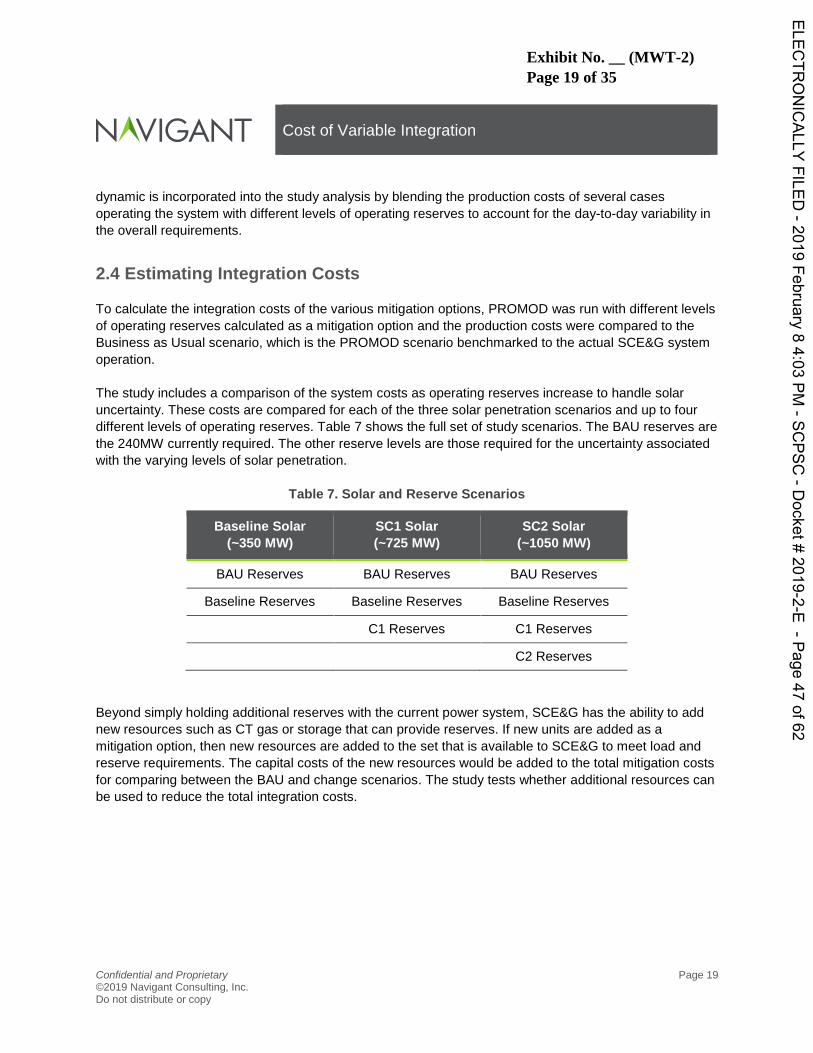
Exhibit No. __ (MWT-2) Page 19 of 35
Cost of Variable Integration
Confidential and Proprietary Page 19 ©2019 Navigant Consulting, Inc. Do not distribute or copy
dynamic is incorporated into the study analysis by blending the production costs of several cases operating the system with different levels of operating reserves to account for the day-to-day variability in the overall requirements.
2.4 Estimating Integration Costs
To calculate the integration costs of the various mitigation options, PROMOD was run with different levels of operating reserves calculated as a mitigation option and the production costs were compared to the Business as Usual scenario, which is the PROMOD scenario benchmarked to the actual SCE&G system operation. The study includes a comparison of the system costs as operating reserves increase to handle solar uncertainty. These costs are compared for each of the three solar penetration scenarios and up to four different levels of operating reserves. Table 7 shows the full set of study scenarios. The BAU reserves are the 240MW currently required. The other reserve levels are those required for the uncertainty associated with the varying levels of solar penetration.
Table 7. Solar and Reserve Scenarios
Baseline Solar (~350 MW)
SC1 Solar (~725 MW)
SC2 Solar (~1050 MW)
BAU Reserves BAU Reserves BAU Reserves
Baseline Reserves Baseline Reserves Baseline Reserves
C1 Reserves C1 Reserves
C2 Reserves Beyond simply holding additional reserves with the current power system, SCE&G has the ability to add new resources such as CT gas or storage that can provide reserves. If new units are added as a mitigation option, then new resources are added to the set that is available to SCE&G to meet load and reserve requirements. The capital costs of the new resources would be added to the total mitigation costs for comparing between the BAU and change scenarios. The study tests whether additional resources can be used to reduce the total integration costs.
ELECTR
ONICALLY
FILED-2019
February84:03
PM-SC
PSC-D
ocket#2019-2-E
-Page47
of62
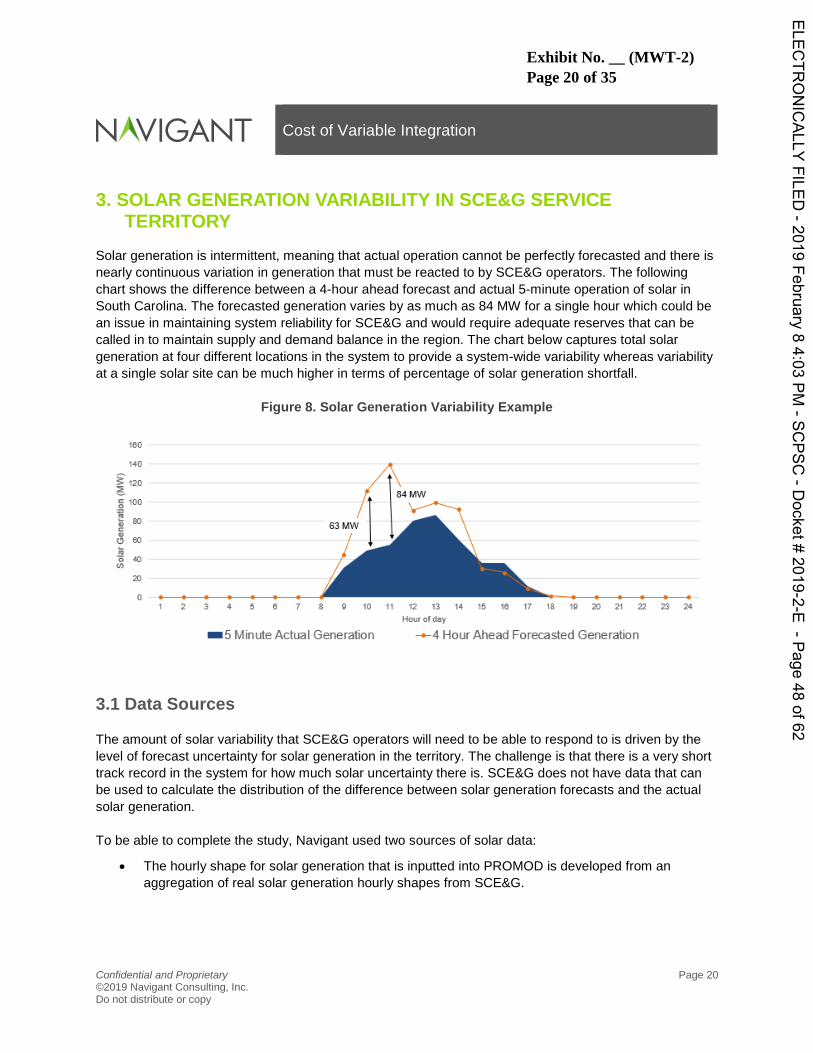
Exhibit No. __ (MWT-2) Page 20 of 35
Cost of Variable Integration
Confidential and Proprietary Page 20 ©2019 Navigant Consulting, Inc. Do not distribute or copy
3. SOLAR GENERATION VARIABILITY IN SCE&G SERVICE TERRITORY
Solar generation is intermittent, meaning that actual operation cannot be perfectly forecasted and there is nearly continuous variation in generation that must be reacted to by SCE&G operators. The following chart shows the difference between a 4-hour ahead forecast and actual 5-minute operation of solar in South Carolina. The forecasted generation varies by as much as 84 MW for a single hour which could be an issue in maintaining system reliability for SCE&G and would require adequate reserves that can be called in to maintain supply and demand balance in the region. The chart below captures total solar generation at four different locations in the system to provide a system-wide variability whereas variability at a single solar site can be much higher in terms of percentage of solar generation shortfall.
Figure 8. Solar Generation Variability Example
3.1 Data Sources
The amount of solar variability that SCE&G operators will need to be able to respond to is driven by the level of forecast uncertainty for solar generation in the territory. The challenge is that there is a very short track record in the system for how much solar uncertainty there is. SCE&G does not have data that can be used to calculate the distribution of the difference between solar generation forecasts and the actual solar generation. To be able to complete the study, Navigant used two sources of solar data:
• The hourly shape for solar generation that is inputted into PROMOD is developed from an aggregation of real solar generation hourly shapes from SCE&G.
ELECTR
ONICALLY
FILED-2019
February84:03
PM-SC
PSC-D
ocket#2019-2-E
-Page48
of62
NAVIGANT
XS 120
c 1QQ
0 80
80
o 40Vl
63 MW
84 MW
~--
1 2 3 4 5 5 7 8 8 10 11 12 13 14 15 18 17 18 18 20 21 22 23 24
Htwf 01 547
~5 Minute Actual Generation 4 Hour Ahead Forecasted Generation
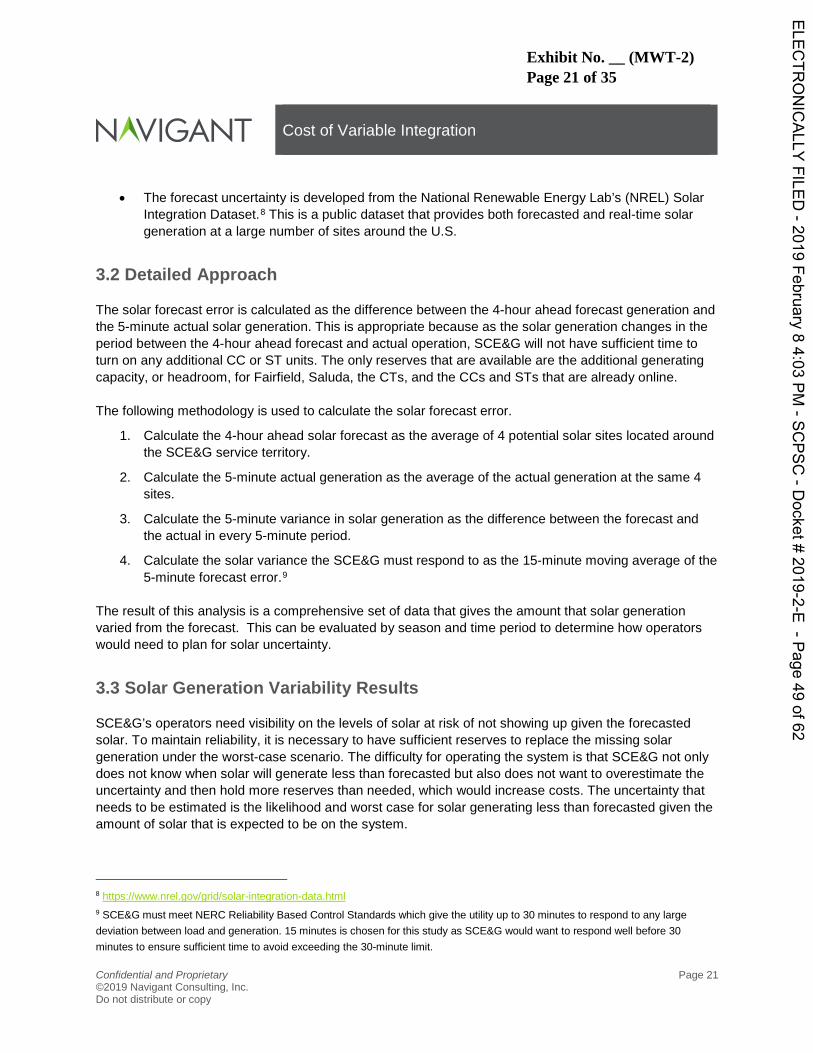
Exhibit No. __ (MWT-2) Page 21 of 35
Cost of Variable Integration
Confidential and Proprietary Page 21 ©2019 Navigant Consulting, Inc. Do not distribute or copy
• The forecast uncertainty is developed from the National Renewable Energy Lab’s (NREL) Solar Integration Dataset.8 This is a public dataset that provides both forecasted and real-time solar generation at a large number of sites around the U.S.
3.2 Detailed Approach
The solar forecast error is calculated as the difference between the 4-hour ahead forecast generation and the 5-minute actual solar generation. This is appropriate because as the solar generation changes in the period between the 4-hour ahead forecast and actual operation, SCE&G will not have sufficient time to turn on any additional CC or ST units. The only reserves that are available are the additional generating capacity, or headroom, for Fairfield, Saluda, the CTs, and the CCs and STs that are already online. The following methodology is used to calculate the solar forecast error.
1. Calculate the 4-hour ahead solar forecast as the average of 4 potential solar sites located around the SCE&G service territory.
2. Calculate the 5-minute actual generation as the average of the actual generation at the same 4 sites.
3. Calculate the 5-minute variance in solar generation as the difference between the forecast and the actual in every 5-minute period.
4. Calculate the solar variance the SCE&G must respond to as the 15-minute moving average of the 5-minute forecast error.9
The result of this analysis is a comprehensive set of data that gives the amount that solar generation varied from the forecast. This can be evaluated by season and time period to determine how operators would need to plan for solar uncertainty.
3.3 Solar Generation Variability Results
SCE&G’s operators need visibility on the levels of solar at risk of not showing up given the forecasted solar. To maintain reliability, it is necessary to have sufficient reserves to replace the missing solar generation under the worst-case scenario. The difficulty for operating the system is that SCE&G not only does not know when solar will generate less than forecasted but also does not want to overestimate the uncertainty and then hold more reserves than needed, which would increase costs. The uncertainty that needs to be estimated is the likelihood and worst case for solar generating less than forecasted given the amount of solar that is expected to be on the system.
8 https://www.nrel.gov/grid/solar-integration-data.html 9 SCE&G must meet NERC Reliability Based Control Standards which give the utility up to 30 minutes to respond to any large deviation between load and generation. 15 minutes is chosen for this study as SCE&G would want to respond well before 30 minutes to ensure sufficient time to avoid exceeding the 30-minute limit.
ELECTR
ONICALLY
FILED-2019
February84:03
PM-SC
PSC-D
ocket#2019-2-E
-Page49
of62

Exhibit No. __ (MWT-2) Page 22 of 35
Cost of Variable Integration
Confidential and Proprietary Page 22 ©2019 Navigant Consulting, Inc. Do not distribute or copy
One outcome of this analysis is that the level of solar variability depends the amount of solar that is generating. At a high level, the higher the percentage of the total installed nameplate facility rating of solar that is generating, the lower the proportion of generation that is at risk. Table 8 shows the full results of this analysis. The rows give the forecasted solar generation as a percentage of the installed nameplate facility rating. The columns give the percentage drop in solar generation. The cells give the conditional probability of a given drop in solar generation given the level of forecasted generation. For example, if 1000 MW of solar was installed on the system and it was forecasted to generate 400 MW, the highlighted cells show:
• There is a 1% chance of a 75% drop – equivalent to 300 MW of solar not showing up (only 100 MW is generated).
• There is a 9% chance of a 25% drop- equivalent to 100 MW of solar not showing up (only 300 MW is generated)
Table 8. Conditional Probability of Solar Variability
Forecasted Generation
>75% Drop
>65% Drop
>55% Drop
>45% Drop
>35% Drop
>25% Drop
>15% Drop >5% Drop
20% 0% 1% 4% 6% 9% 16% 23% 33% 25% 1% 2% 4% 5% 8% 13% 21% 33% 30% 1% 2% 3% 6% 9% 13% 22% 34% 35% 1% 2% 4% 7% 11% 16% 22% 33% 40% 1% 1% 2% 3% 5% 9% 16% 27% 45% 0% 1% 1% 2% 4% 8% 13% 22% 50% 0% 1% 1% 2% 4% 7% 12% 25% 55% 0% 0% 0% 1% 1% 2% 6% 16% 60% 0% 0% 0% 0% 0% 1% 3% 11% 65% 0% 0% 0% 0% 0% 1% 3% 5% 70% 0% 0% 0% 0% 0% 0% 2% 5% Since SCE&G must maintain self-sufficiency, it is necessary to plan for the worst case drops in solar generation. Table 9 gives the solar generation at risk that is used in this study. In each hour, the amount of solar forecasted to generate is calculated and this table is used to calculate the potential drop in solar that the system may need to respond to.
ELECTR
ONICALLY
FILED-2019
February84:03
PM-SC
PSC-D
ocket#2019-2-E
-Page50
of62
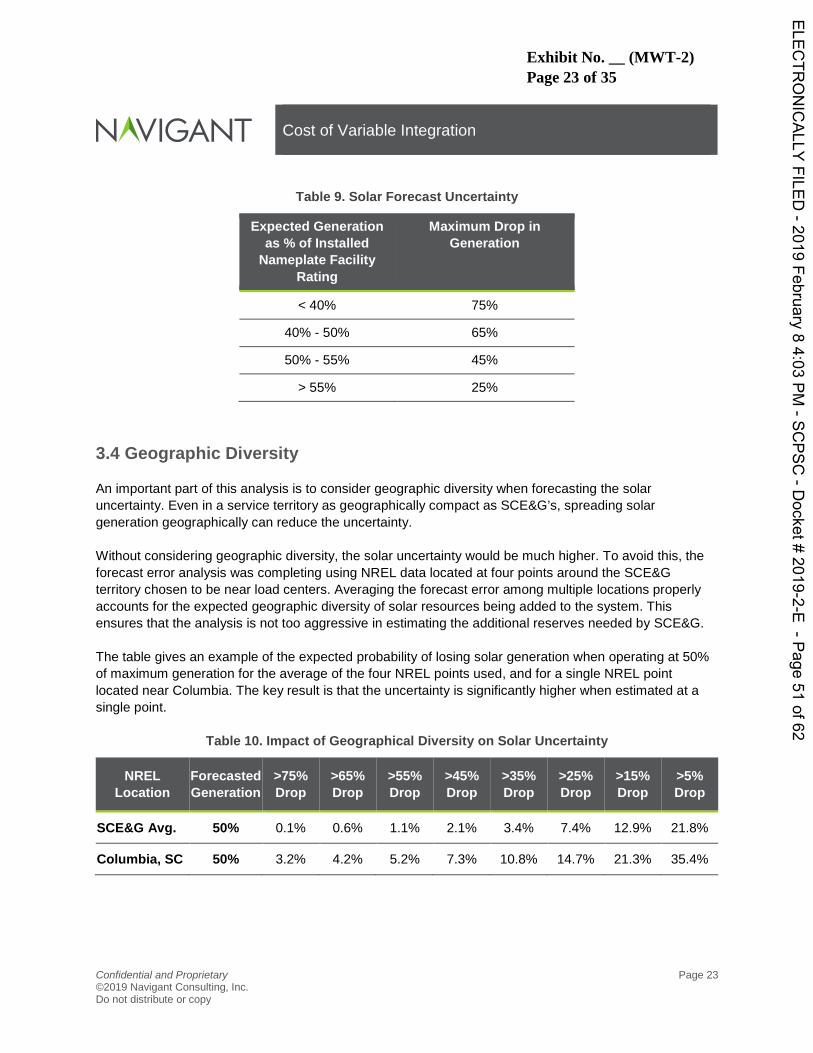
Exhibit No. __ (MWT-2) Page 23 of 35
Cost of Variable Integration
Confidential and Proprietary Page 23 ©2019 Navigant Consulting, Inc. Do not distribute or copy
Table 9. Solar Forecast Uncertainty
Expected Generation as % of Installed
Nameplate Facility Rating
Maximum Drop in Generation
< 40% 75%
40% - 50% 65%
50% - 55% 45%
> 55% 25%
3.4 Geographic Diversity
An important part of this analysis is to consider geographic diversity when forecasting the solar uncertainty. Even in a service territory as geographically compact as SCE&G’s, spreading solar generation geographically can reduce the uncertainty. Without considering geographic diversity, the solar uncertainty would be much higher. To avoid this, the forecast error analysis was completing using NREL data located at four points around the SCE&G territory chosen to be near load centers. Averaging the forecast error among multiple locations properly accounts for the expected geographic diversity of solar resources being added to the system. This ensures that the analysis is not too aggressive in estimating the additional reserves needed by SCE&G. The table gives an example of the expected probability of losing solar generation when operating at 50% of maximum generation for the average of the four NREL points used, and for a single NREL point located near Columbia. The key result is that the uncertainty is significantly higher when estimated at a single point.
Table 10. Impact of Geographical Diversity on Solar Uncertainty
NREL Location
Forecasted Generation
>75% Drop
>65% Drop
>55% Drop
>45% Drop
>35% Drop
>25% Drop
>15% Drop
>5% Drop
SCE&G Avg. 50% 0.1% 0.6% 1.1% 2.1% 3.4% 7.4% 12.9% 21.8%
Columbia, SC 50% 3.2% 4.2% 5.2% 7.3% 10.8% 14.7% 21.3% 35.4%
ELECTR
ONICALLY
FILED-2019
February84:03
PM-SC
PSC-D
ocket#2019-2-E
-Page51
of62

Exhibit No. __ (MWT-2) Page 24 of 35
Cost of Variable Integration
Confidential and Proprietary Page 24 ©2019 Navigant Consulting, Inc. Do not distribute or copy
4. DEMONSTRATING THE NEED FOR ADDITIONAL RESERVES SCE&G reliability is threatened when there is insufficient system ramping capability to meet potential drops in solar generation while maintaining the required reserves.
4.1 Reliability Challenges without Adding Reserves for Variable Integration
In each hour of the forecast, the following process is used to calculate whether SCE&G has any reliability issues from solar generation that need to be mitigated.
1. Calculate the total amount of ramping capability on the system. – This is the sum of the ramping up capability of online units and the capacity of quick start
units that can be turned on. – This will be at least the total reserve requirement (240 MW) but is typically more
depending on how the system is operating.
2. Calculate the potential lost solar generation due to forecast uncertainty.
3. Subtract the lost solar generation from the system ramping capability.
4. Flag any hours in which the minimum reserve requirement is not met as reliability violations. The table below shows 3 hours in which there are reserve shortfalls if the system only requires 240 MW reserves but includes risk of solar generation being out. These sample hours are the reason that SCE&G operators must hold more reserves for the solar uncertainty.
Table 11. Example of Hours with Reserve Shortages
Hour Load CC Ramp (Gen)
CT Ramp (Gen)
Saluda Ramp (Gen)
Fairfield Ramp (Gen)
Interruptible Load for reserves
Total Reserves
Online
Risk of Solar Out
Reserves Shortage
after Solar
3/1/20, 10am 3793MW 0MW
(1685MW) 74MW
(216MW) 164MW (30MW)
42MW (246MW) 100MW 281MW 60MW 30MW
9/10/24, 3PM 4240MW 96MW
(1274MW) 67MW
(265MW) 8MW
(186MW) 0MW
(576MW) 100MW 271MW 44MW 24MW
8/1/25, 3PM 4653MW 0MW
(1777MW) 96MW
(235MW) 126MW (68MW)
0MW (576MW) 100MW 322MW 133MW 62MW
While in most hours there are more than the minimum reserves, there are a material number of hours in each scenario for which additional reserves would need to be held for the solar generation. PROMOD was used to simulate the system operation in each solar penetration scenario and the number of hours in the forecast period in which SCE&G was not holding sufficient reserves to account for solar
ELECTR
ONICALLY
FILED-2019
February84:03
PM-SC
PSC-D
ocket#2019-2-E
-Page52
of62
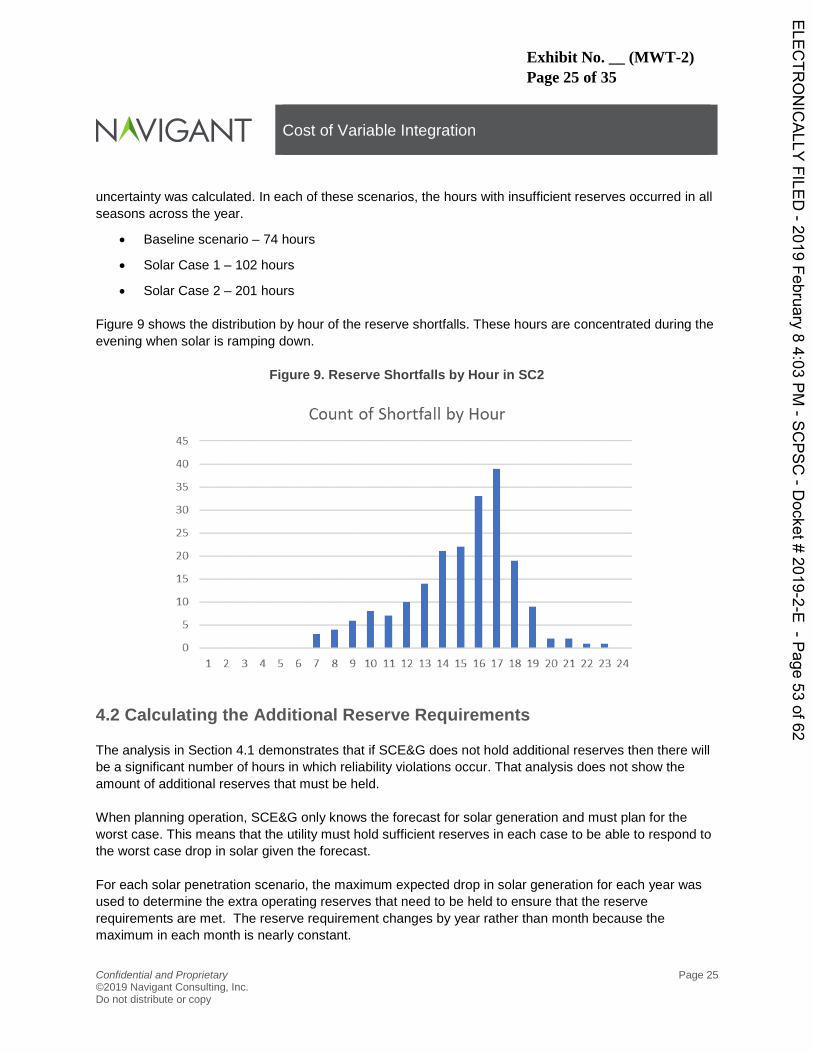
Exhibit No. __ (MWT-2) Page 25 of 35
Cost of Variable Integration
Confidential and Proprietary Page 25 ©2019 Navigant Consulting, Inc. Do not distribute or copy
uncertainty was calculated. In each of these scenarios, the hours with insufficient reserves occurred in all seasons across the year.
• Baseline scenario – 74 hours
• Solar Case 1 – 102 hours
• Solar Case 2 – 201 hours Figure 9 shows the distribution by hour of the reserve shortfalls. These hours are concentrated during the evening when solar is ramping down.
Figure 9. Reserve Shortfalls by Hour in SC2
4.2 Calculating the Additional Reserve Requirements
The analysis in Section 4.1 demonstrates that if SCE&G does not hold additional reserves then there will be a significant number of hours in which reliability violations occur. That analysis does not show the amount of additional reserves that must be held. When planning operation, SCE&G only knows the forecast for solar generation and must plan for the worst case. This means that the utility must hold sufficient reserves in each case to be able to respond to the worst case drop in solar given the forecast. For each solar penetration scenario, the maximum expected drop in solar generation for each year was used to determine the extra operating reserves that need to be held to ensure that the reserve requirements are met. The reserve requirement changes by year rather than month because the maximum in each month is nearly constant.
ELECTR
ONICALLY
FILED-2019
February84:03
PM-SC
PSC-D
ocket#2019-2-E
-Page53
of62
NAVIGANT
45
40
35
30
25
20
15
10
Count of Shortfall by Hour
, ital
I'
..1 2 3 4 5 6 7 8 9 10 11 12 13 14 15 16 17 18 19 20 21 22 23 24

Exhibit No. __ (MWT-2) Page 26 of 35
Cost of Variable Integration
Confidential and Proprietary Page 26 ©2019 Navigant Consulting, Inc. Do not distribute or copy
Table 12 shows the maximum additional reserves needed in each solar penetration scenario plus the BAU level of reserves held by SCE&G.
Table 12. Maximum Additional Reserves Needed
Year BAU Baseline SC1 SC2
2019 240 347 421 420 2020 240 348 445 529 2021 240 349 447 579 2022 240 351 448 581 2023 240 352 450 582 2024 240 354 451 584 2025 240 356 453 586 2026 240 358 456 588 2027 240 360 458 590 2028 240 363 460 593 2029 240 365 463 595 2030 240 368 466 598 2031 240 371 469 601 2032 240 375 472 605
One aspect of holding reserves is that SCE&G knows the level of expected solar generation prior to setting the reserves to be held, so the required reserves needed to compensate for a potential drop in solar would be adjusted on a daily or hourly basis.
Table 12 shows the maximum needed reserves necessary, but when calculating the costs, it is important to consider that many individual days within each case have lower forecasted solar than the maximum and hence need fewer reserves. For SC2, the analysis shows:
• SC2 level of reserves is needed for 38% of the days
• SC1 level of reserves is needed for 51% of the days
• Baseline level of reserves is needed for 12% of the days
ELECTR
ONICALLY
FILED-2019
February84:03
PM-SC
PSC-D
ocket#2019-2-E
-Page54
of62
Exhibit No. __ (MWT-2) Page 27 of 35
Cost of Variable Integration
Confidential and Proprietary Page 27 ©2019 Navigant Consulting, Inc. Do not distribute or copy
To ensure that the analysis does not overestimate the costs to integrate the SC2 reserves, PROMOD was run with each of these levels of reserves and then the results were blended using the weighted average of costs tied to the number of days that each level of reserves was required.
ELECTR
ONICALLY
FILED-2019
February84:03
PM-SC
PSC-D
ocket#2019-2-E
-Page55
of62
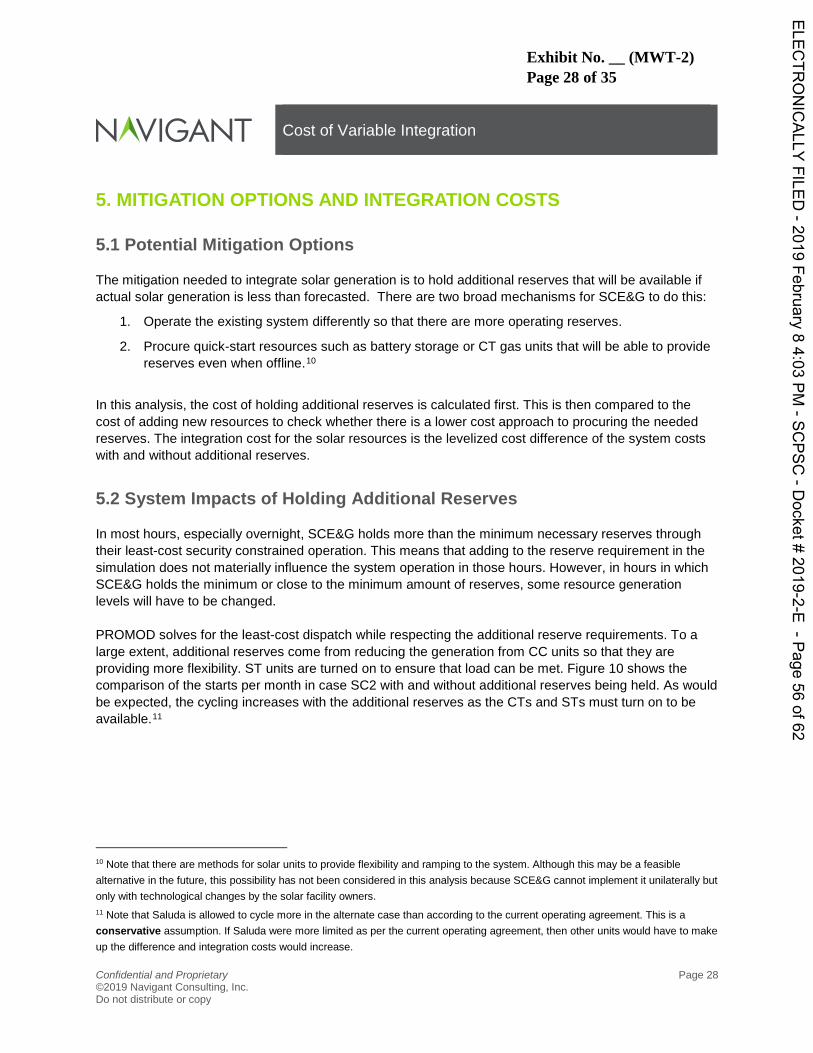
Exhibit No. __ (MWT-2) Page 28 of 35
Cost of Variable Integration
Confidential and Proprietary Page 28 ©2019 Navigant Consulting, Inc. Do not distribute or copy
5. MITIGATION OPTIONS AND INTEGRATION COSTS
5.1 Potential Mitigation Options
The mitigation needed to integrate solar generation is to hold additional reserves that will be available if actual solar generation is less than forecasted. There are two broad mechanisms for SCE&G to do this:
1. Operate the existing system differently so that there are more operating reserves.
2. Procure quick-start resources such as battery storage or CT gas units that will be able to provide reserves even when offline.10
In this analysis, the cost of holding additional reserves is calculated first. This is then compared to the cost of adding new resources to check whether there is a lower cost approach to procuring the needed reserves. The integration cost for the solar resources is the levelized cost difference of the system costs with and without additional reserves.
5.2 System Impacts of Holding Additional Reserves
In most hours, especially overnight, SCE&G holds more than the minimum necessary reserves through their least-cost security constrained operation. This means that adding to the reserve requirement in the simulation does not materially influence the system operation in those hours. However, in hours in which SCE&G holds the minimum or close to the minimum amount of reserves, some resource generation levels will have to be changed. PROMOD solves for the least-cost dispatch while respecting the additional reserve requirements. To a large extent, additional reserves come from reducing the generation from CC units so that they are providing more flexibility. ST units are turned on to ensure that load can be met. Figure 10 shows the comparison of the starts per month in case SC2 with and without additional reserves being held. As would be expected, the cycling increases with the additional reserves as the CTs and STs must turn on to be available.11
10 Note that there are methods for solar units to provide flexibility and ramping to the system. Although this may be a feasible alternative in the future, this possibility has not been considered in this analysis because SCE&G cannot implement it unilaterally but only with technological changes by the solar facility owners. 11 Note that Saluda is allowed to cycle more in the alternate case than according to the current operating agreement. This is a conservative assumption. If Saluda were more limited as per the current operating agreement, then other units would have to make up the difference and integration costs would increase.
ELECTR
ONICALLY
FILED-2019
February84:03
PM-SC
PSC-D
ocket#2019-2-E
-Page56
of62
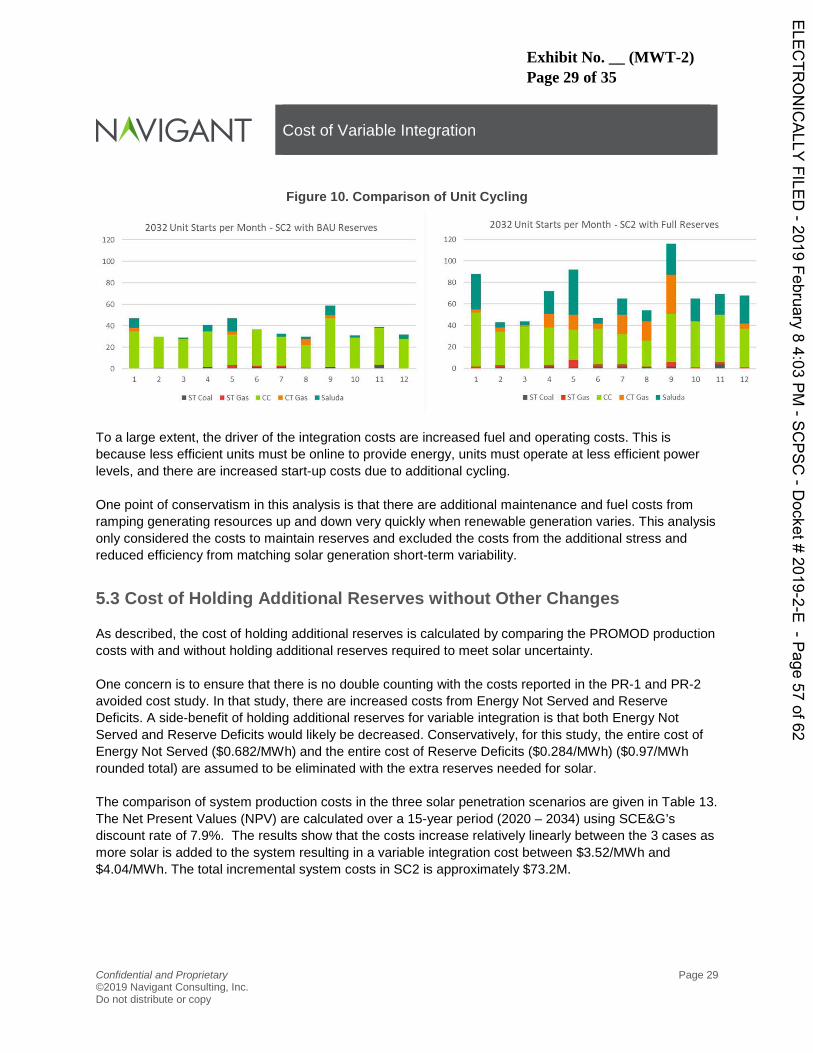
Exhibit No. __ (MWT-2) Page 29 of 35
Cost of Variable Integration
Confidential and Proprietary Page 29 ©2019 Navigant Consulting, Inc. Do not distribute or copy
Figure 10. Comparison of Unit Cycling
To a large extent, the driver of the integration costs are increased fuel and operating costs. This is because less efficient units must be online to provide energy, units must operate at less efficient power levels, and there are increased start-up costs due to additional cycling. One point of conservatism in this analysis is that there are additional maintenance and fuel costs from ramping generating resources up and down very quickly when renewable generation varies. This analysis only considered the costs to maintain reserves and excluded the costs from the additional stress and reduced efficiency from matching solar generation short-term variability.
5.3 Cost of Holding Additional Reserves without Other Changes
As described, the cost of holding additional reserves is calculated by comparing the PROMOD production costs with and without holding additional reserves required to meet solar uncertainty. One concern is to ensure that there is no double counting with the costs reported in the PR-1 and PR-2 avoided cost study. In that study, there are increased costs from Energy Not Served and Reserve Deficits. A side-benefit of holding additional reserves for variable integration is that both Energy Not Served and Reserve Deficits would likely be decreased. Conservatively, for this study, the entire cost of Energy Not Served ($0.682/MWh) and the entire cost of Reserve Deficits ($0.284/MWh) ($0.97/MWh rounded total) are assumed to be eliminated with the extra reserves needed for solar. The comparison of system production costs in the three solar penetration scenarios are given in Table 13. The Net Present Values (NPV) are calculated over a 15-year period (2020 – 2034) using SCE&G’s discount rate of 7.9%. The results show that the costs increase relatively linearly between the 3 cases as more solar is added to the system resulting in a variable integration cost between $3.52/MWh and $4.04/MWh. The total incremental system costs in SC2 is approximately $73.2M.
ELECTR
ONICALLY
FILED-2019
February84:03
PM-SC
PSC-D
ocket#2019-2-E
-Page57
of62
NAVIGANT
2032 Unit Starts per Month - SC2 with BAU Reserves 2032 Unit Starts per Month - SC2 with Full Reserves120
Iiilll( » I(3 6 7 8 9 10 11 12
~ ST Coal ~ ST Gas ~ CC ~ CT Gas ~ Salads
1 2 3 4 9 6 7 8 9 16 11 12
~ ST Coal ~ ST Gas ~ CC ~ CT Gas ~ Saluda

Exhibit No. __ (MWT-2) Page 30 of 35
Cost of Variable Integration
Confidential and Proprietary Page 30 ©2019 Navigant Consulting, Inc. Do not distribute or copy
Table 13. Cost to Integrate Variable Generation
Baseline SC1 SC2
Cost Difference NPV (2020 $) $21,441,812 $46,878,790 $73,242,219
Solar Generation NPV (MWh) 6,091,424 11,603,661 18,495,510
Levelized Cost (2020 $/MWh) $3.52 $4.04 $3.96
Figure 11 shows the incremental levelized cost as reserves are added in each scenario. For example, in SC2, the results show that integration cost are approximately $0.50/MWh if only the baseline solar reserves are needed. These costs increase to $4.02/MWh when all of the reserves required for the SC2 case are required. The expectation is that as solar continues to be added to the system and additional reserves continue to be needed that these costs would increase.
Figure 11. Levelized Costs as Reserves are Added
The breakdown of the cost drivers in SC2 are shown in Table 14. The majority of costs are from additional fuel cost costs but VOM and start-up costs are also material increases in system costs.
ELECTR
ONICALLY
FILED-2019
February84:03
PM-SC
PSC-D
ocket#2019-2-E
-Page58
of62
NAVIGANT
$4.50
$4.00
Q $3.50
~ $3.00
g $2.500~ $2.00
g 5150
5 51.00
$0. 50
50.00BAU Baseline SC1 SC2
Operating Reserves
~Baseline ~SC1 ~SC2

Exhibit No. __ (MWT-2) Page 31 of 35
Cost of Variable Integration
Confidential and Proprietary Page 31 ©2019 Navigant Consulting, Inc. Do not distribute or copy
Table 14. Breakdown of Incremental Costs in SC2
VOM Fuel Emission Start-up Total
Cost Difference NPV ($) $13,941,615 $40,320,211 $48,760 $19,103,954 $73,242,219
Generation NPV (MWh) 18,495,510
Levelized Cost ($/MWh) $0.75 $2.18 $0.003 $1.03 $3.96
% of Total Cost 19% 55% 0% 26% 100%
5.4 Screening the Potential to Mitigate with Additional Resources
In SC2, the NPV of the cost of holding additional reserves for variable integration is $73.2M driven by the need for additional reserves of approximately 350MW. If SCE&G can add resources that can provide these reserves for less than incremental cost, then it would be possible to reduce the overall integration costs of solar to the system.12 For providing reserves, the best options are quick-start gas CTs or battery storage. This study considered the following resources and costs:
• Quick-start CT - $700/kW overnight cost
• 1-hour Lithium-Ion Battery - $800/kW overnight cost13
• 2-hour Lithium-Ion Battery - $1000/kW overnight cost At a high level, this implies that SCE&G could add approximately 110 MW of quick-start CT, approximately 95 MW of 1-hour battery, or approximately 75 MW of 2-hour battery. None of these capacities would be sufficient to meet the additional reserve requirements of the solar generation.14 .
12 Note that if solar units were operated to provide flexibility to the system, the integration costs borne by SCE&G would be reduced. 13 Note that this cost assumes technology improvement and cost declines through 2025 14 To do a full analysis of mitigation with additional resources it would be necessary to also calculate additional benefits and costs associated with owning and operating these resources. The current analysis is only a screening to demonstrate that the additional of these resources is not able to reduce the overall integration costs.
ELECTR
ONICALLY
FILED-2019
February84:03
PM-SC
PSC-D
ocket#2019-2-E
-Page59
of62

Cost of Variable Integration
Confidential and Proprietary Page A-1 ©2019 Navigant Consulting, Inc. Do not distribute or copy
MARKET MODELING PROCESS
Navigant’s market modeling approach relies on a multifaceted approach for modeling and simulating the energy market and studying the performance of energy assets in the marketplace. Navigant’s approach relies on the involvement of numerous subject matter experts with specific knowledge and understanding of several fundamental assumptions, such as fuel pricing, generation development, transmission infrastructure expansion, asset operation, environmental regulations, and technology deployment. From our involvement in the industry, Navigant has specific and independent views on many of these fundamental assumptions based on our knowledge and understanding of the issues. Provided below is an overview of the modeling process.
A.1 Electric Market Simulation
A diagram depicting the models used in Navigant’s market modeling can be seen in Figure A-1. Navigant’s proprietary Portfolio Optimization Model (POM) is a linear optimization model used for capacity expansion. POM simulates economic investment decisions and power plant dispatch on a zonal basis subject to capital costs, reserve margin planning requirements, RPS, fuel costs, fixed and variable operations and maintenance costs, emissions allowance costs, and zonal transmission interface limits. This model incorporates the same generation base, demand forecasts, fuel prices, other operating costs, and plant parameters that are utilized throughout the market simulation modeling process. The model simultaneously performs least-cost optimization of the electric power system expansion and dispatch in multi-decade time horizons. POM can perform multivariate optimization, which can consider value propositions other than cost minimization, such as sustainability, technological innovation, or impacts on other sectors, such as natural gas. The generation expansion results from POM are used in the fundamental energy price forecast. Navigant uses PROMOD, a commercially-available software, to develop its wholesale energy market price and plant performance forecasts. PROMOD is a detailed energy production cost model that simulates hourly chronological operation of generation and transmission resources on a nodal basis in wholesale electric markets. PROMOD dispatches generating resources to match hourly electricity demand, dispatching the least expensive generation first. The choice of generation is determined by the generator’s total variable cost given operating constraints such as ramp rates (for fossil resources) or water availability (for hydraulic resources), and transmission constraints. The total variable cost of the marginally dispatched unit in each hour sets the hourly market clearing price. All generators in the same market area that are selected to run receive the same hourly market clearing price adjusted for losses and congestion, regardless of their actual costs. The LMP’s produced by PROMOD compose Navigant’s structural market price forecasts. Navigant does not employ bid-adders or other exogenous adjustments to prices in the PROMOD forecast. Within PROMOD, production costs are calculated based upon heat rate, fuel cost, and other operating costs, expressed as a function of output. Physical operating limits related to expected maintenance and forced outage, start-up, unit ramping, minimum up time and downtime, and other characteristics are factored into the simulation. Supply offer prices are simulated for each unit within PROMOD that correspond to the minimum price the unit owner is willing to accept to operate the unit. For most generation resources, offer prices are composed primarily of incremental production costs. Incremental production cost is calculated as each unit’s fuel price multiplied by the incremental heat rate, plus variable operations, emissions, and variable maintenance costs.
ELECTR
ONICALLY
FILED-2019
February84:03
PM-SC
PSC-D
ocket#2019-2-E
-Page60
of62
NAVIGANT
APPENDIX A.
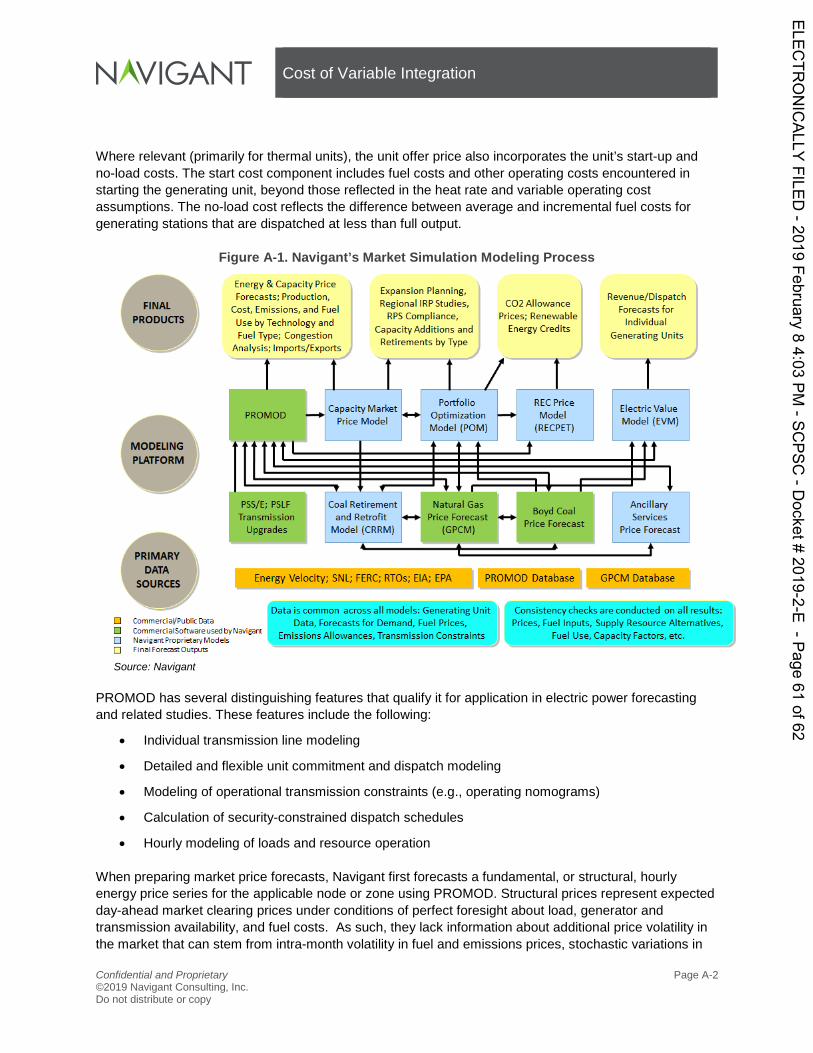
Cost of Variable Integration
Confidential and Proprietary Page A-2 ©2019 Navigant Consulting, Inc. Do not distribute or copy
Where relevant (primarily for thermal units), the unit offer price also incorporates the unit’s start-up and no-load costs. The start cost component includes fuel costs and other operating costs encountered in starting the generating unit, beyond those reflected in the heat rate and variable operating cost assumptions. The no-load cost reflects the difference between average and incremental fuel costs for generating stations that are dispatched at less than full output.
Figure A-1. Navigant’s Market Simulation Modeling Process
Source: Navigant
PROMOD has several distinguishing features that qualify it for application in electric power forecasting and related studies. These features include the following:
• Individual transmission line modeling
• Detailed and flexible unit commitment and dispatch modeling
• Modeling of operational transmission constraints (e.g., operating nomograms)
• Calculation of security-constrained dispatch schedules
• Hourly modeling of loads and resource operation When preparing market price forecasts, Navigant first forecasts a fundamental, or structural, hourly energy price series for the applicable node or zone using PROMOD. Structural prices represent expected day-ahead market clearing prices under conditions of perfect foresight about load, generator and transmission availability, and fuel costs. As such, they lack information about additional price volatility in the market that can stem from intra-month volatility in fuel and emissions prices, stochastic variations in
ELECTR
ONICALLY
FILED-2019
February84:03
PM-SC
PSC-D
ocket#2019-2-E
-Page61
of62
NAVIGANT
FINAL
PRODUCTS
LT Com e t aVPualk DmsP comm t atsonP NamgalsolopllmmtModelsCI e nalso ctaste tp ts
Cost of Variable Integration
Confidential and Proprietary Page A-3 ©2019 Navigant Consulting, Inc. Do not distribute or copy
demand, and deviations of market bidding away from marginal cost bidding. In order to account for this missing volatility and any model error, Navigant incorporates adjustment factors to correlate power price volatility from simulated ex post “backcasts” in PROMOD with historical volatility experienced in the market. Using benchmarks derived from historical data for a rolling three-year period, the PROMOD hourly price forecasts are adjusted to account for the relative difference between actual market prices and PROMOD’s (simulated) prices by season and time period. The actual prices and the simulated prices are grouped and averaged in 18 time blocks differentiated by season (summer, winter, shoulder) and time-of-day (4 hour blocks corresponding to off-peak and peak periods). After eliminating historical price spikes deemed to be unpredictable (two standard deviations outside the time-block average), time-block ratios of actual prices to simulated prices are used to adjust the PROMOD forecast, and these are the final adjusted market prices provided in this report. Navigant also uses GPCM to develop our Reference Case Gas Price Forecast. GPCM is a commercial linear-programming model of the North American gas marketplace and infrastructure. Navigant applies its own analysis to provide macroeconomic outlook and natural gas supply and demand data for the model, including infrastructure additions and configurations, and its own supply and demand elasticity assumptions. Forecasts are based upon the breadth of Navigant’s view, insight, and detailed knowledge of the US and Canadian natural gas markets. Adjustments are made to the model to reflect accurate infrastructure operating capability and the rapidly changing market environment regarding economic growth rates, energy prices, gas production growth levels, demand by sector and natural gas pipeline, storage, and LNG terminal system additions and expansions. To capture current expectations for the gas market, this long-term monthly forecast is combined with near-term New York Mercantile Exchange average forward prices for the first two years of the forecast.
ELECTR
ONICALLY
FILED-2019
February84:03
PM-SC
PSC-D
ocket#2019-2-E
-Page62
of62