Embed Size (px)
Citation preview

Patrick Harris Director, Global Marketing Solutions
Yale Customer Insights Conference

To make the world more open and connected


Technology helps us to understand how
people connect, discover and share
…and here’s what we are
seeing
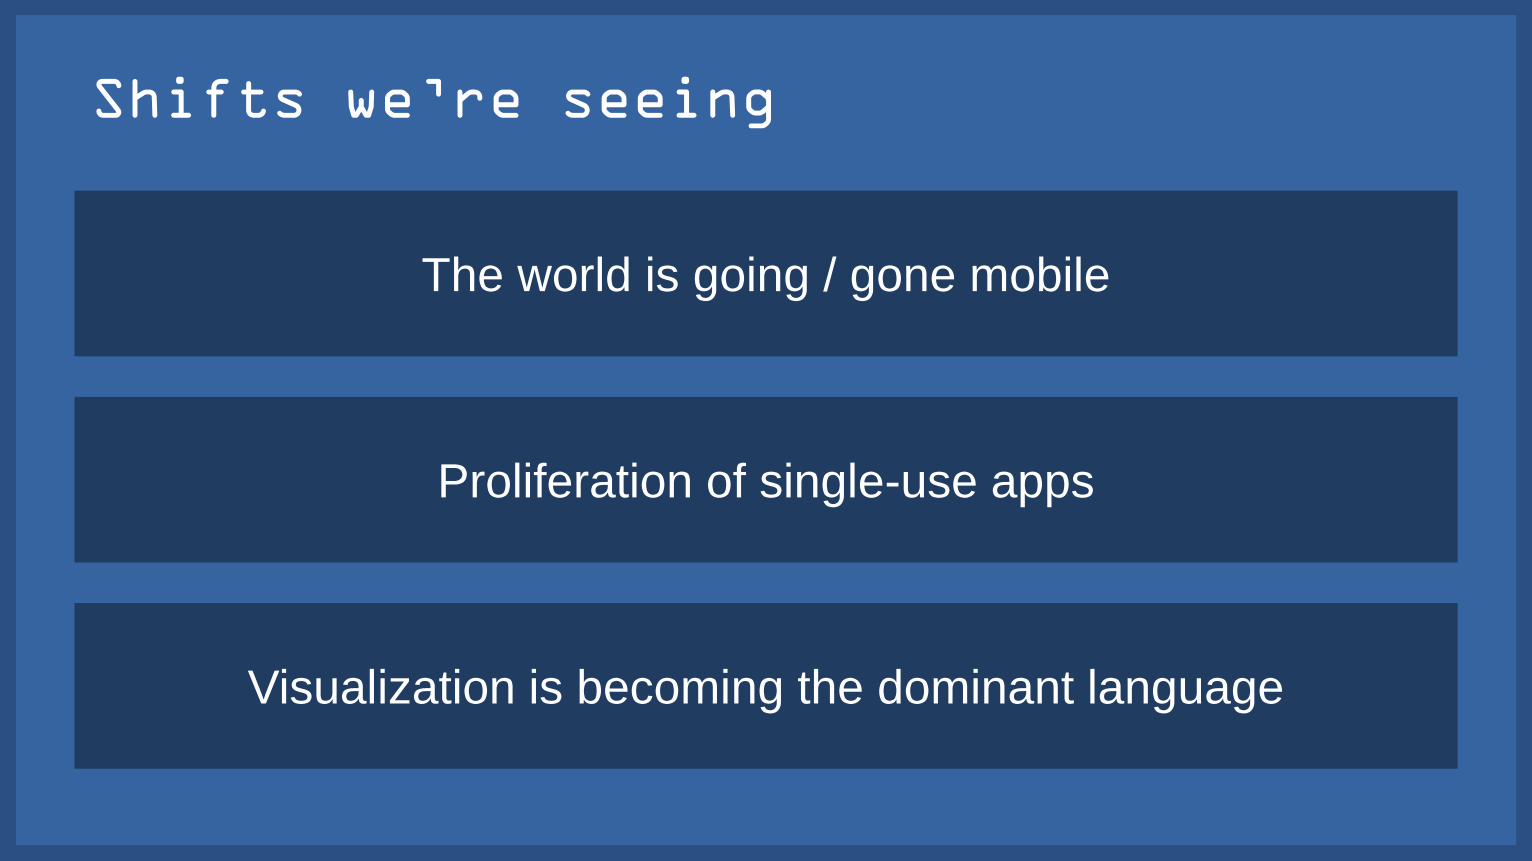
Proliferation of single-use apps
Visualization is becoming the dominant language
The world is going / gone mobile
Shifts we’re seeing
Proliferation of single-use apps
Visualization is becoming the dominant language
The world is going / gone mobile


Media crossover in terms of time
spent (US)
Source: eMarketer, US , September 2014 1950 1960 2000 2010
Radio Television
Digital Mobile 2h 51m
4h 33m
5h 46m
Carolyn

5X
7.2
B 100
92%


Proliferation of single-use apps
Visualization is becoming the dominant language
The world is going / gone mobile

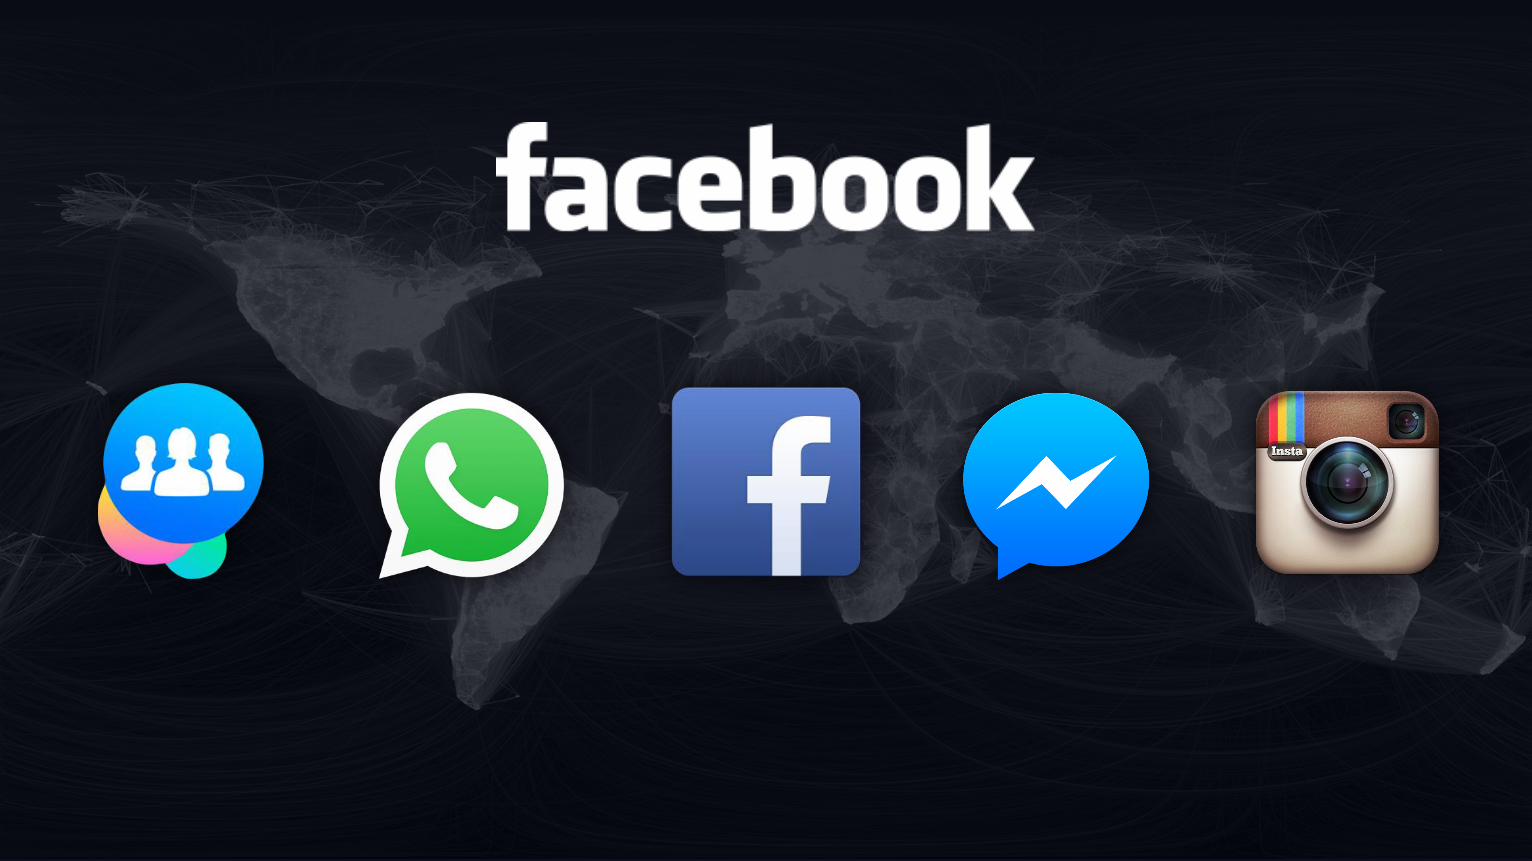
People are using apps
for single uses

Messaging has exploded
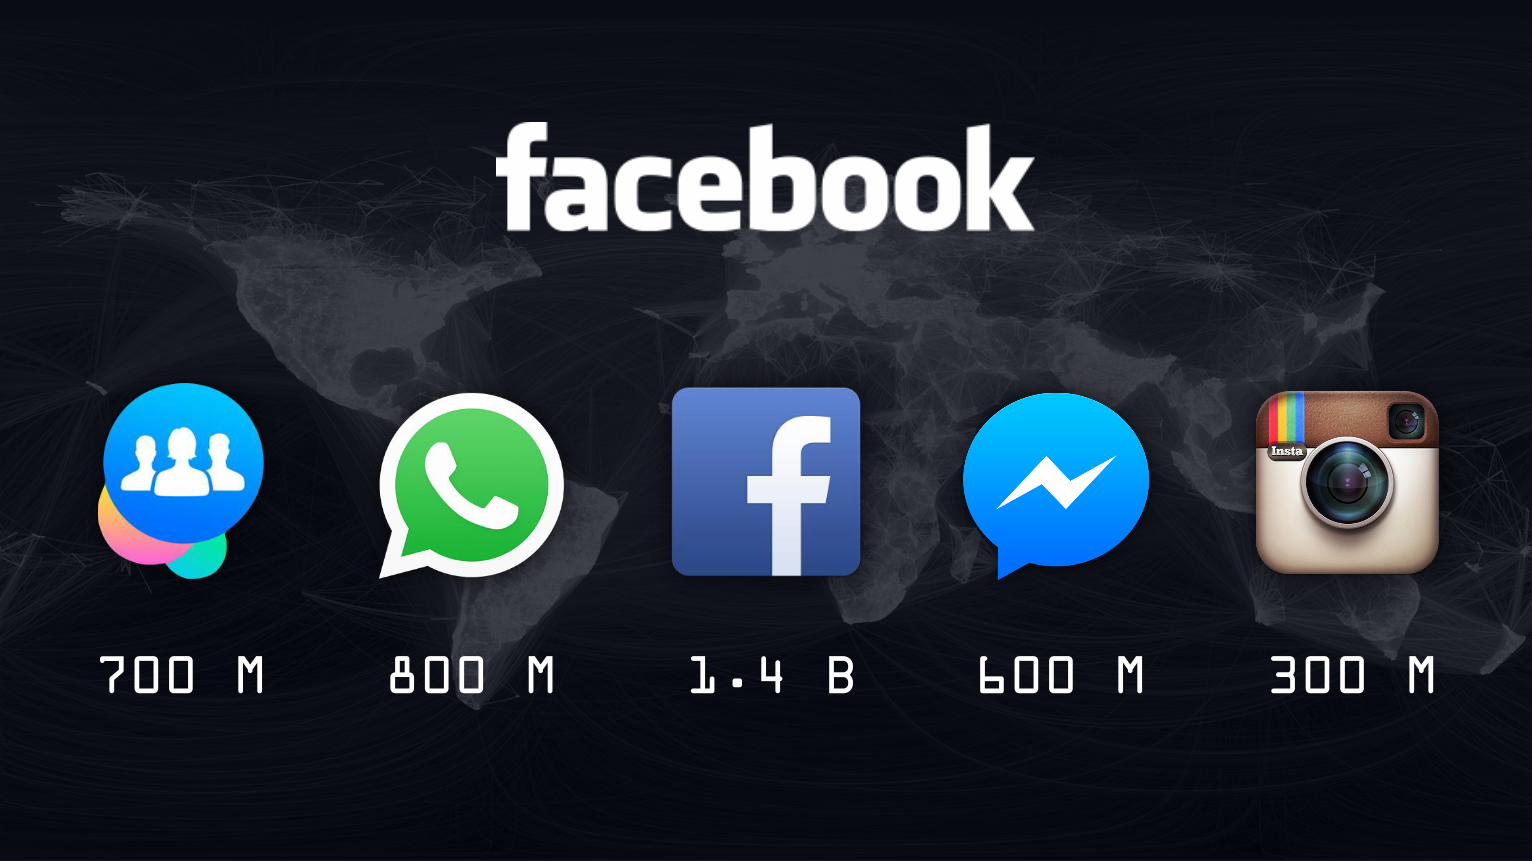
1.4 B 800 M 700 M 600 M 300 M

Proliferation of single-use apps
Visualization is becoming the dominant language
The world is going / gone mobile

1
8
The new visual language
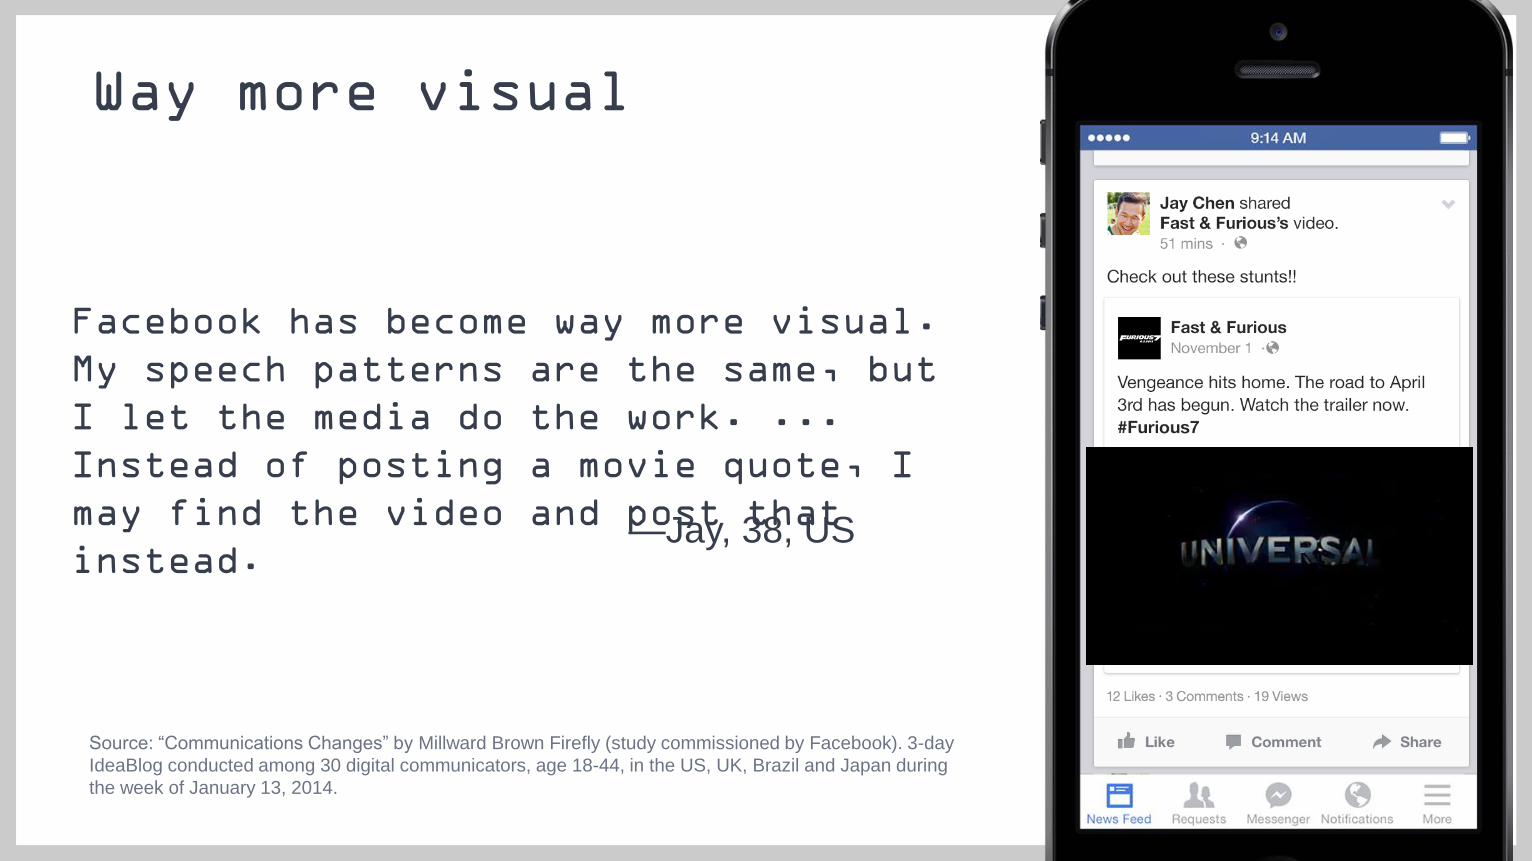
Way more visual
—Jay, 38, US
Source: “Communications Changes” by Millward Brown Firefly (study commissioned by Facebook). 3-day
IdeaBlog conducted among 30 digital communicators, age 18-44, in the US, UK, Brazil and Japan during
the week of January 13, 2014.
Facebook has become way more visual.
My speech patterns are the same, but
I let the media do the work. ...
Instead of posting a movie quote, I
may find the video and post that
instead.
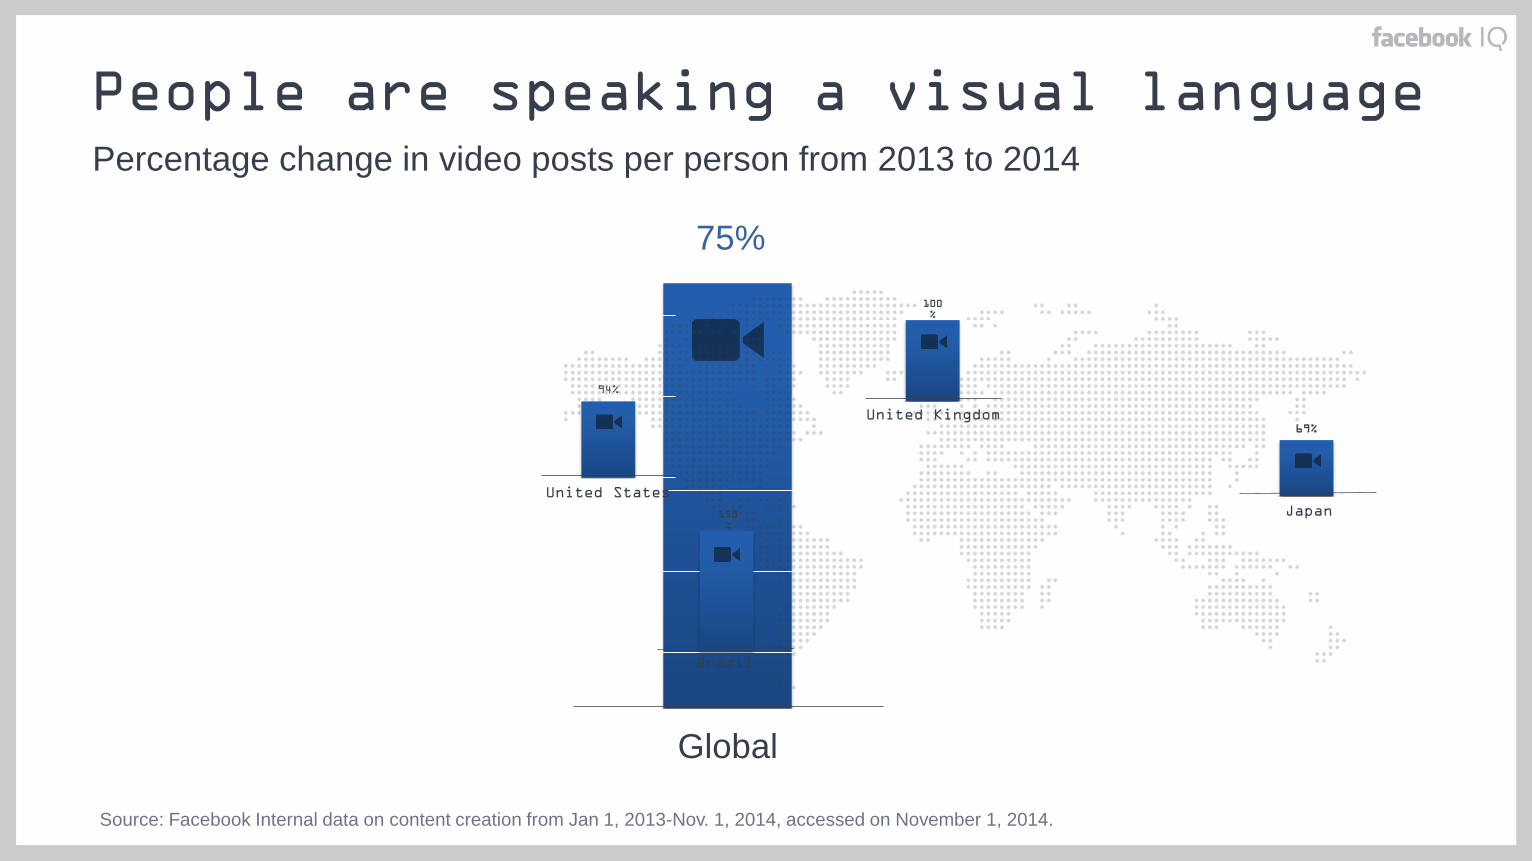
People are speaking a visual language
Source: Facebook Internal data on content creation from Jan 1, 2013-Nov. 1, 2014, accessed on November 1, 2014.
Percentage change in video posts per person from 2013 to 2014
Global
75%
150%
100%
69%
94%
United States
Brazil
Japan
United Kingdom
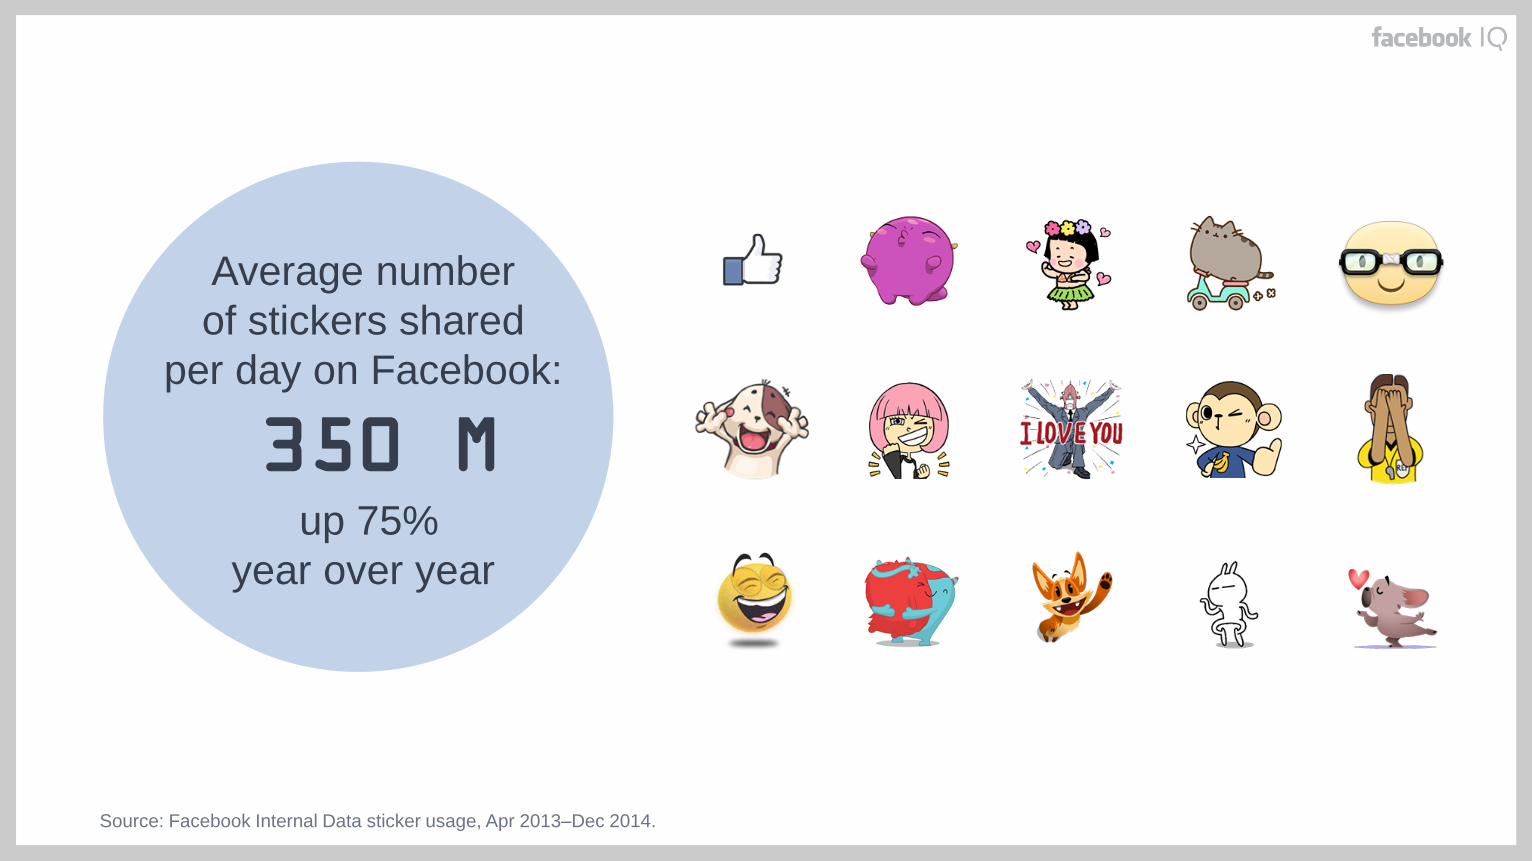
Source: Facebook Internal Data sticker usage, Apr 2013–Dec 2014.
Average number
of stickers shared
per day on Facebook:
350 M up 75%
year over year

300M+ 70M+ Instagrammer
s
(MAPs)
Photos and
videos each
day on Instagram
Source: Instagram Internal Data, Dec 2014.

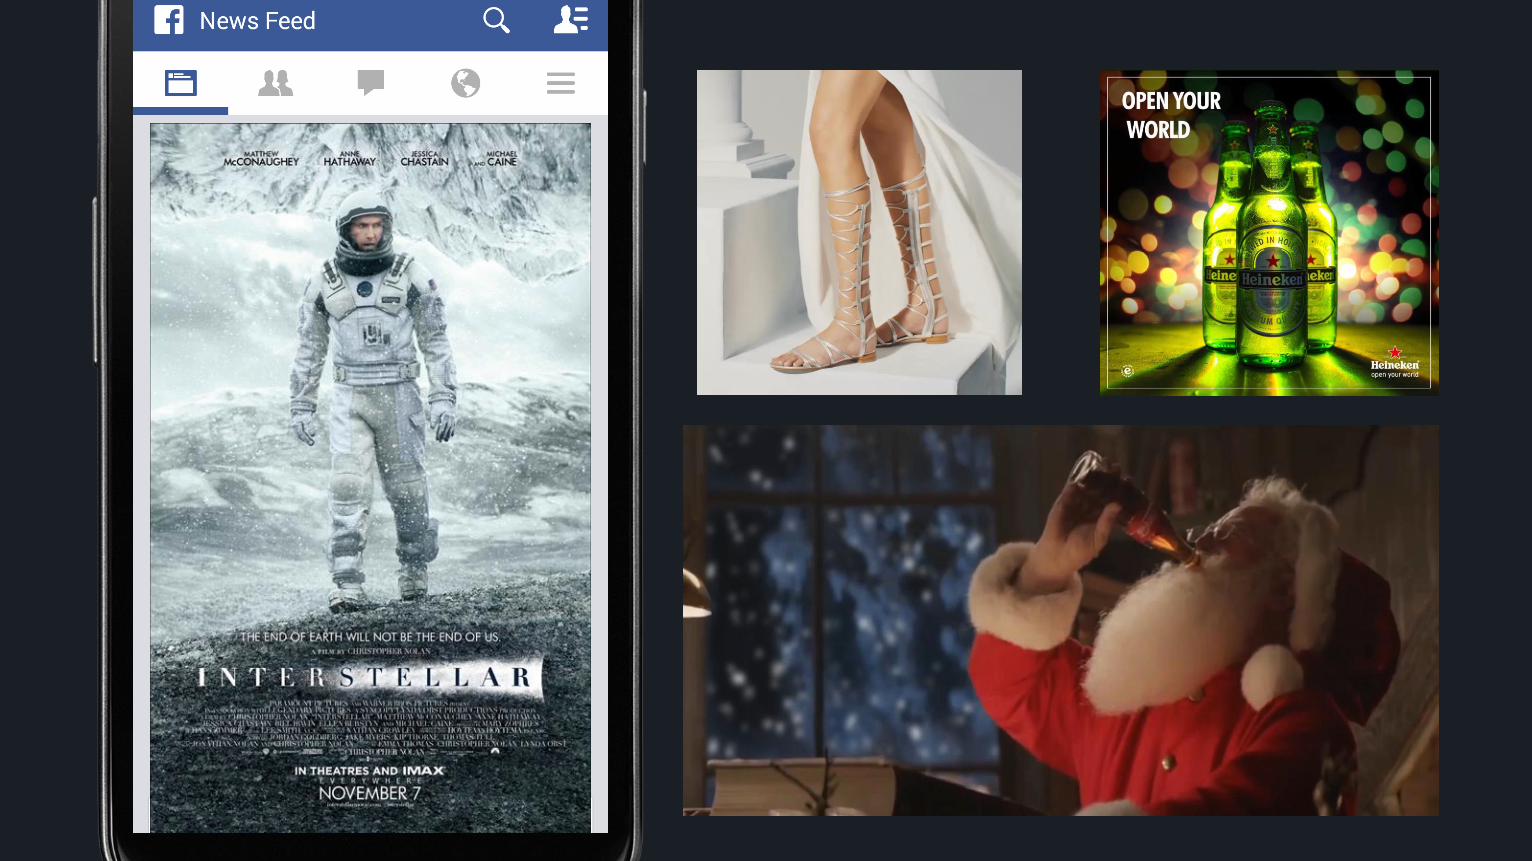
News Feed is seeing more videos
Source: Facebook Internal Data on News Feed composition since 2013, accessed on Nov 1, 2014. Average of randomly selected days from 2013 and 2014.
Globally,
the amount of video in
News Feed has increased
year over year
3.6x

VR / AR
aa
VIDEOS
PHOTOS
Text


Needs Consistent Design
What do you mean?
consistent with what?? the
rest of this deck??
Coca-Cola America is Beautiful

LGBT
Marriage equality
Middle East Descent
Religious freedom
US Hispanic
Opportunity

#1 ASK FROM MARKETERS:
BETTER CREATIVE

Sponsored ・
Volvo Trucks
This is the power of Volvo precision. Never done before,
JCVD says it's the most epic of splits.
OUR ASK: PLAY MORE

VALUE People | Brands