Embed Size (px)
Citation preview

1
Dirty Air in God’s Country: A Preliminary Look at Breast Cancer and Prostate Cancer Exposure via Organochlorine/Dioxin Contaminants from Incinerator Emissions, 1990-1999 John Gabbert Department of Resource Analysis, Saint Mary’s University of Minnesota, Winona, MN 55987 Keywords: ArcMap 8.3, breast cancer, dioxin, environment, French Island, geospatial, GIS, incinerator, La Crosse, municipal waste combustor, Northern States Power, NSP, organochlorine, prostate cancer, SaTScan, spatial analysis, Wisconsin, Xcel Energy Abstract This project seeks to discover a relationship between breast and prostate cancer incidence and organochlorine/dioxin exposure among Wisconsin residents of areas within the prevailing winds of an incinerator emissions plume. The French Island waste incinerator/biomass electrical generating facility in La Crosse, Wisconsin began burning both waste wood and refuse-derived fuels prior to 1990, its first full year doubling as a municipal waste incinerator. The plant's owner, Xcel Energy, was fined in 2002 by the Wisconsin Attorney General for excessive dioxin emissions on a number of occasions between 1995 and 2000. In a related matter, finalized in October, 2003, the USEPA found the facility in violation of the Clean Air Act for emissions of particulates, sulfur dioxide, and hydrogen chloride. The plant, located in a region of Wisconsin popularly known as “God’s Country,” has since improved its pollution control capabilities. The outcome of interest is spatial incidence of breast and prostate cancers among residents of the areas in the state of Wisconsin potentially impacted by the released contaminants. The study documents incidence through state cancer registry data. Exposure is modeled through a seasonal air dispersion flow for winter and for summer prevailing winds, and includes the geography of another potential source of organochlorine/dioxin contaminants, agricultural pesticides. Assumptions in the model, in light of the limited availability of accurate measures of dose and duration of exposure, limit the ability to assess cause. In addition, inferences from the study may also be limited by the probability of multiple factors of etiology, and by long latency of the cancers. Nevertheless, the model and analysis may prove useful for future studies.
While the study used low cost, crude incidence rates, it found elevated rates of breast cancer under the null hypothesis in an area centered near La Crosse County at the end of the 10-year study period. Even though heredity, age, or latency may explain the elevated incidence, further study with finer-resolution data may be required in light of the dioxin/organochlorine exposure in the area. Prostate cancer rates do not appear to be spatially related to the emissions. Yet, the possible presence of hexachlorobenzene in the emissions could be an additive exposure factor for farmers using organochlorine pesticides in the region. Recent studies link prostate cancer to organochlorine pesticides and to hexachlorobenzene, also an organochlorine compound.
Introduction Research Question / Scope of the Study This paper centers on the following research question: Does a geospatial relationship exist between breast and prostate cancer incidence
and organochlorine/dioxin exposure from 1990 to 1999 in Wisconsin residents within an incinerator emissions plume of the French Island waste incinerator / power plant in La Crosse, Wisconsin?
The approach to this question applied a geographic information system (GIS) that
2
sought to discover spatial incidence of breast and prostate cancers among Wisconsin residents via freely available state cancer registry data. Because dioxin is generally associated with waste incineration (Karasek, Dickson 1987), dioxin/organochlorine exposure is assumed from 1990, the first full year the plant burned refuse-derived fuel (RDF). The exposure model takes two geoshapes, one a rough centric model (excluding Minnesota counties), and the other an elongated seasonal airflow model that reflects combined winter and summer winds. In addition, an agricultural land cover of the state sought evidence of any additive cancer incidence effect from similar land-applied organochlorines, such as agricultural pesticides. A respiratory incidence layer of chronic obstructive pulmonary disease (COPD) looked for any echo of the air dispersion model. While the study would have instead preferred children’s asthma incidence, an increasing public health concern, such data was not freely available for years within the study period. Finally, this study used SaTScan (Kulldorff, Nagarwalla 1995), a new space-time statistical software to scan the study areas for significant disease clusters. Study Area and Emissions Point Source The study initially began to research the La Crosse, Wisconsin area for potential causes of, or geospatial relationships to, possible environmentally-related cancers.
One need not look very long before discovering the largest potential source of known carcinogens in the area, an Xcel Energy electrical generating planted burning refuse-derived fuel (RDF), essentially processed garbage. Xcel, formally Northern States Power Co. (NSP) is traded on the New York Stock Exchange as symbol “XCH.” The company has a number of power plants, including nuclear, coal, oil, and natural-gas fired units in Wisconsin, Minnesota, South
Dakota, Colorado, Texas, and New Mexico. Company assets are presently valued at approximately $5.4 billion with $3.5 billion in liabilities and $1.8 billion in stockholder equity (Securities and Exchange Commission, Xcel Energy 2003).
First built as two small coal-fired units in the 1940’s, the French Island plant was converted to oil in 1972, the year prior to the so-called Arab Oil Embargo of 1973. It began burning waste wood, primarily railroad ties in the mid-1980’s (Magney 2002). In 1987, the company installed a “waste-to-energy” (WTE) garbage processing facility to grind and fluff garbage for increased combustibility. From the original 26 MW capacity in two 13 MW steam generators, the plant was upgraded to include two fluidized bed combustors driving a pair of 72 MW turbine generators totaling 144 MW capacity (Mid-Continent Area Power Pool 2001).
La Crosse County contracted with the company for waste disposal as well as with surrounding counties in Minnesota and Wisconsin as a waste disposal service provider in the late 1980’s. Many county and municipal governments in the region agreed to sole source all their garbage to La Crosse County and the Xcel facility (Brommerich 2003). The plant is located at 43.8286 N / -91.2600 W on an Upper Mississippi River island, French Island, within the city of La Crosse, Wisconsin. Xcel operates a similar municipal incinerator combustor power plant at Red Wing, MN, 44.5670 N / -92.5227 W (USEPA Toxic Release Inventory 2001). The Red Wing plant is linked to long range dioxin transport to the Arctic (Commoner, Bartlett, Holger, Couchot 2000).
With the increased incineration in the early 1990’s of old railroad ties treated at a minimum with creosote, permissibly burnable, or with pentachlorophenol (penta), an organochlorine pesticide, or chromium copper arsenate (CCA), both not permissibly burnable (Magney 2002), complaints from French Island residents increased (Scanlan,
3
Midwest Environmental Advocates 2002). Wells in the area were found to be contaminated with creosote. Citizens began to organize their opposition to the plant and its emissions.
As a result of this opposition, and in response to a notice to file a citizen lawsuit under Section 304(b) of the Clean Air Act by the Midwest Environmental Advocates (MEA), both the Wisconsin DNR and the United States Environmental Protection Agency (EPA) focused on the Xcel plant emissions (Magney 2002). MEA convinced state and federal regulators that the plant was indeed a large Municipal Waste Combustor (MWC) and not in the unregulated “small” category. As a large combustor it was, therefore, operating without a valid permit and in violation of state and federal standards for particulate matter, visible emissions, carbon monoxide, dioxin, sulfur dioxide, nitrogen oxides, lead, hydrogen chloride, mercury, and cadmium (Scanlan, Grzezinski 2001).
The Wisconsin DNR Air division pursued an enforcement action against the plant after it failed three successive stack emissions tests for dioxin in 1999. The French Island facility exceeded the allowable dioxin emissions rate of 1.0 ng/dscm (nanogram per dry standard cubic meter) at 7% 02 TEQ (1989 Toxic Equivalent Formula), totaling a range of dioxin emissions at rates estimated from 45 grams to 113 grams over a year of operation (Stibbe 2003). Xcel reported 28 grams total for 2000 (USEPA Toxic Release Inventory 2001).
Xcel was subsequently fined in 2002 by the Wisconsin attorney general (now Governor) James Doyle (Magney 2002). The plant was found to have exceeded dioxin emission standards a number of times between 1995 and 2001 (State of Wisconsin Department of Justice). The company incurred a $167,579 fine, was required to spend another $300,000 to implement an area household hazardous waste collection
program (Magney 2002), and was forced to upgrade its pollution control equipment to meet the standard of the new permit. Most of the cost of the upgrade was borne by La Crosse County and its regional county disposal customers, which paid $10.9 million for the work. Xcel spent another $3.5 million (Magney 2002). The company’s published report (Xcel 2003) of the results of the upgrade work, stating that “emissions at the plant are well below the new federal limits and most have been reduced from 85 to 99 percent,” provides a good example of the value of the Clean Air Act itself.
In a matter initiated in 2001, the U.S. Environmental Protection Agency cited the plant for violations of the Clean Air Act with excess emissions of particulate matter, sulfur dioxide (SO2), and hydrochloric acid (hydrogen chloride, HCl) (Midwest Environmental Advocates 2003). In July, 2003, a proposed settlement announced by the USEPA on its enforcement of those Clean Air Act violations called for a $500,000 fine (Midwest Environmental Advocates 2003). The proposal included a variance, permitting the plant to exceed the required carbon monoxide emission standard of 100 ppm by 100% to 200 ppm (La Crosse Tribune 2003). The Midwest Environmental Advocates challenged the proposal and the variance, and stated that the fine could have been as high as $230 million (Magney 2003). In October, 2003, a federal judge in Madison, Wisconsin accepted the proposed fine and the variance, and angered MEA attorney Melissa Scanlan, who called the agreement a “wake-up call to local citizens.” (Murphy 2003) Specific Human Cancers and Dioxin / Organochlorines
The relationship of breast cancer with environmental dioxin / organochlorine contaminants, according to the National Cancer Institute (NCI), “might be associated with an increase in breast cancer risk.

4
However, the significance of this evidence has been debated.” (National Cancer Institute 2003). Some researchers cite stronger associations, notably Geoffrey M. Jacquez (Jacquez, Greiling 2003) in an NCI-funded re-examination of data from the GIS-related Long Island Breast Cancer Study Project, where initial research found inconclusive links (Gammon et al 2002). The Cape Cod Breast Cancer and the Environment Study uncovered no direct associations. More recently, geospatial cancer researchers await the publication of a new text, “Cancers in the Urban Environment: Residential Patterns in Los Angeles County,” by Thomas M. Mack, epidemiologist at the University of Southern California (USC) for a more definitive understanding.
In Wisconsin itself the state’s health department says in its online page on cancer clusters, “To date, the Department of Health and Family Services (DHFS) has not identified an environmentally caused cancer cluster in Wisconsin. It is not uncommon for people to suspect that the cause of all cancers is some toxic substance in the environment or workplace.” (Wisconsin Department of Health & Family Services 2003)
The environmental association between the organochlorine, hexachlorobenzene (HCB), and its impacts on the prostate gland are as recent as April 2003 (Ralph, Orgebin-Crist, Lareyre, Nelson 2003). In addition, HCB is linked to waste incineration as a possible flue gas associated with dioxins and furans (Agency for Toxic Substances and Disease Registry U.S Public Health Service 2002). Wisconsin companies are not required to report HCB. Nonetheless, the United Nations Environmental Program (UNEP) in its 2001 Stockholm Convention on Persistent Organic Pollutants (POPs) targeted dioxins, furans and HCBs for elimination as among most dangerous “dirty dozen” chemicals (United Nations Environment Programme 2001). The state of Minnesota requires testing for
hexachlorobenzene in the leachate of fly ash from municipal waste combustors (Minnesota Rule 7035.2885).
Dioxin did not become an officially “known human carcinogen” until January 2001 when an environmental lawsuit forced its recognition first in an addendum to the Ninth (now 10th) Report on Carcinogens, National Toxicology Program (NTP), U.S. Health and Human Services (USHHS 2002). The total number of dioxins is about 75, including one of the most toxic, “TCDD,” or 2,3,7,8-tetrachlorodibenzo-p-dioxin. Organochlorines are a class of organic chemical compounds, including dioxin, as well as PCBs (polychlorinated biphenyls), CFCs (chlorinated fluorocarbons), HCB (hexachlorobenzene), DDT (dichlorodiphenyltrichloroethane), and DDE (dichlorodiphenylethylene, a metabolite of DDT in the body). All these, along with the furans, similar in structure and toxicity to the dioxins, and called “dioxin-like” by the U.S. Environmental Protection Agency (USEPA 2001), are now recognized as known carcinogens and problematic environmental contaminants (Colborn, Dumanoski, Myers 1997).
Like the infamous organochlorines DDT and PCBs, dioxins are “fat-loving bio-accumulators” that build up in human and animal tissue as contaminants (Colborn, Dumanoski, Myers 1997). They first came into widespread public knowledge as part of “Agent Orange,” the defoliant mixture of a dioxin herbicide, 2,4,5-T, and another herbicide, 2,4-D, during the Vietnam War, when Operation Ranchhand sprayed hundreds of thousands of gallons of it from airborne tankers over the southeast Asian countryside from 1962 to 1971 (Buckingham 1983). Subsequent health problems in both returning Vietnam veterans and in the Vietnamese population created an awareness of the dangers of dioxin exposure that appears to echo in the La Crosse area today.

5
Indeed, Wisconsin’s chief medical officer, Dr. Henry A. Anderson, and the state toxicologist, Mark A. Werner, both of the Department of Health and Family Services, called on the Wisconsin DNR in early 2002 to test the food supply in the La Crosse area for dioxin contamination. However, the DNR said it had neither the budget nor the scientific resources for such a study, and no study was begun (Magney 2002).
Dioxin’s effects cause it to act as an immunosuppressant; it is associated with lymphoma, it influences thyroid function, blood glucose levels, sexual development, and testosterone production. In rats, dioxin acts with PCBs to alter liver function. In monkeys, it is linked to the painful uterine disorder endometriosis (Steingraber 1997).
Breast cancer risks among U.S. women, in general, estimate that 1 in 8 (13.3%) U.S. women will contract breast cancer in her lifetime, according to the NCI. The federal agency also found that abortion or miscarriage does not increase risk; nor does underarm deodorant. However, they do estimate that 36 to 85% of women with altered breast cancer genes, BRCA1 or BRCA2, will develop breast cancer in their lifetimes. The recognized latency period for breast cancer to develop is from 10 to 20 years. The Institute believes that the evidence on occupational, environmental, or chemical exposures related to breast cancer is limited. They do acknowledge that there is some evidence that organochlorine residues in the environment might be associated with an increase in breast cancer risk, yet they also state that the significance of this research is still being debated, and that research is in progress on the effects of various environmental factors. (NCI 2003)
Generally, researchers believe that organochlorines mimic estrogen in humans, and masquerade as the hormone that prepares the female for gestation by thickening the uterine lining and increasing breast tissue for lactation (Colborn, Dumanoski, Myers1997).
Furthermore, one recent study suggests that cadmium (Cd), a heavy metal often present in municipal waste combustor emissions, may also mimic estrogen in breast tissue “with potent estrogen-like activity in vivo” (Johnson et al 2003).
Prostate cancer, on the other hand, now has definitive links to environmental and occupational hazards. As recently as May 2003, agricultural pesticides appear to be causal, according to NCI, with “evidence of a possible association with prostate cancer among pesticide applicators (NCI 2003).” Applicators using methyl bromide, a common soil and grain bin fumigant, show increased risk in all men. In addition, men with a family history of prostate cancer and exposure to six pesticides, chlorpyrifos, coumaphos, fonofos, phorate, permethrin, and butylate, show increased risk. Other research shows that applicators of older chlorinated pesticides, including aldrin, chlordane, dieldrin, DDT, 2,4,5-T, heptachlor, and toxaphene, also have higher risk (Alavanja et al 2003). Several of these chlorinated pesticides are also on the UNEP Stockholm Convention on POPs (persistent organic pollutants) “dirty dozen” list and targeted for elimination (United Nations Environment Programme 2001).
Confounders to these findings point out the highly hazardous nature of the farming occupation. In addition to a high risk for accident, farmers also are exposed to pesticides, exhausts, solvents, dusts, animal viruses, fertilizers, fuels, and specific microbes, according to NCI. Age, family history, and African-American ethnicity, hormonal factors, high levels of animal fat and red meat in the diet are also suspected prostate cancer risk factors. A small increased risk occurs as well with vasectomy (National Cancer Institute. 2003).
No reports on hexachlorobenzene are made to the U.S. Environmental Protection Agency (USEPA) from the plant, however, the association of HCB with municipal waste

6
incinerators is well-established (Tobin 1986). Other recent research from April, 2003 shows HCB as a prostate androgen disruptor, and therefore a potential cancer risk factor (Ralph, Orgebin-Crist, Lareyre, Nelson. 2003). The latency period of prostate cancer is typically more than 20 years. Data Collection Disease Incidence Data The incidence trends of these two cancers in Wisconsin and elsewhere are divergent. Breast cancer is on a slowly increasing slope for the last 15 years in Wisconsin, and also, nationally and internationally. The Wisconsin 1998 invasive breast cancer rate is 111.2 per 100,000 females. In the United States in 1998 the invasive breast cancer rate was 110 per 100,000 females. (Invasive cancer, which has spread to other tissue beyond its original site, is tracked separately in the statistics from in situ cancers, or that which has not spread from the original site.) Spatially-oriented cancer researchers are not yet in full consensus about the best method for spatial age-adjustment (Wiggins 2002). The Wisconsin numbers are age-adjusted rates per the 1970 standard census from the Wisconsin Cancer Registry. The U.S. numbers are from the National Cancer Institute.
Prostate cancer, on the other hand, has declined in Wisconsin and nationally since 1992, the year of the widespread introduction of the prostate specific antigen (PSA) test, accompanied everywhere in the statistical charts nationally with a spike in incidence, and as a result, many cancers discovered among U.S. men. The Wisconsin prostate cancer incidence rate for 1998 was 122 per 100,000 males. The United States 1997 rate was 139 per 100,000. The Wisconsin numbers are age-adjusted rates per the 1970 standard census from the Wisconsin Cancer Registry. The U.S.
numbers are from the National Cancer Institute.
While cataloging disease has likely occurred in western society since the Middle Ages and the Black Plague (National Cancer Institute 2000), cancer registries, the formal places of record for cancer cases, had a start in 1935 with the Connecticut Tumor Registry, (Savino 2003). The microcomputer revolution in the 1980’s added momentum, and by 1994 the Centers for Disease Control and Prevention (CDC) of the U.S. Department of Health and Human Services (HHS) began managing the National Program of Cancer Registries. This effort enabled the 10 states then without a cancer registry to begin one. All the nation’s cancer registries now participate in the North American Association of Central Cancer Registries, Inc. (NAACCR), an organization that sets standards and policy for uniform data and rules. The association’s GIS Workgroup recently published its best practices manual, “Using Geographic Information Systems Technology in the Collection, Analysis and Presentation of Cancer Registry Data: An Introduction to Basic Practices” (Wiggins 2002). Both Minnesota’s Cancer Surveillance System and Wisconsin’s Cancer Reporting System comprise extensive state cancer registries. The Wisconsin Cancer Reporting System, Bureau of Health Information, Wisconsin Department of Health and Family Services, provided invaluable guidance, in addition to the core data, for this study. Their data included 1990 to 1999 cancer incidence counts for breast cancer and prostate cancer by individual county, incidence totals for both cancers by year aggregated by county into two separate sets of study groups, and population estimates per year by county. In addition, 1999 chronic pulmonary obstructive disease (COPD) incidence counts by county stem from the Bureau of Health Information, Wisconsin Department of Health and Family Services.

7
Wind / Climatic Data The study created a plume shape from an average of 30 years of hourly wind readings “blowing to” the official weather anemometer (National Center for Atmospheric Research 2003) at the La Crosse airport (LSE), located at 43.8833N / -91.2500 W. This data derives from the Solar and Meteorological Surface Observation Network (SAMSON), National Climatic Data Center, 1961-1990. A freeware program, “WRPLOTVIEW” from Lakes Environmental, plotted the composite. Geographic Data Geographic land cover data derives from “WISCLAND,” the Wisconsin land cover data, via the Wisconsin State Cartographer from United States Geological Survey (USGS) Landsat satellite imagery, primarily from 1992 flights, yet including some flights from 1991 to 1993. Wisconsin geography is GCS Assumed Geographic Projection, North American Datum 1927 (NAD 27). Methods Study Group Delineation ESRI ArcMap© software delineated the aggregated groups for two separate geographic shapes in the study area. The first, labeled Study Group “A,” (Figure 1) used a centric approach commonly applied in disease research. This centered model was altered by the fact that it did not include Minnesota counties lying on its western side. This preliminary study focused on Wisconsin cancer incidence data only. Applying the wind rose to the state map created an area that resembled the shape of the prevailing winds plot, a composite of winds blowing generally from the south and southeast to the north and northwest in summer, and from the northwest to the
Figure 1. Study Group “A” Centric Model with A, B, C, and D (Remainder of the State) County Groups. southeast in winter. Placed together these shapes resemble a “broken L” (Figure 2), hence the “L” label. The shape is thus representative of contaminants released by
Figure 2. Thirty Year Wind Rose Plot for La Crosse Airport (LSE) 1961-1990. the plant. The La Crosse Airport (LSE) anemometer and the French Island incinerator are approximately 6.0 km apart. The wind rose superimposed on the state map (Figure 3) creates Group “L” (Figure 4).

8
Figure 3. Study Group “L” with “Blowing To” Wind Rose Superimposed
Figure 4. Study Group “L” Wind Rose-Shaped Elongated Model with L0, L1, L2 , and L3 (Remainder of the State) County Groups. Analysis The methods for this study first created the database of disease information necessary for subsequent overlay of the geographic data sets. The study acquired tabulated incidence counts for the two cancers in each of two sets of county aggregated groups for all 10 years of the study period, and also population estimates for each county year-by-year. This data was compiled by and provided courtesy of the Wisconsin Cancer Reporting System.
Then “crude” (not age-adjusted) incidence rates were calculated for both cancers by dividing each group’s incidence count total by that group’s population estimate per year. Subsequently, three-year
moving average smoothing of each group’s annual graph was accomplished by adding the two years prior to the third year and dividing by three. The study process then plotted the smoothed rates with Microsoft Excel© for both cancers in each of the study groups for each year.
As a secondary analysis, the research then compared the percent of agricultural land in Study Group “L” as a possible factor in cancer rate variation. The method reclassified Wisconsin land cover data at 30-meter resolution from Landsat imagery with ArcGIS 8.3 Spatial Analyst into a single agricultural class. Results Cancer Incidence Rates by Study Group
While results of this study are limited by the long latency of the cancers – the ten year period from 1990 to 1999 may be simply too short for the cancers to appear as a result of exposure to the emissions – the model and the analysis may prove useful in the future. Figures 5 - 8 compare the crude incidence rates between the polygons of the “A” Study Group and the “L” Study Group for both breast and prostate cancers. In Figure 5, La Crosse County has the highest incidence in the “A” centric model, followed by the first ring of Wisconsin counties around La Crosse, followed by the rest of the state, and then by the second ring of Wisconsin counties around La Crosse
Breast Cancer Incidence Rates per 100,000A Groups, 3 Year Moving Average, 1990-99
50
60
70
80
90
100
1990 1991 1992 1993 1994 1995 1996 1997 1998 1999
A TotalB TotalC TotalD Total
Figure 5. Breast Cancer in “A” Study Group

9
County. While this appears to be of interest, results may be age-related, and at this point in the analysis, there is no certainty of significance. In Figure 6, La Crosse County again has the highest incidence in the wind-shaped “L” model, followed by the rest of the state, followed by first ring of Wisconsin counties around La Crosse, and then by the second
Breast Cancer Incidence Rates per 100,000L Groups, 3 Year Moving Average. 1990-99
50
60
70
80
90
100
1990 1991 1992 1993 1994 1995 1996 1997 1998 1999
0L Total 1L Total2L Total 3L Total
Figure 6. Breast Cancer in “L” Study Group ring of counties around La Crosse County. While this also appears to be of interest, the results again may be age-related, and at this point in the analysis, there is no certainty of significance, as well. In Figure 7, the first ring around La Crosse County has the highest incidence of
Prostate Cancer Incidence Rates per 100,000A Groups, 3 Year Moving Average, 1990-99
50
60
70
80
90
100
110
120
130
1990 1991 1992 1993 1994 1995 1996 1997 1998 1999
A TotalB TotalC TotalD Total
Figure 7. Prostate Cancer in “A” Study Group prostate cancer in the “A” centric model, followed by the second ring of counties around La Crosse County, then by the rest of the state, and finally trailed by La Crosse County itself. The chart shows the nationally recognized 1992 prostate specific antigen (PSA) test spike, in which the announcement
and implementation of a successful new test, discovered many new cancers at that time.
Prostate Cancer Incidence Rates per 100,000L Groups, 3 Year Moving Average, 1990-99
50
60
70
80
90
100
110
120
130
1990 1991 1992 1993 1994 1995 1996 1997 1998 1999
0L Total1L Total2L Total3L Total
Figure 8. Prostate Cancer in “L” Study Group
In Figure 8, the first ring around La
Crosse County again has the highest incidence of prostate cancer in the “L” wind-shaped model, followed by the rest of the state, then by the second ring of Wisconsin counties around La Crosse County, and finally followed by La Crosse itself. This chart also shows the 1992 prostate specific antigen (PSA) test spike.
Cancer Incidence Rates by Study Group “L” Percent Agricultural Land The next analysis creates a comparison grid that examines the agricultural land cover percentages among the polygons of the “L” model for both breast and prostate cancers. The rationale for this approach is that agricultural lands use pesticides with organochlorine content, and that such organochlorines may be additive to any organochlorines deposited on the land via the wind-borne particulate from the point source. (The “L” Study Group was selected for this analysis due to the more clearly elevated breast cancer incidence in it.) Grasslands tend to use fewer pesticides, thus these lands were excluded from the aggregation. The grid creation process aggregated all agricultural classes except grasslands into a single agricultural class in one grid, then clipped the grid against the polygons of the “L” group (Figure 9). By calculating the

10
percentage of agricultural land cover type cells in each of the polygons, the percentage of agricultural lands emerged.
Figure 9. Agricultural Lands in Wisconsin (Less Grasslands) 1991-1993 Overlaid on “L” Study Groups.
One comparison (Figure 10) is at
least at first notable because it tracks a predictable increase in agricultural land with an increase in prostate cancer incidence rate in La Crosse County and in the even more agricultural first wind rose-shaped ring of
Mean Prostate Cancer Incidence 1990-1999 per 100,000 within "L" Groups and the Relative Percent of
Agricultural Land (less Grasslands) in Each
0102030405060708090
0L 1L 2L 3L
Mean Rate
%AgLandx 100
Figure 10. Mean Prostate Cancer Rate Compared to “L” Groups Percent Agricultural Land, 1990-1999. counties around La Crosse County. The relationship does not extend throughout, however. A direct relationship with breast
cancer and increasing agricultural land is not evident in Figure 11. With populations of older women and the likelihood of breast cancer and, indeed, better access to health care concentrated in urban areas, a decrease in rate is not surprising. The hypothesis of agricultural chemicals as an additive factor to incinerator contaminants needs further work.
Mean Breast Cancer Incidence Rate per 100,000within "L" Groups with the Relative Percent of Agricultural Land
(less Grasslands) in Each, 1990-1999
0102030405060708090
100
0L 1L 2L 3L
MeanRate
%AgLand x 100
Figure 11. Mean Breast Cancer Rate Compared to “L” Groups Percent Agricultural Land, 1990-1999.
Respiratory Data As Plume Indication Chronic obstructive pulmonary disease (COPD) hospitalization rate data (1999) in Figure 12 showed a parallel to the 1990-1999 mean prostate cancer incidence rates in a logarithmic scale comparison of the “L” groups, but no striking shadow of the plume.
"L" Groups Compared for 1999 COPD Rate, Breast and Prostate Mean Rates 1990-1999, and % Agricultural Land
10
100
1000
0L 1L 2L 3L"L" County Groups Compared
Log
Scal
e
COPD Rate 1999
Breast Mean Rate1990-1999Prostate MeanRate 1990-1999%AgLand x 100
Figure 12. Chronic Obstructive Pulmonary Disease (COPD) Hospitalization 1999 Rate Compared to Cancer Rates and Agricultural Land in the “L” Group.
11
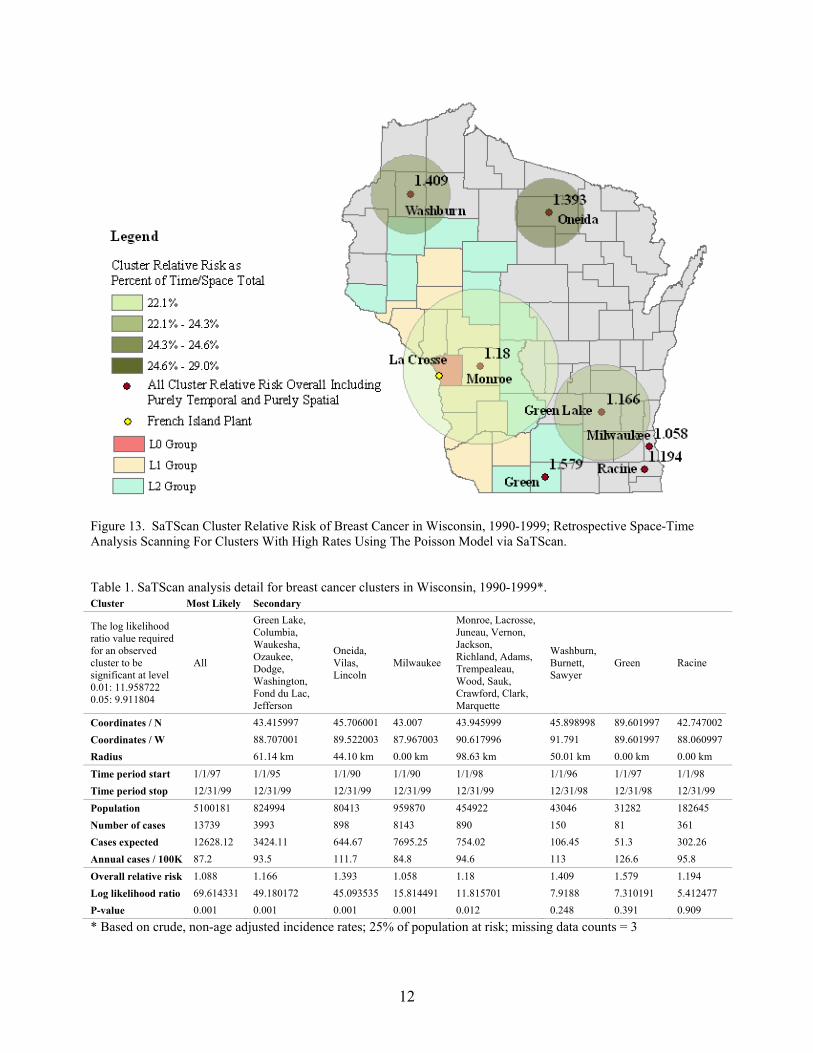
SaTScan Spatiotemporal Statistics The study performed SaTScan software cancer cluster analyses (Kulldorff 1997) on each of the two cancers with the full state of Wisconsin incidence rate data from 1990 through 1999. It used Kulldorff’s scan statistic, described thus by its inventor Martin Kulldorff: “The space-time scan statistic is defined by a cylindrical window with a circular geographic base and with height corresponding to time. The base is defined exactly as for the purely spatial scan statistic, while the height reflects the time period of potential clusters. The cylindrical window is then moved in space and time, so that for each possible geographical location and size, it also visits each possible time period. In effect, we obtain an infinite number of overlapping cylinders of different size and shape, jointly covering the entire study region, where each cylinder reflects a possible cluster (Kulldorff, Information Management Services, Inc. 2003).” This analysis uses the Poisson model that applies a Poisson distribution via the null hypothesis to the actual incidence count in each geographic area such that the expected incidence count in that area is calculated to be proportional to the area’s population size. It must be noted that this analysis is based on crude, non-age adjusted incidence counts, and with 25% of the shown population at risk to correct for the lack of age adjustment. The few missing data counts for counties in certain years in the state incidence table, 1990-1999, were set to a count of 3. The cancer clusters analysis (Figures 13 and 14) details the most likely cluster and the principal secondary clusters. The analysis calculates relative risk in two forms. The shaded clusters demonstrate relative risk of each cluster as a percent of total incidence in those clusters at specific time spans. Other clusters are relative only to the counties where they occur at specific time spans (Tables 1 and 2). All cluster’s relative risk of
cancer appears on the map near the name of the county at the center of the cluster or near the county name itself. Breast Cancer Clusters SaTScan identifies a most likely, purely temporal, entire state cluster from 1/1/1997 to 12/31/1999 as significant at the 0.01 level (Figure 13, Table 1). Green Lake, Oneida, and Milwaukee County are significant. The Monroe County cluster, in the study area, is significant at the 0.05 level. The Green and Racine County clusters are not significant per the log likelihood ratio used in this Poisson distribution; nor is the time/space cluster centered in Washburn County in the northwest. Prostate Cancer Clusters The most likely Florence County and Vernon County-centered clusters and the Sheboygan County cluster are significant at the 0.01 level (Figure 14, Table 2). The cluster points are relative only to Sheboygan, Waukesha, and Racine Counties over specific time spans. The Racine cluster is not significant per the log likelihood ratio used in the Poisson distribution. In addition, SaTScan also identifies a significant purely temporal, entire state cluster for the time period 1/1/1991 to 12/31/1993. However, this cluster, as well as the Vernon County cluster (in the study area), occurred during the prostate antigen test spike period, and thus are likely not valid. Discussion Cost of Data A number of times during the study, the problem of spatial data resolution arose. Cost of the data was an issue. While county level incidence data is free from the Wisconsin Cancer Registry as a query under one hour, it
12
Figure 13. SaTScan Cluster Relative Risk of Breast Cancer in Wisconsin, 1990-1999; Retrospective Space-Time Analysis Scanning For Clusters With High Rates Using The Poisson Model via SaTScan. Table 1. SaTScan analysis detail for breast cancer clusters in Wisconsin, 1990-1999*. Cluster Most Likely Secondary
The log likelihood ratio value required for an observed cluster to be significant at level 0.01: 11.958722 0.05: 9.911804
All
Green Lake, Columbia, Waukesha, Ozaukee, Dodge, Washington, Fond du Lac, Jefferson
Oneida, Vilas, Lincoln
Milwaukee
Monroe, Lacrosse, Juneau, Vernon, Jackson, Richland, Adams, Trempealeau, Wood, Sauk, Crawford, Clark, Marquette
Washburn, Burnett, Sawyer
Green Racine
Coordinates / N 43.415997 45.706001 43.007 43.945999 45.898998 89.601997 42.747002 Coordinates / W 88.707001 89.522003 87.967003 90.617996 91.791 89.601997 88.060997 Radius 61.14 km 44.10 km 0.00 km 98.63 km 50.01 km 0.00 km 0.00 km
Time period start 1/1/97 1/1/95 1/1/90 1/1/90 1/1/98 1/1/96 1/1/97 1/1/98 Time period stop 12/31/99 12/31/99 12/31/99 12/31/99 12/31/99 12/31/98 12/31/98 12/31/99
Population 5100181 824994 80413 959870 454922 43046 31282 182645 Number of cases 13739 3993 898 8143 890 150 81 361 Cases expected 12628.12 3424.11 644.67 7695.25 754.02 106.45 51.3 302.26 Annual cases / 100K 87.2 93.5 111.7 84.8 94.6 113 126.6 95.8
Overall relative risk 1.088 1.166 1.393 1.058 1.18 1.409 1.579 1.194 Log likelihood ratio 69.614331 49.180172 45.093535 15.814491 11.815701 7.9188 7.310191 5.412477 P-value 0.001 0.001 0.001 0.001 0.012 0.248 0.391 0.909
* Based on crude, non-age adjusted incidence rates; 25% of population at risk; missing data counts = 3

13
Figure 14. SaTScan Cluster with Relative Risk of Prostate Cancer in Wisconsin, 1990-1999; Retrospective Space-Time Analysis Scanning For Clusters With High Rates Using The Poisson Model via SaTScan. Table 2. SaTScan analysis detail for prostate cancer clusters in Wisconsin, 1990-1999*. Cluster Most Likely Secondary
The log likelihood ratio value required for an observed cluster to be significant at level: 0.01: 11.958722 0.05: 9.911804
Florence, Forest, Marinette, Langlade, Oneida, Vilas, Oconto, Menominee, Lincoln, Shawano, Door, Iron
All
Vernon, Crawford, Richland, Lacrosse, Monroe, Juneau, Sauk, Jackson, Grant, Iowa, Trempealeau, Adams, Buffalo, Wood, Marquette, Lafayette, Columbia, Clark
Sheboygan Waukesha Racine
Coordinates / N 45.848 43.594002 43.721001 43.018005 42.747002 Coordinates / W 88.398003 90.834 87.945 88.304001 88.060997 Radius 149.45 km 128.02 km 0.00 km 0.00 km 0.00 km
Time period start 1/1/90 1/1/91 1/1/91 1/1/91 1/1/1997 1/1/96 Time period stop 12/31/99 12/31/93 12/31/93 12/31/94 12/31/99 12/31/98
Population 262893 5100181 603172 108087 329581 182645 Number of cases 2972 12905 1872 480 929 492 Cases expected 2006.84 11437.73 1354.42 323.33 796.8 427.77 Annual cases / 100K 113.1 86.1 105.5 113.3 89 87.8
Overall relative risk 1.481 1.128 1.382 1.485 1.166 1.15 Log likelihood ratio 214.59295 130.193405 91.842014 33.301437 10.63508 4.650883 P-value 0.001 0.001 0.001 0.001 0.026 0.989
* Based on crude, non-age adjusted incidence rates; 25% of population at risk; missing data counts = 3

14
is too coarse for precise analysis. After the first query, the cost increases to $45 per hour. Other detailed disease queries for hospitalizations older than 2001 are priced at $25 per hour by the Wisconsin Department of Health and Family Services. Wisconsin sells data to AmeriNet Central for value-added, ease-of-use packaging and resale to Wisconsin hospitals. The reseller’s costly licensing fees and restrictive use policies make access to the data severely restricted.
This free data resulted in crude incidence rates that were not age-adjusted to 1970 population. Further, Wisconsin’s Privacy “Rule of Five” nulls counts of five or less at all spatial levels, be those counties, minor civil divisions, tracts, or blocks. Therefore, the Wisconsin registry data miner’s aggregated group counts were more accurate than the individual county counts because the Rule of Five in no case applied. While Wisconsin requires cancer reports of hospitals, physicians, and pathology labs, only hospitals and clinics routinely report cases. Reporting rules are not promulgated for pathology labs. Finally cancer case reporting follow-up queries are limited by the size of the small registry staff.
Another Technique Without access to high resolution incidence data, this study considered an isopleth map technique attributed to Gerard Rushton, medical geographer at the University of Iowa. The technique combines a population density grid with an incidence count grid, and yields isolines of equal rate incidence that suggest cluster-like concentrations of disease. However, fine cluster discovery is not possible with county level data, according to Rushton (Rushton 2003). At least zip code level data is required. Zip codes themselves are becoming less desirable for disease research because of their changeable nature with the United States Postal Service (USPS) aggregation trend for postal efficiency,
creating annual spatial shifts in those polygons (Borchers 2003). (Smaller census group spatial data would increase both the data cost and the likelihood of missing data for privacy reasons.)
Regulatory Models On the federal and state regulatory fronts, both the U.S. EPA and the State of Wisconsin are very active in monitoring air pollution. However, recent budget cuts and resultant shifts in philosophy toward environmental enforcement, both at the federal and state levels, have some critics concerned. The U.S. EPA is modernizing its monitoring tools, moving in 2003 by a new rule from the present monitoring model, the Industrial Source Complex Model (ISC3) to AERMOD (the American Meteorological Society / Environmental Protection Agency Regulatory Model). The regulatory models seek a point of highest concentration among monitors; GIS output is not usually generated. The new software ISC-AERMOD View by Lakes Environmental would have facilitated analysis for this study, yet cost made it inaccessible.
SaTScan Clusters Nonetheless, a readily available resource, SaTScan, relatively new space-time statistical software, could scan the study areas for significant disease clusters (Kulldorff 1997). The software was developed by Martin Kulldorff, then with the National Cancer Institute, now associate professor and biostatistician at Harvard Medical School. The NCI and the Alfred P. Sloan Foundation continue to support new revisions of this valuable software tool. SaTScan employs Poisson, Bernoulli, and space-time permutation models in either retrospective or prospective analyses.
According to Kulldorff, when SaTScan uses… “the Poisson model, the

15
number of cases in each location is Poisson distributed. Under the null hypothesis, and when there are no covariates, the expected number of cases in each area is proportional to its population size, or to the person-years in that area. The Poisson model requires case and population counts for a set of data locations such as counties, parishes, census tracts or zip code areas, as well as the geographical coordinates for each of those locations.” (Kulldorff, Information Management Services, Inc. 2003)
Breast Cancer Cluster Discussion The SaTScan analysis for breast cancer incidence, 90-1999 in Figure 13 and Table 1, with only 25% of the population at risk (to correct for the lack of age adjustment in the data), shows eight clusters statewide.
The most likely cluster is an all-inclusive, statewide cluster with a time span of 1/1/1997 to 12/31/1999. It is significant at the 0.01 level via the log likelihood ratio method used by SaTScan. Other secondary clusters, including temporal-only clusters exist for southeastern Wisconsin counties near where one would expect to find them in the state’s most populous counties.
Of the four time/space clusters, the analysis shows only one that lies in the “A” or “L” study areas. That cluster, centered in Monroe County, extends nearly 200 km in diameter from 1/1/1998 to 12/31/1999. It is also significant, but at the 0.05 level. The cluster analysis does not indicate whether the “A” or the “L” contaminant distribution model is more significant. SaTScan analysis of the “A” and “L” areas for breast cancer found the same cluster. It found no spatial difference per the plume shape.
Prostate Cancer Cluster Discussion
SaTScan analysis of prostate cancer incidence from 90 to 1999 in Figure 14 and Table 2, again with 25% of the population at
risk (to correct for the lack of age adjustment in the data), shows six clusters statewide.
Only two have a spatial dimensions beyond the county borders. Of those two, the one in the study area has a time period of 1/1/1991 to 12/31/1992 during which the prostate specific antigen (PSA) test incidence spike occurred with the onset of that cancer test for men over 40. Thus, that cluster, while significant, may need to be discounted. SaTScan analysis for prostate cancer in the “A” and “L” areas found no spatial difference per the plume shape in them.
Conclusions The data suggest that elevated breast cancer incidence in La Crosse County, higher than the rest of the state under the null hypothesis for 1997-1999, is worthy of further study. Considering the years of excess dioxin emissions and the level of concern of two of the state’s top public health officers, one would not say with certainty that the cluster in the La Crosse region is absolutely not related to dioxin / organochlorine exposure. The apparent time/space cluster for the region does occur within the early part of the 10 year breast cancer latency window. While heredity, age, and latency effects may explain the elevated incidence, further study with finer-resolution data may be required in light of the dioxin/organochlorine exposure. The prostate cancer appears unrelated to exposure in the region in this spatial analysis. Nonetheless, links of prostate cancer to HCB, incineration, and organochlorine pesticides do exist in the literature, and also may merit another examination in this region in the future, especially considering the 20 year latency of prostate cancer.
Afterword Meanwhile, more and more voices are beginning to call both for more research into

16
possible environmental causes of cancer, and specifically for more breast cancer research in response to women’s suffering and deaths, and apparently unequal access to health care research dollars. The simple fact that the U.S. Post Office sells breast cancer fundraising postage stamps seems to underscore an effort to correct the inequity.
This geographic information system effort represents one attempt to apply new research tools and new methods aiming to reveal relationships among diseases and environmental contaminants. Resources The following list represents a partial assembly of medical geography or GIS in public health resources: • Laura Stephenson and Robert Borchers,
Wisconsin Cancer Registry • Martin Kulldorff, Harvard Medical
School • Gerard Rushton, Department of
Geography, University of Iowa • Geoffrey M. Jacquez, TerraSeer, Inc. • Sally Bushhouse, Minnesota Cancer
Surveillance System • Connie Weil, Dept. of Geography,
University of Minnesota • Medical Geographers Specialty Group –
Association of American Geographers (AAG)
• World Health Organization (WHO) Public Health Mapping
• NCI SEER, NCI Cancer Maps and Graphs
• USEPA Support Center for Regulatory Air Models (SCRAM).
• Social Science & Medicine Journal • Health-GIS discussion group LIST Recent Software Resources • SaTScan;
http://www.satscan.org
• TerraSeer / ClusterSeer; http://www.terraseer.com
• GeoVISTA Studio; Penn State; http://www.geovistastudio.psu.edu/jsp/index.jsp
• ISC-AERMOD View; Lakes Environmental; http://www.weblakes.com/completesolution.html
Acknowledgements • Robert Borchers, Wisconsin Cancer
Reporting System, Bureau of Health Information
• Indiana Strombom, Population Health Sciences, University of Wisconsin
• Martha Roldan, John Ebert, Mara May, and Jay Meehl, Department of Resource Analysis, Saint Mary’s University of Minnesota
• Dr. Martin Kulldorff and Thomas Hostovich, SaTScan.org
• Becky Fink, Rise North • Guy Wolf, University of Wisconsin La
Crosse • Thomas Stibbe, John Roth, et al,
Wisconsin Department of Natural Resources - Air
• Dr. Gerard Rushton, University of Iowa Department of Geography
• Sandra Steingraber, Cornell University Center for Environment
• Theo Colborn, Dianne Dumanoski, John Peterson Myers; Our Stolen Future
• Dr. Thomas Custer, United States Geological Survey
• Dr. David McConville, Chair, Department of Resource Analysis, Saint Mary’s University of Minnesota
• Steve Lubahn and Barry Drazkowski. GeoSpatial Services, Department of Resource Analysis, Saint Mary’s University of Minnesota
• Bruce Braaten, Minnesota Pollution Control Agency
17
• My supportive GIS classmates. Keep on! • My wonderful family; thank you! Dedication “For the first time in the history of the world, every human being is now subjected to contact with dangerous chemicals, from the moment of conception until death.” Rachel Carson, Silent Spring, 1962.
Figure 15. Rachel Carson died of breast and bone cancer on April 14, 1964. Photo courtesy USFWS.
References Agency for Toxic Substances and Disease
Registry (ATSDR). 2002. Toxicological profile for hexachlorobenzene. Atlanta, GA: U.S. Department of Health and Human Services, Public Health Service.
Alavanja, MCR, C Samanic, M Dosemecil, J Lubin, R Tarone, CF Lynch, C Knott, K Thomas, JA Hoppin, J Barker, J Coble, DP Sandler and A Blair. 2003. Use of Agricultural Pesticides and Prostate Cancer Risk in the Agricultural Health Study Cohort. American Journal of Epidemiology 157:800–814.
Borchers, Robert. 2003. Re: mcd boundary .shp? Personal email. Wisconsin Cancer Registry, September 22, 2003.
Brommerich, David. 2003. Buffalo County might not extend incinerator contract. La Crosse Tribune. January 3, 2003.
Buckingham, W. A., Jr. Operation Ranch Hand: Herbicides In Southeast Asia 1961-1971 A previous version appeared in Air University Review, Vol. 34, No. 5 (July-August 1983), pp 42-53. http://www.cpcug.org/user/billb/ranchhand/ranchhand.html.
Carson, Rachel Louise. 1962. Silent Spring. Boston, Houghton Mifflin.
Colborn, Theo; D. Dumanoski, J.P. Myers. 1997. Our Stolen Future: Are We Threatening Our Fertility, Intelligence, and Survival? - A Scientific Detective Story. Dutton, p. 113.
Ibid., p. 181. Commoner, B., P.W. Bartlett, E. Holger and
K. Couchot. 2000. Long-range air transport of dioxin from North American sources to ecologically vulnerable receptors in Nunavut, Arctic Canada. Final report to the North American Commission for Environmental Cooperation. September, 2000.
Gammon MD, Neugut AI, Santella RM, Teitelbaum SL, Britton JA, Terry MB, Eng SM, Wolff MS, Stellman SD, Kabat
18
GC, Levin B, Bradlow HL, Hatch M, Beyea J, Camann D, Trent M, Senie RT, Garbowski GC, Maffeo C, Montalvan P, Berkowitz GS, Kemeny M, Citron M, Schnabe F, Schuss A, Hajdu S, Vincguerra V, Collman GW, Obrams GI. The Long Island Breast Cancer Study Project: description of a multi-institutional collaboration to identify environmental risk factors for breast cancer. Breast Cancer Research And Treatment. 2002 Jun;74(3):235-54.
Jacquez, G.M. and D.A. Greiling. 2003. Local Clustering in Breast, Lung and Colorectal Cancer in Long Island, New York. International Journal of Health Geographics 2:3.
Johnson MD, Kenney N, Stoica A, Hilakivi-Clarke L, Singh B, Chepko G, Clarke R, Sholler PF, Lirio AA, Foss C, Reiter R, Trock B, Paik S, Martin MB. Cadmium mimics the in vivo effects of estrogen in the uterus and mammary gland. Nature Medicine 2003 Aug;9(8):1000-1.
Karasek FW, Dickson LC. 1987. Model studies of polychlorinated dibenzo-p-dioxin formation during municipal refuse incineration. Science. 1987 Aug 14;237(4816):754-6.
Kulldorff, M., Information Management Services, Inc. 2003. SaTScanTM User Guide for Version 4.0, p. 4.
Ibid., p. 5. Kulldorff, M., Nagarwalla N. 1995. Spatial
disease clusters: detection and inference. Stat Med 1995;14:799–810.
La Crosse Tribune. 2003. EPA, Xcel near deal on French Island pollution. La Crosse Tribune. May 10, 2003.
Magney, R. 2002. Activists: Demand proof of cleanup from Xcel. La Crosse Tribune. La Crosse Tribune. July 25, 2002.
Magney, R. 2002. Burning of used railroad crossties at Xcel plant spawns pollution questions. La Crosse Tribune. February 17, 2002.
Magney, R. 2002. Excel [sic] takes pollution control steps, but not fast enough for some. La Crosse Tribune. January 13, 2002.
Magney, R. 2002. Health officials want food supply tested for toxins. La Crosse Tribune. June 30, 2002.
Magney, R. 2002. State sues Xcel over emissions. La Crosse Tribune. August 1, 2001.
Magney, R. 2002. Xcel deal funds household hazardous waste disposal. La Crosse Tribune, August 28, 2002.
Magney, R. 2003. Environmental groups challenge Xcel fine. La Crosse Tribune. August 6, 2003.
Magney, R. 2002. Other treated wood not safe for incinerator fuel. La Crosse Tribune. February 17, 2002.
Mid-Continent Area Power Pool (MAPP). 2001. Mid-Continent Area Power Pool Regional Reliability Council Coordinated Bulk Power Supply Program (EIA-411). Web site. http://www.mapp.org/assets/pdf/2001_USA.PDF. July 1, 2001.
Midwest Environmental Advocates. 2003. Website: Advocacy Archives / Open Cases / French Island Incinerator. http://www.midwestadvocates.org/main.html.
Minnesota Rule 7035.2885 Municipal Solid Waste Combustor Ash Land Disposal Facilities. Groundwater, surface water, and leachate sampling and analysis. Subp. 16, B(2).
Murphy, Kevin. 2003. Judge accepts EPA, Xcel settlement over French Island plant. La Crosse Tribune. October 24, 2003.
National Cancer Institute. 2003. Etiology and Pathogenesis of Breast Cancer. Website. http://www.cancer.gov/cancerinfo/pdq/prevention/breast/healthprofessional/#Section_175.
National Cancer Institute. 2003. Risk Factors for Prostate Cancer Development. Website.
19
http://www.cancer.gov/cancerinfo/pdq/prevention/prostate/healthprofessional/#Section_17.
National Cancer Institute Surveillance, Epidemiology and End Results (SEER) Training Program. 2000. A Brief History of Cancer Registration. Web site. http://training.seer.cancer.gov/module_cancer_registration/unit1_history.html
National Center for Atmospheric Research (NCAR), the Research Applications Program (RAP), http://www.rap.ucar.edu/weather/surface/stations.txt
Ralph, JL, M-C Orgebin-Crist, J-J Lareyre and CC Nelson. 2003. Disruption of androgen regulation in the prostate by the environmental contaminant hexachlorobenzene. Environmental Health Perspectives doi:10.1289/ehp.5919.
Rushton, Gerard. 2003. Re: Isopleth mapping cancer incidence rates with coarse data? University of Iowa. Personal email. September 26, 2003.
Savino, Daniel J. 2003. Connecticut Tumor Registry, Connecticut Department of Public Health. Web site. http://www.dph.state.ct.us/OPPE/hptumor.htm.
Scanlan, M. and Grzezinski, D. 2001. Notice of Intent to Sue Xcel Energy Services Inc., Letter to Tina Ball, Xcel Energy. Web site. http://www.midwestadvocates.org/archive/frenchisland/xcel-notice.pdf. April 2, 2001.
Scanlan, M. K. and Midwest Environmental Advocates. 2002. Comments on Draft Title V permit 632022820-P01 for Xcel’s French Island Incinerator. Letter to Jeff Johnson, Wisconsin Department of Natural Resources. Web site. http://www.midwestadvocates.org/archive/frenchisland/xcel_comments.pdf. June 20, 2002.
Securities and Exchange Commission (SEC) 2003. Northern States Power. Xcel Energy website: www.xcelenergy.com.
State of Wisconsin Department of Justice Environmental Protection Unit. 2002. State Settles Environmental Lawsuit In La Crosse County. http://www.doj.state.wi.us/dls/environpro/news/enr082702.asp.
Steingraber, S. 1997. Living Downstream: An Ecologist Looks at Cancer and the Environment. Perseus Books, p. 229.
Stibbe, T. 2003 RE: Xcel Energy - La Crosse Plant. Personal email. Wisconsin Department of Natural Resources Air Division. October 21, 2003.
Tobin P. 1986. Known and potential sources of hexachlorobenzene. International Agency For Research On Cancer Scientific Publications 1986;(77):3-11.
United Nations Environment Programme (UNEP). 2001. Final Act of the Conference of Plenipotentiaries on the Stockholm Convention on Persistent Organic Pollutants. Stockholm, Sweden, 22-23 May 2001. Annex A, p. 31. http://www.pops.int/documents/meetings/dipcon/25june2001/conf4_finalact/en/FINALACT-English.PDF.
United States Environmental Protection Agency (USEPA). 2001. Database Of Sources Of Environmental Releases Of Dioxin-like Compounds In The United States. Web site: EPA Home / Research & Development / NCEA Home / Database Of Sources Of Environmental Releases Of Dioxin-like Compounds In The United States. http://cfpub.epa.gov/ncea/cfm/recordisplay.cfm?deid=20797. March, 2001.
United States Environmental Protection Agency (USEPA). Toxic Release Inventory (TRI) State Data Files for Wisconsin and Minnesota. Web site. Toxics Release Inventory Program / Get TRI Data / State Data Files.

20
http://www.epa.gov/tri/tridata/state_data_files.htm. 1996 - 2001.
U.S. Department of Health and Human Services (USHHS), Public Health Service, National Toxicology Program. 2002. Report on Carcinogens, Tenth Edition. December 2002. Web Site: http://ehp.niehs.nih.gov/roc/toc10.html
U.S. Fish and Wildlife Service (undated). USFWS photo. Rachel Carson. National Conservation Training Center-Publications And Training Materials. http://offices.fws.gov/directory/OfficeDetail.cfm?OrgCode=97340
Wiggins L (Ed). 2002. Using Geographic Information Systems Technology in the Collection, Analysis, and Presentation of Cancer Registry Data: A Handbook of Basic Practices. Springfield (IL): North American Association of Central Cancer Registries, October 2002. p. 33-34.
Wisconsin Department of Health & Family Services. 2003. Cancer Facts and Cancer Clusters. Website. http://www.dhfs.state.wi.us/eh/HlthHaz/fs/CancerClus.htm.
Xcel Energy. 2002. La Crosse, Wis.: New equipment helps Xcel Energy dramatically improve emissions at French Island Power Plant. News release.