Embed Size (px)
Citation preview


Disclaimer
This presentation contains forward-looking statements. Forward-looking statements may include, in particular, statements
about future events, future financial performance, plans, strategies, expectations, prospects, competitive environment,
regulation and supply and demand. Statements with respect to the future are characterized by the use of words such as
"expect", "intend", "plan", "anticipate", "believe", "estimate" and similar terms. Forward-looking statements are based on our
current assumptions and forecasts. These statements naturally entail risks and uncertainties, which may cause the actual
results of operations, financial position or performance to diverge materially from the estimates given here. Factors that could
cause such a divergence include, inter alia, changes in the economic and business environment, fluctuations in exchange
rates and interest rates, launches of competing products, poor acceptance of new products or services, and changes in
business strategy. Given these uncertainties, readers should not put undue reliance on any forward-looking statements. We
undertake no obligation to update or revise any forward-looking statements.
All financial information for the Divisions from 2019 onwards are based on the current portfolio setup and allocation of entities.
Deviations of selected Divisions due to “Zebra” companies may occur. A constant IFRS 16 effect was assumed for the
planning timeframe 2019 onwards based on extrapolation June 2019 YTD. Sales, EBITDA margins, CAGR, ROCE and the
sum of percentages have been rounded, which may vary in sum-up calculations.
2
A self-help story in attractive markets
Our new organization
Introduction to the divisions
Beyond organizational changes
Financials
GEA’s equity story
3

4
STEFAN KLEBERTCEO
MARCUS A. KETTERCFO
STEFFENBERSCHExecutive BoardMember
4
Today’s presenters

A self-help storyin attractive markets
5
STEFAN KLEBERT

Our mission
We strive to be the world‘s
most respected technology
group offering cutting-edge
solutions for sustainable
processes that improve
people‘s everyday lives.
6

GEA‘s business model and
underlying markets… no disruption, as in other
industries, around the corner!
7

Industry volatility
Source: Oxford Economics per 08/2019; Global production real value added output in USD (expressed in constant prices)
2.5%
0.6%
8.7%
7.7%
2.9%
1.9%
15.8%
3.2%
6.2%
[Standard Deviation 2000-2018 in %]
Production growth
Mechanical
Engineering
3.4%
Food & Beverages
Pharmaceuticals
Motor vehicles
Electrical, optical &
high-tech
Oil & Gas extraction
Chemicals
4.5%
Industrial production
w/o Construction
Machines for mining &
construction
3.7%
5.0%2.4%
3.2%
4.0%
3.5%
3.8%
[CAGR 2000-2018 in %]
~72% of sales
~7% of sales
GEA’s key
customer industries
are very stable,
reliable and
growing thanks to
global megatrends
8

11%
13%
17%
31%
7%
7%
14%
Food
Dairy
FarmingChemicals
Beverages
Dairy
Processing
Pharma
Other
Food, beverage & pharma exposure
Sales
exposure FY 2018 per
industry
Food, Beverage
& Pharma
applications
represent
of sales
9
~79%

Greater demand for
safe food
Demographic change
63%growth of people aged 65+(2015 – 2030f)
Healthier,
functional &
personalized
food
Alternative
protein sources
79%Middle class growth(2015 – 2030f)
Important global
megatrends are
propelling our
technologies
underlying markets
1.2bnGlobal populationgrowth (2015 – 2030f)
10
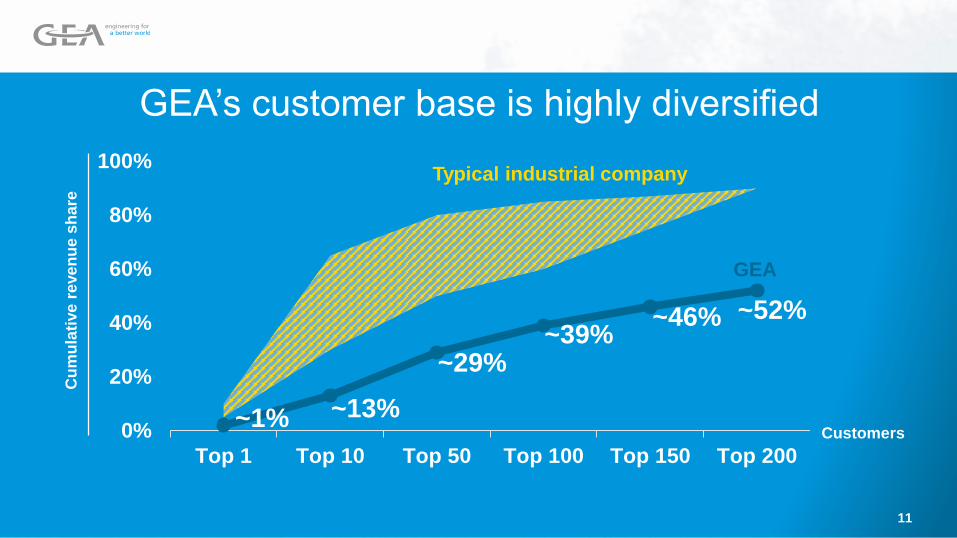
GEA’s customer base is highly diversifiedC
um
ula
tive
re
ve
nu
e s
ha
re
Customers~1% ~13%
~29%~39%
~46% ~52%
0%
20%
40%
60%
80%
100%
Top 1 Top 10 Top 50 Top 100 Top 150 Top 200
GEA
Typical industrial company
11

Benefits:
• Minimizes treatment through
innovative sensor measures
• Safeguards the healing
process
• Increases herd health and
productivity
GEA DairyMilk M6850Early warning system for
mastitis detection
GEA OxyCheck®
Quality control system
Benefits:
• In-line quality control for
package inspection
• Checks residual oxygen
content and seal integrity of
each modified atmosphere
pack leaving the thermoformer
• Non-invasive measurement
with no packaging material or
food wasted
Creating value for our customers | Innovation & digitization
Animal welfare Food
GEA Virtual Reality Experience entire plants
before they’re even built
Benefits:
• Optimization during design
phase
• Familiarization with plant
characteristics in VR
• Identification of critical control
points in design phase
Service
GEA OptiPartnerSoftware based optimization
of production line performance
Benefits:
• Increased process stability
and operational consistency
• Continuous performance
optimization of production line
• Increased transparency of
process performance
Food & Dairy
12
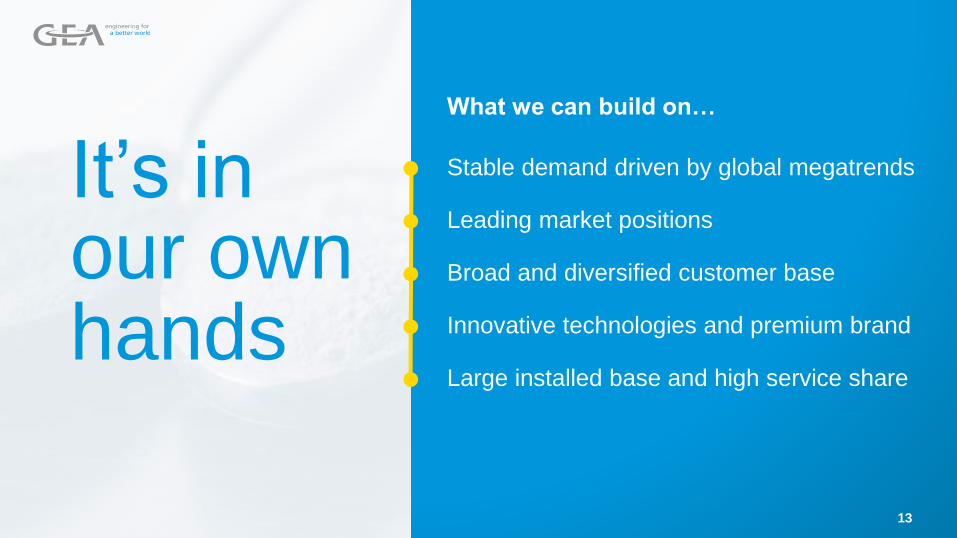
It’s in our own hands
What we can build on…
Stable demand driven by global megatrends
Leading market positions
Broad and diversified customer base
Innovative technologies and premium brand
Large installed base and high service share
13

… to increase profitability
Improve operational efficiency
Realize procurement savings
Optimize production footprint
Portfolio pruning
Improve outsourced processes
Harmonize ERP landscape
Implement new
organization with
clear P&L responsibility
and accountability
bringing back
financial transparency
14
What we will do differently …

What we want to achieve:
Mid-term
targets for
Sales CAGR
2.0% - 3.0%
EBITDA Margin
11.5% - 13.5%
15
Figures based on the assumption of no major changes in global
economic growth and no substantial slow-down in any of GEA’s
customer industries.
1
1
1

Our new organization
Structurecore principles
16
STEFAN KLEBERT

615557 523
472 386 -426
2015 2016 2017 2018 2019e
…
OneGEA functional setup eliminated
clear P&L responsibility and led to deteriorated margins
EBITDA before restructuring and margin
(in €m / in %)
Da
iry
Po
wd
er
Be
ve
rage
, F
illin
g&
Pa
cka
gin
g
Ph
arm
aS
olid
s
Ba
ke
ry
Ch
em
ica
ls
9.8%11.4%12.4%
13.4%8.0%-
8.9%
Application Management
Research & Development
17In accordance with guidance 2019 of €450-490m EBITDA before restructuring incl. ~€64m IFRS 16 effect based on extrapolation June 2019 YTD
Excl.
IFRS 16
effect
of €64m
1
1

Six coreorganizational principlesthat make thedifference
Organize
technologies
into 5 divisions
Give P&L responsibility
back to our managers
and focus on local
entrepreneurship
Connect strong
country
organization to
divisions
Leverage synergies
in procurement and
production
Strengthen service
business and
steering by having
separate service P&L
Transparency
through financial
steering based on
5 new divisions
and focused BUs
18

New divisional structure designed to increase profitability by encouraging entrepreneurship
Production / Procurement / Technology
Global Corporate Center / Shared Service Center
Five divisions organized along technologies
Separation & Flow
Technologies
Separators
Valves & Pumps
Homogenizers
Food & Healthcare
Technologies
Pasta
Slicing & Packaging
Bakery
Food Solutions
Pharma & Healthcare
Frozen Food
Refrigeration
Technologies
Components
Skids
Projects
Liquid & Powder
Technologies
Liquid Technologies
Beverage & Filling Tech.
Powder Technologies
Chemical Technologies
Farm
Technologies
Milking & Dairy Farming
Cooling
Milking & Feeding
Manure
Barn
19
Country organization

Well-experienced managers nominated to lead the divisions
Norbert Breuer Tobias Andreae Stefan LiskeErik Jan Bultje Erkul Basaran
Klaus Stojentin Steffen Bersch Thies HachfeldManuel Delgado
Ulrich WalkArmin Tietjen Tjitze de Wit Nicolas Groth
Separation & Flow
Technologies
Liquid & Powder
Technologies
Refrigeration
Technologies
Food & Healthcare
Technologies
Farm
Technologies
Division
CEO
Division
CFO
Division
CSO
20

Well-experienced Regional Heads to lead established country organizations
Greater
China
Dong Li
Asia
Pacific
Hugo Blaum
21
(APAC)
North
America
John Ansbro
(NAM)
Latin
America
Beatrice Bruey
(LAM)
North Central
Europe
Barry Dumble
(NCE)
DACH &
Eastern
Europe
Ansgar Hoffmann
(DACH&EE)
Western
Europe,
Middle East
& Africa
Alvaro Martínez
(WE&MEA)

All management layers outlined
~90% of all new management positions
(Level 1 to Level 3) already filled
Employees allocated from old to new
organization; final reviews ongoing
Discussions with works councils nearly
concluded; works councils supporting
transition to new organization
Growing trust of employees has led to
reduced staff turnover
New divisional structure
What we’ve already achieved
22

Former Employee Former EmployeeFormer Employee
Former GEA employees show interest in rejoining the company
…in total 8 years I was a
part of GEA, before I left in
2017. It was a tough
decision for me, because I
liked very much working at
the site in … There were so
many loyal and well-
experienced colleagues, but
the OneGEA structure has
made decision taking highly
complex…
Dear Mr. Klebert,
as a former GEA employee I
am closely following the
company‘s developments.
I am happy to see that you
brought back positive
momentum and I believe that
the changes announced will
make GEA successful
again…
…falls Interesse an meinem
Profil besteht, würde ich mich
sehr freuen wieder ein Teil
der GEA Familie zu werden.
Unabhängig davon wünsche
ich Ihnen und dem
Unternehmen Erfolg und
Wachstum.
Mit freundlichen Grüßen
…
23

And some managers have already returned
I rejoined GEA because the
divisional set-up opens up
great opportunities for
business growth that were
not available in OneGEA.
As a manager I want to
manage and influence
business. I feel that with the
new organization we’ll have
the means to get back to
real entrepreneurship.
„„
Manuel Delgado, newly
appointed Division CEO
24
Nick Groth, newly appointed
Division CSO

Introductionto the divisions
25
STEFAN KLEBERT & STEFFEN BERSCH

Liquid & Powder
Customer industriesby divisions
Farm
Dairy
Refrigeration
Separation & Flow
Food & Healthcare
Other
Food
Beverage
Pharma
Chemical
Environmental
Oil & Gas, Marine
26
18%1
21%132%1
16%1
13%1
1 percentage of sales FY 2018, rounded figures
Separation Flow Technologies
27

ROCE2
~31%
EBITDA1
~21%Employees3
~4,500 FTE
Sales
~€1.2bn
Separators
Key products
Share of div. sales
EBITDA margin
Market position
Selected
customers
Major
competitors
~75%
Below divisional average
#1
Separators, decanters
Alfa Laval, Andritz,
SPX Flow
Homogenizers
~7%
Above divisional average
Top 3
Homogenizers
SPX Flow,
Tetra Pak
Valves & Pumps
~18%
Above divisional average
Top 3-5
Aseptic valves,
cleaning technology,
hygienic pumps and valves
Alfa Laval, Bürkert,
Pentair, SPX Flow
Facts & figures 2019e
Separation & Flow Technologies
1 EBITDA includes ~€12m IFRS16 effect based on extrapolation June 2019 YTD 2 Calculation based on capital employed L4Q as per Q2 2019 including IFRS 16 pro forma for Q3 & Q4 2018 3 FTE based on Q2 2019 28
AB InBev
ADM
Asahi
Biogen
Bünge
Chobani
CSL Behring
Danone
DMK Group
Julphar
Yili
Hilmar Cheese Comp.
Hyundai
Nestlé
Novartis
Sanofi

Separation & Flow Technologies
Service 41%
Equipment 59%
APAC 29%
DACH&EE 21%
NAM 17%
NCE 12%
WE&MEA 14%
LAM 7%
Chemical 5%
Environmental 6%
Other 5%
Oil & Gas 3%
Beverage 15%
Dairy 24%
Food 23%
Pharma 10%
Marine 9%
Due to rounding, marginal
deviations may occur.
By end market By region By type
Sales Breakdown LTM (Q2 2019)
29

Production site managed by division
Multi-purpose site managed by global production
Separation & Flow Technologies
Global Footprint
30

Separators
Expansion of new equipment
sales and service coverage
on large installed base
Homogenizer
Increase of exposure to mid-
market segment and to high-
quality pharma applications
Valves & Pumps
Footprint initiative to localize
production
Pharma and biopharma
applications expected to
continue positive long-
term trend
High value dairy
products expected to
trigger customer
investment
Mid-market driven by
Asia where mid-sized
dairies are investing in
high-quality applications
Energy scarcity and
stricter environmental
regulations drive
demand for resource-
saving equipment
Separation & Flow Technologies
2.0 - 2.5%
Key market drivers
strategic focus
Sales CAGR 19-22e EBITDA margin1
2019e: ~21.0% | 2022e: 21.0 - 22.0%
1before restructuring31

Liquid Powder Technologies
32

1 EBITDA includes ~€16m IFRS16 effect based on extrapolation June 2019 YTD 2 Calculation based on capital employed L4Q as per Q2 2019 including IFRS 16 pro forma for Q3 & Q4 2018 3 FTE based on Q2 2019
ROCE2
~3%
EBITDA1
~3%Employees3
~5,700 FTE
Sales
~€1.6bn
Liquid Technologies Powder TechnologiesBeverage & Filling
Technologies
Process
lines for
Share of div.
sales
EBITDA margin
Market position
Selected
customers
Major
competitors
~26%
Below divisional average
#2
~39%
Divisional average
Top 1-2
~19%
Divisional average
Top 2-4
Cheese,
Liquid Dairy
Dairy Powder &
Nutritional Formula,
Coffee & Tea
Beer & Alcoholic Beverages;
Beverage Blowing, Filling &
Packaging; Non-Alcoholic Beverage
& Home and Personal Care
JBT FoodTech, Krones,
SPX Flow, Tetra Pak
SPX Flow,
Tetra Pak
KHS, Krones,
Sidel
Emission Control,
Chemicals
Chemical
Technologies
~16%
Above divisional average
Top 3
Many small
players
Liquid & Powder Technologies
Facts & figures 2019e
33
Almarai
Arla
Carlsberg
FrieslandCampina
Fonterra
Mondelez
Coca Cola
Danone
Glanbia
BASF
Tingyi

Service 21%
Equipment
79%
Liquid & Powder Technologies
APAC 32%
DACH&EE 17%
NAM 15%
NCE 16%
WE&MEA 11%
LAM 9%
Other 4%Pharma 5%
Beverage
24%
Dairy 36%
Food 14%
Chemical
17%
By end market By region By type
Due to rounding, marginal
deviations may occur.
Sales Breakdown LTM (Q2 2019)
3434
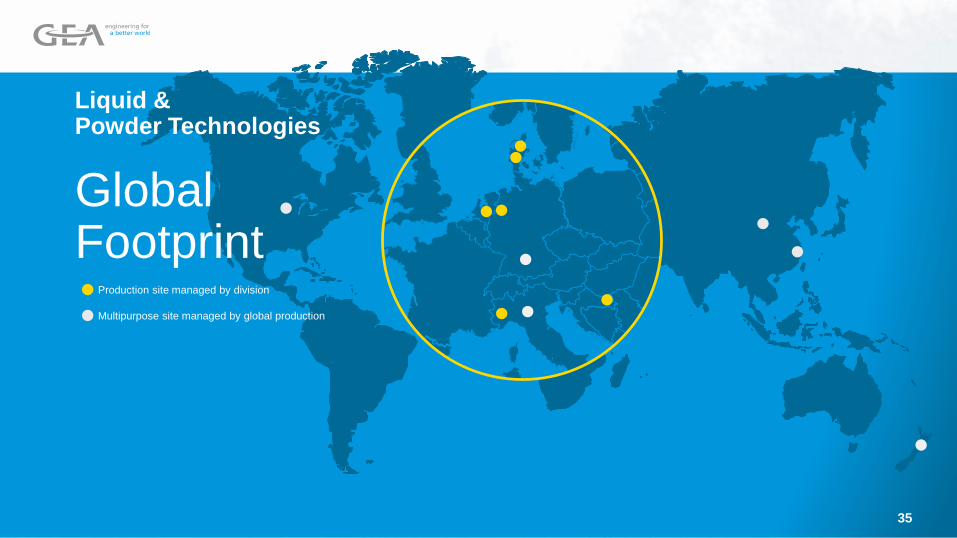
Production site managed by division
Multipurpose site managed by global production
Liquid & Powder Technologies
Global Footprint
35
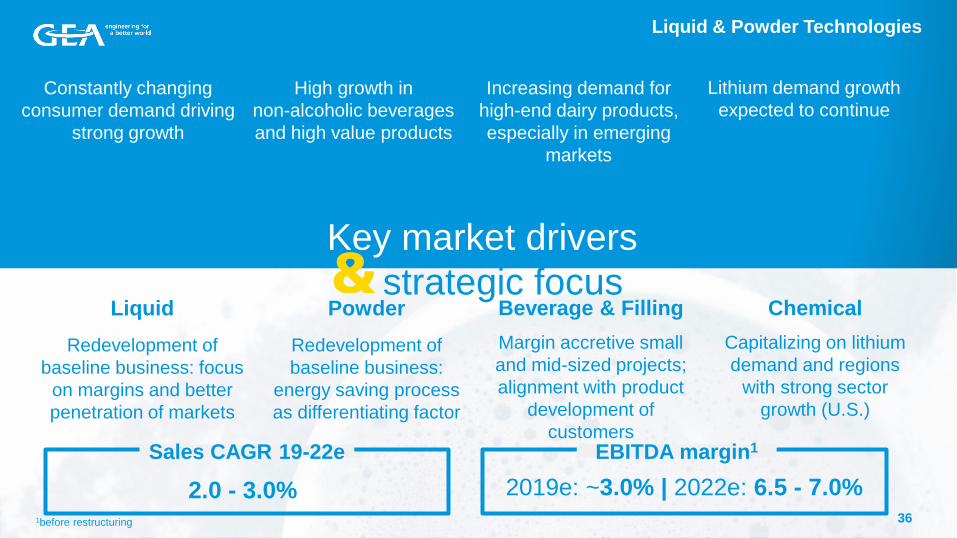
Constantly changing
consumer demand driving
strong growth
High growth in
non-alcoholic beverages
and high value products
Increasing demand for
high-end dairy products,
especially in emerging
markets
Lithium demand growth
expected to continue
Liquid
Redevelopment of
baseline business: focus
on margins and better
penetration of markets
Powder
Redevelopment of
baseline business:
energy saving process
as differentiating factor
Beverage & Filling
Margin accretive small
and mid-sized projects;
alignment with product
development of
customers
Chemical
Capitalizing on lithium
demand and regions
with strong sector
growth (U.S.)
Liquid & Powder Technologies
Key market drivers
strategic focus
2.0 - 3.0%
Sales CAGR 19-22e EBITDA margin1
2019e: ~3.0% | 2022e: 6.5 - 7.0%1before restructuring 36

Food Healthcare Technologies
37

ROCE2
~2%
EBITDA1
~7%Employees3
~3,500 FTE
Sales
~€1.0bn
Key products /
Process lines for
Share of div. sales
EBITDA margin
Market position
Selected
customers
Major
competitors
Pasta
~16%
Above divisional average
#3
Milling, Mixing, Extrusion,
Drying & packaging
equipment
Bühler, Fava,
Storci
Bakery
~12%
Above divisional average
#2
Tunnel ovens, Depositors,
Pie making systems,
Filling injectors
Bühler,
Rademaker
Slicing & Packaging
~14%
Above divisional average
Top 2-3
Slicing & loading systems,
Sugar & vertical packaging
equipment, Thermoformers
Multivac, Weber
Maschinenbau
Food & Healthcare Technologies
Facts & figures 2019e (1/2)
1 EBITDA includes ~€9m IFRS16 effect based on extrapolation June 2019 YTD 2 Calculation based on capital employed L4Q as per Q2 2019 including IFRS 16 pro forma for Q3 & Q4 2018 3 FTE based on Q2 2019 38
Barilla
Ebro
General Mills
Mondelēz
Nestlé
PepsiCo
Barilla
Grupo Bimbo
Mondelēz
Nestlé
Arla
Cargill
Danish Crown
JBS
Tyson

Food Solutions Frozen Food Pharma & Healthcare
Key products /
Process lines for
Share of div. sales
EBITDA margin
Market position
Selected
customers
Major
competitors
~32%
At divisional average
Top 2-3
~7%
Below divisional average
Top 2-3
~19%
Below divisional average
Top 3-5
Protein treatment &
Processing equipment
Spiral-, Tunnel- & Carton-
Freezers
Granulation lines, Tablet
presses, Lyophilization &
fermenters
Marel,
JBT FoodTech
Heinen,
JBT FoodTech
Bosch Packaging, Glatt, Fette
Compacting, IMA
Food & Healthcare Technologies
Facts & figures 2019e (2/2)
1 EBITDA includes ~€9m IFRS16 effect based on extrapolation June 2019 YTD 2 Calculation based on capital employed L4Q as per Q2 2019 including IFRS 16 pro forma for Q3 & Q4 2018 3 FTE based on Q2 2019
ROCE2
~2%
EBITDA1
~7%Employees3
~3,500 FTE
Sales
~€1.0bn
39
WH Group
Danish Crown
JBS
Cargill
TysonUnilever
Nestlé
Nutresco
Mondelēz
Grupo Bimbo
Bayer
Sanofi
Roche
Pfizer
GlaxoSmithKline
Aventis

Food & Healthcare Technologies
Service 24%
Equipment
76%
APAC 16%
DACH&EE
20%
NAM 22%
NCE 12%
WE&MEA
22%
LAM 8%Food 74%
Pharma 21%
By end market By region By type
Due to rounding, marginal
deviations may occur.
Sales Breakdown LTM (Q2 2019)
Other 5%
40

Production site managed by division
Multipurpose site managed by global production
Food & HealthcareTechnologies
Global Footprint
41

Global megatrends incl. aging
and urbanization lead to
increasing demand in processed
food and medication
Constantly changing consumer
demand driving strong growth
Increased demand in
ready-to-eat food,
packaged products,
ready meals
Pasta
Increasing market and service
share especially on large
installed base
Bakery
Increasing market share on
global level and increased
service on installed base
Slicing & Packaging
Focus on line concepts and
environmentally friendly
packaging solutions
Food & Healthcare Technologies
42
Key market drivers
strategic focus 1/2

Change in diets
(e.g. shift to gluten free nutrition)
triggers customer investment
Food Security
and traceability
Change in environmental
regulation triggers investments
(e.g., biodegradable plastics)
Food Solutions
Leverage rise of middle
class by optimizing
sales force footprint
Frozen Food
Turn around strategy to
recover market share and
increase profitability
Pharma & Healthcare
Focus on excellence & margins in
project execution; technology
selling in targeted growth markets
with focus on mid-size projects
Food & Healthcare Technologies
Key market drivers
strategic focus 2/2
2.5 - 3.0%
Sales CAGR 19-22e EBITDA margin1
2019e: ~7.0% | 2022e: 7.5 - 8.5%1before restructuring 43

Farm Technologies
44

ROCE2
~6%
EBITDA1
~9%Employees3
~2,200 FTE
Sales
~ €0.6bnMilking & Feeding Cooling Manure
Key products
Share of div. sales
EBITDA margin
Market position
Selected
customers
Major
competitors
~83%
Below divisional average
Top 2
~3%
Below divisional average
Top 2-4
~10%
Above divisional average
#1
Automated Milking &
Feeding, Conventional
Milking
Milking Equipment
& Milk CoolingManure Management
DeLaval,
Lely
DeLaval, Müller,
Serap Jourdain
Barn Equipment
Barn
~4%
Below divisional average
Very fragmented market
very fragmented
market
Farm Technologies
1 EBITDA includes ~€9m IFRS16 effect based on extrapolation June 2019 YTD 2 Calculation based on capital employed L4Q as per Q2 2019 including IFRS 16 pro forma for Q3 & Q4 2018 3 FTE based on Q2 2019
Facts & figures 2019e
Individual dairy farmers with corresponding herd sizes of at least ~30 cows in mature markets
45

Farm Technologies
Due to rounding, marginal
deviations may occur.
Sales Breakdown LTM (Q2 2019)
Service 42%
Equipment
58%
APAC 12%
DACH&EE 27%
NAM 32%
NCE 12%
WE&MEA 9%
LAM 8%
Dairy
Farming 100%
By end market By region By type
46

Production site managed by division
Multipurpose site managed by global production
FarmTechnologies
Global Footprint
47

Further consolidation
of farms
Lack of low cost labor
and therefore need for
automated solutions
Professionalization of
milking in emerging
markets
Digitization
and big data
on farms
Key market drivers
strategic focusMilk & Feeding
Automated milking and
feeding systems; enlarge
footprint in hygiene and
aftermarket business
Cooling
Review of strategic
options
Manure
Automated systems,
enhance environmentally
friendly manure systems
Barn
Review of strategic
options
Farm Technologies
1.5 - 4.5%
Sales CAGR 19-22e EBITDA margin1
2019e: ~9.0% | 2022e: 10.0 - 12.0%1before restructuring 48

RefrigerationTechnologies
49

ROCE2
~14%
EBITDA1
~8%Employees3
~2,700 FTE
Sales
~ €0.8bnComponents Projects Skids
Key products
Share of div. sales
EBITDA margin
Market position
Selected
customers
Major
competitors
~31%
Above divisional average
Top 3
~48%
Below divisional average
Key player in many markets
~21%
Below divisional average
Very fragmented market
Piston & Screw Compressors,
Piston & Screw Chillers, Piston &
Screw Heat Pumps, Condensing
Units, Dryers, Purgers
Industrial refrigeration & heat
pumps; sustainable energy
solutions
Marine, Oil & Gas,
Power & Chemical skids
Bitzer, Howden, Mayekawa, JCI/Sabroe, Engie
Refrigeration Technologies
Facts & figures 2019e
1 EBITDA includes ~€11m IFRS16 effect based on extrapolation June 2019 YTD 2 Calculation based on capital employed L4Q as per Q2 2019 including IFRS 16 pro forma for Q3 & Q4 2018 3 FTE based on Q2 2019
50
Edeka
Daimler
Intermalt
Mars
General Electrics
The Linde Group

Due to rounding, marginal
deviations may occur.
Sales Breakdown LTM (Q2 2019)
Refrigeration Technologies
Beverage 5%
Food 42%
Other 44%
Climate Control 5%
Dairy 4%
Service 36%
Equipment /
Projects
64%
APAC 13%
DACH&EE 26%
NCE 19%
WE&MEA 33%
LAM 2%NAM 7%
By end market By region By type
51

Production site managed by division
Multi-purpose site managed by global production
RefrigerationTechnologies
Global Footprint
52

Projects
Focus on projects with attractive
margins and improving service /
parts business especially
on the installed base
Positive market growth
for Dairy, Food &
Beverage industries
Strong focus on
reduction of energy
consumption
and CO2 footprint
Increased demand
for heat pumps and
sustainable energy
solutions
Trend towards
”plug & play”
refrigerators
Refrigeration Technologies
Key market drivers
strategic focus
2.0 - 2.5%
Sales CAGR 19-22e EBITDA margin1
2019e: ~8.0% 2022e: 9.5 - 10.0%
1before restructuring53
Components
Streamline product portfolio
(commercial compression
business)
Skids
Turnaround of Oil & Gas
business; increase service
share by focusing on profitable
projects; strengthen export
share of skids

Strategic priorities
Separation & Flow
TechnologiesFood & Healthcare
Technologies
Refrigeration
Technologies
Liquid & Powder
TechnologiesFarm
Technologies
54

Beyondorganizational changes
55
STEFAN KLEBERT & MARCUS A. KETTER

Operational efficiency
56
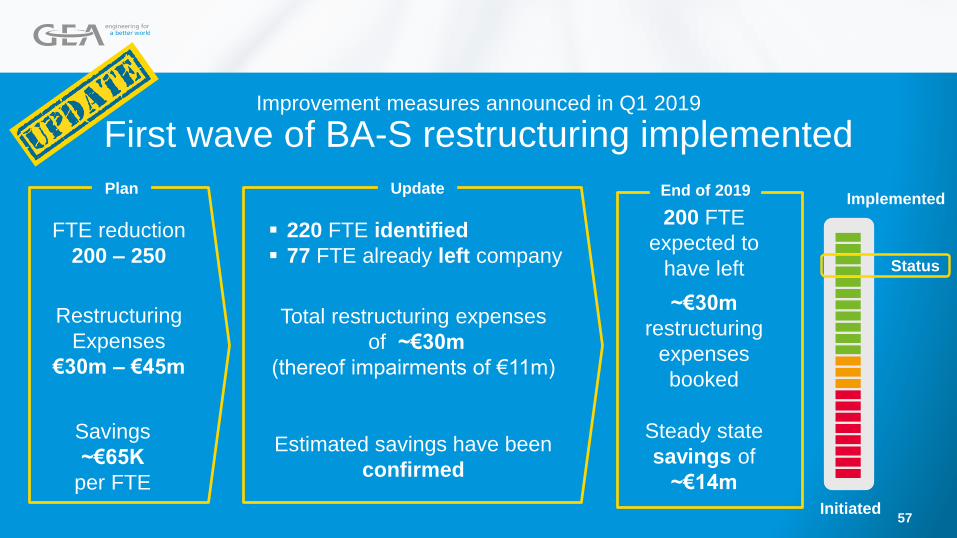
Improvement measures announced in Q1 2019
First wave of BA-S restructuring implemented
FTE reduction
200 – 250
▪ 220 FTE identified
▪ 77 FTE already left company
Restructuring
Expenses
€30m – €45m
Total restructuring expenses
of ~€30m
(thereof impairments of €11m)
Estimated savings have been
confirmed
Savings
~€65K
per FTE
200 FTE
expected to
have left
~€30m
restructuring
expenses
booked
Steady state
savings of
~€14m
Status
Initiated
Implemented
57
End of 2019Plan Update

Reduction of
further 600 FTE1
needed to regain
solid operational
efficiency
Assessment
Severance
payments of
€50m – €60m
expected
Estimated Cash Out
Steady state
savings of
€35m – €45m
expected
Estimated Savings
Implementation to
be completed by
end of 2020
Timing
1 Compared to FTE base dated June 30, 2019 (full time & contingent)
Total capacity reduction of ~800 FTE1 (incl. first wave of BA-S restructuring) to be
implemented by end of 2020
Further operational efficiency measures required
Reduction of further 600 FTE in focus
58

424 547 750 674 747 906
9.4%
11.9%
16.7%
14.6%15.5%
18.6%
0%
2%
4%
6%
8%
10%
12%
14%
16%
18%
20%
0
100
200
300
400
500
600
700
800
900
1.000
Q4 14 Q4 15 Q4 16 Q4 17 Q4 18 Q2 19 Q4 19 Q4 20 Q4 21 Q4 22
NWC (Closing date) [€m] NWC (spot) as % of sales (LTM)
Global program launched to reverse the Net Working Capital (NWC) trend
Ongoing increase of NWC to sales ratio
since implementation of OneGEA
Global NWC optimization project
launched in August 2019 to sustainably
improve NWC
Operational efficiency
Target
• Reverse the NWC trend with
short-term measures
• Pave the ground for sustainable
NWC reduction and management
59
Target corridor
2021-2022

Procurementoptimization
60

New COO Procurement & Productionappointed
TBA
Chief Operating Officer, member of
the Executive Board
• Process optimization and organizational transformation
• Digitizing global procurement and supply organizations
• Realizing significant procurement synergies
• Innovating production processes and automation
Experience
• Chief Procurement and Supply Chain Officer of a global
technology group
• Vice President Supply Chain & Logistics
• Management Consultant
• Degree in Business Administration & Engineering
Career Steps
61

~€360m
Total Spend 2018 ~€2.8bn
Manufacturing ~€510m
Components ~€410m
Electrical systems ~€340m
Transparency on spend - overview
Direct spend
~€1.260bn
Operations &
logistic
~€510m
Indirect spend
~€400m
To be classified
Procurement optimization
62
~€300m
Division specific

Core principles of the new
organization
Procurement empowered and
represented by a member of the
Executive Board
Bundling of expertise for category
management
Clear responsibilities & contact points,
by cascading into the divisions
Strict governance with full
accountability
From threeindependentprocurementorganizations toone professional setup
Procurement optimization
63

1rounded figures
Components
Electrical systems
Operations &
logistics
Indirect spend
Manufacturing
2021
34m
2020
26m
2022
50m
Savings
ramp-up per
procurement
categoryTotal €1
Main levers
• Initiatives for mechanical engineering business
• Initiatives for project business
• Initiatives for operations & logistics
• Initiatives for indirect spend
64

Key figures
Scope: global
Spend: €61m/y
Addressed spend breakdown
Situation
• High No. of suppliers (1,400)
• 80% of spend w/ 60 suppliers
• Significant variation on components
• High complexity in supply chain processes
Target
• Definition of standards &
preferred suppliers
• Process optimization
Key results
Net savings: €3.1m
Temperature
Flow
Pressure
Liquid analyse
Level / weight
Main measures
• Standardization with preferred parts per sub-category
• Introduce GEA standard components catalogue
• No definition of brands in GEA quotes
Optoelectronic /
proximity
Process
Demand &
Specifications Commercial
Maturity level Lever assessment
Case study Sensors
Procurement optimization
65

Key figures
Scope: Global
Key focus area: WE
Spend: €100m/y
Situation
• High No. of suppliers (700)
• 80% of spend w/ 200 suppliers
• 82% of spend in WE, only 6% in EE
Target
• Increase total spend in EE to
30%
• Realize cost saving of 20% on
transfers from WE to EE
• Implement over a 3y timeframe
Key results
Net savings: €4.3m
Main measures
• Create global category business plan
• Expand and consolidate network base in EE
• Find and qualify competitive suppliers specialized in machining process
Maturity level
Case Study Machined Parts
MD2
AD
MD1
APAC
FD
NAM/LAM
BA-S
Commercial
Procurement optimization
66
Process
Demand &
Specifications Commercial
Lever assessment

Productionfootprint
67

Production footprint
Global manufacturing footprint – targets & initiatives
Significant shift of production volumes to
Eastern Europe to reduce complexity,
full-cost hourly rates and
manufacturing costs
Consolidate APAC production volumes
to increase utilization and optimize
manufacturing costs
Consolidate assembly footprint mainly in
Western Europe to increase utilization,
decrease costs and complexity
Strengthen multi-purpose sites by
increasing utilization and flexibility
68

Global manufacturing footprint – targets
1 Figures based on 2018 production hour volumes, no growth or future product mix effects considered, no inflation and price, increases considered, no potential acquisitions considered2 One-off costs & savings for APAC consolidation requires further validation and is not included in figures
2023 -
2025
One-off costs
(€m)1
41
FTE shift from
WE to EE
~260
Moved production
hours
~545k
Annual savings
(€m)1
30
Moved production
hours
~720k
Annual savings
(€m)1,2
>15
One-off costs
(€m)1,2
>30
By
2023
Production footprint
69
Capex
(€m)
38

Shift of production volumes to EE by 2023
Key measures
Significant expansion of Eastern
European production volume by mid-2021
to absorb hours from Western Europe
• Shift a total of 150K production hours
from Western European sites to Eastern
Europe by 2022
• Additional shift of 185K production hrs
by 2023
In total:
Shift ~335K hours from high to low
cost countries by 2023
Potential shift of additional
~220K hours from high to low cost
countries by 2025
Lever 1:
shift production volumesto low cost countries
Production footprint
70

APAC consolidation by 2021
Consolidation of APAC production hours
to increase utilization and optimize
manufacturing costs
Shift of in total
~210K hours by 2021
Potential shift of in total
~500K hours by 2025
Lever 2:
consolidate productionhours in APAC countries
Key measures
Production footprint
71

As is 2023 2025
260
27%73% 33%67%
26%74%
37%63%
30%70%
Production hours1
FTE21%79%
LCC
HCC
2025 target for global production
Production footprint
72
Shift of FTE from WE to LCC
(currently 3,800 FTE in Western Europe)
545K >720KRelocation of hours
(from current, in total 5.6m hours)
1 Figures based on 2018 production hour volumes, no growth or future product mix effects considered, no inflation and price, increases considered, no potential acquisitions considered

Shorttermperformance actions
73

Not yet the right timing for larger portfolio measures
▪ Highly integrated OneGEA
organization needs to be sorted out
first
▪ “Zebra entities” need to be cleaned to
achieve the necessary transparency
for appropriate portfolio decisions
▪ Healthy balance sheet with no urgent
need to generate cash
Current situation
Short term performance actions
▪ Exit underperforming businesses
for which GEA is not best owner
▪ In a next phase, active portfolio
management will be an important
value driver for GEA
▪ At the same time, we will look for
value creating reinvestments to
take the company to the next level
Next steps
2019 2020 2021
74

EBITDA
~0% - ~2%Employees
~700 FTE
Sales
€~200m
Short term portfolio streamlining
Short term performance actions
Exit processes in preparation
Selected FT Businesses
Refrigeration Technologies
Farm Technologies
Rationale
▪ Low margin businesses for which GEA is
not best owner
▪ No synergies with other GEA businesses
▪ Not mission critical – can be sourced
externally
Refrigeration Technologies
Overall size of
streamlining
Selected RT Businesses
Rationale
▪ Low margin or currently underperforming
businesses for which GEA is not best owner
▪ Limited synergies with other GEA
businesses
▪ Exposure to end markets which are not core
to GEA
75

IT and ERP
76

IT and ERP
Five major steps to build astate-of-the-art IT for GEA
New Operating Model & IT Setup
New IT Top Management
Improvements in IT Infrastructure
Improvements in IT Operations
Global ERP Program
77

New IT Top Management
Career steps
• Degrees in Mechanical
Engineering as well as
Engineering Economics
• Managing Director at GEO
Tusk (Software)
• CIO at KHS (Engineering /
Manufacturing)
• CIO at MANN+HUMMEL
(Automotive)
Experience
• Global ERP rollouts (SAP, SAP
HANA, Microsoft)
• Global sales and configuration
projects (SAP, Salesforce)
• Large scale projects
(Engineering and IoT
platforms, cloud
transformation)
• Multiple implementations of
modern IT organizations
Christian Niederhagemann
Group Chief Information Officer
Career steps
• Degree in Technical
Cybernetics and Automation
Engineering
• Head of IT at KHD Humboldt
Wedag (Engineering)
• CIO at Hitachi Power Europe
(Engineering)
• CIO at Schuler (Engineering /
Manufacturing)
Experience
• Global ERP template
implementation and
harmonization (SAP) in
Manufacturing & Engineering
• Harmonization of PLM/PDM,
CAx solutions
• IIoT projects focused on
remote maintenance &
machine learning
Michael Claus
Vice CIO / Head of
Architecture & Innovation
78
IT and ERP
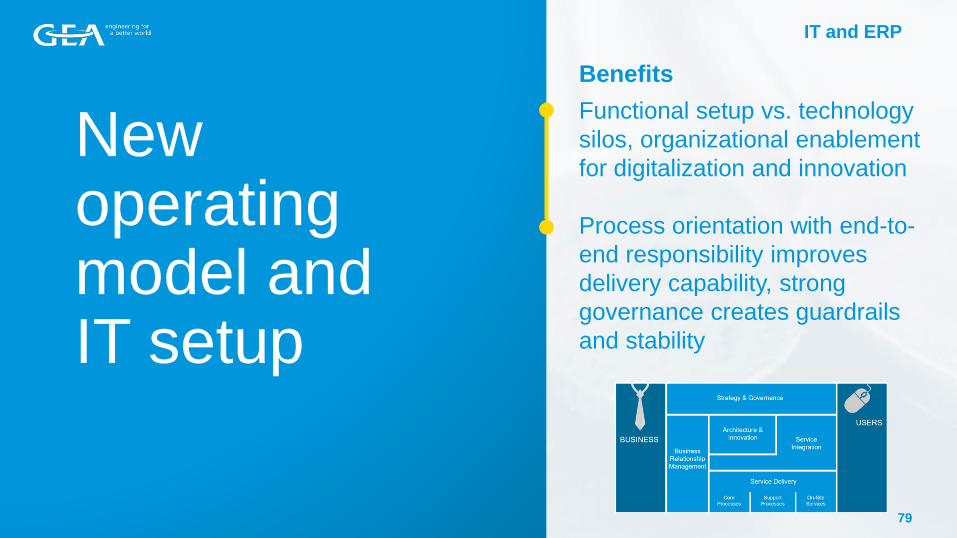
New operatingmodel andIT setup
Benefits
Functional setup vs. technology
silos, organizational enablement
for digitalization and innovation
Process orientation with end-to-
end responsibility improves
delivery capability, strong
governance creates guardrails
and stability
79
IT and ERP

Improvements in IT operations (1/3)
Improved global Shared Services
• Assessment and benchmarking by independent advisor
• Definition of market-standard Service Level Agreements
Re-adjusted contract with outsourcing partner
• Negotiations completed successfully incl. new SLA and penalties
• Mid-term commitment by 2022
• New culture of collaboration on board and operations level
State-of-the-art IT operations
• Establish IT service management processes and organization
• Periodic IT user satisfaction surveys
Improve
Renew
Manage
80
IT and ERP

Market Benchmark
Improvements in IT operations (2/3)
SLAs ▪ Down to 43 SLAs
▪ Strong improvement in
resolution time and
quality
▪ Assessed and approved by
an independent advisor
Penalties ▪ Only 5% of overall
contract fee at risk
▪ 15% of IT fee at risk ▪ 15% agreed of IT-fee at
risk can be assumed as
market standard
▪ 101 SLAs
▪ No end-user focus
Example
Major incident
Example
User incident
▪ Resolution time: 3 days
▪ For example: Site w/o network
▪ Resolution time: up to 10 days
▪ For example: Password reset
▪ Resolution time: 4 to 8 hours
▪ Resolution time: 24 hours
NowPast
81
IT and ERP

Monthly
C-level
review board
▪ GEA
▪ Vendor
Assessment
and SLA
benchmark by
independent
advisor
Definition of
state-of-the-
art SLAs
Re-adjusted
contract with
improved SLAs
and higher
penalties
New setup
in place
Application
harmonization
and Windows
10 rollout
completed
H2 2020 H1 H22019 H1
IT Satisfaction
Survey
IT Satisfaction
Survey
IT Satisfaction
Survey
Improvements in IT operations (3/3)
82
IT and ERP

Improvements in IT infrastructure
Consistent cloud strategy
• State-of-the-art cloud environment
• More than 90% of all GEA servers will be moved to the cloud by
2020
Redesign of global network
• State-of-the-art software based network (SD-WAN) in place by
mid-2021
• Enabling latest security technology incl. 24/7 security operations
Harmonization of application landscape
• 1,600+ server applications under review
• 450+ desktop applications reduced to 210 by mid-2020
Cloud
Network
Applications
83
IT and ERP

August
2019
ERP transition with three initiatives
October
2019
~End of
2021
End of
2025
Financial statements per new
organization BUs/Divisions
ER
P I
nit
iati
ve
s
ERP split up of zebra companies
of material size
Global ERP program
84
IT and ERP
S/4HANA
Digital Process
World
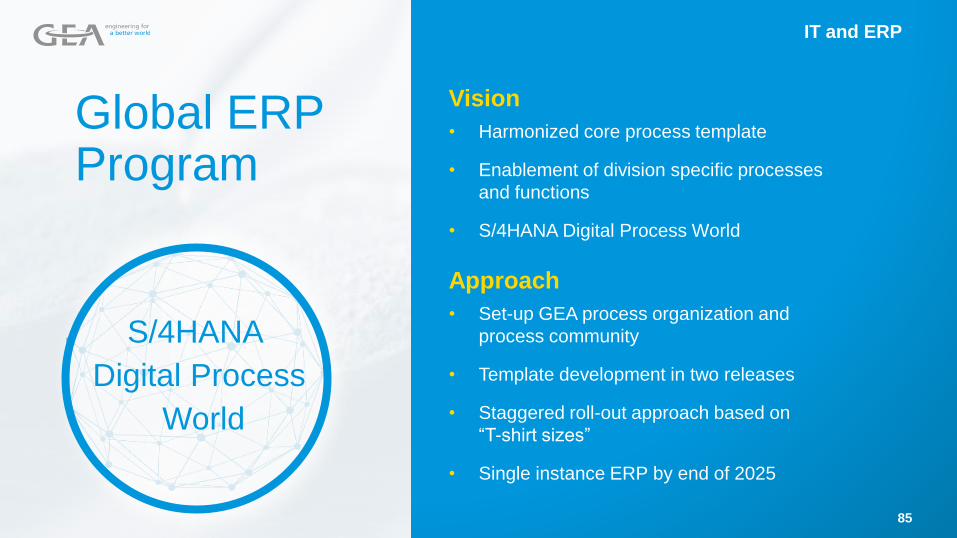
Global ERP Program
Vision
• Harmonized core process template
• Enablement of division specific processes
and functions
• S/4HANA Digital Process World
Approach
• Set-up GEA process organization and
process community
• Template development in two releases
• Staggered roll-out approach based on
“T-shirt sizes”
• Single instance ERP by end of 2025
85
IT and ERP

Process Expert
Key User
GEA BPM Community
New Business Process Management Organization with clear responsibilities for the BPM Community
Career steps
• Degrees in International
Business Development and
Economics
• Business Process Consultant
at Bearing Point (Consulting)
• Head of Business Process
Management at Schuler
(Engineering / Manufacturing)
Experience
• Business Process
Management (BPM) in different
industries
• Process harmonization
(different context incl. ERP
implementation)
Daniela Weiss
Head of Process Organization
Global Process Owner
Owner of the global end-to-end
process responsible for strategic
guidance
Process Lead
Responsible for business process
activities within and across
Divisions / Regions / Central Functions
Process Expert
Supports business process activities
within own Division / Region / Central
Function
~2.5 FTE1
~25 FTE1
~50 FTE1
1 Only about 7 new FTE for new organization needed;
all other members of BPM community cover tasks as part of their scope 86
IT and ERP

Roll-outs are clustered in T-shirt sizes based on an entity evaluation with roll-out complexity
A company that does not
perform production
activities.
A company that performs
ordinary production,
R&D or service activities.
A company that performs
complex production,
R&D and/ or service
activities.
A company that performs
the most complex
production activities
on multiple layers.
S
M
L
XL
✓ ✓ ✓ ✓
✓ ✓ ✓ ✓ ✓ ✓ ✓
✓ ✓ ✓ ✓ ✓ ✓ ✓ ✓ ✓
✓ ✓ ✓ ✓ ✓ ✓ ✓ ✓ ✓
Finance Controlling Purchasing Sales Production Project Engineering
Ware-
house &
Logistics ServiceT-shirt definitionsSizing Complexity
✓ = Reduced process scope 87
IT and ERP

GEA Digital
Platform
completed
Design & build Roll-out
Elimination of all unsupported
ERP systems – Phase 1
Elimination of all non-SAP
systems – Phase 2
Full S/4HANA
roll-out– Phase 3
End of 2025 -
Program
finalized
2020 2022 2023 2024 202520212019 2026
SAP as only
ERP system
All non-
supported ERP
systems on S/4
>20% of total
GEA revenue
on S/4HANA
Full template
(Release 2)
finalized
Template
(Release 1)
finalized
E2E process
organization
set up
Eliminate unsupported technologies early to minimize IT risks and realize roll-out synergies (1/2)
88
IT and ERP

Eliminate unsupported technologies early to minimize IT risks and realize roll-out synergies (2/2)
Group revenue
on S/4HANA
Entities
on S/4HANA
Eliminated ERP
systems from a total
of 67 active ones
Group revenue
on SAP56% 76% 94% 100% 100%
2021 2022 2023 2024 2025
1% 21% 39% 69% 100%
31 / 15% 63 / 31% 97 / 47% 154 / 75% 204 / 100%
20 26 33 40 67
End of
89
IT and ERP

Required investments for current ERP land-scape will be used for the new Global ERP
1224
64
56
99
16
25
0
10
20
30
40
50
60
70
80
90
100
110
120
130
140
150
Additional
investment
GEA ERP
investment
92
148Contingency
Software costs
External costs
Investment Delta
Minimum required
IT investment for
current ERP
landscape
€m
60
50
40
30
20
10
0
Typical process efficiencies1
• Reduce process time to serve 10-15%• Process simplification 10-15%• Reduce error rate 5-10%• Process number of complaints 5-10%
1 Benchmark based on comparable process harmonization programs (Source: Reputable Audit firm)
Projected process efficiency 5% = €65m p.a.90

Split of cash out & relevant costs over the entire program
50
100
150
226
20
Total
7
20
194
25
15
99
13 242
148
6
6
28
26
26
23Contingency1
External
Software
€m
2020 2021 2022 2023 2024 2025
CAPEX 6 13 20 18 17 15
D&A 0 1 2 5 7 9
expenses 0 2 8 8 9 8
Total expenses 0 3 10 13 16 17
1Contingency is calculated with 25% on external costs (€99m)
91

Benefits
Full transparency, single source of truth for company
data
Harmonized and standardized processes to ensure
synergies leveraged and complexity
Reduces risk by eliminating insufficient ERP systems
Enables future digitalization and digital business models
State-of-the-art S/4HANA technology, highly scalable due
to cloud operations
Eases organizational transformation due to globally
standardized process and IT framework
Global ERP
92
IT and ERP

A self-help story in attractive markets
Our new organization
Introduction to the divisions
Beyond organizational changes
Financials
GEA’s equity story
Summary of
the morning
session
Preview of
the afternoon
session
93

Lunch break
94

FinancialsMARCUS A. KETTER
95

Down by 6% YoY
H1 2019
Order intake
€m 2,333
Growth of 2% YoY
EBITDA1 burdened by
special effects in the
amount of €45m
EBIT1 down by €35m
YoY and equally
burdened by special
effects as EBITDA1
ROCE1,2 down YoY by
32%
Sales
€m 2,305
EBDITA1
€m 186
EBIT1
€m 85
ROCE1,2
10.5%
1 Before effects from restructuring (see Annual Report, page 28 ff.); previous year: pro-forma figure incl. IFRS 16 effects
2 Capital employed excluding goodwill from the acquisition of the former GEA AG by former Metallgesellschaft AG in 1999
(average of the last 4 quarters); previous year: pro-forma figure incl. IFRS 16 effects96

Guidance FY 2019 confirmed
Revenue moderately below
previous year’s level
EBITDA (before restructuring
measures) between €450m
and €490m
ROCE (before restructuring measures)
between 8.5% and 10.5%
This forecast is based on the assumptions described in the Report on Expected Developments on pages 124 ff. in the 2018 Annual Report
and takes into account, among other things, the assumption that there will be no significant slowdown in global economic growth. Potential
acquisitions and divestments in 2019 are not considered.
97
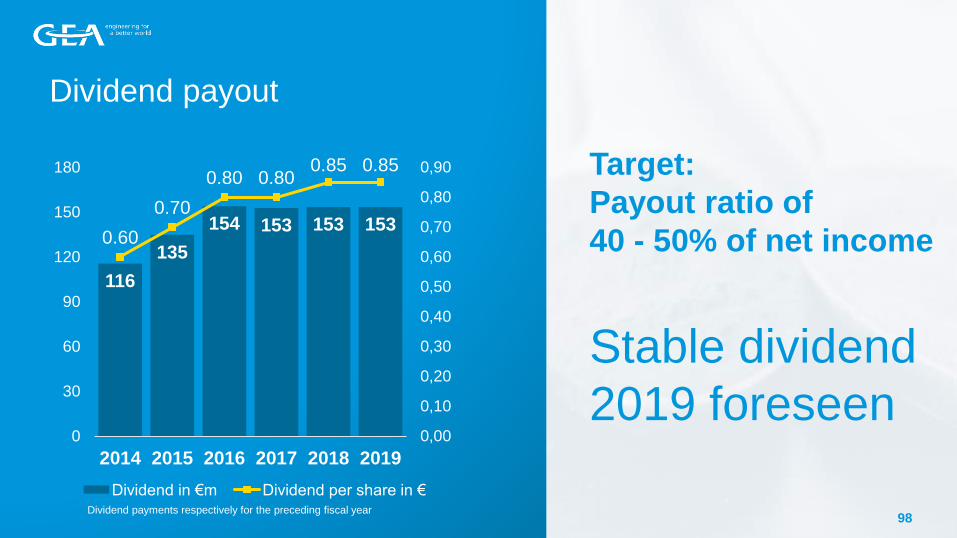
116
135
154 153 153 1530.60
0.70
0.80 0.800.85 0.85
0,00
0,10
0,20
0,30
0,40
0,50
0,60
0,70
0,80
0,90
0
30
60
90
120
150
180
2014 2015 2016 2017 2018 2019
Dividend in €m Dividend per share in €
Dividend payout
Dividend payments respectively for the preceding fiscal year
Target:
Payout ratio of
40 - 50% of net income
Stable dividend
2019 foreseen
98

Financing and liquidity (1/2)Borrower’s note loans with attractive
financing terms
EIB (European Investment Bank) term loan
with very favorable conditions
Several bilateral credit lines with different
international banking partners
EUR 650m syndicated loan serves as
liquidity back-up facility
Solidly funded with a
diversified financing
structure and sufficient
headroom
100
260
650
128 128
122
313
202420222019 2020 20252021 2023
413
172172
50 50
Other* BNL (2025)EIB** BNL (2023) Syn Loan
*Including uncommitted lines and credit lines < 1 Year.
**From the €150m EIB €100m will be lapsed in 2020 if not utilized.
122
€m Committed 2019 Utilized 2019 Headroom 2019
Borrower’s note loan (2023) 128 128 0
Borrower’s note loan (2025) 122 122 0
European Investment Bank 150 50 100
Bilaterals 313 260 53
Syndicated loan 650 - 650
Total 1,363 560 803
99

Financing and liquidity (2/2)
Very healthy balance sheet
with a solid equity position
Adequate headroom to our financial
covenant
However, limited headroom for maintaining
current investment grade rating
Investment grade rating of Baa2 with
Moody’s and BBB with Fitch respectively
We are committed to our
investment grade rating
€m June 2019incl. IFRS 16
June 2018 FY 2018
Equity 2,318 2,410 2,449
Leverage1 (Covenant 3x) 0.8x 0.7x 0.2x
Leverage2 (Rating) 3.1x 2.8x 2.3x
Cash and cash
equivalents231 269 248
Net debt 330 327 72
1 Total net debt / cons. EBITDA based on frozen GAAP (covenant concept)2 According to Moody’s consideration
GEA rating
Agency Rating Outlook Last update
Moody’s Baa2 Negative Feb 27, 2019
Fitch BBB Negative June 29, 2019
100

€m
Preliminary restructuring costs based on EBITDAmidterm development1
0
20
40
60
80
100
120
140
160
180
200
2018 2019 2020 2021 2022 2022
41
45-55
110-120
30-4025-35
65-130
1 Excluding potential impairment
2 Incl. operations, procurement, footprint & ERP
∑ €210m - €250m
EBITDA
improvement
p.a.2
101

91 119 136 159
2.0%
2.6%2.8%
3.3%
0
20
40
60
80
100
120
140
160
2016 2017 2018 2019e . . Target2020 -2022
Capex
Capex as % of sales
Capex development Capex increased to over 3.0% of sales due
to investments in manufacturing footprint,
steering systems and IT transformation
Further investments in manufacturing
footprint and ERP roadmap will keep capex
ratio around 3.0% midterm
Target Capex:
2.5% to 3.5%
of sales
€m
2.5%
3.5%
102
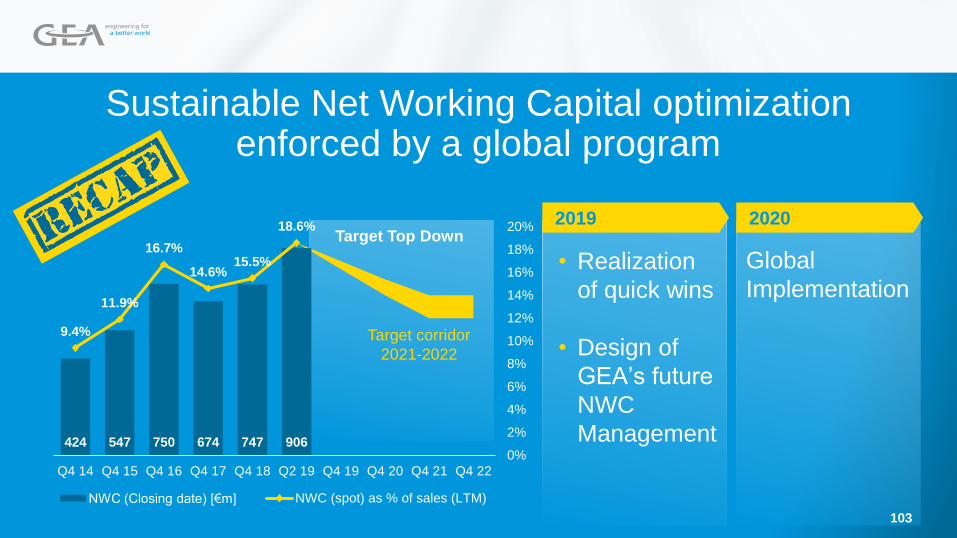
Target Top Down
Target corridor
2021-2022
• Realization
of quick wins
• Design of
GEA’s future
NWC
Management
Global
Implementation
Sustainable Net Working Capital optimization enforced by a global program
20202019
424 547 750 674 747 906
9.4%
11.9%
16.7%
14.6%15.5%
18.6%
0%
2%
4%
6%
8%
10%
12%
14%
16%
18%
20%
0
100
200
300
400
500
600
700
800
900
1.000
Q4 14 Q4 15 Q4 16 Q4 17 Q4 18 Q2 19 Q4 19 Q4 20 Q4 21 Q4 22
NWC (Closing date) [€m] NWC (spot) as % of sales (LTM)
103

Farm
Technologies
Note: Including €64m IFRS 16 effect
GEA GROUP*
Refrigeration
Technologies
Liquid & Powder
Technologies
Food & Healthcare
Technologies
GCC/RoC
Separation & Flow
Technologies
2019e
~9.0%
~8.0%
~3.0%
~7.0%
(~0.5%)
~21.0%
~9.8%
Sales growth and EBITDA margin targets
2.0 - 2.5%
2.0 - 3.0%
2.5 - 3.0%
1.5 - 4.5%
2.0 - 2.5%
2.0 - 3.0%
Sales CAGR 2019-2022 2022e
21.0% - 22.0%
6.5% - 7.0%
7.5% - 8.5%
10.0% - 12.0%
9.5% - 10.0%
11.5% - 13.5%
(0.5%) - (0.4%)
* GEA Group including additional group measures 104

2019 2022Operations
Improvement measures
Footprint Procurement
To
pic
Des
cri
pti
on
Im
pa
ct
Procurement
consolidationOperating
efficiency
increase
Footprint
optimization
Improvement of
procurement
organization
Shift manufacturing
capacities from high
to low cost
countries
Reduction of
~800 FTE
EBITDA1
Guidance
Midpoint
~9.8%
Note: Including €64m IFRS 16 effect
EBITDA1
Target Range
11.5%to
13.5%0.9% - 1.1% 0.2% - 0.3% 0.5% - 1.3%
Sales
Sales efficiency
increase
Appropriate
incentive schemes
and aligned
steering of sales
and service force
0.3% - 1.2%
ERP
ERP
harmonization
Optimization and
harmonization of
existing ERP
landscape
(0.2%)
Sales CAGR 2019-2022 | 2.0 - 3.0%
Overview
New organizational model acting as enabler to drive improvement measures
1051 Before restructuring
2

Summing up
GEA‘s equity storySTEFAN KLEBERT
106

What we want to achieve:
Midterm
targets for
Sales CAGR
2.0% - 3.0%
EBITDA Margin1
11.5% - 13.5%
CAPEX
2.5% - 3.5%Net Working Capital Intensity
12.0% - 14.0%
1before restructuring 107

Technological leadership, excellent
engineering and innovation power
Leading position in attractive global markets
New organization with reinvigorated
entrepreneurial culture
Clear plan in place to increase profitability
Solid balance sheet
108
GEA strives to become the most respected player
in its industries and among all its stakeholders
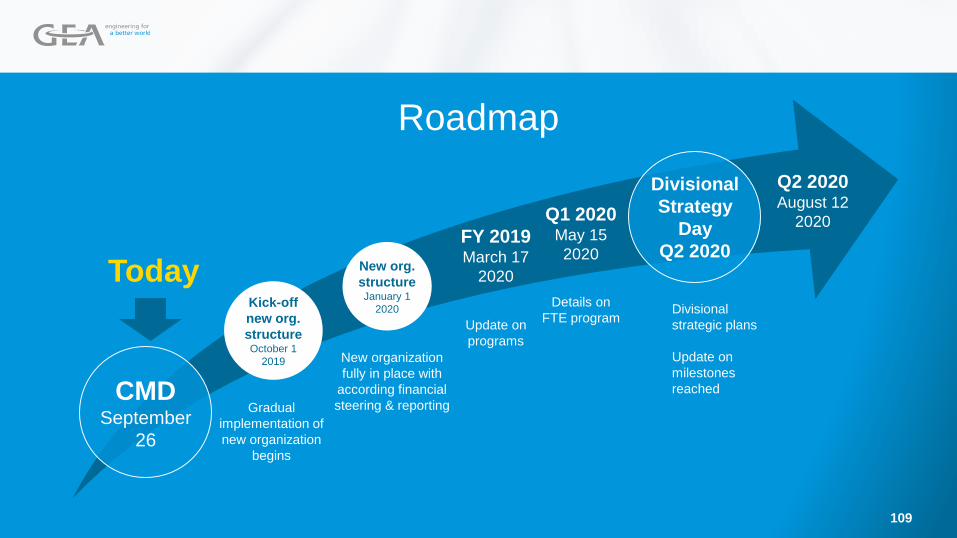
CMDSeptember
26
Gradual
implementation of
new organization
begins
New organization
fully in place with
according financial
steering & reporting
Kick-off
new org.
structureOctober 1
2019
New org.
structureJanuary 1
2020
Q1 2020May 15
2020
Details on
FTE program
FY 2019March 17
2020
Update on
programs
Q2 2020 August 12
2020
Roadmap
TodayDivisional
strategic plans
Update on
milestones
reached
Divisional
Strategy
Day
Q2 2020
109

Questions
are welcome
110