Embed Size (px)
Citation preview

Disclaimer:
This Food Security Assessment Survey was undertaken between March and April 2017 and while the World Food Programme stands by the
information it contains, the situation in northern Rakhine has changed dramatically since then. The upsurge in violence in northern Rakhine since
25 August has led to population displacement and the movement of more than 600,000 people across the border into Bangladesh. It is essential
that the World Food Programme is granted immediate access to northern Rakhine to carry out new assessments and to meet the food needs of
distressed populations living in the area.
ASSESSMENT BACKGROUND
In March 2017, following the November and December 2016 remote emergency assessments, WFP in collaboration with the Food Security Information Network (FSIN) partners, conducted a food security assessment as part of the bi-annual Food Security Monitoring active in 110 Townships.
Between 16 March and 10 April 2017, the monitoring system covered 450 households in 45 villages in Buthidaung and Maungdaw Townships. The survey relied on a statistically representative township-level sample and it was designed to assess the food security and livelihood situation and give an indication of infant and young child feeding practices (See the Methodology section for additional details).
FOOD SECURITY ASSESSMENT IN THE NORTHERN PART OF RAKHINE STATE
Final Report
450 face-to-face household interviews in 45 villages between 26 March and 10 April 2017
Part of the bi-annual Food Security Monitoring implemented by WFP in collaboration with Food Security Information Network (FSIN) partners
OVERALL SITUATION
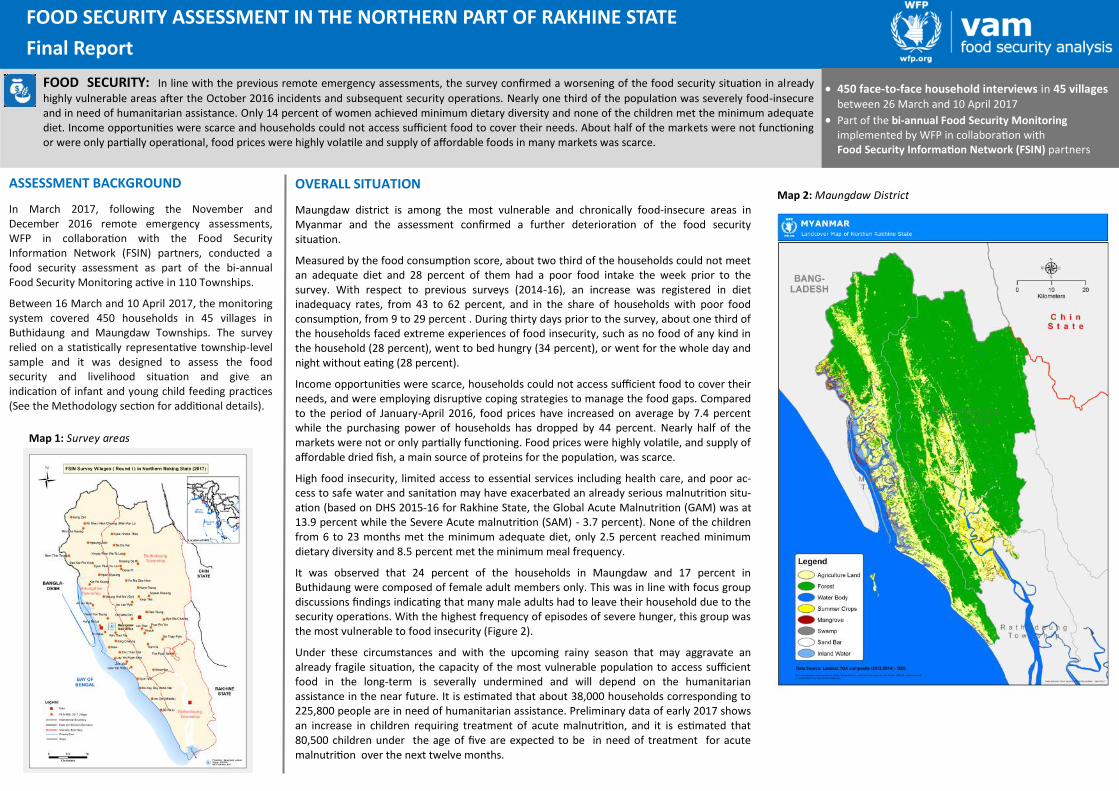
Maungdaw district is among the most vulnerable and chronically food-insecure areas in Myanmar and the assessment confirmed a further deterioration of the food security situation.
Measured by the food consumption score, about two third of the households could not meet an adequate diet and 28 percent of them had a poor food intake the week prior to the survey. With respect to previous surveys (2014-16), an increase was registered in diet inadequacy rates, from 43 to 62 percent, and in the share of households with poor food consumption, from 9 to 29 percent . During thirty days prior to the survey, about one third of the households faced extreme experiences of food insecurity, such as no food of any kind in the household (28 percent), went to bed hungry (34 percent), or went for the whole day and night without eating (28 percent).
Income opportunities were scarce, households could not access sufficient food to cover their needs, and were employing disruptive coping strategies to manage the food gaps. Compared to the period of January-April 2016, food prices have increased on average by 7.4 percent while the purchasing power of households has dropped by 44 percent. Nearly half of the markets were not or only partially functioning. Food prices were highly volatile, and supply of affordable dried fish, a main source of proteins for the population, was scarce.
High food insecurity, limited access to essential services including health care, and poor ac-cess to safe water and sanitation may have exacerbated an already serious malnutrition situ-ation (based on DHS 2015-16 for Rakhine State, the Global Acute Malnutrition (GAM) was at 13.9 percent while the Severe Acute malnutrition (SAM) - 3.7 percent). None of the children from 6 to 23 months met the minimum adequate diet, only 2.5 percent reached minimum dietary diversity and 8.5 percent met the minimum meal frequency.
It was observed that 24 percent of the households in Maungdaw and 17 percent in Buthidaung were composed of female adult members only. This was in line with focus group discussions findings indicating that many male adults had to leave their household due to the security operations. With the highest frequency of episodes of severe hunger, this group was the most vulnerable to food insecurity (Figure 2).
Under these circumstances and with the upcoming rainy season that may aggravate an already fragile situation, the capacity of the most vulnerable population to access sufficient food in the long-term is severally undermined and will depend on the humanitarian assistance in the near future. It is estimated that about 38,000 households corresponding to 225,800 people are in need of humanitarian assistance. Preliminary data of early 2017 shows an increase in children requiring treatment of acute malnutrition, and it is estimated that 80,500 children under the age of five are expected to be in need of treatment for acute malnutrition over the next twelve months.
Map 2: Maungdaw District
FOOD SECURITY: In line with the previous remote emergency assessments, the survey confirmed a worsening of the food security situation in already
highly vulnerable areas after the October 2016 incidents and subsequent security operations. Nearly one third of the population was severely food-insecure and in need of humanitarian assistance. Only 14 percent of women achieved minimum dietary diversity and none of the children met the minimum adequate diet. Income opportunities were scarce and households could not access sufficient food to cover their needs. About half of the markets were not functioning or were only partially operational, food prices were highly volatile and supply of affordable foods in many markets was scarce.
Map 1: Survey areas

HOW MANY AND WHERE ARE THE PEOPLE IN NEED?
WFP estimates that Maungdaw District is home to about 880,000 people of which 158,500 are children under the age of five.
Based on the household hunger scale, about 38,000 households corresponding to 225,800 people are suffering from hunger and are in need of humanitarian assistance (Figure 1).
Households with children under the age of five, large number of dependents, female-headed, or those with only female household members, were the most at risk of severe food insecurity with likelihoods up to 10 percentage points above the average (Figure 2).
Poor infant and young child feeding (IYCF) practices - poor diets and low meal frequency - with known aggravating factors such as poor water and sanitation may have increased wasting and may have had a long term delayed impact on stunting in children.
Based on 2017 preliminary data showing an increase in children requiring treatment of acute malnutrition, it is estimated that 80,500 children under the age of five are expected to be in need of treatment for acute malnutrition within the next 12 months. This estimate includes children in need of multiple treatment cycles.
Based on the bi-annual area profiling assessment conducted by WFP in April 2017, Map 3 shows the most vulnerable areas in the district. The vulnerability score was computed based on a console of eleven indicators including food production, access to food, market functioning, livelihood opportunities and the number of children receiving acute malnutrition treatment.
IMPLICATIONS FOR INTERVENTIONS
Restriction of movement was one of the main constraints for the population for accessing food. Full and unhindered access to viable livelihoods, markets and health care is the key pre-condition for durable, long term solutions to improve access to sufficient food.
Interventions should consider addressing household’s food access constraints, stabilizing food supply and, when possible, enabling food production at the household level in order to ensure food availability and improve intake of high quality animal protein and micro-nutrients.
It is recommended that life-saving assistance prioritizes those groups at risk of malnutrition including those with specific needs such as families with a large number of dependents, children under 5 or households led by single women. Immediate livelihood support interventions would allow beneficiaries to engage in income generating activities during the lean season and restore the productive assets base lost due to security operations.
Nutrition intervention should focus on scaling up treatment of acute malnutrition, preventing nutritional deterioration in children and women at risk with blanket supplementary feeding and promoting optimal young child feeding practices.
Security operations and movement restrictions have changed considerably the operational context. Humanitarian assistance should be provided in the form of in-kind support. Cash interventions should be supported by feasibility assessments due to highly volatile prices, unavailability of preferred commodities, partially functioning markets and unsafe access.
HUMANITARIAN NEEDS
Map 3: Vulnerable areas Figure 1: Humanitarian needs
Figure 2: Risk factors
MORE ON FOOD SECURITY
ACCESS TO FOOD
With the majority of the population bound to a daily cash economy, lower daily wages and reduced employment opportunities have created major difficulties in food access. Compared to the period of January-April 2016, food prices have increased on average by 7.4 percent while the purchasing power of households has dropped by 44 percent.
Nearly 90 percent of the households were worried about not having enough food (89 percent), reduced size and number of meals (70 and 59 percent respectively), and consumed non-preferred foods (89 percent). Households were employing crisis and emergency type coping strategies such as selling productive assets (7 percent), consuming seeds stocks (11 percent), pawn land (7 percent), begging for food (29 percent) and reducing non-food expenditures such as education or health (72 percent).
The share of households who made new debts to buy food in the three months prior to the interview increased significantly (from 20.9 percent in June 2016 to 56 percent in March 2017) as well as the proportion of households relying on non-safe sources of food such as
begging, gathering and food received in exchange of labour. Nearly two thirds of households (62 percent) borrowed food during the month prior to the interview.
The analysis of cost of diet based on 7 days food frequencies and market prices, shows that in April 2017 households were able to only afford an energy dense, undiversified diet lacking of proteins, fats, and micronutrients. Figure 3 shows the average cost of both an energy dense diet and a macronutrient diet in relation to the estimated weekly food expenditure of an average household (6.5 members and 1.3 income earners) engaged in casual labour. Before October 2016, the population could still afford, although not in sufficient quantities, dry fish, chickpeas, green leaf, and palm oil. Since then, the macronutrient diet which would meet the requirements for proteins and fat had become unaffordable for the majority of the population. Most households had sufficient means only to purchase an energy-dense food basket—consisting of mainly rice, some vegetables, and palm oil—with consequences on their nutritional status and health due to the deficiencies in macro and micronutrients.
FOOD UTILIZATION
Overall 69 percent of the households had an inadequate diet of which 28 percent being poor and 41 percent borderline.
Low food diversity and lack of animal proteins were the main concerns in the surveyed areas as access to a sufficiently diversified diet was problematic for 62 percent of the households. Average household dietary diversity score was 3.9 out of a maximum of 12 food groups.
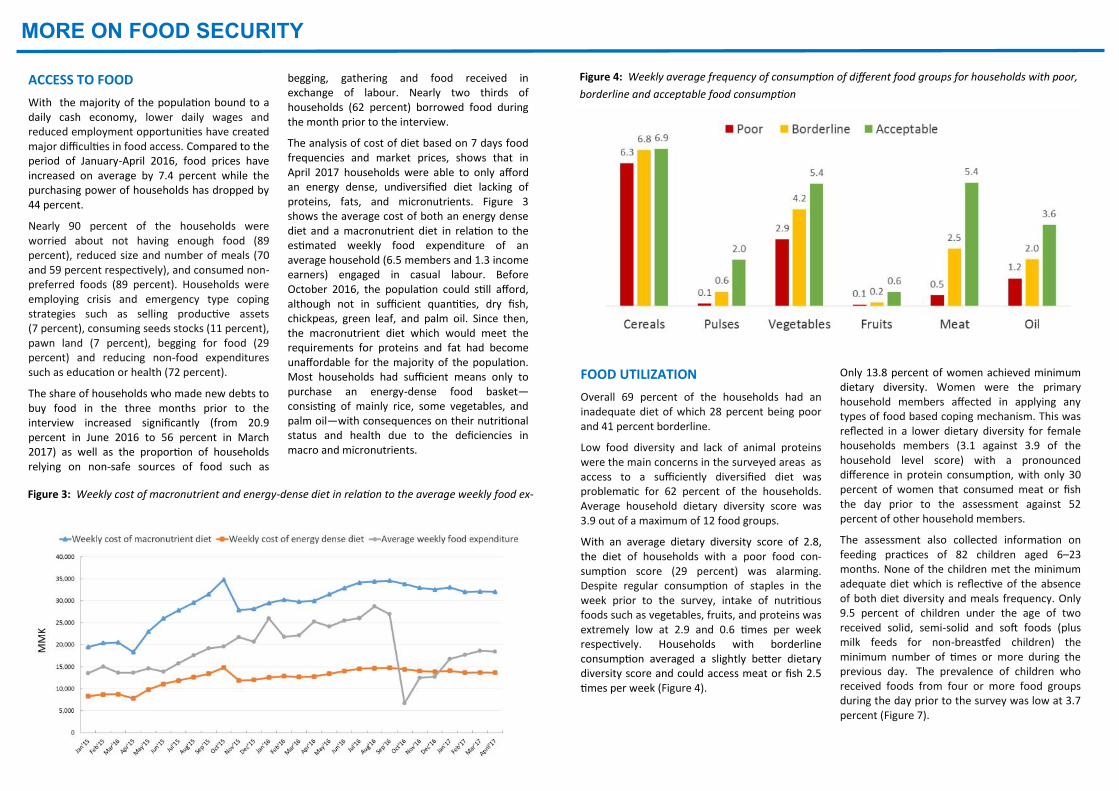
With an average dietary diversity score of 2.8, the diet of households with a poor food con-sumption score (29 percent) was alarming. Despite regular consumption of staples in the week prior to the survey, intake of nutritious foods such as vegetables, fruits, and proteins was extremely low at 2.9 and 0.6 times per week respectively. Households with borderline consumption averaged a slightly better dietary diversity score and could access meat or fish 2.5 times per week (Figure 4).
Only 13.8 percent of women achieved minimum dietary diversity. Women were the primary household members affected in applying any types of food based coping mechanism. This was reflected in a lower dietary diversity for female households members (3.1 against 3.9 of the household level score) with a pronounced difference in protein consumption, with only 30 percent of women that consumed meat or fish the day prior to the assessment against 52 percent of other household members.
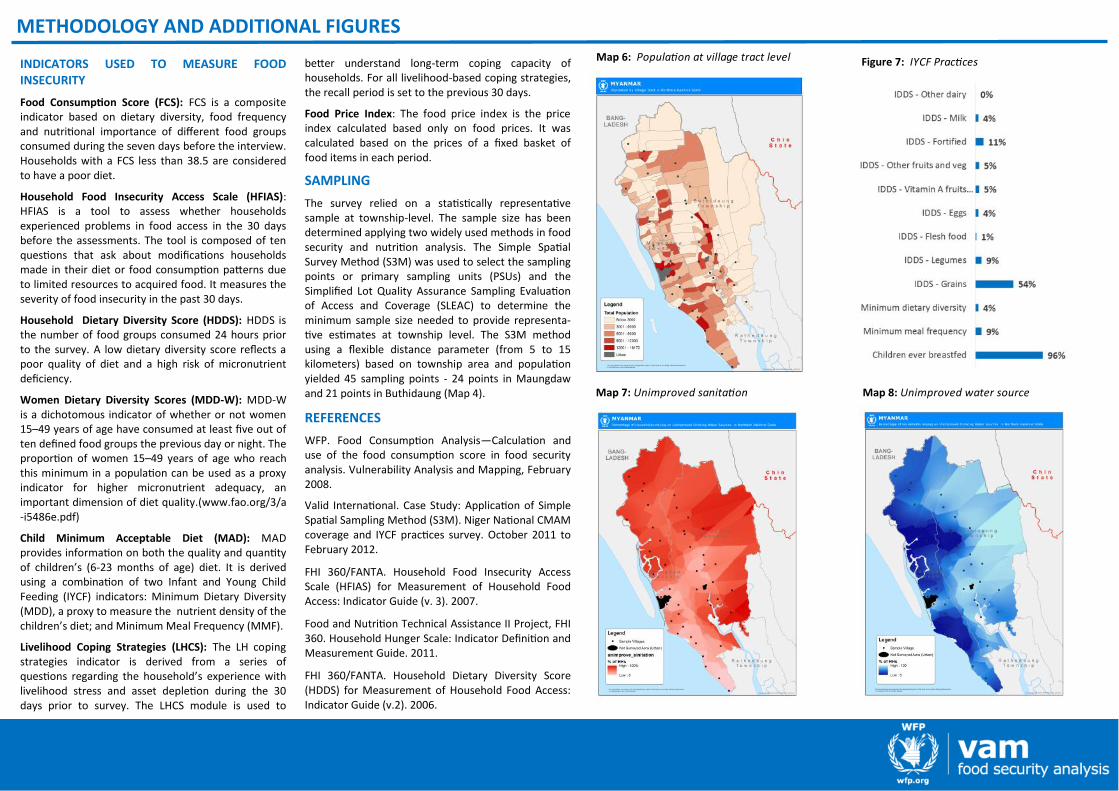
The assessment also collected information on feeding practices of 82 children aged 6–23 months. None of the children met the minimum adequate diet which is reflective of the absence of both diet diversity and meals frequency. Only 9.5 percent of children under the age of two received solid, semi-solid and soft foods (plus milk feeds for non-breastfed children) the minimum number of times or more during the previous day. The prevalence of children who received foods from four or more food groups during the day prior to the survey was low at 3.7 percent (Figure 7).
Figure 3: Weekly cost of macronutrient and energy-dense diet in relation to the average weekly food ex-
Figure 4: Weekly average frequency of consumption of different food groups for households with poor,
borderline and acceptable food consumption

MARKETS AND FOOD PRICES
FOOD PRICES
Between January and April 2017, food prices have increased on average by 7.4 percent, compared to the same period in 2016. Higher food prices have been registered in the northern part of the district (Figure 5). The overall food price increase has been driven by foods rich in protein and fats (dried fish, pulses, and oils) while staples and vegetables had become less expensive.
The price of dried fish, vegetable oil and pulses rose constantly since October 2016 due to increased transportation costs and lower supply.
Low quality dried fish - a major source of proteins for the population - was not available in five monitored markets in Maungdaw and
Buthidaung. In line with dried fish, the price of pulses increased on average by 46 percent while palm oil by 15 percent.
Weaker demand may have caused steep price reductions of rice, potatoes, and fresh vegetables. In April 2017, the price of rice, after its peak in October and December, has dropped to its lowest since March 2015. If compared to the same period in 2016, it was 21 percent less expensive with price reductions up to 33 percent in key production areas in the northern part of Buthidaung Township. The same pattern has been observed for seasonal vegetables, such as potatoes, tomatoes, and eggplants who all registered below average prices for this time of the year and an overall price reduction of 67 percent with respect to the same period in 2016.
Figure 4: Nominal price trend of main food commodities (2014-2017) Map 4: Market status
MARKETS
Markets were functional in the south and partially functional in the north where, out of 25 markets, 8 were partially open and 9 were closed. Residents were hesitating to move through the check points to reach the market.
Markets have been affected by unstable trade flows which have led to food shortages. The supply of commodities which usually flow to Maungdaw District from southern and central Rakhine State through Buthidaung municipal markets was low and erratic. In many markets, particularly in the north, shortages of dried fish, fresh vegetables, palm oil and pulses have been observed.
Figure 5: Food price index

RURAL LIVELIHOODS AND SOCIO ECONOMIC CONTEXT
POVERTY AND INCOMES
Since September 2016 most of the households faced major income losses which had seriously undermined their coping capacity for the upcoming rainy season. Due to the scarce income-generating opportunities and rising cost of living, most of the households could afford neither a nutritious diet nor meet other than food needs such as education and health.
Poverty likelihoods in Maungdaw District were more than double of the national average and among the highest in Myanmar. The estimated poverty probability was 62 percent while 19 percent of the households were “food poor“ and did not have sufficient means to afford basic human needs.
ACCESS TO LIVELIHOODS
Residents still did not have full access to the forest, agricultural land and fishing grounds due to continuous military presence. Production from fish breeding in April decreased by 40 percent as compared to the same period in 2016. The price of charcoal and firewood which are produced locally has increased on average by 45 percent with respect to April 2016. This may indicate lower production due to limited access to the forest.
Military operations had a negative impact on the agricultural production and demand for labour in key production areas in the north of the district. Farmers are facing crop losses and reduced profitability of their harvests due to weaker demand and lower prices for paddy and vegetables.
LIVELIHOOD ACTIVITIES
The most common activity was casual labour (53 percent) followed by farming (17 percent), wood bamboo-cutting (13 percent), fishing (4 percent) and trade (6 percent). Households who did not earn any income during the three months prior to the survey were 3 percent.
Nearly 85 percent of the households had only one income activity while, on average, there were 1.3 income earners per household. Households with
only male income earners were 77 percent while those with active members of both sexes were 7 percent. In approximately 15 percent of the households there were only female and/or children income earners.
DAILY WORK
With more than three quarters of the households that were landless or functionally landless, occasional and daily work was the most important income source for nearly half of the population.
In the first quarter of 2017, lower demand for daily work has led to a surplus of labour that caused lower wages and widespread unemployment. Workers were earning, on average, 27 percent less with respect to the first quarter of 2016. Although average daily wages were slightly lower compared to April 2016 levels, daily labourers worked on average for 1.5 days less with two third of the workforce being employed for three or less working days the week prior to the assessment.
AGRICULTURE
Despite being a rural economy, households with access to land and engaged in crop production were 34.1 percent. Households owning land were only 14 percent while those renting their land or using communal land were 17 and 2 percent respectively.
The ratio between population and available agricultural land (Map 5) shows that production areas are concentrated in few village tracts mainly located in the central and southern part of the district while only few production areas were situated in the extreme north which is mainly covered by forest.
Most of the households were engaged in mono crop production. Paddy (53 percent) and vegetables (27 percent) were the most produced crops followed by other types of cereal (15 percent) and vegetable oils (14 percent). Paddy production was concentrated in the northern part of Buthidaung township.
With more than 83 percent of the landholdings less than two acres, the vast majority of farmers were
operating below subsistence level. Nearly half of the households producing rice or vegetables were food deficient at the time of the survey and they were relying on markets and other sources for their own consumption of such items.
DEBTS
To cope with income losses, the population was undertaking new debts. Since June 2016, the proportion of households having a pre-existing debt rose from 73 percent to 90 percent while the share of households who took new debts in the three months prior to the interview rose from 52 to 73 percent. Nearly 70 percent of the households used the loans to buy food while 19 percent to cover health expenses.
Levels of debt were escalating. If in previous assessments, the average number of working days needed to repay the loans was 48.6, now households will need 84.7 working days, due to both lower wages and higher debts. In addition, this type of coping strategy often comes at a high interest rate which increases household indebtedness and the impact on the household economy. This could devote the loans for investment on education or to buy productive assets.
WASH
Poor drinking water services including accessibility and availability of drinking water was reflected in the high share of households using unimproved and surface water (55 percent) as well as in the proportion of those who reported insufficiency of water over the last year (40 percent). Unimproved and surface water can lead to poor health outcomes and aggravate malnutrition in children (Map 8).
About 35 percent of the households reported to use unimproved and open defecation which can contribute to morbidity and malnutrition (Map 7). About 80 percent of the households did not have a fixed place for washing hands but used a mobile object (bucket, jug or bowl cup in own dwelling). Water without soap or any form of cleaning agent was used by nearly half of the population.
Map 5: Man-land ratio
Figure 6: Income activities
INDICATORS USED TO MEASURE FOOD INSECURITY
Food Consumption Score (FCS): FCS is a composite indicator based on dietary diversity, food frequency and nutritional importance of different food groups consumed during the seven days before the interview. Households with a FCS less than 38.5 are considered to have a poor diet.
Household Food Insecurity Access Scale (HFIAS): HFIAS is a tool to assess whether households experienced problems in food access in the 30 days before the assessments. The tool is composed of ten questions that ask about modifications households made in their diet or food consumption patterns due to limited resources to acquired food. It measures the severity of food insecurity in the past 30 days.
Household Dietary Diversity Score (HDDS): HDDS is the number of food groups consumed 24 hours prior to the survey. A low dietary diversity score reflects a poor quality of diet and a high risk of micronutrient deficiency.
Women Dietary Diversity Scores (MDD-W): MDD-W is a dichotomous indicator of whether or not women 15–49 years of age have consumed at least five out of ten defined food groups the previous day or night. The proportion of women 15–49 years of age who reach this minimum in a population can be used as a proxy indicator for higher micronutrient adequacy, an important dimension of diet quality.(www.fao.org/3/a-i5486e.pdf)
Child Minimum Acceptable Diet (MAD): MAD provides information on both the quality and quantity of children’s (6-23 months of age) diet. It is derived using a combination of two Infant and Young Child Feeding (IYCF) indicators: Minimum Dietary Diversity (MDD), a proxy to measure the nutrient density of the children’s diet; and Minimum Meal Frequency (MMF).
Livelihood Coping Strategies (LHCS): The LH coping strategies indicator is derived from a series of questions regarding the household’s experience with livelihood stress and asset depletion during the 30 days prior to survey. The LHCS module is used to
better understand long-term coping capacity of households. For all livelihood-based coping strategies, the recall period is set to the previous 30 days.
Food Price Index: The food price index is the price index calculated based only on food prices. It was calculated based on the prices of a fixed basket of food items in each period.
SAMPLING
The survey relied on a statistically representative sample at township-level. The sample size has been determined applying two widely used methods in food security and nutrition analysis. The Simple Spatial Survey Method (S3M) was used to select the sampling points or primary sampling units (PSUs) and the Simplified Lot Quality Assurance Sampling Evaluation of Access and Coverage (SLEAC) to determine the minimum sample size needed to provide representa-tive estimates at township level. The S3M method using a flexible distance parameter (from 5 to 15 kilometers) based on township area and population yielded 45 sampling points - 24 points in Maungdaw and 21 points in Buthidaung (Map 4).
REFERENCES
WFP. Food Consumption Analysis—Calculation and use of the food consumption score in food security analysis. Vulnerability Analysis and Mapping, February 2008.
Valid International. Case Study: Application of Simple Spatial Sampling Method (S3M). Niger National CMAM coverage and IYCF practices survey. October 2011 to February 2012.
FHI 360/FANTA. Household Food Insecurity Access Scale (HFIAS) for Measurement of Household Food Access: Indicator Guide (v. 3). 2007.
Food and Nutrition Technical Assistance II Project, FHI 360. Household Hunger Scale: Indicator Definition and Measurement Guide. 2011.
FHI 360/FANTA. Household Dietary Diversity Score (HDDS) for Measurement of Household Food Access: Indicator Guide (v.2). 2006.
METHODOLOGY AND ADDITIONAL FIGURES
Map 6: Population at village tract level Figure 7: IYCF Practices
Map 7: Unimproved sanitation Map 8: Unimproved water source