Embed Size (px)
Citation preview
Disclosure of Genetic Information for
Personalized Nutrition and Change in Dietary Intake
by
Daiva Elena Nielsen
A thesis submitted in conformity with the requirements
for the degree of Doctor of Philosophy
Department of Nutritional Sciences
University of Toronto
© Copyright by Daiva Elena Nielsen 2014
ii
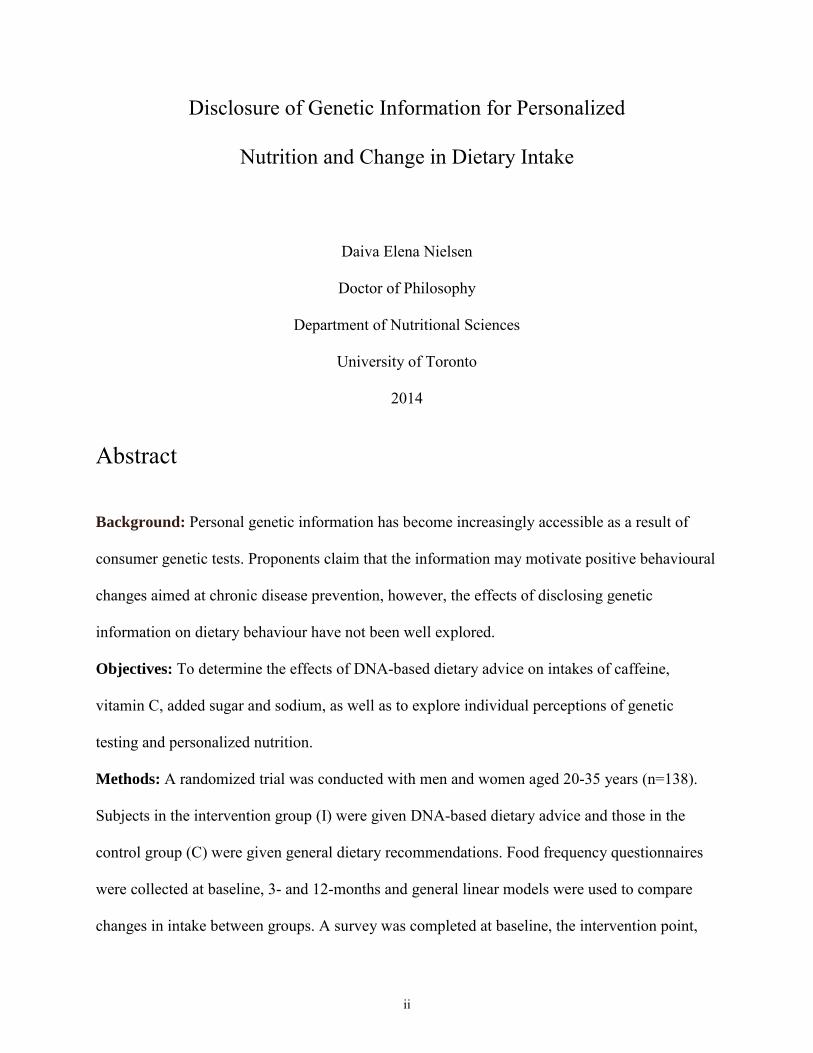
Disclosure of Genetic Information for Personalized
Nutrition and Change in Dietary Intake
Daiva Elena Nielsen
Doctor of Philosophy
Department of Nutritional Sciences
University of Toronto
2014
Abstract
Background: Personal genetic information has become increasingly accessible as a result of
consumer genetic tests. Proponents claim that the information may motivate positive behavioural
changes aimed at chronic disease prevention, however, the effects of disclosing genetic
information on dietary behaviour have not been well explored.
Objectives: To determine the effects of DNA-based dietary advice on intakes of caffeine,
vitamin C, added sugar and sodium, as well as to explore individual perceptions of genetic
testing and personalized nutrition.
Methods: A randomized trial was conducted with men and women aged 20-35 years (n=138).
Subjects in the intervention group (I) were given DNA-based dietary advice and those in the
control group (C) were given general dietary recommendations. Food frequency questionnaires
were collected at baseline, 3- and 12-months and general linear models were used to compare
changes in intake between groups. A survey was completed at baseline, the intervention point,
iii
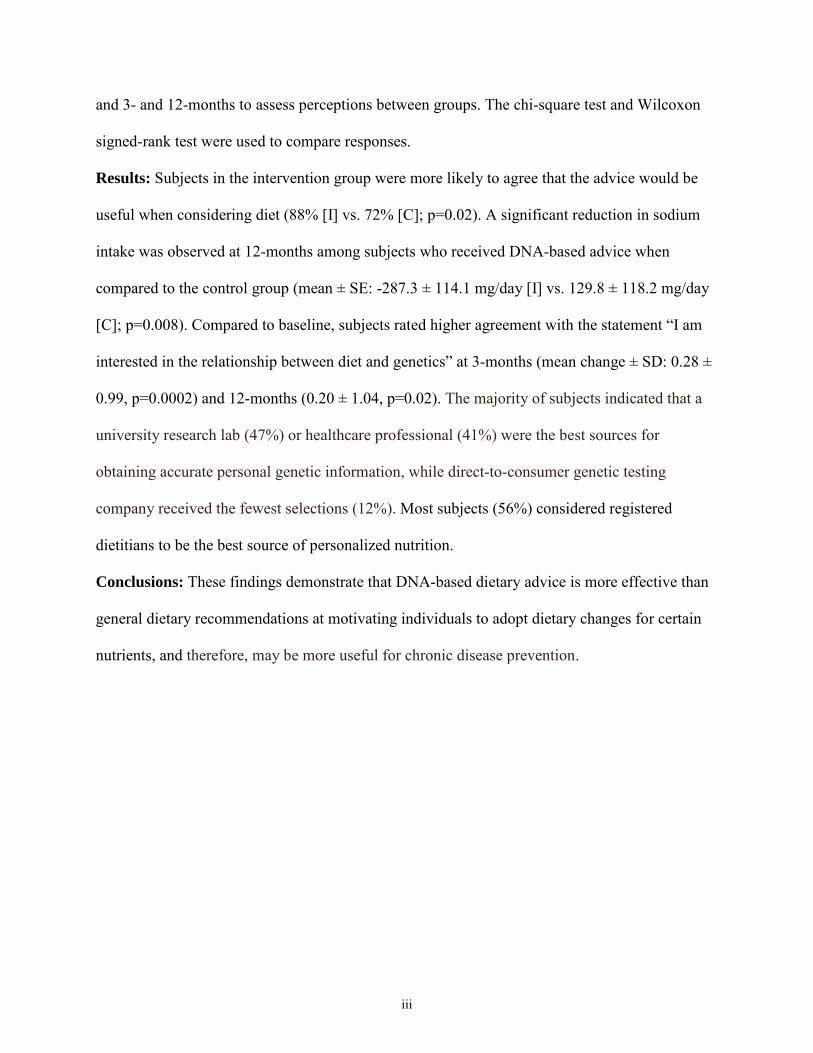
and 3- and 12-months to assess perceptions between groups. The chi-square test and Wilcoxon
signed-rank test were used to compare responses.
Results: Subjects in the intervention group were more likely to agree that the advice would be
useful when considering diet (88% [I] vs. 72% [C]; p=0.02). A significant reduction in sodium
intake was observed at 12-months among subjects who received DNA-based advice when
compared to the control group (mean ± SE: -287.3 ± 114.1 mg/day [I] vs. 129.8 ± 118.2 mg/day
[C]; p=0.008). Compared to baseline, subjects rated higher agreement with the statement “I am
interested in the relationship between diet and genetics” at 3-months (mean change ± SD: 0.28 ±
0.99, p=0.0002) and 12-months (0.20 ± 1.04, p=0.02). The majority of subjects indicated that a
university research lab (47%) or healthcare professional (41%) were the best sources for
obtaining accurate personal genetic information, while direct-to-consumer genetic testing
company received the fewest selections (12%). Most subjects (56%) considered registered
dietitians to be the best source of personalized nutrition.
Conclusions: These findings demonstrate that DNA-based dietary advice is more effective than
general dietary recommendations at motivating individuals to adopt dietary changes for certain
nutrients, and therefore, may be more useful for chronic disease prevention.
iv
Acknowledgements
The completion of this thesis would not have been possible without the support of many
instrumental individuals. I am extremely grateful to have had the privilege of working under the
guidance of Dr. Ahmed El-Sohemy. I have benefited tremendously from his mentorship in both
my intellectual and personal growth over the past four years. Not only have I learned important
concepts in conducting sound research, but also I have learned how to communicate much more
effectively in both writing and speech, which are skills that will continue to serve me well as my
career develops. I am so grateful to Dr. El-Sohemy for all of his time, feedback and
encouragement, and opportunities to attend numerous conferences to present my research. I
would not have had such an incredible graduate experience, or achieved so much, with anyone
else. Thank you.
I am very thankful for the many other professors who have advised and mentored me
over the course of my PhD. I feel very fortunate to have worked with a wonderful Advisory
Committee, whose diverse expertise complemented my thesis research so well. Dr. Ann Fox, Dr.
Mary L’Abbé and Dr. Andrew Paterson provided me with excellent feedback and insight that
guided my thought process and thesis goals. I learned so much from each of you and am very
grateful for your time and input. I would also like to thank Dr. David Jenkins for serving on my
MSc committee and providing valuable advice early on in my research. During my graduate
studies, I completed several courses taught by talented instructors that supplemented my thesis
research perfectly. I am grateful to Dr. Billie-Jo Hardy and Dr. Dominique McMahon for their
thorough overview of issues in genomics, bioethics and public policy, as well as Dr. Jackie
Bender and Dr. Paula Gardner for their thoughtful insight into health behaviour change. Thank
you to Dr. Anthony Hanley for his excellent instruction in nutritional epidemiology, for serving
on my comprehensive exam committee and for his generous support of me by writing letters of
recommendation for many scholarship applications. I would also like to thank Dr. Valerie
Tarasuk. I learned a tremendous amount in Public Health Nutrition and was inspired by your
knowledge and enthusiasm. Thank you as well for serving as my departmental thesis examiner.
Many thanks to the Department of Nutritional Sciences Administration: Louisa Kung,
Emelia D’Souza, Lucile Lo and Vijay Chetty. You ensured that the administrative aspects of my
graduate studies ran smoothly and kept me informed of important dates and timelines. I am very

v
grateful to each of you for your help, and for always being so cheerful and friendly. I will think
fondly of sharing many smiles and laughs with you in the FitzGerald Building. I would also like
to acknowledge the sources of funding that supported my graduate studies: the Ontario Graduate
Scholarship, the Banting and Best Diabetes Centre, the Advanced Foods and Materials Network
and the Department of Nutritional Sciences.
To all the friends I have made at the Department of Nutritional Sciences, a heartfelt thank
you. You have made my PhD a lot more fun and a lot less lonely. I am so grateful to have
worked with incredible lab mates: Leah Cahill, Karen Eny, Hyeon Joo Lee, Andre Dias,
Francesca Garofalo, Bibiana Garcia Bailo, Laura Da Costa, Joanne Brathwaite, Lilli Mauer,
Andrea Josse, Ouxi Tian, Dennis Wang, Joseph Jamnik and Nanci Guest. I wish each of you
nothing but the best. Special thanks to Leah and Karen, you were my first lab mentors and I am
so grateful to you for your kindness, friendship and support. Dennis and Joseph, you made my
final year very special. I looked forward to coming to the lab every day knowing we would have
lots of laughs over lunch and I hope we have many more fishing trips! To Chuck Chen, Alyssa
Schermel, Teri Emrich, Stephanie Nishi, Sabrina Janes, Luke Johnston, Jolynn Dickson and
Sheena Kayaniyil, thank you for your friendship. Chuck, you have been my number one fan and
I am so proud to be your colleague and friend. Many thanks to the undergraduate students who
assisted with subject recruitment and data collection for my study: Alyssa Katzikowski, Maria
Tassone and Sarah Shih. Special thanks to Alyssa who provided countless laughs and memories.
To my close friends outside of the department: Yuliya, Diana, Alexandra and Ruta. Thank you
so much for always keeping in touch (and understanding when I was out of touch) and
providing endless encouragement.
I would like to thank my wonderful family. My parents, Neris and Paul Nielsen, thank
you for all of your love and support. To my brother, Adam Nielsen, thank you for your witty
points of view on my thesis endeavours. You have a unique ability to turn stress into laughter
and for that I am very grateful. Thank you to my Uncle Frank and Aunt Cheryl for cheering me
on (and for the movie nights). I must acknowledge my grandparents, Pranas and Elena Žulys, for
teaching me the value of hard work. My grandmother deserves a special mention for piquing my
interest in nutrition at a young age. And to my brother, Eric Nielsen. Because your story ended
too soon, my goal is to live a life that is twice as full. Your adventurous spirit motivates me to be
brave and strive to achieve as much as I possibly can every day. This thesis is dedicated to you.
vi
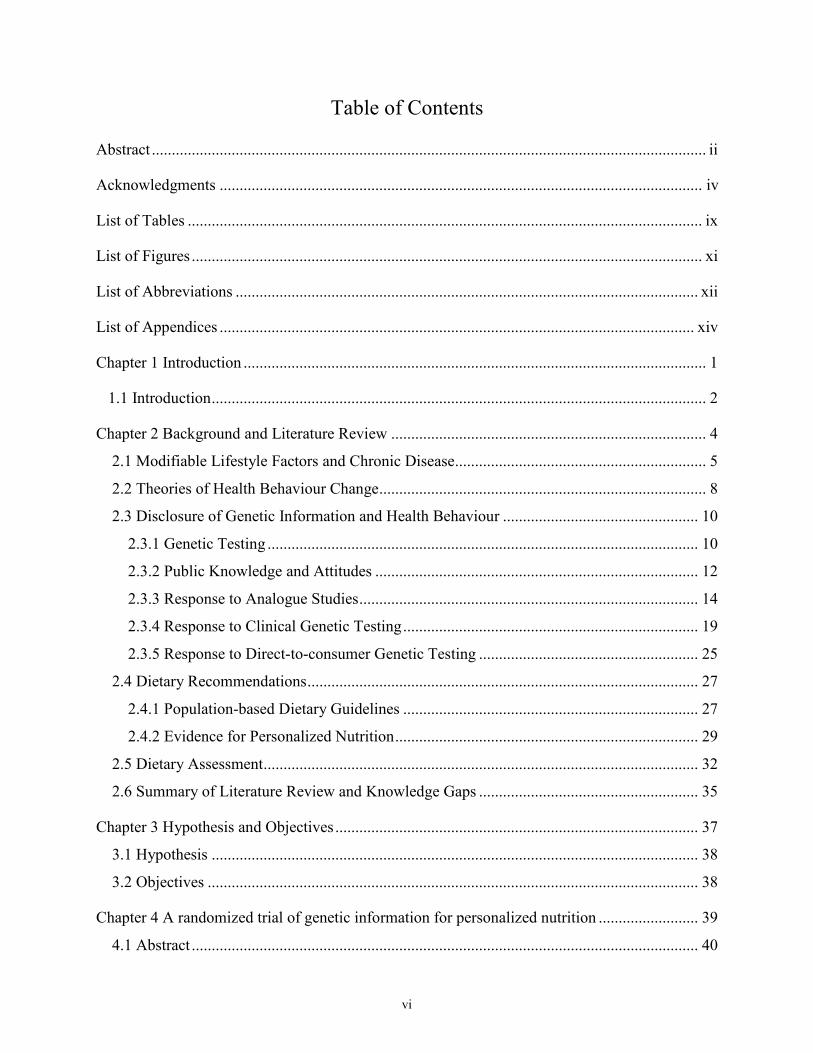
Table of Contents
Abstract ........................................................................................................................................... ii
Acknowledgments ......................................................................................................................... iv
List of Tables ................................................................................................................................. ix
List of Figures ................................................................................................................................ xi
List of Abbreviations .................................................................................................................... xii
List of Appendices ....................................................................................................................... xiv
Chapter 1 Introduction .................................................................................................................... 1
1.1 Introduction ............................................................................................................................ 2
Chapter 2 Background and Literature Review ............................................................................... 4
2.1 Modifiable Lifestyle Factors and Chronic Disease ............................................................... 5
2.2 Theories of Health Behaviour Change .................................................................................. 8
2.3 Disclosure of Genetic Information and Health Behaviour ................................................. 10
2.3.1 Genetic Testing ............................................................................................................ 10
2.3.2 Public Knowledge and Attitudes ................................................................................. 12
2.3.3 Response to Analogue Studies ..................................................................................... 14
2.3.4 Response to Clinical Genetic Testing .......................................................................... 19
2.3.5 Response to Direct-to-consumer Genetic Testing ....................................................... 25
2.4 Dietary Recommendations .................................................................................................. 27
2.4.1 Population-based Dietary Guidelines .......................................................................... 27
2.4.2 Evidence for Personalized Nutrition ............................................................................ 29
2.5 Dietary Assessment ............................................................................................................. 32
2.6 Summary of Literature Review and Knowledge Gaps ....................................................... 35
Chapter 3 Hypothesis and Objectives ........................................................................................... 37
3.1 Hypothesis .......................................................................................................................... 38
3.2 Objectives ........................................................................................................................... 38
Chapter 4 A randomized trial of genetic information for personalized nutrition ......................... 39
4.1 Abstract ............................................................................................................................... 40
vii
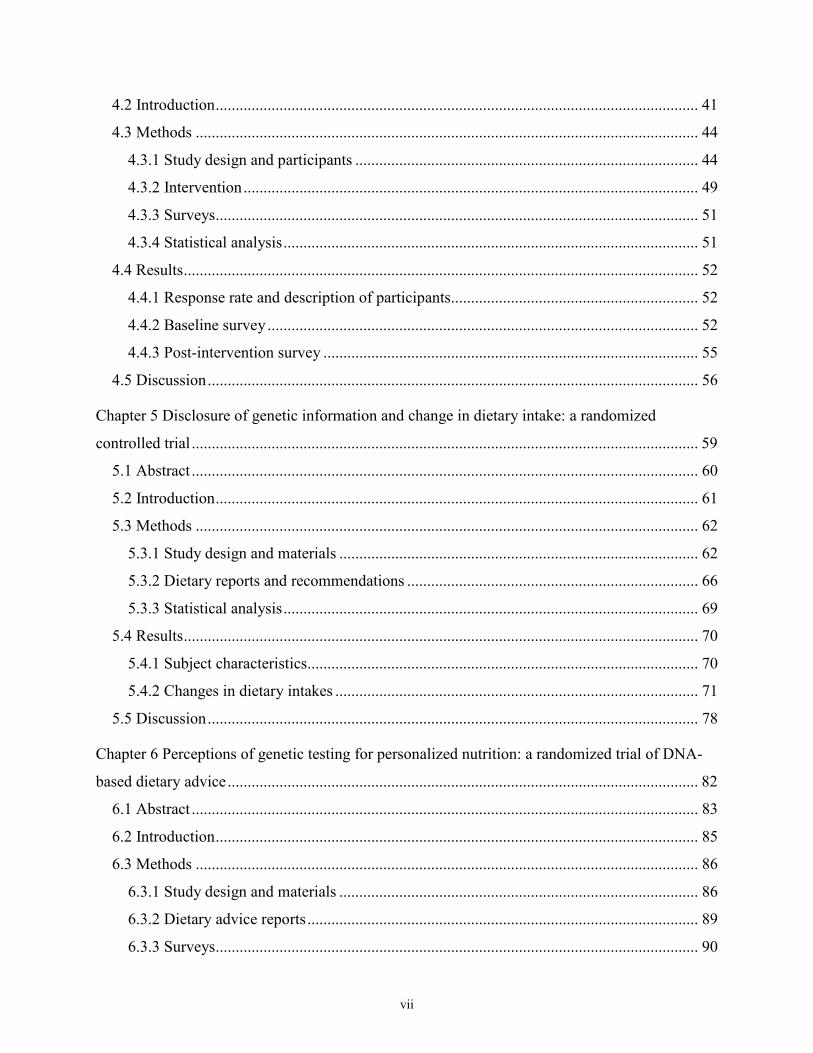
4.2 Introduction ......................................................................................................................... 41
4.3 Methods .............................................................................................................................. 44
4.3.1 Study design and participants ...................................................................................... 44
4.3.2 Intervention .................................................................................................................. 49
4.3.3 Surveys ......................................................................................................................... 51
4.3.4 Statistical analysis ........................................................................................................ 51
4.4 Results ................................................................................................................................. 52
4.4.1 Response rate and description of participants .............................................................. 52
4.4.2 Baseline survey ............................................................................................................ 52
4.4.3 Post-intervention survey .............................................................................................. 55
4.5 Discussion ........................................................................................................................... 56
Chapter 5 Disclosure of genetic information and change in dietary intake: a randomized
controlled trial ............................................................................................................................... 59
5.1 Abstract ............................................................................................................................... 60
5.2 Introduction ......................................................................................................................... 61
5.3 Methods .............................................................................................................................. 62
5.3.1 Study design and materials .......................................................................................... 62
5.3.2 Dietary reports and recommendations ......................................................................... 66
5.3.3 Statistical analysis ........................................................................................................ 69
5.4 Results ................................................................................................................................. 70
5.4.1 Subject characteristics .................................................................................................. 70
5.4.2 Changes in dietary intakes ........................................................................................... 71
5.5 Discussion ........................................................................................................................... 78
Chapter 6 Perceptions of genetic testing for personalized nutrition: a randomized trial of DNA-
based dietary advice ...................................................................................................................... 82
6.1 Abstract ............................................................................................................................... 83
6.2 Introduction ......................................................................................................................... 85
6.3 Methods .............................................................................................................................. 86
6.3.1 Study design and materials .......................................................................................... 86
6.3.2 Dietary advice reports .................................................................................................. 89
6.3.3 Surveys ......................................................................................................................... 90
viii
6.3.4 Statistical analysis ........................................................................................................ 91
6.4 Results ................................................................................................................................. 92
6.4.1 Subject characteristics .................................................................................................. 92
6.4.2 Opinions of sources for personal genetic information and personalized ..................... 93
nutrition advice ..................................................................................................................... 93
6.4.3 Changes in perceptions of personalized nutrition and genetic testing ......................... 94
6.4.4 Sharing of information and utility of personalized nutrition ....................................... 97
6.5 Discussion ........................................................................................................................... 97
Chapter 7 Overall Discussion ..................................................................................................... 102
7.1 Summary ........................................................................................................................... 103
7.2 Other Considerations ........................................................................................................ 106
7.3 Limitations ........................................................................................................................ 110
7.3.1 Comparison of Nutrient Intake Estimates to Population Data ................................... 117
7.4 Future Directions .............................................................................................................. 120
7.5 Implications ...................................................................................................................... 125
References ................................................................................................................................... 127

ix
List of Tables
Table 2.1. Clinical trials investigating the behavioural impact of disclosing genetic information……………………………………………………………………………………….36
Table 4.1. Subject characteristics...……………………………………………………………....47
Table 4.2. Number of subjects excluded using ideal exclusion cut-off points………………..…48
Table 4.3. Number of subjects excluded using actual exclusion cut-off points………………....49
Table 4.4. Sample of dietary advice for caffeine…………………...……………………………50
Table 4.5. Awareness of DTC genetic tests and nutrigenomics………………………...……….53
Table 4.6. Attitudes toward nutrigenomics and genetic testing………………………………….54
Table 5.1. Prevalence of risk alleles and associated risk………………………………………...68
Table 5.2. Subject characteristics………………………………………………………………...71
Table 5.3. Changes in dietary intakes after 3-months and 12-months, unadjusted results.…...…74
Table 5.4. Changes in dietary intakes after 3-months and 12-months, adjusted for ethnicity………………………………………………………………………………..….......…75
Table 5.5. Changes in dietary intakes after 3-months and 12-months, adjusted for ethnicity and energy intake…………………………………………………………………………..….......…76
Table 5.6. Changes in sodium advice food items, adjusted for ethnicity and energy intake ……77
Table 6.1. Prevalence of risk alleles in intervention group and associated risk…………………90
Table 6.2. Subject characteristics………………………………………………………………..92

x
Table 6.3. Survey responses at baseline, 3-months and 12-months……………………………..95
Table 6.4. Changes in perceptions of personalized nutrition and genetic testing………………..96
Table 7.1. Correlation coefficients between the Toronto-modified FFQ and 3-day food record…………………………………………………………………………………………...112
xi
List of Figures
Figure 4.1. Consolidated standards of reporting trials (CONSORT) diagram and subject
flow………………………………………………………………………………………………46
Figure 4.2. Comparison of “agree” between intervention and control group..…….………….....56
Figure 5.1. CONSORT diagram….……………………………………………………………...65
Figure 6.1. CONSORT diagram...…………..…………………………………………………...88
Figure 7.1. The Precaution Adoption Process…...……………………………………………..107
Figure 7.2. Media archives related to sodium………………………………………..………...109
xii
List of Abbreviations
ACE - Angiotensin-converting enzyme FFQ - Food frequency questionnaire
AD - Alzheimer’s disease FH - Familial hypercholesterolemia
AI - Adequate intake FTO - Fat mass and obesity associated
ANCOVA - Analysis of covariance GSTM1 - Glutathione S-transferase Mu 1
APOB - Apolipoprotein B GSTT1 - Glutathione S-transferase Theta 1
APOE - Apolipoprotein E GWAS - Genome-wide association study
BMI - Body mass index HOMA-IR - Homeostasis model assessment of insulin resistance
CCHS - Canadian Community Health Survey HOMA-B - Homeostasis model assessment of beta-call dysfunction
CYP1A2 - Cytochrome P450 1A2 IOM - Institute of Medicine DRI - Dietary Reference Intakes LDL - Low density lipoprotein cholesterol
DTC - Direct-to-consumer LDLR - Low density lipoprotein receptor
EAR - Estimated Average Requirement MI - Myocardial infarction
FBG - Fasting blood glucose NCD - Noncommunicable diseases
FDA - Food and Drug Administration NOD2 – Nucleotide-binding oligomerization domain-containing protein 2
xiii
PAPM - Precaution Adoption Process Model WC - Waist circumference PGT - Personal genome testing WHO - World Health Organization RDA - Recommended Dietary Allowance RD - Registered Dietitian RFLP - Restriction fragment length polymorphism
RNI - Recommended Nutrient Intakes
RT-PCR - Real-time polymerase chain reaction
SBP - Systolic blood pressure
SIDE - Software for intake distribution estimation
SNP - Single nucleotide polymorphism
TAS1R2 - Taste receptor type 1 member 2
TC - Total cholesterol
TG - Triglycerides
TNH - Toronto Nutrigenomics and Health Study
UL - Tolerable upper intake level
USDA - United States Department of Agriculture
xiv
List of Appendices
Appendix………………………………………………………………………………………..150
Sample FFQ Pages……………………………………………………………………...151
Dietary Advice for Control Group……………………………………………………...154
Dietary Advice for Intervention Group Non-Risk..…………………………………….156
Dietary Advice for Intervention Group Risk..…………………………………….……160

1
Chapter 1
Introduction
2
1.1 Introduction Recent advances in genomics technologies have made the acquisition of personalized genetic
information easily obtainable. Consumer genetic tests claim to provide consumers with
information about their genetic ancestry, ability to metabolize nutrients and drugs, and risk for
developing diseases (Janssens and van Duijn, 2010). One class of genetic tests offer personalized
dietary advice based on one’s DNA to improve health (Sterling, 2008). These tests are
commercially available through the internet and are largely unregulated, though significant
measures are being taken to regulate this emerging market in certain jurisdictions (McGuire et
al., 2010). In some cases the tests are sold direct-to-consumer (DTC), without involvement of
healthcare professionals. DTC genetic testing for disease susceptibility remains controversial,
with opponents arguing that the tests possess limited value due to their questionable clinical
validity and utility (Burke, 2009; Caulfield, 2010; Eng and Sharp, 2010). Critics note that
predicted risks will continue to change as new genetic variants are discovered, and thus any risk
estimates for disease based on currently known common variants are premature (Janssens et al.,
2011; Mihaescu et al., 2009). Moreover, the corresponding advice with test results is not
genuinely personalized since the lifestyle recommendations are generally the same, regardless of
genotype.
Despite these criticisms, proponents of DTC genetic tests argue that there is public
interest in genomics and that individuals should have access to their own genetic information
(Bloss et al., 2011a; Caulfield, 2010). In addition, some propose that direct access to genetic
information may motivate consumers to adopt lifestyle behavioural changes aimed at reducing
risk of disease development (Bloss et al., 2011b; McBride et al., 2010). Therefore, a potential
outcome of these genetic tests is a decrease in the prevalence of chronic diseases, such as type 2

3
diabetes and cardiovascular disease, due to an increase in preventative strategies through lifestyle
modification. However, much debate exists about the influence of genetic information on an
individual’s behaviour, and little is known about the influence on dietary behaviour in particular.

4
Chapter 2
Background and Literature Review
5
2.1 Modifiable Lifestyle Factors and Chronic Disease
Chronic diseases such as cardiovascular diseases and diabetes are becoming increasingly
prevalent around the world. In a 2011 World Health Organization (WHO) report on
noncommunicable diseases (NCD) in 193 countries, cardiovascular diseases and diabetes
accounted for 51% of deaths globally from NCD (WHO, 2011). In Canada, cardiovascular
diseases and diabetes were responsible for 36% of total deaths, regardless of age (WHO, 2011),
and 58% of annual healthcare spending (equivalent to $68 billion per year) was directed to
chronic diseases in 2010 (Public Health Agency of Canada, 2011). Beyond these direct health
care costs, productivity and indirect income losses attributable to chronic diseases were
estimated at $122 billion (Public Health Agency of Canada, 2011). Productivity losses are
expected to rise, since the onset of chronic diseases is increasingly occurring at younger ages
(Yates et al., 2012). This is due, in part, to the rising rates of obesity in North America. A recent
analysis in Canada reported that adult obesity rates have tripled (from 6.1% to 18.5%) between
1985 and 2011 (Twells et al., 2014).
The WHO has identified three lifestyle factors as the most common modifiable risk
factors for chronic diseases: an unhealthy diet, physical inactivity and tobacco use (Strong et al.,
2006). Non-modifiable risk factors include age and genetics (WHO, 2005). These three lifestyle
factors, along with age and genetics, influence intermediate risk factors of chronic disease, which
include hypertension, dysglycemia, dyslipidemia, and overweight or obesity (WHO, 2005). As a
result, modifying an individual’s or population’s health behaviours related to diet, physical
activity and tobacco use can have a significant impact on chronic disease rates globally (Willett
et al., 2006). While all three lifestyle factors are implicated in chronic disease development, the
individual relative importance of each may depend on whether the goal is to achieve improved
6
health at an individual or population level. Indeed, in 1985 the epidemiologist Geoffrey Rose
noted that individual and population approaches to health are fundamentally different, since they
target different factors that influence health (Rose, 1985). While the “high-risk” individual
approach identifies “causes of cases” of an outcome, the population approach identifies “causes
of incidence” (Rose, 1985). Rose proposed that a population approach to health intervention
could prevent more cases of a disease than an approach that targets high-risk individuals,
although he acknowledged that the two are generally not in competition (Rose, 1985).
In this view, several population-based strategies have been or are being developed to
target diet, physical activity and tobacco use to reduce the prevalence of chronic diseases. One of
the most effective strategies to date is government taxation on tobacco products (Chaloupka et
al., 2011). Tobacco taxes have reduced overall tobacco use (Becker et al., 1994; Franz, 2008;
Siahpush et al., 2009; Townsend et al., 1994), smoking initiation rates among youth (Cawley et
al., 2004; Lewit et al., 1981) and the total number of cigarettes consumed by persistent users
(Jimenez-Martin et al., 1998). The success of this initiative has led some to propose taxing
unhealthy food products as a way to target overweight and obesity in the population (Pomeranz,
2014). However, those opposed to that proposal point out that tobacco taxes were only one
contributor to a decrease in smoking rates, and factors such as indoor smoking bans (Zablocki et
al., 2014) and marketing limits (Pierce, 2007) also played an important role. Menu labeling,
where nutrient values for calories, fat and/or sodium are clearly displayed on restaurant menus, is
another population-based strategy that aims to influence consumer food choices (Wootan, 2007).
While menu labeling has been shown to impact consumer behaviour (Gittelsohn et al., 2013), its
effectiveness is partly mediated by the availability of healthier options that restaurants provide.
To target physical activity, the Canadian government implemented the Children’s Fitness Tax
7
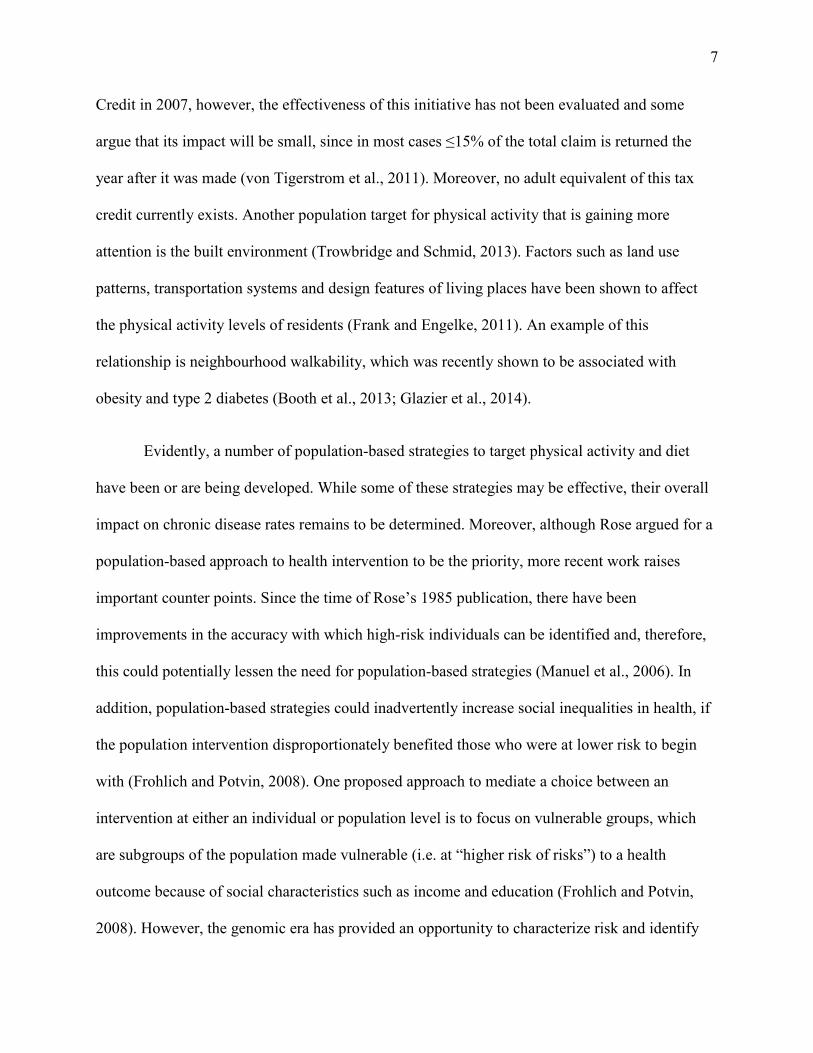
Credit in 2007, however, the effectiveness of this initiative has not been evaluated and some
argue that its impact will be small, since in most cases ≤15% of the total claim is returned the
year after it was made (von Tigerstrom et al., 2011). Moreover, no adult equivalent of this tax
credit currently exists. Another population target for physical activity that is gaining more
attention is the built environment (Trowbridge and Schmid, 2013). Factors such as land use
patterns, transportation systems and design features of living places have been shown to affect
the physical activity levels of residents (Frank and Engelke, 2011). An example of this
relationship is neighbourhood walkability, which was recently shown to be associated with
obesity and type 2 diabetes (Booth et al., 2013; Glazier et al., 2014).
Evidently, a number of population-based strategies to target physical activity and diet
have been or are being developed. While some of these strategies may be effective, their overall
impact on chronic disease rates remains to be determined. Moreover, although Rose argued for a
population-based approach to health intervention to be the priority, more recent work raises
important counter points. Since the time of Rose’s 1985 publication, there have been
improvements in the accuracy with which high-risk individuals can be identified and, therefore,
this could potentially lessen the need for population-based strategies (Manuel et al., 2006). In
addition, population-based strategies could inadvertently increase social inequalities in health, if
the population intervention disproportionately benefited those who were at lower risk to begin
with (Frohlich and Potvin, 2008). One proposed approach to mediate a choice between an
intervention at either an individual or population level is to focus on vulnerable groups, which
are subgroups of the population made vulnerable (i.e. at “higher risk of risks”) to a health
outcome because of social characteristics such as income and education (Frohlich and Potvin,
2008). However, the genomic era has provided an opportunity to characterize risk and identify
8
vulnerable groups based on genetic variation (Burton et al., 2012). Stratifying a population by
genetic risk and determining the most appropriate intervention for the different levels of risk may
be more effective and less costly than applying a single intervention to an entire population. In
particular, nutrigenomics, the study of the relationship between genes and diet, provides a unique
opportunity to tailor dietary recommendations to an individual’s genotype and this level of
personalization may motivate positive dietary behaviour changes to a greater extent than general
dietary recommendations.
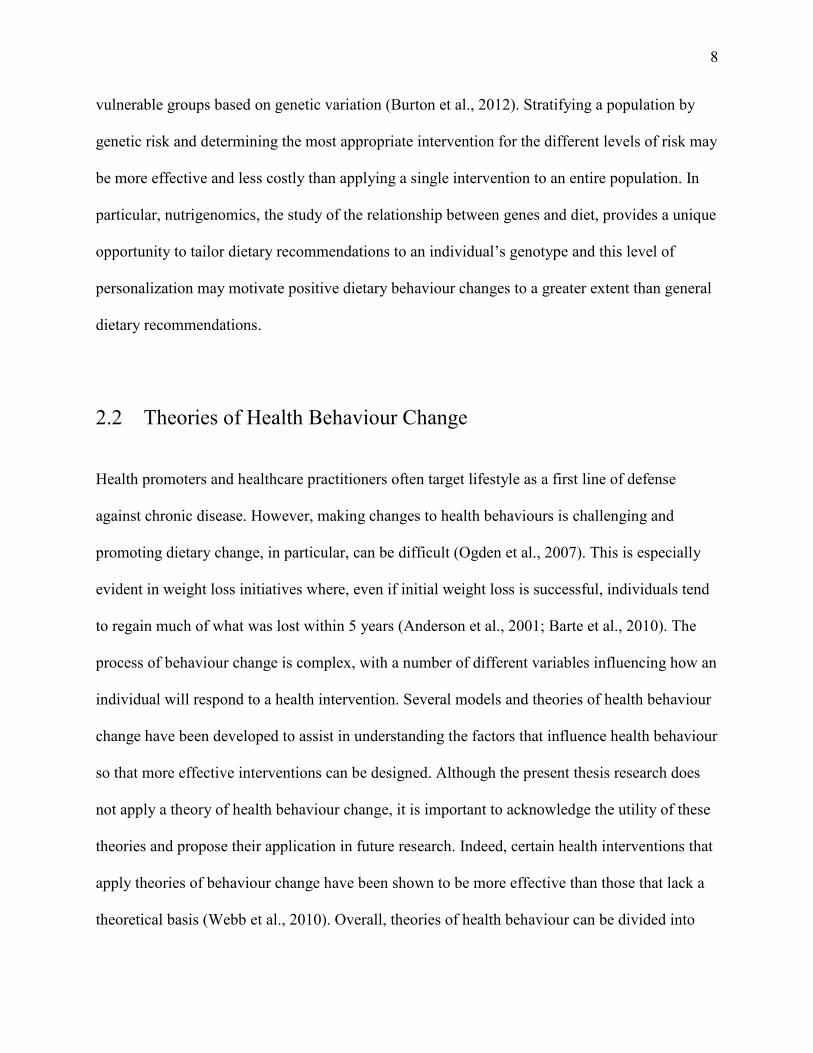
2.2 Theories of Health Behaviour Change
Health promoters and healthcare practitioners often target lifestyle as a first line of defense
against chronic disease. However, making changes to health behaviours is challenging and
promoting dietary change, in particular, can be difficult (Ogden et al., 2007). This is especially
evident in weight loss initiatives where, even if initial weight loss is successful, individuals tend
to regain much of what was lost within 5 years (Anderson et al., 2001; Barte et al., 2010). The
process of behaviour change is complex, with a number of different variables influencing how an
individual will respond to a health intervention. Several models and theories of health behaviour
change have been developed to assist in understanding the factors that influence health behaviour
so that more effective interventions can be designed. Although the present thesis research does
not apply a theory of health behaviour change, it is important to acknowledge the utility of these
theories and propose their application in future research. Indeed, certain health interventions that
apply theories of behaviour change have been shown to be more effective than those that lack a
theoretical basis (Webb et al., 2010). Overall, theories of health behaviour can be divided into
9
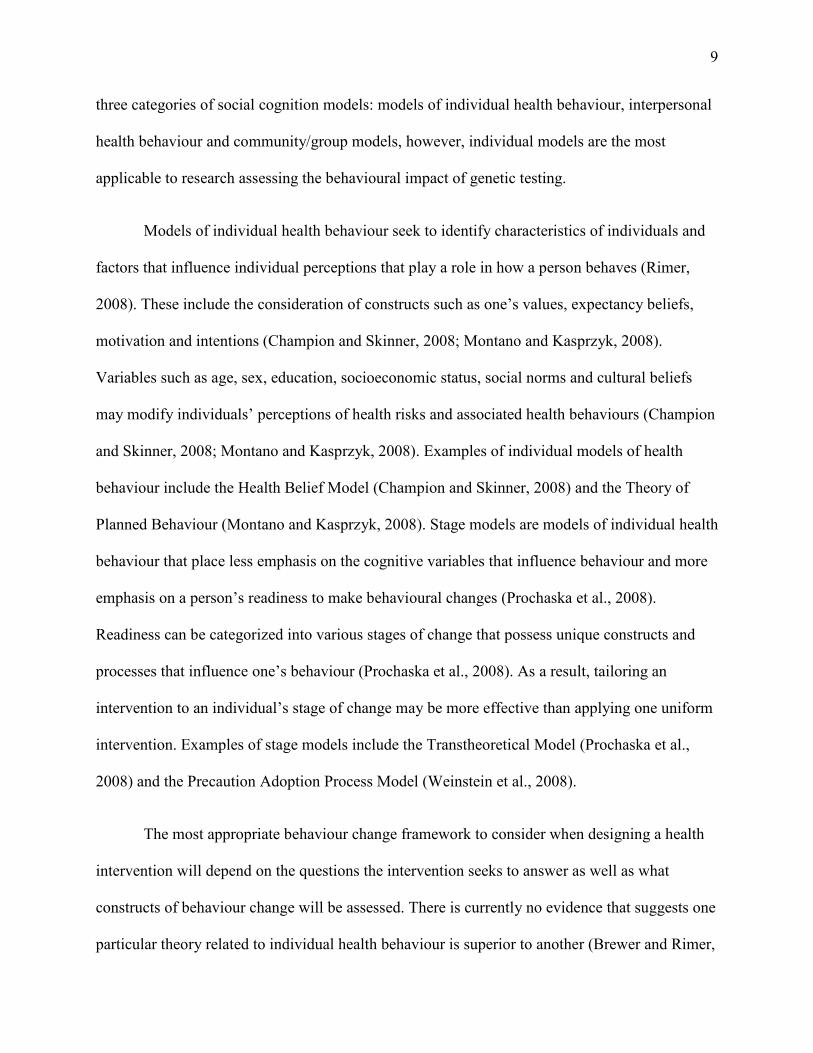
three categories of social cognition models: models of individual health behaviour, interpersonal
health behaviour and community/group models, however, individual models are the most
applicable to research assessing the behavioural impact of genetic testing.
Models of individual health behaviour seek to identify characteristics of individuals and
factors that influence individual perceptions that play a role in how a person behaves (Rimer,
2008). These include the consideration of constructs such as one’s values, expectancy beliefs,
motivation and intentions (Champion and Skinner, 2008; Montano and Kasprzyk, 2008).
Variables such as age, sex, education, socioeconomic status, social norms and cultural beliefs
may modify individuals’ perceptions of health risks and associated health behaviours (Champion
and Skinner, 2008; Montano and Kasprzyk, 2008). Examples of individual models of health
behaviour include the Health Belief Model (Champion and Skinner, 2008) and the Theory of
Planned Behaviour (Montano and Kasprzyk, 2008). Stage models are models of individual health
behaviour that place less emphasis on the cognitive variables that influence behaviour and more
emphasis on a person’s readiness to make behavioural changes (Prochaska et al., 2008).
Readiness can be categorized into various stages of change that possess unique constructs and
processes that influence one’s behaviour (Prochaska et al., 2008). As a result, tailoring an
intervention to an individual’s stage of change may be more effective than applying one uniform
intervention. Examples of stage models include the Transtheoretical Model (Prochaska et al.,
2008) and the Precaution Adoption Process Model (Weinstein et al., 2008).
The most appropriate behaviour change framework to consider when designing a health
intervention will depend on the questions the intervention seeks to answer as well as what
constructs of behaviour change will be assessed. There is currently no evidence that suggests one
particular theory related to individual health behaviour is superior to another (Brewer and Rimer,
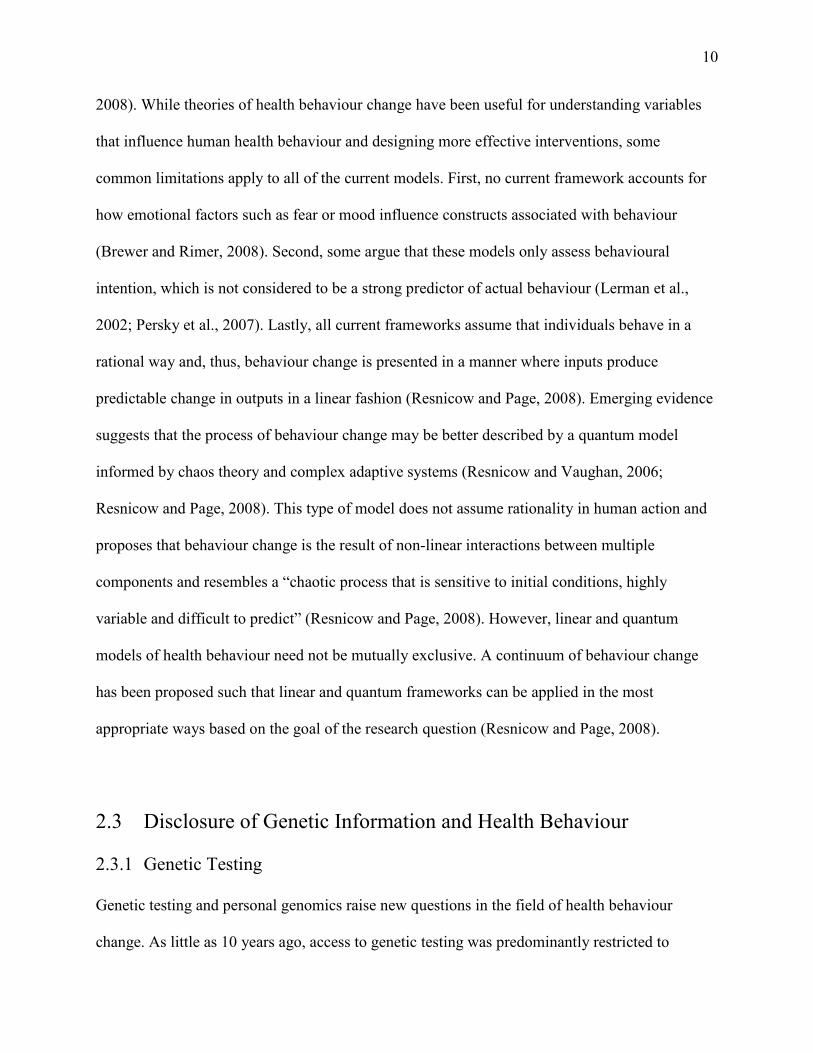
10
2008). While theories of health behaviour change have been useful for understanding variables
that influence human health behaviour and designing more effective interventions, some
common limitations apply to all of the current models. First, no current framework accounts for
how emotional factors such as fear or mood influence constructs associated with behaviour
(Brewer and Rimer, 2008). Second, some argue that these models only assess behavioural
intention, which is not considered to be a strong predictor of actual behaviour (Lerman et al.,
2002; Persky et al., 2007). Lastly, all current frameworks assume that individuals behave in a
rational way and, thus, behaviour change is presented in a manner where inputs produce
predictable change in outputs in a linear fashion (Resnicow and Page, 2008). Emerging evidence
suggests that the process of behaviour change may be better described by a quantum model
informed by chaos theory and complex adaptive systems (Resnicow and Vaughan, 2006;
Resnicow and Page, 2008). This type of model does not assume rationality in human action and
proposes that behaviour change is the result of non-linear interactions between multiple
components and resembles a “chaotic process that is sensitive to initial conditions, highly
variable and difficult to predict” (Resnicow and Page, 2008). However, linear and quantum
models of health behaviour need not be mutually exclusive. A continuum of behaviour change
has been proposed such that linear and quantum frameworks can be applied in the most
appropriate ways based on the goal of the research question (Resnicow and Page, 2008).
2.3 Disclosure of Genetic Information and Health Behaviour
2.3.1 Genetic Testing
Genetic testing and personal genomics raise new questions in the field of health behaviour
change. As little as 10 years ago, access to genetic testing was predominantly restricted to
11
clinical settings and utilized under select conditions, such as to determine carrier status for
inherited genetic disorders or for prenatal screening. The rise of the consumer genetic testing
industry since 2007 has rapidly changed access to genomic technologies. Individuals can now
purchase genetic tests over the Internet for relatively low costs that claim to provide personalized
information on disease susceptibility and nutrient and drug response. Some of these tests are
available directly to consumer (DTC), without need for healthcare professional involvement,
while others require that a physician order the test. The DTC genetic testing industry has been
heavily scrutinized (Lancet Oncology, 2014). In fact, in late 2013 the Food and Drug
Administration (FDA) in the United States sent a warning letter to one of the largest DTC
genetic testing companies, 23andMe, ordering them to halt the sale and marketing of their health-
related genetic test (Food and Drug Administration, 2013). The federal body pointed out that the
company had not provided any evidence of the clinical validity or utility of their genetic test and
stated concerns that the information could cause harm to consumers. This event has implications
for the entire DTC genetic testing industry and has been received with mixed response. Some
believe the FDA was warranted in their action (Annas and Elias, 2014) while others feel the
approach was overly cautious without sufficient reasoning (Green and Farahany, 2014). Indeed,
a recent study reported benefits of direct access to BRCA genetic test information (Francke et al.,
2013). Women who discovered they were carriers of the BRCA mutation from a DTC genetic test
sought out medical advice and some chose to undergo risk-reducing procedures after confirming
the DTC test result. Moreover, men who discovered they were carriers understood that their
result had relevance for their female relatives and shared this information with their family
members. This led to medical screening of these participants’ female relatives and additional
BRCA carriers were identified. Direct access to BRCA mutation testing did not result in
12
emotional distress or inappropriate actions among either carriers or non-carriers of the mutation
(Francke et al., 2013), although it is important to consider that DTC genetic test consumers may
not be representative of the general population.
While the future of DTC genetic testing remains unclear, a recent trend in the industry
has been for companies that began with a DTC marketing model to shift to offering their services
through physicians (Allison, 2012). While in some cases this shift occurred because certain states
prohibited DTC genetic testing, more broadly it is due to the fact that the DTC method attracted
a select group of individuals and there was a great deal of competition between companies to
possess market share (Allison, 2012). Essentially, the change has been an attempt to attract a new
customer base by offering tests through physicians (Allison, 2012). With or without healthcare
professional involvement, the impact of disclosing health-related personal genomic information
on health behaviours is of great interest to researchers and health promoters (McBride et al.,
2010) and in order to properly regulate the consumer genetic testing industry, an understanding
of the public’s perceptions of and demands for this technology, in addition to evidence on how
individuals respond to disclosure of health-related genetic information, is needed.
2.3.2 Public Knowledge and Attitudes
For appropriate recommendations and regulations regarding consumer personal genetic tests to
be made, public knowledge and opinions of these technologies must be well understood. Surveys
of the general public demonstrate substantial public interest in personal genomics. In the UK,
4,050 adult volunteers were surveyed on their interest in Internet-based personal genome testing
(PGT) (Cherkas et al., 2010). While only 13% of respondents were aware of PGT, after reading a
13
summary about PGT half of the participants were interested in taking a test if it was free
(Cherkas et al., 2010). Nearly all the respondents who would take a test reported that they would
do so to encourage them to adopt a healthier lifestyle if found to be at high genetic risk of a
disease (Cherkas et al., 2010). An Internet-based survey of almost 1,500 randomly sampled
Americans reported that 88% would be willing to pay for a genetic test that provided disease
susceptibility information (Neumann et al., 2010). In line with these findings, a Canadian survey
reported that 51% of nearly 1,200 respondents would pay for genetic testing that provides
information on serious diseases (Ries et al., 2010). The interest in genomics in Canada is further
illustrated by the recent launch of the Canadian Personal Genome Project and the large number
of volunteers (~350) who offered to participate within a number of days of the project’s
announcement (Abraham, 2012). Reasons for seeking out genetic testing have been reported and
include curiosity, identity-seeking, disease-risk testing that complements health care and
searching for a better lifestyle (Su, 2013).
Two studies have assessed public interest in nutrigenomics testing in particular (Morin,
2009; Stewart-Knox et al., 2009). In a sample of European consumers (n=5,967), 66% reported
they would be willing to undergo nutrigenomics testing and 27% would follow a personalized
diet (Stewart-Knox et al., 2009). Of note, individuals who were aware that they had health
problems associated with the metabolic syndrome were more favourable toward nutrigenomic
intervention (Stewart-Knox et al., 2009). In addition, focus groups were conducted in Canadian
cities in 2007 to examine Canadian consumers’ and health care professionals’ (HCPs) knowledge
of and attitudes toward nutritional genomics (Morin, 2009). Most consumers were unfamiliar
with the term “nutrigenomics” and did not relate the term “personalized nutrition” to an
individual’s genetic profile (Morin, 2009). Roughly half of HCPs were aware of the term
14
“nutrigenomics”, and a few related “personalized nutrition” to an individual’s genetic profile
(Morin, 2009). After the moderator offered an explanation of nutrigenomics, consumers were
optimistic that a tailored diet could help reduce the risk of disease, while HCPs expressed more
skepticism (Morin, 2009). All participants were shown a mock website selling nutrigenomics test
kits and health questionnaires, ranging from $275 to $2400. Some consumers held a favourable
view of such companies, though there was general discomfort with purchasing a test online
(Morin, 2009). A preference for in-person testing at a clinic, in the presence of a HCP, was
evident (Morin, 2009). Both consumers and HCPs agreed that more public education about
nutrigenomics is necessary and that regulatory oversight should ensure consumer protection
(Morin, 2009).
Results from studies assessing public perceptions of genetic testing demonstrate a great
deal of interest in personal genetic testing for health-related purposes, but behavioural effects of
the technology must also be elucidated. Indeed, a number of studies have begun to explore the
behavioural effects of genetic information in analogue settings, clinical settings, and from DTC
genetic tests.
2.3.3 Response to Analogue Studies
Analogue studies, sometimes referred to as vignette studies, involve researchers presenting
hypothetical scenarios to study participants and assessing participant reactions to and perceptions
of the scenarios (Persky et al., 2007). These studies possess a number of advantages including
cost-effective and efficient production of study materials, ability to administer materials with
little special preparation and ability to present scenarios in a standardized way (Persky et al.,
15
2007). To test responses to disclosure of health-related genetic information, analogue studies
generally request that participants imagine they undergo genetic testing for assessment of risk of
a particular health outcome. To date, nine analogue studies examining responses to hypothetical
genetic information scenarios have been published (Conradt et al., 2009; Frosch et al., 2005;
Hicken and Tucker, 2002; Meisel et al., 2012; Rief et al., 2007; Sanderson and Michie, 2007;
Sanderson et al., 2010; Wright et al., 2006; Wright et al., 2008). Hicken et al. (2002) assessed
self-reported intentions to engage in behavioural strategies that were recommended to reduce the
risk of developing a fictitious genetically determined disorder. Participants were randomized to
one of three groups: positive genetic test result, negative test result, or positive family history
with no genetic test. Participants were not informed that the disorder was fictitious until the
completion of the study, and those randomized to a genetic test group were required to provide a
saliva sample and were told the sample would be analyzed for assessment of genetic risk. The
authors reported that the positive test result group and the positive family history group
expressed greater intent to follow the recommended behavioural strategies (reducing dietary fat
and increasing soy intake) than the negative test result group, but there was no difference in
intent between the positive test result group and the family history group, indicating that genetic
risk information did not provide stronger behavioural motivation than family history (Hicken and
Tucker, 2002).
Five analogue studies examined participant responses to genetic testing for weight
gain/obesity (Conradt et al., 2009; Frosch et al., 2005; Meisel et al., 2012; Rief et al., 2007;
Sanderson et al., 2010). Frosch et al. (2005) conducted a 2x2 factorial design randomized trial
that assessed behavioural intentions and perceived behavioural control to eat a healthy diet after
subjects were provided with either genetic risk (increased vs. average) or hormone risk
16
(increased vs. average) information for obesity. Subjects who received information indicating
increased obesity risk expressed greater intentions to eat a healthy diet, whether the information
was genetic or hormone. Those who received information indicating greater genetic risk
expressed a lower sense of behavioural control than those who received information indicating
average genetic risk (Frosch et al., 2005).
Sanderson et al. (2010) compared perceived risk of obesity and intention to eat healthily
among participants who were randomized to receive a genetic test result for obesity that
indicated high eating-based risk or high metabolism-based risk, an enzyme test result indicating
high eating-based risk or high metabolism-based risk, or no risk information but standard advice
to eat a healthy diet. Those who received high risk information from either a genetic or enzyme
test reported greater perceived risk of obesity and a greater intent to eat healthily compared to the
no risk information group, although perceived risk was higher among the genetic information
group compared to the enzyme information group (Sanderson et al., 2010).
Meisel et al. (2012) examined responses to FTO genotype information indicating higher
or average risk for obesity among two separate groups: middle-aged overweight or obese adults
and normal weight students (mean age of 25 years). The A allele of rs9939609 in FTO has been
associated with increased body mass index and a predisposition to obesity in both children and
adults in an additive manner (Frayling et al., 2007), although a recent study suggests that the
effect of FTO may be mediated by a nearby gene, IRX3 (Smemo et al., 2014). Among both the
student and older adult group, a higher risk result was associated with greater motivation to
change diet or exercise behaviour compared to the average risk result. The student group
expressed a slight increase in fatalism about weight gain in response to a high risk result, while
the older adult group did not (Meisel et al., 2012).
17
Conradt et al. (2009) found that incorporating genetic information about obesity into a
weight loss consultation led to more realistic weight loss goals and greater satisfaction with a 5%
weight loss. Additionally, subjects with familial predisposition to obesity reported less self-
blame about eating after receiving consultations with genetic information (Conradt et al., 2009).
A study by Rief et al. (2007) also found an improvement in negative mood in obese subjects with
a family history of obesity when consultations included genetic information. This is important as
negative thoughts and feelings about current weight have been shown to predict future weight
gain (Burk-Braxton, 1996).
The remaining three analogue studies investigated the impact of health-related genetic
information on smoking cessation (Sanderson and Michie, 2007; Wright et al., 2006; Wright et
al., 2008). Wright et al. (2006) assessed intention to quit smoking and intention to attend an
information session about quitting after providing participants with risk of developing heart
disease due to genetic susceptibility to the adverse effects of smoking. Participants were
randomized to receive a positive genetic test result, negative genetic test result, or no genetic
testing but standard information about the risk of heart disease among smokers. Those who
received a positive genetic result expressed greater intention to quit smoking and attend an
information session about quitting compared to both the negative genetic result group and the no
genetic test group (Wright et al., 2006). Moreover, there was no indication that receiving a
negative genetic test result reduced motivation to quit smoking when responses were compared
to the no test group (Wright et al., 2006). Sanderson et al. (2007) also examined the effect of
providing heart disease genetic risk information on smoking cessation. Participants were
randomized to receive either a low or high risk genetic test result, or a high risk oxidative stress
test result. The group that received a high risk genetic test result for heart disease expressed a
18
greater intention to quit smoking compared to both the high risk oxidative stress group and low
risk genetic test group, and also expressed greater perceived control over an ability to quit
smoking compared to the low risk genetic test group (Sanderson and Michie, 2007). Finally,
Wright et al. (2008) examined the impact of genetic information on motivation to quit smoking,
but with genetic information related to Crohn’s disease risk. Smokers who have a sibling with
Crohn’s disease and who carry at least two out of the three mutations in NOD2 that have been
shown to increase risk of Crohn’s disease (Pascoe et al., 2007) have a 35% risk of developing the
disease compared with a 5% risk among smokers who do not carry a mutation (Lewis et al.,
2007). Wright et al. also assessed whether the nature, magnitude or display of risk information
had differential effects on perceived susceptibility to Crohn’s disease and motivation to quit
smoking. Participants were randomized to one of 18 groups in a 3 (nature of information: genetic
test mutation positive group, genetic test mutation negative group or family history only group) x
3 (risk magnitude: 3%, 5%, 50%) x 2 (display: grouped or dispersed icons) design (Wright et al.,
2008). Perceived susceptibility to Crohn’s disease was only affected by risk magnitude in the
family history group (with no difference between genetic test groups). The nature of risk
information had no impact on intentions to quit smoking, while risk magnitude did (Wright et al.,
2008). Those who were informed they were at 50% greater risk of the disease reported a greater
intention to quit smoking compared to the 3% risk group (Wright et al., 2008).
Results from analogue studies illustrate that providing genetic risk information does have
an impact on health behavioural intentions, but genetic information does not consistently
produce greater effects than non-genetic forms of health information. However, analogue studies
assess behavioural intention, which may not reflect actual behaviour (Lerman et al., 2002; Persky
et al., 2007). Individuals may have difficulty predicting their own behaviour when scenarios are
19
hypothetical versus real (Vallone et al., 1990). As a result, studies that truly disclose genetic
information and assess health behaviour change provide stronger evidence of the utility of
genetic testing for behaviour change. Such studies have been conducted with both clinical and
DTC genetic tests.
2.3.4 Response to Clinical Genetic Testing
Most clinical genetic testing research to date has evaluated the effects of genetic information
related to rare genetic variants, such as those involved in hereditary breast, ovarian and colon
cancers, on screening behaviours (McBride et al., 2010). Genetic feedback of carrier status and
cancer risk has been associated with improved screening behaviour among those carrying an at-
risk gene variant (Claes et al., 2005; Collins et al., 2005; Hadley et al., 2004; Halbert et al., 2004;
Kinney et al., 2006; Watson et al., 2004). However, studies have also examined the effect of
incorporating genetic testing in smoking cessation programs (Audrain et al., 1997; Hishida et al.,
2010; Hollands et al., 2012; Ito et al., 2006; Lerman et al., 1997; McBride et al., 2002; Sanderson
et al., 2008), weight loss and chronic disease prevention (Arkadianos et al., 2007; Cho et al.,
2012; Grant et al., 2013), and behaviour changes following disclosure of genetic risk for
Alzheimer’s disease (Chao et al., 2008) and familial hypercholesterolemia (Marteau et al., 2004).
Studies that have examined the utility of genetic information in smoking cessation
programs have reported little effect of genetic information on sustained cessation. Lerman et al.
(1997) randomized smokers to one of three groups: a standard smoking cessation consultation
group (SC), SC + carbon monoxide exhaled in breath information (CO), or SC + CO + genetic
susceptibility (GS) to lung cancer information. The GS group received personal genotypes for
CYP2D6, which has been associated with lung cancer risk in the past (Law et al., 1989), although
20
more recent GWAS examining genetic risk for lung cancer have not identified this locus (Landi
et al., 2009; Timofeeva et al., 2012; Zhang et al., 2014). Immediately following the intervention,
the GS group expressed greater perceived risk of lung cancer, greater perceptions of cessation
benefits and greater fear arousal compared to either the SC or CO group, however, after a 2-
month follow-up, there were no significant differences in cessation rates between any of the
groups (Lerman et al., 1997). After a 12-month follow-up, no significant differences in cessation
rates were observed between any of the groups, but the GS group was two times more likely to
attempt quitting smoking compared to the SC group (Audrain et al., 1997). McBride et al. (2002)
incorporated genetic susceptibility feedback to tobacco-related cancers into a smoking cessation
program and compared cessation rates to a group that received a standard cessation intervention.
Participants in the genetic information group were counseled on their GSTM1 genotype, since
individuals with lung cancer are significantly more likely to be missing GSTM1 (Bartsch et al.,
1999; McWilliams et al., 1995). However, a 2008 meta-analysis of 98 genetic association studies
reported that although the null variant of GSTM1 was associated with an increased risk of lung
cancer overall (OR: 1.22, 95% CI: 1.14-1.30), this increased risk was only present in East Asian
individuals (OR: 1.38, 95% CI: 1.24-1.55) and was not present in Caucasians (OR: 1.04, 95%
CI: 0.97-1.11) (Carlsten et al., 2008). While GWAS have not identified associations between
GSTM1 and lung cancer, Rotunno et al. reported in 2012 that GSTM1 was not well tagged in a
reference GWAS platform (Environment and Genetics in Lung Cancer Etiology; EAGLE study)
and expressed the importance of direct genotyping to investigate GSTM1 (Rotunno et al., 2012).
Nevertheless, McBride et al. (2002) found that smoking cessation was greater in the group that
received genetic information in the short-term (6 months following intervention), but not at the
12-month follow-up (McBride et al., 2002). Sanderson et al. (2008) also examined the effect of
21
GSTM1 genetic test feedback on smokers’ motivation to quit smoking. Those with the GSTM1
null variant reported a greater motivation to quit smoking compared to subjects with GSTM1
positive variant and also smoked fewer cigarettes at 1-week follow-up (Sanderson et al., 2008).
These differences were not significant at 2-months follow-up (Sanderson et al., 2008). Ito et al.
(2006) assessed the utility of genetic information in a smoking cessation program among hospital
outpatients in Japan, of whom approximately 30% were cancer patients (Ito et al., 2006).
Participants were randomized to an intervention group (I) that received information on the
MYCL1 polymorphism (rs3134613), which has been associated with greater risk of lung and
esophageal cancers among smokers carrying a risk variant (Kumimoto et al., 2002; Kumimoto et
al., 2001), or a control group (C) that received no information for smoking cessation or genetic
information. However, more recent GWAS investigating genetic risk of lung (Landi et al., 2009;
Timofeeva et al., 2012; Zhang et al., 2014) and esophageal cancer (Wu et al., 2011; Levine et al.,
2013) have not identified this locus. After 9-months, cessation rates did not differ between the
intervention and control group (I: 17.0%, C: 18.8%, p=0.80), however, there was a significant
difference among female participants who did not have cancer (Ito et al., 2006). Among those
women, a greater proportion of those in the intervention group quit smoking compared to those
in the control group (I: 15.0%, C: 4.2%, p=0.02) (Ito et al., 2006). There was no significant
difference among men who did not have cancer (I: 11.0%, C: 12.3%, p=0.89) (Ito et al., 2006).
Hishida et al. (2010) also examined the utility of incorporating MYCL1 genotype information
into a smoking cessation program among bank employees in Japan and reported no difference in
smoking cessation rates between the intervention group that received genetic information and the
control group that received no information after 12-months of follow-up (Hishida et al., 2010).
Finally, Hollands et al. (2012) assessed the impact of incorporating genetic information for risk
22
of Crohn’s disease into a smoking cessation program against family history risk information.
These investigators had previously conducted an analogue study to examine this effect and
reported no differences between genetic information or family history information on intention to
quit smoking (Wright et al., 2008). In the 2012 study, subjects in the intervention group
underwent genetic testing for three mutations in NOD2 (a genetic susceptibility marker for
Crohn’s disease (Lewis et al., 2007) and were given personalized risk information for Crohn’s
disease based on their genetic results. After a 6-month follow-up, no differences in attempts to
quit smoking or the proportion of subjects who stopped smoking for 24 hours or longer were
reported between the intervention and control group (Hollands et al., 2012).
Three studies have examined the impact of incorporating genetic information into weight
loss programs, either solely for weight loss (Arkadianos et al., 2007), or as part of a diabetes
prevention program (Cho et al., 2012; Grant et al., 2013). A study conducted in Greece evaluated
the effect of personalized diets based on genetic information on weight loss among obese
individuals who had a history of weight loss failures (Arkadianos et al., 2007). Individuals who
opted for a nutrigenetic screening test, manufactured by the company Sciona Ltd., were given
genotype-based weight loss recommendations and were compared to individuals who did not
take the genetic test, but were following a weight loss diet (Arkadianos et al., 2007). There were
no significant changes in BMI between the two groups in the first 100-300 days after the
intervention, however, weight loss was more likely to be maintained in the nutrigenetic tested
subjects compared to the control group, when subjects were followed for more than 300 days
(Arkadianos et al., 2007). Fasting blood glucose levels were also significantly improved among
subjects who underwent nutrigenetic testing, but did not improve significantly among the control
group (Arkadianos et al., 2007). Cho et al. (2012) examined the effect of incorporating genetic
23
information for type 2 diabetes risk in a diabetes prevention program. Participants were
randomized to an intervention group that received standard risk assessment (SRA: consisting of
fasting blood glucose, family history and BMI) plus genetic risk information (given as number of
higher risk variants out of a total of 16 SNPs), or SRA alone. Primary outcome measurements
included change in insulin resistance and BMI at 3- and 12-months. Preliminary results showed
no differences in weight loss between the two groups at 3-months (Cho et al., 2012), although
additional results have yet to be published. Grant et al. (2013) also assessed the utility of genetic
information in a 12-week diabetes prevention program among overweight adults. Participants
were randomized to a genetic risk testing group (intervention) or a no testing group (control)
using a 4:1 allocation ratio and only those found to be in the top and bottom quartiles of genetic
risk for diabetes (using the diabetes genetic risk score based on 18 risk alleles developed in the
Framingham Offspring Study (Meigs et al., 2008)) were retained in the intervention group (Grant
et al., 2013). Outcome measures included self-reported motivation to make lifestyle changes,
number of weekly program sessions attended over the 12-weeks and weight change from
baseline at 12-weeks. Overall, all participants in the study reported greater motivation to make
lifestyle changes, attended approximately half of the program sessions and lost an average of
approximately 8 pounds, but there were no significant differences in these outcomes between the
intervention and control group (Grant et al., 2013).
Additional studies examining genetic information and behaviour have been related to
Alzheimer’s disease (AD) and familial hypercholesterolemia (FH) (Chao et al., 2008; Marteau et
al., 2004). Chao et al. (2008) examined whether disclosure of APOE e4 genotype altered health
behaviour among asymptomatic individuals at high risk for AD. First-degree family members
and those carrying 1 or 2 copies of the APOE e4 allele are at increased risk of developing AD
24
(Farrer et al., 1997; Green et al., 2002). The researchers found that participants who learned they
were ε4 positive were significantly more likely to report AD-specific health behaviour change 1-
year after disclosure, such as changing medication or vitamin use (Chao et al., 2008). Adding a
vitamin E supplement was the most common change (Chao et al., 2008). Marteau et al. (2004)
examined whether clinical diagnosis of FH, as confirmed by a genetic mutation in the LDLR or
APOB genes, affected patients’ adherence to risk-reducing behaviours. The researchers found
that subjects with a mutation believed less strongly in the efficacy of diet in reducing cholesterol
levels, but showed a trend in believing more strongly in the efficacy of medication (Marteau et
al., 2004). However, confounding may have influenced this result since individuals who
possessed mutations for FH may have had more severe disease and stronger family history of
early CVD and were perhaps more motivated to take medication. Moreover, baseline analyses
indicated that subjects who attributed more importance to genetics than lifestyle in CVD risk
reported greater adherence to their cholesterol-lowering medication (Marteau et al., 2004).
Results from studies assessing the impact of clinical genetic testing on health behaviour
changes have reported conflicting findings. While incorporation of genetic information appears
to have little impact on smoking cessation, some effects have been reported for dietary
behaviours (Arkadianos et al., 2007; Chao et al., 2008). Overall, few of these studies have
included long-term follow-up assessments of at least 1-year and the type of genetic information
that has been provided varies between studies. Therefore, it is difficult to compare studies in
order to draw conclusions about the effectiveness of disclosing genetic information for behaviour
change. Additional studies may clarify the effect of genetic information on behaviour.
25
2.3.5 Response to Direct-to-consumer Genetic Testing
To date, only one study has empirically examined the effect of genetic information obtained
from a DTC genetic test on behavioural outcomes and published both short-term and long-term
findings (Bloss et al., 2011c; Bloss et al., 2013). Subjects in the study (n=2,037) were recruited
from health and technology companies (Microsoft, Sempra Energy, Qualcomm, SDG&E, Life
Technologies, Affymetrix and The Scripps Research Institute) and purchased the Navigenics
“Health Compass” DTC genetic test ($999 USD) at a reduced price. To encourage enrolment
early on during participant recruitment, the price of the genetic test was lowest at the start of the
study at $150 USD. The price increased over time and the highest cost of the test was $470 USD
during the final months of recruitment. Participant recruitment occurred between October 2008
and September 2009. The Navigenics “Health Compass” test screened DNA for 23 different
health conditions (e.g. type 2 diabetes, heart disease, obesity and certain cancers) and provided
estimates of one’s risk for developing them over a lifetime (Bloss et al., 2011c). Questionnaires
were used to measure subjects’ level of anxiety (Speilberger State-Trait Anxiety Inventory),
dietary fat intake (Block Dietary Fat Screener) and time spent exercising (Godin Leisure-Time
Exercise Questionnaire) prior to genetic testing (Bloss et al., 2011c). These questionnaires were
repeated at mean follow-up points of 6- and 12- months after the test results were disclosed and
scores were compared to determine if the genetic information affected any outcome variable. No
changes in scores were seen at either follow-up time points and the investigators concluded that
the genetic information had no effect on the behavioural outcomes of interest (Bloss et al.,
2011c; Bloss et al., 2013).
Although Bloss et al. were the first to investigate the effect of DTC genetic test
information on behaviour, a number of study limitations should be noted. No control group was
26
present, which limits the interpretation of the results. As well, the corresponding lifestyle advice
that was provided to the subjects was the same regardless of genotype and was not personalized.
Therefore, the subjects were not aware of what specific changes they should make based on their
genotypes that would mitigate their risk for the conditions. Furthermore, the questionnaire scores
indicated that, at baseline, the majority of the sample had relatively low dietary fat intakes and
were meeting public health recommendations for physical activity. The effects of the information
may have been different in a population that consumed a greater amount of dietary fat and
exercised less at baseline.
Despite that study’s null findings, other evidence suggests that information from a DTC
genetic test may result in lifestyle modification. A survey of 1,055 readers of the journal Nature
reported that 27% of respondents who had undergone genetic testing (predominantly from a
DTC genetic testing company) indicated that they changed their diet, lifestyle or medication use
based on their genetic test results (Maher, 2011). However, Nature readers are likely not a
representative sample of the general population. A separate survey conducted among 1,048 DTC
genetic test users reported that 43% sought out additional information about a health condition
included in their test results, and that 33% were “being more careful about their diet” and 16%
had changed their use of medications or supplements (Kaufman et al., 2012). These results
suggest that information obtained from a DTC genetic test does impact health behaviour,
particularly dietary behaviour, in a considerable proportion of users and thus warrants further
study.

27
2.4 Dietary Recommendations
2.4.1 Population-based Dietary Guidelines
The origin of dietary guidelines can be dated back to the work of the chemist Wilbur Olin
Atwater in the late 19th century. Atwater conducted the first calorimeter experiments that
measured the energy in different foods, which led to the development of the first food
composition tables and dietary standards for Americans in 1894 (Atwater, 1894). These
standards were updated and developed over time into recommendations for consuming specific
items from different food groups until the 1941 release of the first Recommended Dietary
Allowances (RDAs) by the Food and Nutrition Board of the National Academy of Sciences
(National Research Council, 1941). This five page report included intake recommendations for
calories and nine nutrients (protein, calcium, iron, vitamin A, thiamin, riboflavin, niacin,
ascorbic acid and vitamin D). The recommendations were based on sex, activity level and age
and the report notes that they only apply to individuals in good health (National Research
Council, 1941). Moreover, the authors of the report acknowledged that evidence on nutrient
requirements was sparse at the time and that the values would need to be revised as more
knowledge became available (National Research Council, 1941). The RDAs continued to be
used until the publication of the Dietary Reference Intakes (DRIs) in 1997. Canada had
developed its own set of dietary standards released by the Canadian Council of Nutrition in 1939,
but adopted the US RDAs in 1942 for uniformity between the two countries (Health Canada,
2010). However, in 1945 the RDAs were shown to be inappropriate for evaluating group intakes
(Wilder, 1945), so the Canadian Council of Nutrition created new Canadian standards that were
used from 1948-1990 (Health Canada, 2010). These standards were named the Recommended
28
Nutrient Intakes (RNI) in 1983 and remained as the Canadian guidelines until the publication of
the DRIs in 1997 (Health Canada, 2010).
A 1994 IOM publication called for considerations of how the RDAs should be revised,
since disagreement existed between scientists on the interpretation and application of the RDAs
(Food and Nutrition Board, 1994). Proponents of revising the recommendations expressed that
the standards did not consider the role nutrients played in chronic disease risk (Food and
Nutrition Board, 1994). The first Dietary Reference Intakes report was published in 1997 after
collaboration between scientists from the IOM and Health Canada and replaced the US RDAs
and Canadian RNI (Food and Nutrition Board, 1997). The DRIs report included a set of
reference values (rather than a single value) to describe states of average requirements,
recommended allowances and upper safe limits (Food and Nutrition Board, 1997). A complete
summary report of DRIs and their application was published by the IOM in 2006 (National
Research Council, 2006), with a revision to the calcium and vitamin D recommendations
released in late 2010 (National Research Council, 2011).
While the DRIs are an improvement from the RDAs, the values must be periodically
reviewed to consider emerging scientific evidence. In fact, the IOM and Health Canada recently
accepted nominations to review the DRIs and applications were received for 16 nutrients (Health
Canada, 2013). One criticism of population-based dietary recommendations is that knowledge of
individuals’ genetic variation affecting nutrition requirements has not been considered in their
creation (Stover, 2006). Proponents of personalized nutrition argue that dietary recommendations
that are tailored to an individual’s genotype will maximize the effects of nutrition on health
outcomes. In addition, individuals may be more motivated to adhere to personalized dietary
recommendations based on genotype. Indeed, a number of studies investigating the relationship
29
between nutrition and genetics have demonstrated an ability to personalize dietary
recommendations based on genetic variation.
2.4.2 Evidence for Personalized Nutrition
Several significant findings in the field of nutrigenomics have formed the basis for this thesis
project. A study examining the association between CYP1A2 genotype, coffee intake and acute
nonfatal myocardial infarction (MI) found that 2 or more cups per day of coffee increased the
risk of nonfatal MI only among carriers of the variant allele (“slow” caffeine metabolizers)
(Cornelis et al., 2006). Among slow metabolizers, the multivariate-adjusted odds (adjusted for
age, sex, area of residence, waist-hip ratio, income, physical activity, history of diabetes, history
of hypertension, and intakes of alcohol, total energy, and energy-adjusted saturated fat,
polyunsaturated fat, trans fat, folate and sucrose) of MI increased as coffee consumption
increased. The odds ratios (ORs) and 95% confidence intervals for MI when consuming less than
1, 1, 2 to 3, and 4 or more cups of coffee per day were 1.00 (reference), 0.99 (0.69-1.44), 1.36
(1.01-1.83), and 1.64 (1.14-2.34), respectively. These effects were more pronounced among
individuals younger than the median age of 59 years. The multivariate-adjusted ORs for MI
among slow metabolizers under 59 years when consuming less than 1, 1, 2 to 3, or 4 or more
cups of coffee per day were 1.00, 1.24 (0.71-2.18), 1.67 (1.08-2.60), and 2.33 (1.39-3.89),
respectively. A different study found that risk of hypertension associated with coffee intake
varies according to CYP1A2 genotype, with carriers of the slow allele being at increased risk
when consuming moderate amounts of caffeine (1-3 cups of coffee per day). The multivariate-
adjusted ORs (adjusted for age, sex, baseline blood pressure and follow-up length) of
hypertension among slow metabolizers was 1.00 in abstainers (reference), 1.72 (1.21-2.44) in
30
moderate coffee drinkers and 3.00 (1.53–5.90) in heavy drinkers (Palatini et al., 2009). Fast
metabolizers were not at significantly increased risk of MI or hypertension in either study at any
level of coffee consumption (Cornelis et al., 2006; Palatini et al., 2009). These results suggest
that individuals carrying a slow allele should limit their consumption of caffeine, potentially to
no more than 2 cups of coffee per day.
Researchers studying genetic variation in vitamin C metabolism found that individuals
with null variants in the GSTM1 and GSTT1 were at increased risk of serum ascorbic acid
deficiency if they did not meet the Recommended Dietary Allowance (RDA) for vitamin C
(Cahill et al., 2009). The multivariate-adjusted ORs and 95% confidence intervals (adjusted for
BMI, energy intake, oral contraceptive use in women, C-reactive protein, ethnicity and season)
for serum ascorbic acid deficiency were 2.17 (1.10, 4.28) and 12.28 (4.26, 33.42), respectively,
for subjects with the GSTT1 functional and GSTT1 null genotypes and 2.29 (0.96, 5.45) and 4.03
(2.01, 8.09), respectively, for subjects with the GSTM1 functional and GSTM1 null genotypes.
Serum ascorbic acid levels were also lower in subjects with a deletion of GSTT1 or GSTM1 in a
different study (Horska et al., 2011). The recommended intake for vitamin C protects against
serum ascorbic acid deficiency regardless of genotype, yet these results suggest that individuals
with deletion genotypes for GSTM1 and GSTT1 could benefit from being particularly mindful of
meeting the daily recommendation.
An intriguing area of study which is rapidly expanding is the science of chemical senses
and its relation to individual food preferences (Meiselman, 1996). There is growing evidence that
genetics plays a significant role in one’s ability to detect taste and smell, in turn affecting food
preferences and dietary intake (Garcia-Bailo et al., 2009; Reed and Knaapila, 2010). A study
examining the role of genetics in sugar consumption found that a variation in the TAS1R2 gene
31
(which encodes the sweet taste receptor) affected habitual consumption of sugars in two distinct
populations: (1) healthy, young adults and (2) individuals with type 2 diabetes (Eny et al., 2010).
Individuals possessing a variant in the TAS1R2 gene consumed more total sugars (mean ± SEM)
than those without the genetic variant (population 1: 122 ± 6 g/day vs. 103 ± 6 g/day, p = 0.01;
population 2: 99 ± 6 g/day vs. 83 ± 6 g/day, p = 0.04) (Eny et al., 2010). Although the
mechanism for this is unknown, it is plausible that genetic variation in TAS1R2 affects sweet
taste perception and may play a role in an individual’s preference for sweet tasting foods.
Knowing whether one is genetically predisposed to preferring sweet foods may impact eating
behaviour.
The role of genetic variation in salt-sensitive hypertension has also been explored (Giner
et al., 2000; Poch et al., 2001). One study found that hypertensive patients with the I variant of
the intronic Insertion/Deletion (I/D) ACE gene had a significantly higher increase in both mean ±
SD systolic blood pressure (SBP) and diastolic blood pressure (DBP) with high salt intake
compared to those without the I variant (SBP mm Hg: 9.8 ± 8.1 (I/I), 5.0 ± 7.3 (I/D), 1.2 ± 5.9
(D/D), p = 0.01; DBP mm Hg: 5.2 ± 4.2 (I/I), 2.4 ± 6.1 (I/D), -0.2 ± 4.2 (D/D), p = 0.03) (Giner
et al., 2000). The prevalence of salt-sensitive hypertension, as determined by 24-hour ambulatory
mean blood pressure after high salt intake, was also higher among I/I (67%) and I/D (62%)
genotypes compared with the DD genotype (19%), p = 0.01. (Giner et al., 2000). The same
results were observed when this sample size was increased from 50 patients to 71 patients, and
additional genotypes in other genes were examined (Poch et al., 2001). The other genes included
angiotensinogen (M235T), angiotensin II type 1 receptor (A1166C), 11ß HSD2 (G534A),
aldosterone synthase (C-344T and Intron 2 conversion), and the mineralocorticoid receptor
(G3514C and A4582C). Only 11ß HSD2 and ACE were significantly associated with salt-
32
sensitive hypertension (Poch et al., 2001). These results suggest that the ACE polymorphism may
serve as a potential genetic marker of salt-sensitivity. Informing individuals of their genetic
susceptibility to salt-sensitive hypertension may motivate adoption of behaviours such as
limiting dietary sodium intake, which will mitigate the chance of developing this condition later
in life.
The evidence highlighted above forms the rationale for the proposed research project,
which is to examine how general dietary recommendations compare with targeted dietary advice
based on genotypes to motivate changes in dietary intake. Dietary intake will be assessed with a
food frequency questionnaire, which is discussed below along with other tools for assessing
intake.
2.5 Dietary Assessment
In order to assess relationships between diet and health, as well as the effectiveness of an
intervention in promoting dietary change, assessments of individuals’ dietary intakes are
commonly made in nutrition research. The three most common tools currently available for
assessing dietary intake include food records, 24-hour dietary recalls and food frequency
questionnaires. However, each of these instruments possesses unique strengths and limitations.
Food records require that research subjects record everything they consume over a day as
the day progresses (Buzzard, 1998). If completed correctly, data from food records are
considered to be highly accurate of an individual’s actual recent intake, since memory does not
play a role in the quality of reporting (Buzzard, 1998). Research participants are generally asked
to record foods and beverages consumed over a period of 3-7 days and include portion sizes (or
weights) and methods of preparation. The records should include intake from at least one
33
weekend day, as dietary intake has been shown to differ between week days and weekend days
(Bhargava et al., 1994). Requesting participants to record intake on non-consecutive days is an
important consideration, as capturing the true variation in dietary intake may be otherwise
minimized (Larkin et al., 1991). Although considered one of the best measures of actual dietary
intake, a limitation of food records includes the high level of motivation subjects require to
complete the records correctly, which may affect the representativeness of the study population
and limit the generalizability of findings (Buzzard, 1998). The process of completing a food
record may also influence the dietary intake of the subject and thus would compromise the
reliability of the data (Buzzard, 1998). In addition, food records are costly as subjects are
generally compensated for their completion and study staff are required to review records for
completeness and enter data manually into nutrient analysis software (Buzzard, 1998).
Twenty four hour dietary recalls are commonly used in large scale studies to obtain an
estimate of recent dietary intake in a more cost-effective manner than food records (Buzzard,
1998). In this method, a trained interviewer probes a subject about the foods and beverages that
were consumed over the previous day (Buzzard, 1998). Although this method only provides data
on one day’s intake, a second dietary recall can be conducted among a subset of the study sample
to estimate the day-to-day variation in intake of the entire sample (Hoffmann et al., 2002). This
method of assessment places little burden on study subjects and allows for participation from a
more representative sample of the general population, since the quality of reporting does not
depend on the literacy of the subject (Buzzard, 1998). However, 24-hour recalls rely on a
subject’s memory to accurately recall what was consumed over the previous day and, therefore,
are prone to measurement error (Buzzard, 1998).
34
Food frequency questionnaires (FFQ) are commonly used in epidemiological studies to
assess diet-disease relationships because they provide an estimate of usual intake, rather than
recent intake (Willet, 1998). FFQs generally consist of a comprehensive list of foods, frequency
response options and portion size information for either all items (quantitative), some items
(semi-quantitative) or no items (Willet, 1998). The questionnaires generally collect data on
dietary intake over a time period of one month to one year, although some request participants to
report on dietary intake from over a year ago (particularly case-control studies where cases are
asked to recall dietary intake before disease onset) (Willet, 1998). While FFQs are advantageous
because they measure usual intake, can be self-administered and are processed quickly, they are
prone to measurement errors such as underreporting of energy (Bedard et al., 2004; Brown,
2006) and recall bias where cases inaccurately report their dietary intake from before disease
onset (Prentice, 1996).
Each of the instruments that assesses self-reported dietary intake is affected by inherent
susceptibilities to measurement and reporting errors and, as a result, the validity of self-reported
dietary intake data has been questioned (Schoeller, 1990). Therefore, biological markers are used
to obtain more objective measures of intake and also to validate self-reported data (Hunter,
1998). Examples of biomarkers of dietary intake include doubly labeled water for total energy
expenditure (Schoeller et al., 1986), urinary excretion for sodium intake (Watson and Langford,
1970), urinary nitrogen for protein intake (Bingham and Cummings, 1985) and subcutaneous
adipose tissue for certain dietary fatty acids (Beynen et al., 1980). However, factors that may
affect the validity of biomarkers as surrogate indicators of dietary intake include study design
(e.g. cross-sectional studies need to consider whether biomarkers are affected by disease state),
35
whether the biomarker reflects recent or long-term intake, and issues of specimen collection,
handling and storage (Jenab et al., 2009).
2.6 Summary of Literature Review and Knowledge Gaps
Chronic diseases account for a striking proportion of the world’s morbidity and mortality. Diet is
one of the most common modifiable lifestyle factors that influences chronic disease risk.
Therefore, interventions that target diet for health behaviour change can have a significant
impact on chronic disease risk of individuals and populations. Moreover, the genomics era
provides novel opportunities for designing interventions that may be more effective at promoting
behaviour change. Identifying vulnerable groups of the population by characterizing genetic risk
of a health outcome and customizing dietary recommendations according to an individual’s
genotype may result in better adherence to recommendations than providing general population-
based advice. The behavioural impact of disclosing personal genomic information related to
health has been assessed in a few studies and additional randomized trials have been recently
completed or are currently underway (Table 2.1). However, no previous study has assessed the
impact of disclosing genetic information related to nutritional advice on dietary intake behaviour
in particular. Since diet is such an important modifier of chronic disease risk and
recommendations are immediately actionable, this lack of research represents a significant
knowledge gap. In addition, while consumer perceptions of genomic information related to
disease susceptibility have been assessed, little is known about individual perceptions regarding
genetic testing for personalized nutrition. Therefore, the aim of the present thesis is to determine
the effect of disclosing genetic information related to personalized nutrition on dietary intake, as
well as to assess individual perceptions of genetic testing for personalized nutrition.
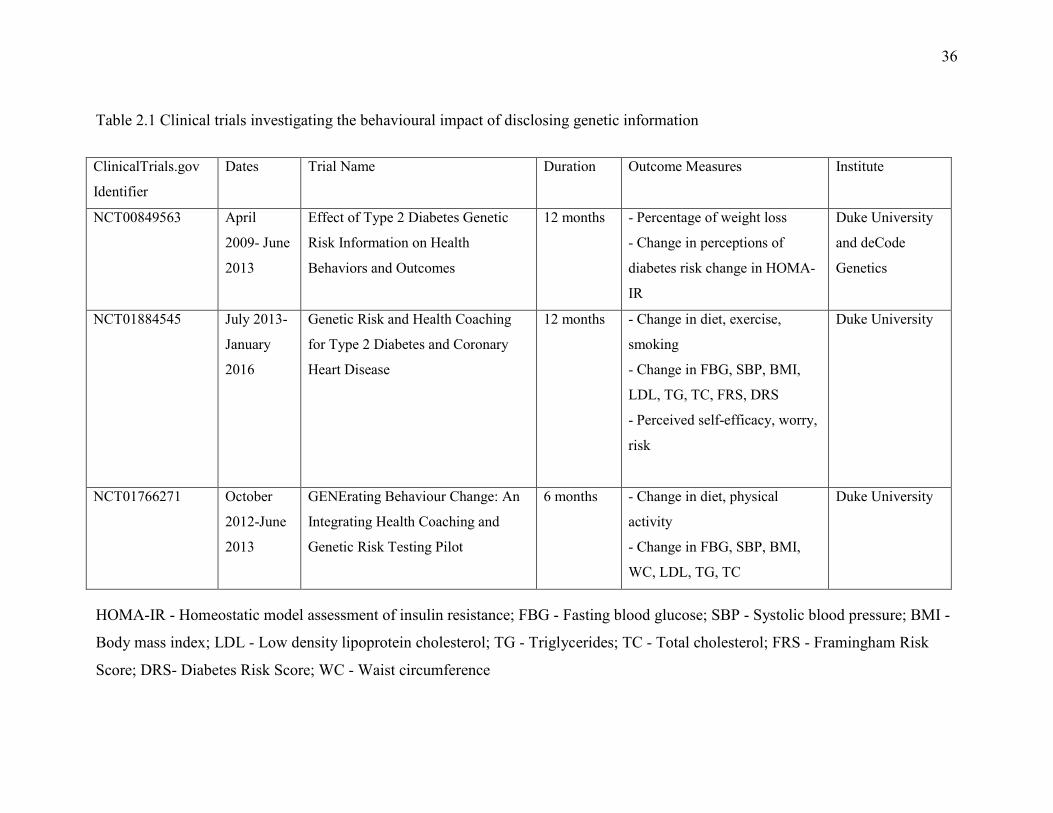
36
Table 2.1 Clinical trials investigating the behavioural impact of disclosing genetic information
HOMA-IR - Homeostatic model assessment of insulin resistance; FBG - Fasting blood glucose; SBP - Systolic blood pressure; BMI -
Body mass index; LDL - Low density lipoprotein cholesterol; TG - Triglycerides; TC - Total cholesterol; FRS - Framingham Risk
Score; DRS- Diabetes Risk Score; WC - Waist circumference
ClinicalTrials.gov
Identifier
Dates Trial Name Duration Outcome Measures Institute
NCT00849563 April
2009- June
2013
Effect of Type 2 Diabetes Genetic
Risk Information on Health
Behaviors and Outcomes
12 months - Percentage of weight loss
- Change in perceptions of
diabetes risk change in HOMA-
IR
Duke University
and deCode
Genetics
NCT01884545 July 2013-
January
2016
Genetic Risk and Health Coaching
for Type 2 Diabetes and Coronary
Heart Disease
12 months - Change in diet, exercise,
smoking
- Change in FBG, SBP, BMI,
LDL, TG, TC, FRS, DRS
- Perceived self-efficacy, worry,
risk
Duke University
NCT01766271 October
2012-June
2013
GENErating Behaviour Change: An
Integrating Health Coaching and
Genetic Risk Testing Pilot
6 months - Change in diet, physical
activity
- Change in FBG, SBP, BMI,
WC, LDL, TG, TC
Duke University

37
Chapter 3
Hypothesis and Objectives
38
3.1 Hypothesis
Targeted dietary advice based on genetic information will influence changes in dietary intake
behaviour to a greater extent than general dietary recommendations.
3.2 Objectives
1. Examine the perceptions of individuals toward genetic testing and personalized nutrition.
2. Compare the short-term and long-term effects of DNA-based dietary advice with general
dietary advice on dietary intakes of caffeine, vitamin C, added sugar and sodium 3-
months and 12-months after providing the advice.
3. Determine individual preferences for obtaining personal genetic information and
determine if perceptions toward genetic testing and personalized nutrition changed over
the course of the intervention.
39
Chapter 4
A randomized trial of genetic information
for personalized nutrition
Adapted from: Nielsen DE and El-Sohemy A. (2012) A randomized trial of genetic
information for personalized nutrition. Genes Nutr. 7(4):559-66.
40
4.1 Abstract
Personal genetic information has become increasingly accessible to the public as a result of
direct-to-consumer (DTC) genetic tests; however, concerns have been raised over their value and
potential risks. We compared the effects of providing genotype-based dietary advice with general
recommendations on behavioral outcomes using a randomized controlled study. Participants
were men and women from the Toronto Nutrigenomics and Health Study between the ages of
20–35 years old (n=149) who completed a survey to assess their awareness of DTC genetic tests
and nutrigenomics, as well as potential motivations for undergoing genetic testing. Participants
were then randomized into an intervention (I) or control (C) group and were given either
genotype-based personalized dietary advice or general dietary advice, respectively. A second
survey was administered to assess the participants’ opinions of the dietary reports they received.
A greater proportion of participants in the intervention group agreed that they understood the
dietary advice they were given (93% (I) vs. 78% (C); p=0.009). Participants in the intervention
group were more likely to agree that the dietary recommendations they received would be useful
when considering their diet (88% (I) vs. 72% (C); p=0.02) and wanted to know more about the
recommendations (95% (I) vs. 76% (C); p<0.0001). Only 9% of participants in the intervention
group reported feeling uncomfortable about learning their genetic information. These findings
suggest that individuals find dietary recommendations based on genetics more understandable
and more useful than general dietary advice. Very few feel uneasy about receiving their genetic
information that relates to personalized nutrition.
41
4.2 Introduction
Recent advances in genomics technologies have made the acquisition of personalized genetic
information easily obtainable. Direct-to-consumer (DTC) personal genetic tests claim to provide
consumers with information about their genetic ancestry, ability to metabolize nutrients and
drugs, and risk for developing diseases (Janssens and van Duijn, 2010). One class of genetic tests
offer personalized dietary advice based on one’s DNA to improve health (Sterling, 2008).
Nutrigenomics (or nutritional genomics) is the study of the relationship between genes and diet,
and is used as an umbrella term for two complimentary approaches: how nutrients affect gene
function and how genetic variation affects nutrient response (Cahill and El-Sohemy, 2011). The
latter is sometimes referred to as nutrigenetics (El-Sohemy, 2007) and includes the study of how
genetic variations affect food intake and eating behaviours (Eny and El-Sohemy, 2010; Garcia-
Bailo et al., 2009). The DTC method of marketing facilitates the sales of genetic tests without
involvement of a healthcare professional (Norrgard, 2008). These tests are commercially
available through the internet and are largely unregulated, though significant measures are being
taken to regulate this emerging market in certain jurisdictions (McGuire et al., 2010). The cost of
the different types of genetic tests available can range from approximately $99 to over $2000
USD (Bloss et al., 2011a). DTC genetic testing for disease susceptibility remains controversial,
with opponents arguing that the tests possess limited value due to their questionable clinical
validity and utility (Burke, 2009; Caulfield, 2010; Eng and Sharp, 2010). Critics note that
predicted risks will continue to change as new genetic variants are discovered, and thus any risk
estimates for disease based on currently known common variants are premature (Janssens et al.,
2011; Mihaescu et al., 2009). Moreover, environmental factors such as diet, smoking and
42
physical activity can have a far greater impact on risk, but are often not considered when
providing estimates of risk. There is also concern that consumers may experience anxiety if
provided with estimates of higher risk for developing certain diseases based on their genes and
may seek out potentially unnecessary health interventions (McGuire and Burke, 2008). Another
criticism of most DTC genetic tests is that the corresponding advice is not genuinely
personalized since the lifestyle recommendations are generally the same, regardless of genotype,
although evidence for such personalized recommendations is currently scarce. Despite these
criticisms, proponents of DTC genetic tests argue that there is public interest in genomics and
that individuals should have access to their own genetic information (Bloss et al., 2011a;
Caulfield, 2010). In addition, some propose that direct access to genetic information may
motivate consumers to adopt lifestyle behavioural changes aimed at reducing risk of disease
development (Bloss et al., 2011b; McBride et al., 2010). Studies have reported different findings
of the effects of disclosure of genetic risk information on health-related behaviours (Arkadianos
et al., 2007; Chao et al., 2008; Conradt et al., 2009; Lerman et al., 1997; Marteau et al., 2004;
McBride et al., 2002; Vernarelli et al., 2010) however, only one study has investigated the
impact of DTC genetic testing on behaviour and reported no short-term changes in specific
dietary or exercise behaviours (Bloss et al., 2011c). A limitation of that study is that the genetic
risk scores that were given to the subjects were not specifically linked to a particular lifestyle
behaviour and no personalized advice to reduce the risk of developing a health condition was
provided. Importantly, there was no control group in the study. A recent survey of readers of the
journal Nature shows that 27% of respondents who had their genomes analyzed changed their
diet, lifestyle or medication based on their genetic information, suggesting that genetic
information could impact behaviour (Maher, 2011).
43
For appropriate recommendations and regulations regarding DTC genetic tests to be
made, the public’s knowledge and opinions of these technologies need to be well understood. A
number of studies have surveyed awareness of and attitudes toward DTC genetic tests either
among the general public or among healthcare providers (Cherkas et al., 2010; Goddard et al.,
2009; Goddard et al., 2007; Gollust et al., 2012; Kolor et al., 2009; McGuire et al., 2009;
Stewart-Knox et al., 2009; Taylor, 2011). These studies report low awareness of genetic tests
among the general public (13-24%) (Cherkas et al., 2010; Goddard et al., 2009; Goddard et al.,
2007), but higher awareness among healthcare providers (42-44%) (Goddard et al., 2007; Kolor
et al., 2009). Studies have reported an interest in genetic testing among the public, with 50-66%
of subjects reporting a willingness to undergo testing (Cherkas et al., 2010; McGuire et al., 2009;
Stewart-Knox et al., 2009). Focus group research has also been conducted to better understand
the knowledge and attitudes of consumers and healthcare professionals toward nutrigenomics
(Morin, 2009; Weir et al., 2010). Most consumers in the focus groups were unfamiliar with the
term nutrigenomics and did not relate the term personalized nutrition to an individual’s genetic
profile, whereas about half of healthcare professionals were aware of the term nutrigenomics
(Morin, 2009). After being provided with an explanation of nutrigenomics, consumers felt that a
tailored diet could help reduce the risk of disease development, while healthcare professionals
expressed more skepticism (Morin, 2009). While these studies provide valuable insight into the
public’s perceptions of nutrigenomics and genetic testing, they have all been either observational
or qualitative in design. In addition, there has been some concern that genetic information
obtained from a DTC genetic test is not always understood (Leighton et al., 2011), and no studies
have examined whether DTC genetic tests that provide personalized nutrition advice are
44
understandable. The objectives of the present study were to conduct a randomized controlled trial
to assess behavioural outcomes as well as the awareness, perceptions and understanding of
nutrigenomics and genetic testing.
4.3 Methods
4.3.1 Study design and participants
The present study is a double-blinded, parallel group randomized controlled trial with a 2:1 ratio
of participants in the intervention vs. control group. Ethics approval was obtained from the
University of Toronto Institutional Review Board and the study was registered with
www.clinicaltrials.gov (NCT 01353014). Recruitment was carried out from May to August
2011. Participants provided informed consent by mail or e-mail and then completed a baseline
survey designed to assess awareness and opinions of genetic testing and nutrigenomics using 4-
and 5- point Likert scales. After the baseline survey was completed, participants were
randomized to an intervention (I) or control (C) group using a computer software program
(Random Allocation Software) that generated a random list of assignments. A 2:1 ratio of
participants in the intervention group compared to the control group was applied since the
intervention group consisted of those who would have either the “risk” or “non-risk” genotype
for each of the four genes. Participants were informed that they would receive DNA-based
dietary advice at some point during the study and those who were randomized to the control
group were given the DNA-based advice after the final follow-up assessment was completed.
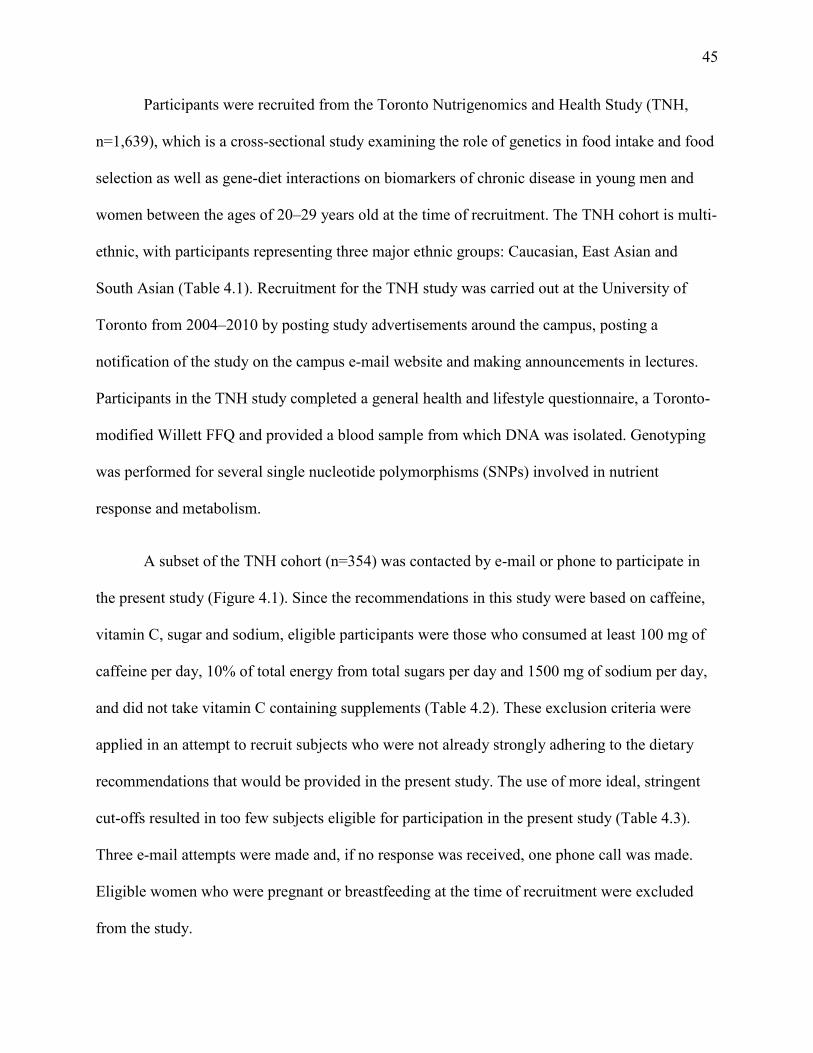
45
Participants were recruited from the Toronto Nutrigenomics and Health Study (TNH,
n=1,639), which is a cross-sectional study examining the role of genetics in food intake and food
selection as well as gene-diet interactions on biomarkers of chronic disease in young men and
women between the ages of 20–29 years old at the time of recruitment. The TNH cohort is multi-
ethnic, with participants representing three major ethnic groups: Caucasian, East Asian and
South Asian (Table 4.1). Recruitment for the TNH study was carried out at the University of
Toronto from 2004–2010 by posting study advertisements around the campus, posting a
notification of the study on the campus e-mail website and making announcements in lectures.
Participants in the TNH study completed a general health and lifestyle questionnaire, a Toronto-
modified Willett FFQ and provided a blood sample from which DNA was isolated. Genotyping
was performed for several single nucleotide polymorphisms (SNPs) involved in nutrient
response and metabolism.
A subset of the TNH cohort (n=354) was contacted by e-mail or phone to participate in
the present study (Figure 4.1). Since the recommendations in this study were based on caffeine,
vitamin C, sugar and sodium, eligible participants were those who consumed at least 100 mg of
caffeine per day, 10% of total energy from total sugars per day and 1500 mg of sodium per day,
and did not take vitamin C containing supplements (Table 4.2). These exclusion criteria were
applied in an attempt to recruit subjects who were not already strongly adhering to the dietary
recommendations that would be provided in the present study. The use of more ideal, stringent
cut-offs resulted in too few subjects eligible for participation in the present study (Table 4.3).
Three e-mail attempts were made and, if no response was received, one phone call was made.
Eligible women who were pregnant or breastfeeding at the time of recruitment were excluded
from the study.
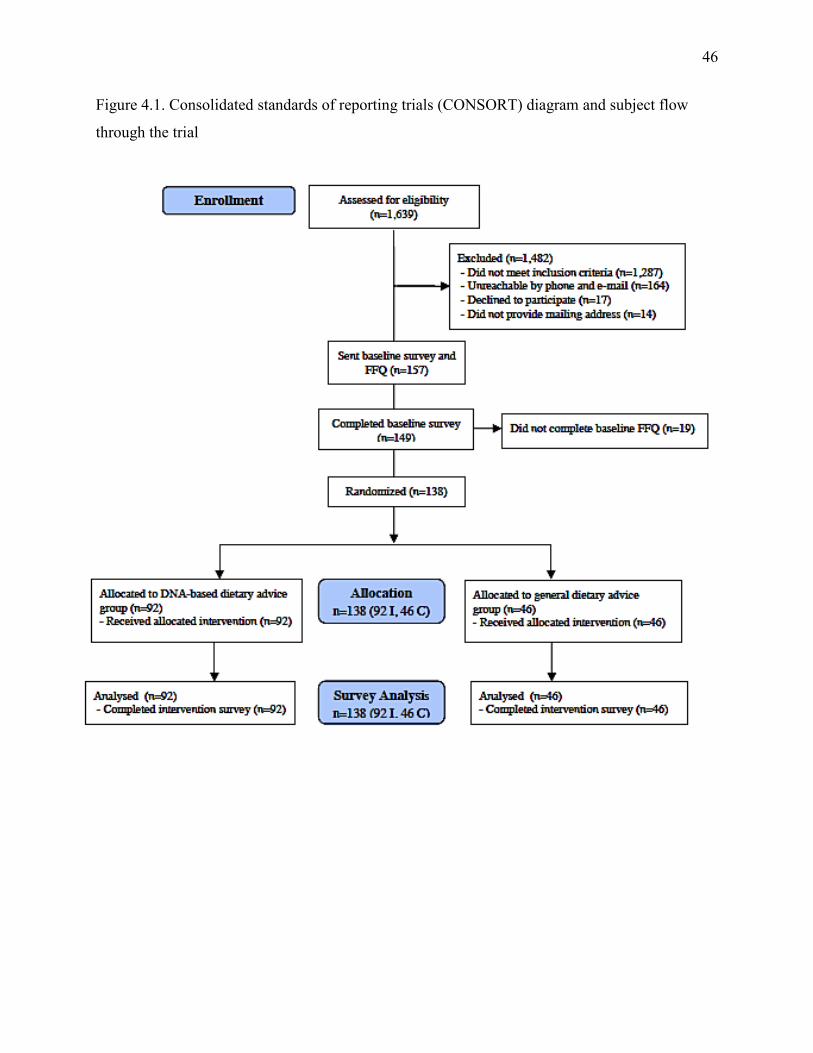
46
Figure 4.1. Consolidated standards of reporting trials (CONSORT) diagram and subject flow
through the trial
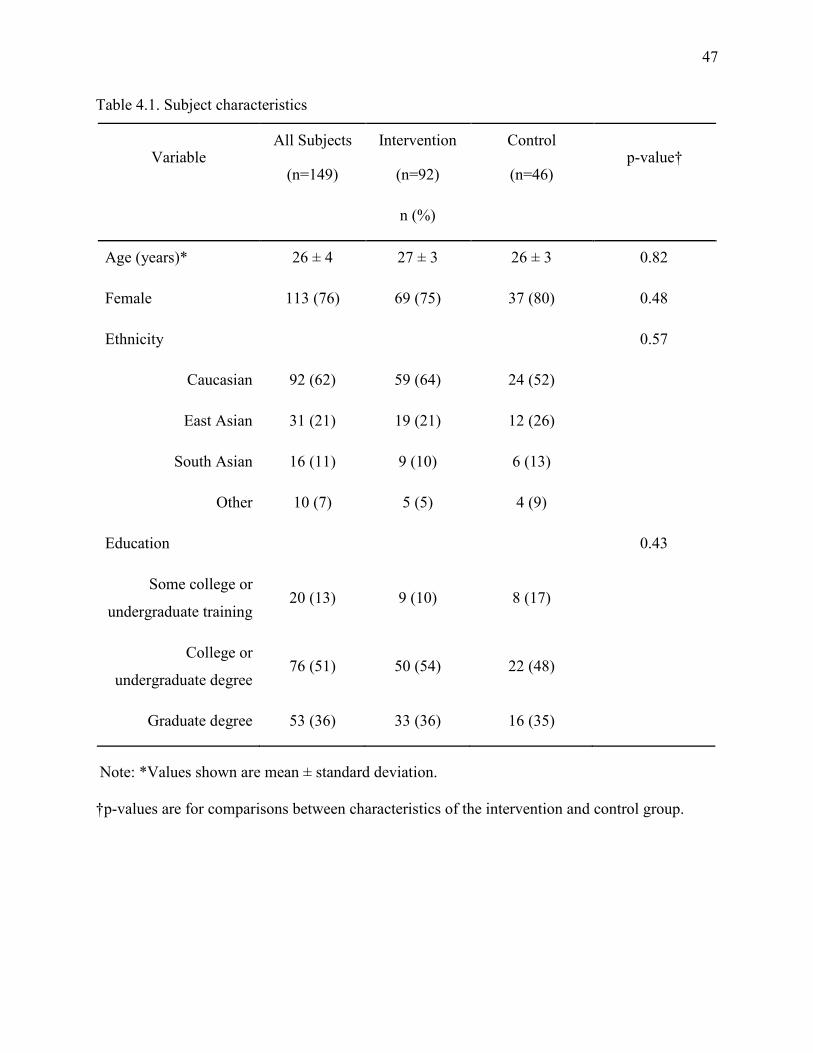
47
Table 4.1. Subject characteristics
Variable All Subjects
(n=149)
Intervention
(n=92)
Control
(n=46) p-value†
n (%)
Age (years)* 26 ± 4 27 ± 3 26 ± 3 0.82
Female 113 (76) 69 (75) 37 (80) 0.48
Ethnicity 0.57
Caucasian 92 (62) 59 (64) 24 (52)
East Asian 31 (21) 19 (21) 12 (26)
South Asian 16 (11) 9 (10) 6 (13)
Other 10 (7) 5 (5) 4 (9)
Education 0.43
Some college or
undergraduate training 20 (13) 9 (10) 8 (17)
College or
undergraduate degree 76 (51) 50 (54) 22 (48)
Graduate degree 53 (36) 33 (36) 16 (35)
Note: *Values shown are mean ± standard deviation.
†p-values are for comparisons between characteristics of the intervention and control group.
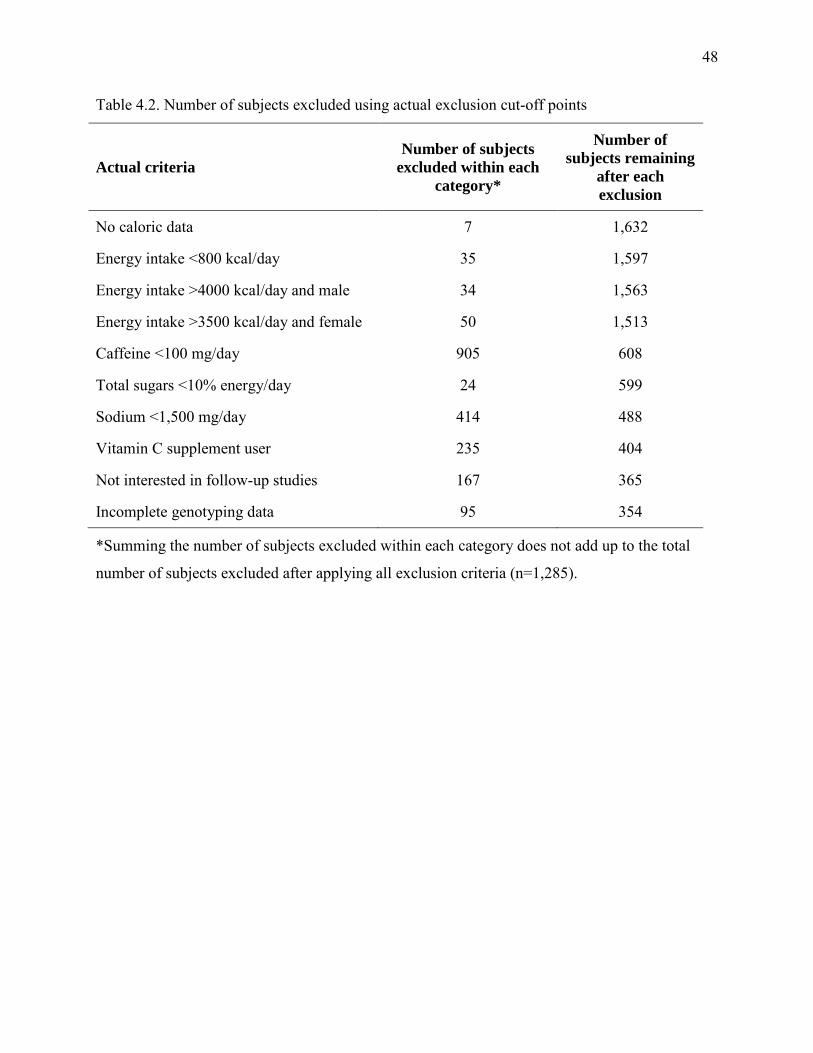
48
Table 4.2. Number of subjects excluded using actual exclusion cut-off points
Actual criteria Number of subjects
excluded within each category*
Number of subjects remaining
after each exclusion
No caloric data 7 1,632
Energy intake <800 kcal/day 35 1,597
Energy intake >4000 kcal/day and male 34 1,563
Energy intake >3500 kcal/day and female 50 1,513
Caffeine <100 mg/day 905 608
Total sugars <10% energy/day 24 599
Sodium <1,500 mg/day 414 488
Vitamin C supplement user 235 404
Not interested in follow-up studies 167 365
Incomplete genotyping data 95 354
*Summing the number of subjects excluded within each category does not add up to the total
number of subjects excluded after applying all exclusion criteria (n=1,285).
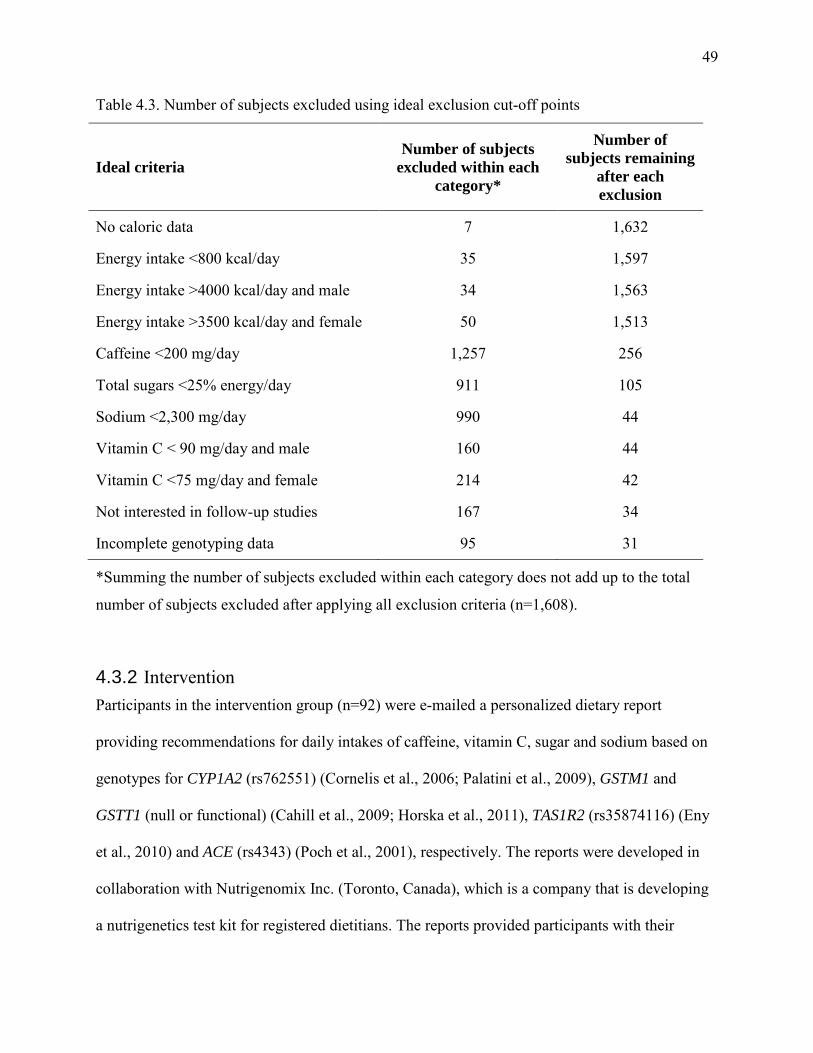
49
Table 4.3. Number of subjects excluded using ideal exclusion cut-off points
Ideal criteria Number of subjects
excluded within each category*
Number of subjects remaining
after each exclusion
No caloric data 7 1,632
Energy intake <800 kcal/day 35 1,597
Energy intake >4000 kcal/day and male 34 1,563
Energy intake >3500 kcal/day and female 50 1,513
Caffeine <200 mg/day 1,257 256
Total sugars <25% energy/day 911 105
Sodium <2,300 mg/day 990 44
Vitamin C < 90 mg/day and male 160 44
Vitamin C <75 mg/day and female 214 42
Not interested in follow-up studies 167 34
Incomplete genotyping data 95 31
*Summing the number of subjects excluded within each category does not add up to the total
number of subjects excluded after applying all exclusion criteria (n=1,608).
4.3.2 Intervention Participants in the intervention group (n=92) were e-mailed a personalized dietary report
providing recommendations for daily intakes of caffeine, vitamin C, sugar and sodium based on
genotypes for CYP1A2 (rs762551) (Cornelis et al., 2006; Palatini et al., 2009), GSTM1 and
GSTT1 (null or functional) (Cahill et al., 2009; Horska et al., 2011), TAS1R2 (rs35874116) (Eny
et al., 2010) and ACE (rs4343) (Poch et al., 2001), respectively. The reports were developed in
collaboration with Nutrigenomix Inc. (Toronto, Canada), which is a company that is developing
a nutrigenetics test kit for registered dietitians. The reports provided participants with their
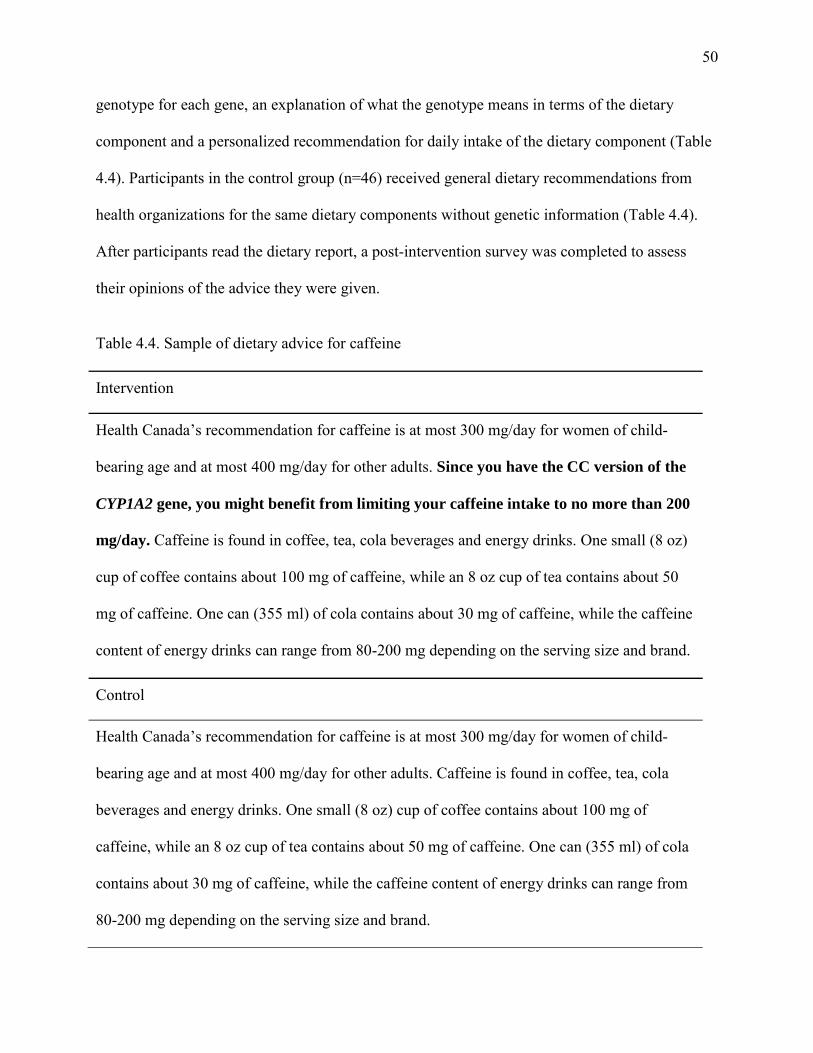
50
genotype for each gene, an explanation of what the genotype means in terms of the dietary
component and a personalized recommendation for daily intake of the dietary component (Table
4.4). Participants in the control group (n=46) received general dietary recommendations from
health organizations for the same dietary components without genetic information (Table 4.4).
After participants read the dietary report, a post-intervention survey was completed to assess
their opinions of the advice they were given.
Table 4.4. Sample of dietary advice for caffeine
Intervention
Health Canada’s recommendation for caffeine is at most 300 mg/day for women of child-
bearing age and at most 400 mg/day for other adults. Since you have the CC version of the
CYP1A2 gene, you might benefit from limiting your caffeine intake to no more than 200
mg/day. Caffeine is found in coffee, tea, cola beverages and energy drinks. One small (8 oz)
cup of coffee contains about 100 mg of caffeine, while an 8 oz cup of tea contains about 50
mg of caffeine. One can (355 ml) of cola contains about 30 mg of caffeine, while the caffeine
content of energy drinks can range from 80-200 mg depending on the serving size and brand.
Control
Health Canada’s recommendation for caffeine is at most 300 mg/day for women of child-
bearing age and at most 400 mg/day for other adults. Caffeine is found in coffee, tea, cola
beverages and energy drinks. One small (8 oz) cup of coffee contains about 100 mg of
caffeine, while an 8 oz cup of tea contains about 50 mg of caffeine. One can (355 ml) of cola
contains about 30 mg of caffeine, while the caffeine content of energy drinks can range from
80-200 mg depending on the serving size and brand.
51
4.3.3 Surveys
Surveys were created using the online survey site SurveyMonkey (www.surveymonkey.com).
Questions included were based on a literature review as well as issues raised in the Harvard
University Personal Genetics Education Project (Personal Genetics Education Project, 2010).
The baseline survey asked how much participants heard about DTC genetic testing to assess their
awareness (Table 4.5). Participants were also asked how much they knew about nutrigenomics.
Survey statements such as “I would take a genetic test to learn more about myself” were used to
assess participants’ motivations to undergo genetic testing (Table 4.6). The post-intervention
survey consisted of statements such as “The dietary recommendations will be useful when I
consider my diet” to assess the participants’ opinions of the value of the dietary
recommendations (Figure 4.2).
4.3.3 Statistical analysis
Statistical analyses were performed using the Statistical Analysis Software (version 9.2; SAS
Institute Inc., Cary, NC). The t-test statistic was used to compare age of subjects in the
intervention vs. control group. The chi square statistic was used to compare all other
characteristics of subjects in the intervention vs. control group. Participants who reported
“strongly agree” or “somewhat agree” to statements on the post-intervention survey were
grouped (“agree”) and the chi-square test was used to compare frequency of “agree” to all other
responses (“strongly disagree”, “somewhat disagree”, and “neither agree nor disagree”). Fisher’s
Exact Test was used when a response category consisted of fewer than 5 counts. Significant p-
values are two-sided and less than 0.05.
52
4.4 Results
4.4.1 Response rate and description of participants
Of the 157 participants who were sent the baseline survey, 149 participants completed the survey
giving a response rate of 95% (Figure 4.1). The mean ± standard deviation age of the participants
was 25 ± 4 years old and 76% were female (Table 4.1). The participants were highly educated
with 87% having a university or college degree. Of the 149 participants who completed the
baseline survey, 138 were randomized into an intervention or control group. The remaining 11
participants did not respond to subsequent e-mail attempts. There were no significant differences
between characteristics of participants in the control or intervention group (Table 4.1).
4.4.2 Baseline survey
Approximately half of the participants (52%) reported having heard “nothing” about DTC
genetic testing, while 18% reported hearing “a fair amount” or “a lot”. A smaller proportion of
participants reported knowing “nothing” about nutrigenomics (30%), with just over half
reporting that they knew “a little bit” about the science (52%) (Table 4.5). Interest in the
relationship between diet and genetics was high, with 90% of participants reporting either
“strongly agree” or “somewhat agree” to the survey statement. The majority of participants
(87%) also agreed that they would benefit from learning about how their genetic make-up would
affect their diet. Consistent with this, 75% of participants agreed that learning about their genetic
make-up would affect what they ate. The greatest motivators participants reported for
undergoing genetic testing were to learn more about themselves and to encourage themselves to
adopt a healthier lifestyle (86% and 83%, respectively), while 73% of participants agreed that
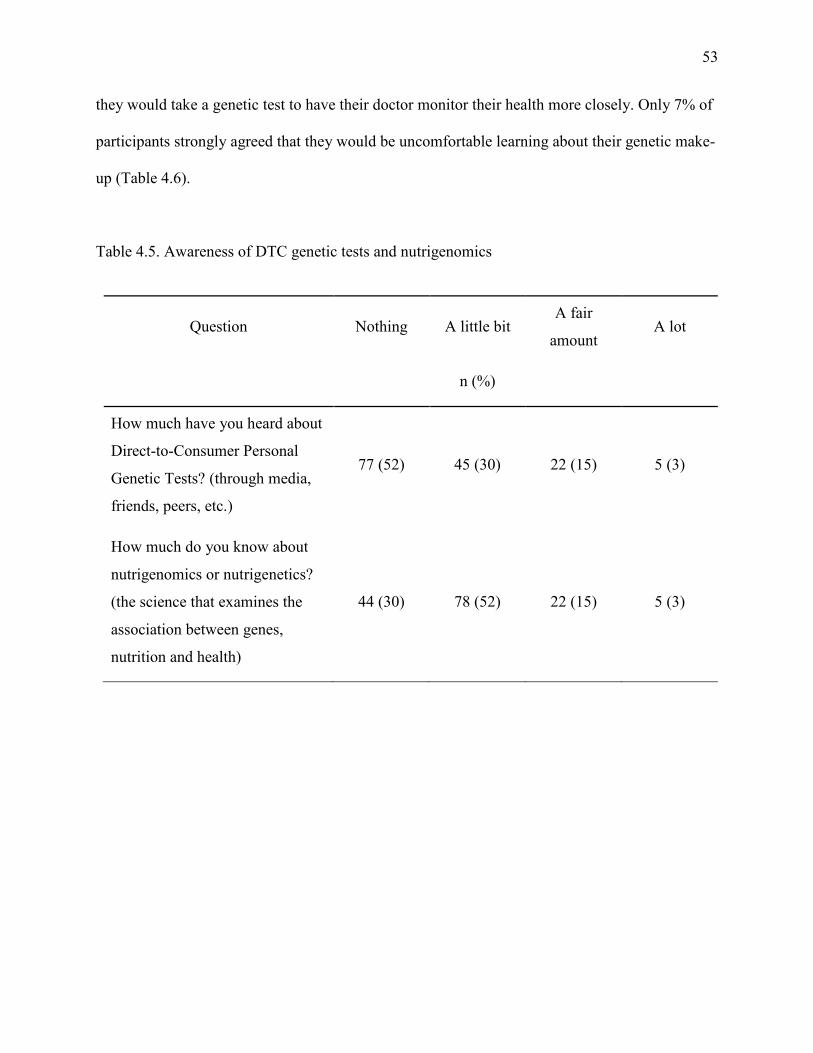
53
they would take a genetic test to have their doctor monitor their health more closely. Only 7% of
participants strongly agreed that they would be uncomfortable learning about their genetic make-
up (Table 4.6).
Table 4.5. Awareness of DTC genetic tests and nutrigenomics
Question Nothing A little bit A fair
amount A lot
n (%)
How much have you heard about
Direct-to-Consumer Personal
Genetic Tests? (through media,
friends, peers, etc.)
77 (52) 45 (30) 22 (15) 5 (3)
How much do you know about
nutrigenomics or nutrigenetics?
(the science that examines the
association between genes,
nutrition and health)
44 (30) 78 (52) 22 (15) 5 (3)
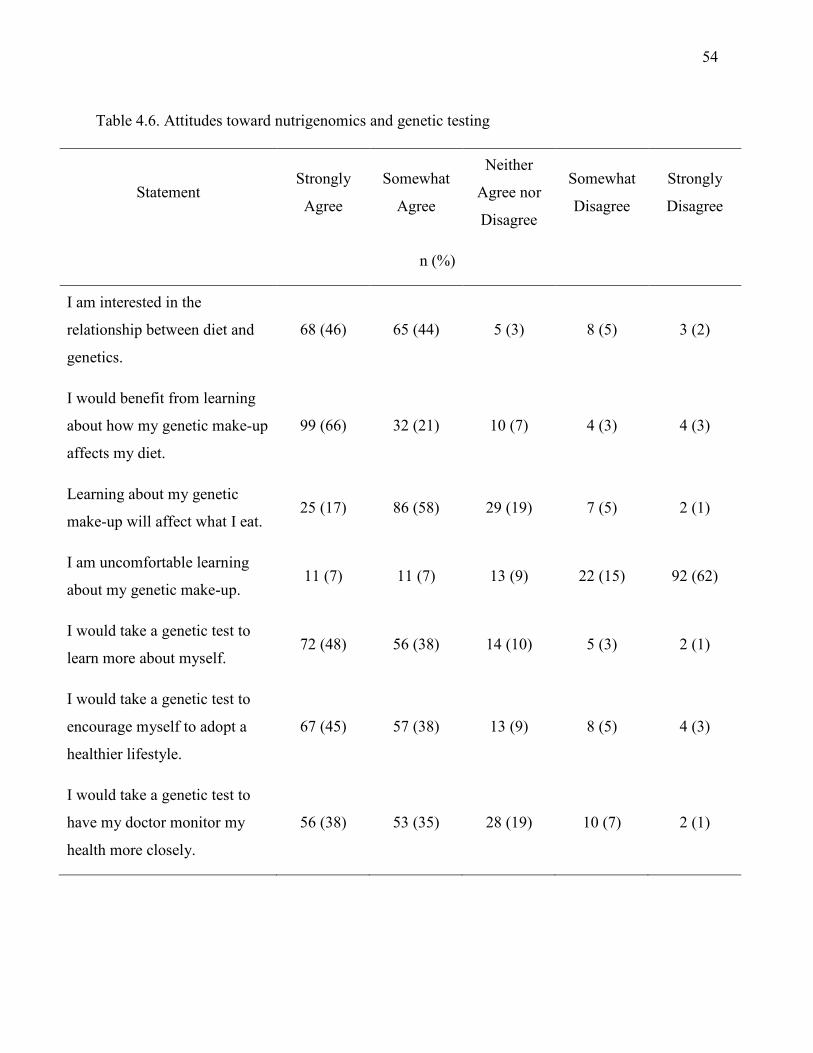
54
Table 4.6. Attitudes toward nutrigenomics and genetic testing
Statement Strongly
Agree
Somewhat
Agree
Neither
Agree nor
Disagree
Somewhat
Disagree
Strongly
Disagree
n (%)
I am interested in the
relationship between diet and
genetics.
68 (46) 65 (44) 5 (3) 8 (5) 3 (2)
I would benefit from learning
about how my genetic make-up
affects my diet.
99 (66) 32 (21) 10 (7) 4 (3) 4 (3)
Learning about my genetic
make-up will affect what I eat. 25 (17) 86 (58) 29 (19) 7 (5) 2 (1)
I am uncomfortable learning
about my genetic make-up. 11 (7) 11 (7) 13 (9) 22 (15) 92 (62)
I would take a genetic test to
learn more about myself. 72 (48) 56 (38) 14 (10) 5 (3) 2 (1)
I would take a genetic test to
encourage myself to adopt a
healthier lifestyle.
67 (45) 57 (38) 13 (9) 8 (5) 4 (3)
I would take a genetic test to
have my doctor monitor my
health more closely.
56 (38) 53 (35) 28 (19) 10 (7) 2 (1)
55
4.4.3 Post-intervention survey
After receiving the dietary report, a greater proportion of participants in the intervention group
agreed that they understood the dietary advice they received (93% (I) vs. 78% (C); p=0.009). As
expected, more participants in the intervention group agreed that the recommendations they
received were new to them (86% (I) vs. 28% (C); p<0.0001). Participants in the intervention
group were also more likely to agree that they enjoyed learning about the recommendations
(96% (I) vs. 72% (C); p<0.0001) and only 9% agreed that they felt uneasy learning about their
genetics (of which only one person reported “strongly agree”). In addition, participants in the
intervention group were more likely to agree that the recommendations would be useful when
considering their diet (88% (I) vs. 72% (C); p=0.02) and that they would like to know more
about the dietary recommendations they were given (95% (I) vs. 76% (C); p<0.0001) (Figure
4.2).
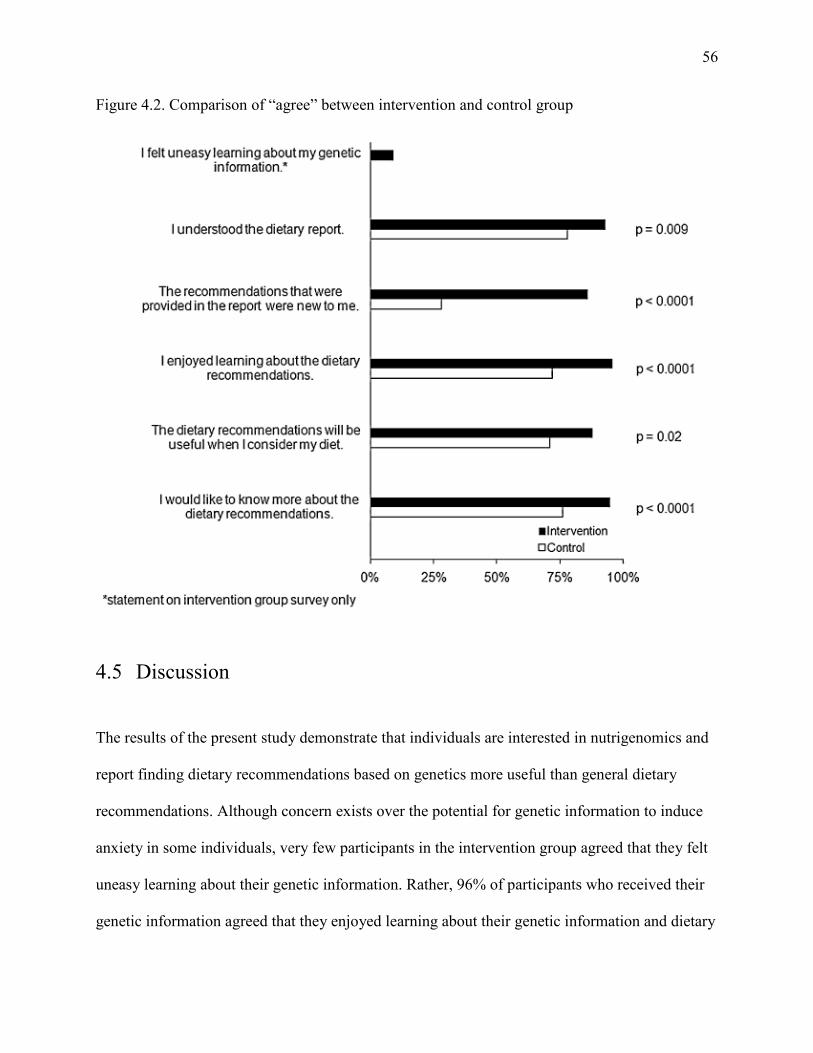
56
Figure 4.2. Comparison of “agree” between intervention and control group
4.5 Discussion
The results of the present study demonstrate that individuals are interested in nutrigenomics and
report finding dietary recommendations based on genetics more useful than general dietary
recommendations. Although concern exists over the potential for genetic information to induce
anxiety in some individuals, very few participants in the intervention group agreed that they felt
uneasy learning about their genetic information. Rather, 96% of participants who received their
genetic information agreed that they enjoyed learning about their genetic information and dietary
57
recommendations. This finding suggests that providing this kind of information is not likely to
induce anxiety and that young adults may embrace a new era of personalized nutrition that could
emerge through the advancement of personalized genomics. However, the nature of the genetic
information that was provided in this study might have been perceived as less serious than
genetic information related to disease risk. Although the participants in this study had an
awareness of the science of nutrigenomics, only 18% reported an awareness of DTC genetic
testing while 52% reported no awareness. This finding is consistent with previous surveys of the
general public conducted in the UK and US (Cherkas et al., 2010; Goddard et al., 2009; Goddard
et al., 2007; Kolor et al., 2009). Despite the considerable attention DTC genetic testing has
received in recent years (Lynch et al., 2011), this finding suggests that media coverage of DTC
genetic testing has not yet greatly impacted young adults.
Scientific literacy and communication of genetic information are important issues to
consider when studying the societal impact of DTC genetic testing (McBride et al., 2010). The
literacy demands and quality of informational content across DTC genetic testing websites have
been shown to vary (Lachance et al., 2010) and there is concern that consumers may misinterpret
or not understand DTC genetic test results (Leighton et al., 2011). In the present study, a greater
proportion of participants in the intervention group agreed that they understood the dietary report
they were given, suggesting that dietary recommendations based on genetics can be more
understandable than general dietary recommendations. This implies that providing individuals
with clear, personalized nutritional advice may result in greater understanding. An important
strength of the present study is the use of a randomized controlled trial, which eliminates the
possibility of confounding and allows for direct comparisons to be made between experimental
groups.
58
In considering the results of this study, some limitations should be noted. In the present
study, no in-person contact was made with study participants, potentially affecting the reliability
of the results. However, DTC genetic testing can be completed without in-person contact, so the
nature of this study closely mimics the nature of DTC genetic testing. Seventy-six percent of
participants in this study were females and this affected our ability to report any sex-specific
findings. However, excluding the males did not materially alter any of the results, suggesting that
there were no major differences between men and women in this population. The age of
participants in the current study was between 20-35 years old, so findings might not be
representative of other age groups. In addition, the participants were highly educated and
previously participated in a nutrigenomics study. This could explain the high degree of reported
understanding of the gene-based dietary recommendations, although participants in the control
group reported less understanding of the general dietary recommendations, yet were equally
educated.
This study is the first to compare the impact of genotype-based personalized dietary
advice with general dietary recommendations. Dietary recommendations based on genotype were
reported to be more understandable than general dietary recommendations and were also
reported to be more useful. Participants reported that they would not be uncomfortable learning
about their own genetic information. Consistent with this, participants in the intervention group
did not express discomfort in learning about their genetics and were more likely to report
enjoyment in learning about the dietary recommendations they were given, as well as a greater
desire to know more about the recommendations. Direct-to-consumer genetic tests based on
personalized nutrition might, therefore, be more valuable that those based solely on disease risk
predictions.
59
Chapter 5
Disclosure of genetic information and change in dietary
intake: a randomized controlled trial
Adapted from: Nielsen DE and El-Sohemy A. (2014) Disclosure of genetic information and
change in dietary intake: a randomized controlled trial. (Under review)
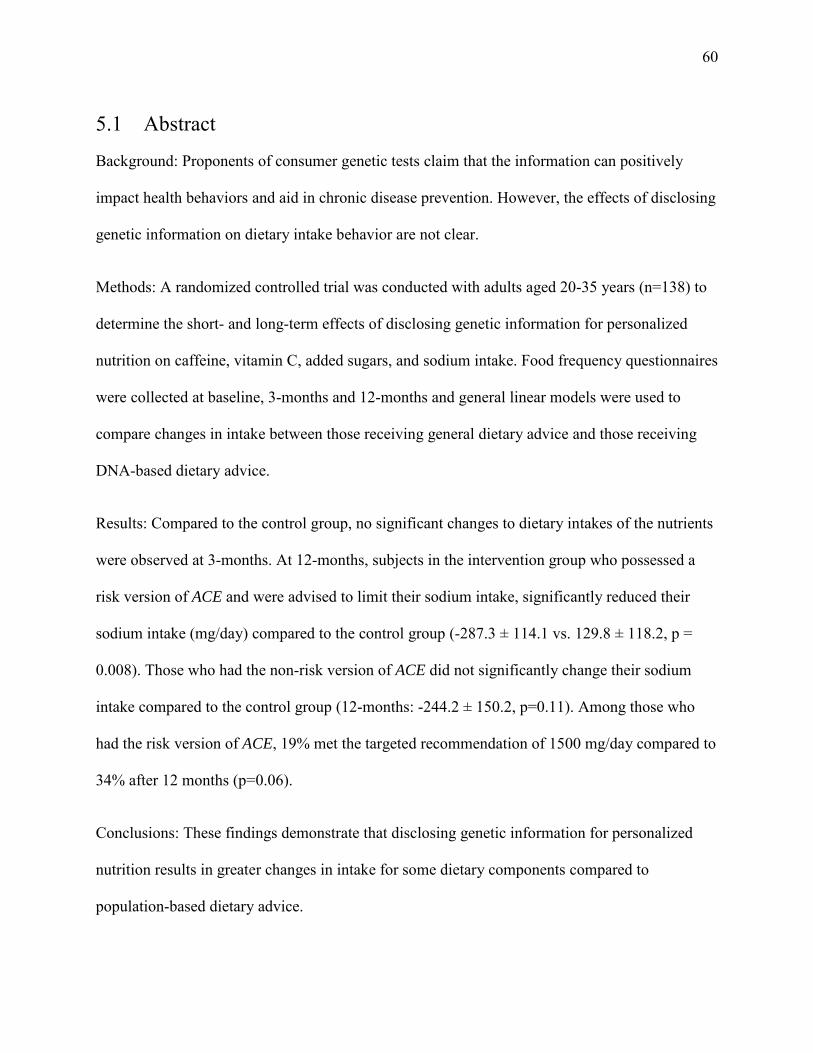
60
5.1 Abstract
Background: Proponents of consumer genetic tests claim that the information can positively
impact health behaviors and aid in chronic disease prevention. However, the effects of disclosing
genetic information on dietary intake behavior are not clear.
Methods: A randomized controlled trial was conducted with adults aged 20-35 years (n=138) to
determine the short- and long-term effects of disclosing genetic information for personalized
nutrition on caffeine, vitamin C, added sugars, and sodium intake. Food frequency questionnaires
were collected at baseline, 3-months and 12-months and general linear models were used to
compare changes in intake between those receiving general dietary advice and those receiving
DNA-based dietary advice.
Results: Compared to the control group, no significant changes to dietary intakes of the nutrients
were observed at 3-months. At 12-months, subjects in the intervention group who possessed a
risk version of ACE and were advised to limit their sodium intake, significantly reduced their
sodium intake (mg/day) compared to the control group (-287.3 ± 114.1 vs. 129.8 ± 118.2, p =
0.008). Those who had the non-risk version of ACE did not significantly change their sodium
intake compared to the control group (12-months: -244.2 ± 150.2, p=0.11). Among those who
had the risk version of ACE, 19% met the targeted recommendation of 1500 mg/day compared to
34% after 12 months (p=0.06).
Conclusions: These findings demonstrate that disclosing genetic information for personalized
nutrition results in greater changes in intake for some dietary components compared to
population-based dietary advice.
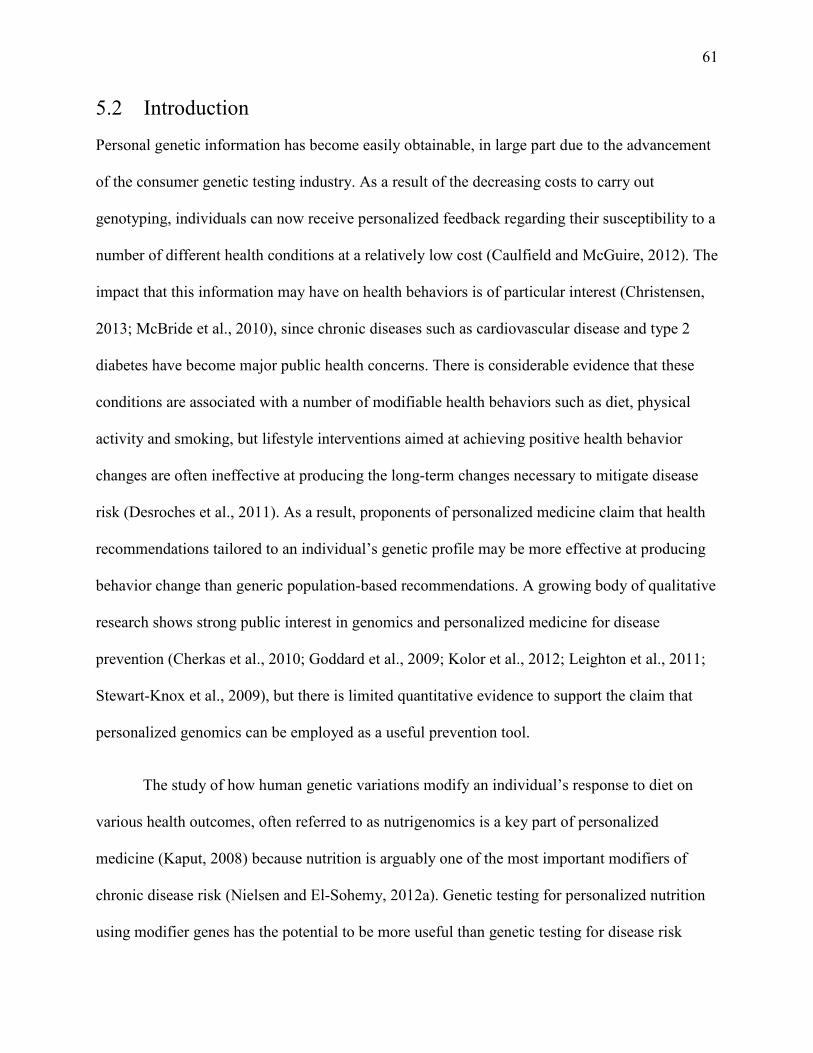
61
5.2 Introduction
Personal genetic information has become easily obtainable, in large part due to the advancement
of the consumer genetic testing industry. As a result of the decreasing costs to carry out
genotyping, individuals can now receive personalized feedback regarding their susceptibility to a
number of different health conditions at a relatively low cost (Caulfield and McGuire, 2012). The
impact that this information may have on health behaviors is of particular interest (Christensen,
2013; McBride et al., 2010), since chronic diseases such as cardiovascular disease and type 2
diabetes have become major public health concerns. There is considerable evidence that these
conditions are associated with a number of modifiable health behaviors such as diet, physical
activity and smoking, but lifestyle interventions aimed at achieving positive health behavior
changes are often ineffective at producing the long-term changes necessary to mitigate disease
risk (Desroches et al., 2011). As a result, proponents of personalized medicine claim that health
recommendations tailored to an individual’s genetic profile may be more effective at producing
behavior change than generic population-based recommendations. A growing body of qualitative
research shows strong public interest in genomics and personalized medicine for disease
prevention (Cherkas et al., 2010; Goddard et al., 2009; Kolor et al., 2012; Leighton et al., 2011;
Stewart-Knox et al., 2009), but there is limited quantitative evidence to support the claim that
personalized genomics can be employed as a useful prevention tool.
The study of how human genetic variations modify an individual’s response to diet on
various health outcomes, often referred to as nutrigenomics is a key part of personalized
medicine (Kaput, 2008) because nutrition is arguably one of the most important modifiers of
chronic disease risk (Nielsen and El-Sohemy, 2012a). Genetic testing for personalized nutrition
using modifier genes has the potential to be more useful than genetic testing for disease risk
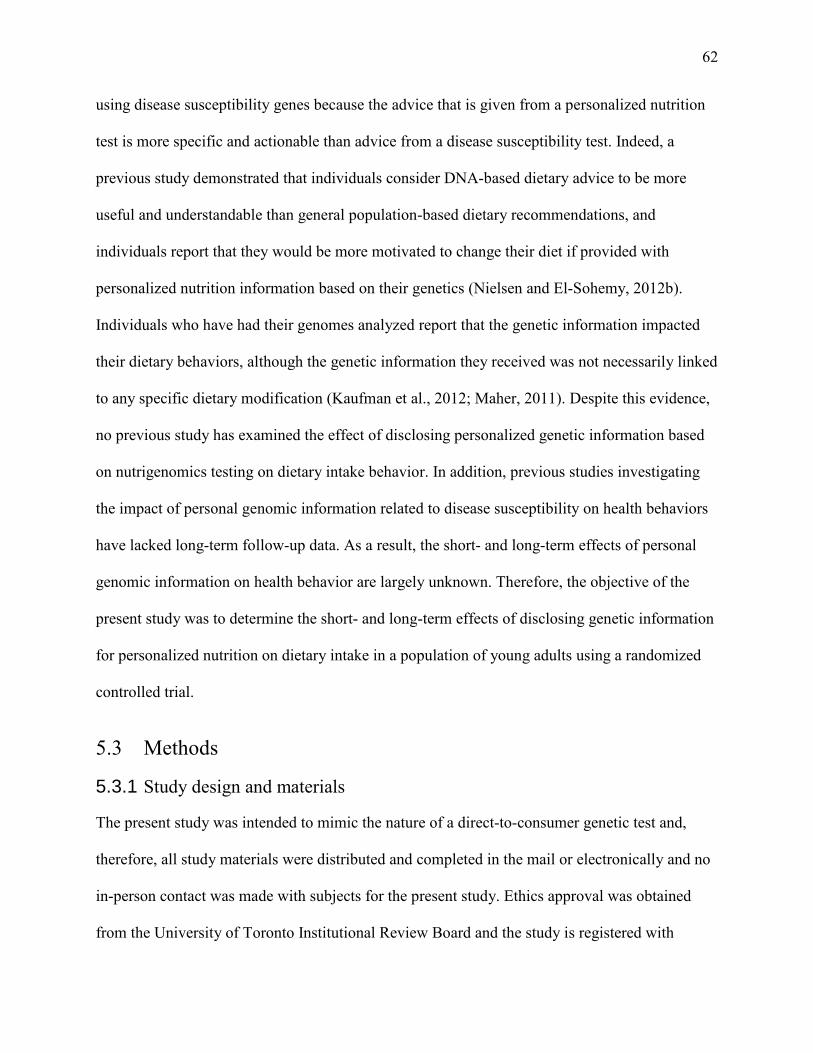
62
using disease susceptibility genes because the advice that is given from a personalized nutrition
test is more specific and actionable than advice from a disease susceptibility test. Indeed, a
previous study demonstrated that individuals consider DNA-based dietary advice to be more
useful and understandable than general population-based dietary recommendations, and
individuals report that they would be more motivated to change their diet if provided with
personalized nutrition information based on their genetics (Nielsen and El-Sohemy, 2012b).
Individuals who have had their genomes analyzed report that the genetic information impacted
their dietary behaviors, although the genetic information they received was not necessarily linked
to any specific dietary modification (Kaufman et al., 2012; Maher, 2011). Despite this evidence,
no previous study has examined the effect of disclosing personalized genetic information based
on nutrigenomics testing on dietary intake behavior. In addition, previous studies investigating
the impact of personal genomic information related to disease susceptibility on health behaviors
have lacked long-term follow-up data. As a result, the short- and long-term effects of personal
genomic information on health behavior are largely unknown. Therefore, the objective of the
present study was to determine the short- and long-term effects of disclosing genetic information
for personalized nutrition on dietary intake in a population of young adults using a randomized
controlled trial.
5.3 Methods
5.3.1 Study design and materials
The present study was intended to mimic the nature of a direct-to-consumer genetic test and,
therefore, all study materials were distributed and completed in the mail or electronically and no
in-person contact was made with subjects for the present study. Ethics approval was obtained
from the University of Toronto Institutional Review Board and the study is registered with
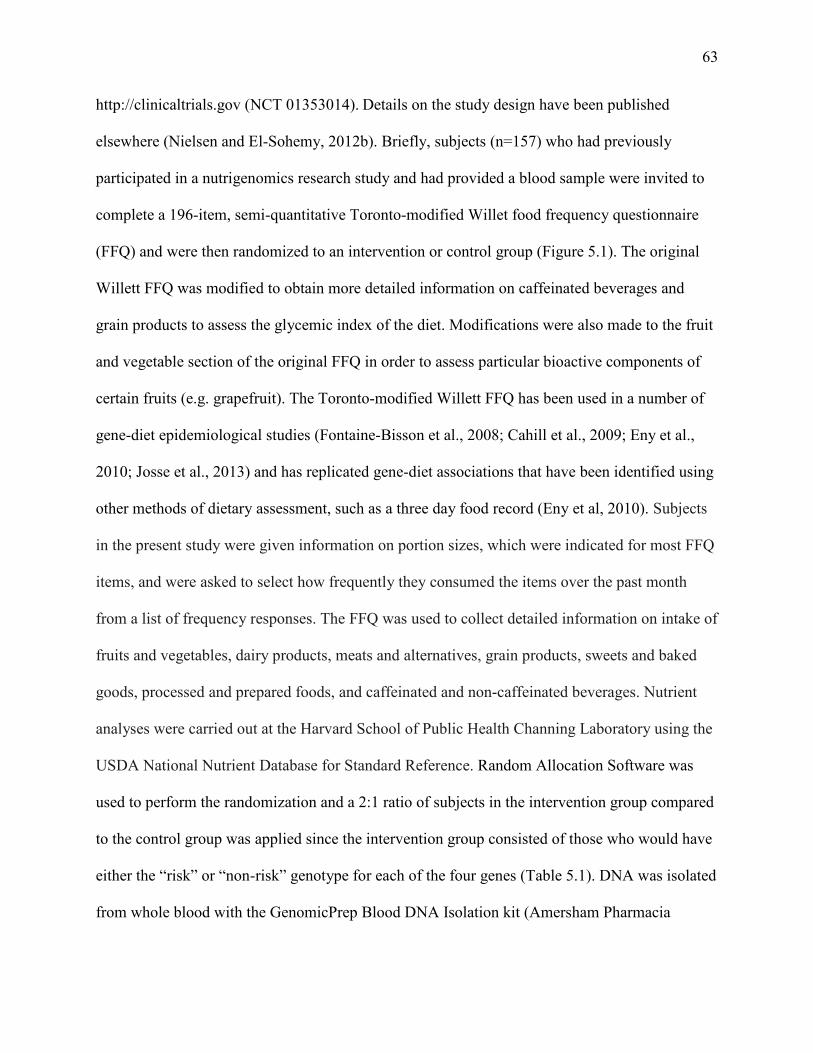
63
http://clinicaltrials.gov (NCT 01353014). Details on the study design have been published
elsewhere (Nielsen and El-Sohemy, 2012b). Briefly, subjects (n=157) who had previously
participated in a nutrigenomics research study and had provided a blood sample were invited to
complete a 196-item, semi-quantitative Toronto-modified Willet food frequency questionnaire
(FFQ) and were then randomized to an intervention or control group (Figure 5.1). The original
Willett FFQ was modified to obtain more detailed information on caffeinated beverages and
grain products to assess the glycemic index of the diet. Modifications were also made to the fruit
and vegetable section of the original FFQ in order to assess particular bioactive components of
certain fruits (e.g. grapefruit). The Toronto-modified Willett FFQ has been used in a number of
gene-diet epidemiological studies (Fontaine-Bisson et al., 2008; Cahill et al., 2009; Eny et al.,
2010; Josse et al., 2013) and has replicated gene-diet associations that have been identified using
other methods of dietary assessment, such as a three day food record (Eny et al, 2010). Subjects
in the present study were given information on portion sizes, which were indicated for most FFQ
items, and were asked to select how frequently they consumed the items over the past month
from a list of frequency responses. The FFQ was used to collect detailed information on intake of
fruits and vegetables, dairy products, meats and alternatives, grain products, sweets and baked
goods, processed and prepared foods, and caffeinated and non-caffeinated beverages. Nutrient
analyses were carried out at the Harvard School of Public Health Channing Laboratory using the
USDA National Nutrient Database for Standard Reference. Random Allocation Software was
used to perform the randomization and a 2:1 ratio of subjects in the intervention group compared
to the control group was applied since the intervention group consisted of those who would have
either the “risk” or “non-risk” genotype for each of the four genes (Table 5.1). DNA was isolated
from whole blood with the GenomicPrep Blood DNA Isolation kit (Amersham Pharmacia

64
Biotech Inc, Piscataway, NJ) and genotyping was completed using either real-time polymerase
chain reaction on an ABI 7000 Sequence Detection System (Applied Biosystems) or a multiplex
restriction fragment length polymorphism (RFLP) polymerase chain reaction method, as
described previously (Cahill et al., 2009; Eny et al., 2009). Genotyping was verified by using
positive control subjects in each 96-well plate as well as a second genotyping of ~5% of a
random selection of samples with 100% concordance.
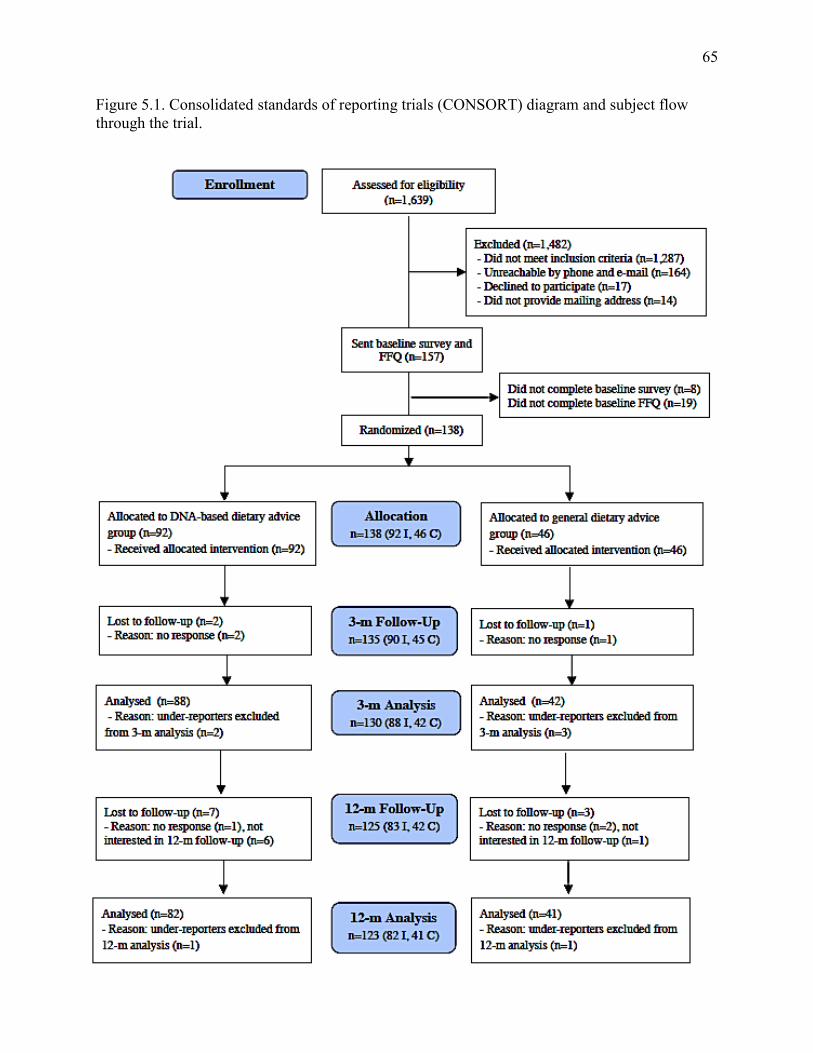
65
Figure 5.1. Consolidated standards of reporting trials (CONSORT) diagram and subject flow through the trial.
66
5.3.2 Dietary reports and recommendations
Subjects in the intervention group were genotyped for variants that affect caffeine metabolism
(CYP1A2, rs762551) (Cornelis et al., 2006; Palatini et al., 2009), vitamin C utilization (GSTT1
and GSTM1, null or functional) (Cahill et al., 2009), sweet taste perception (TAS1R2,
rs35874116 ) (Eny et al., 2010), and sodium-sensitivity (ACE, rs4343) (Giner et al., 2000; Poch
et al., 2001) (Table 5.1). Rs4343 is in complete linkage disequilibrium with the I/D ACE variant
(Glenn et al., 2009). These genes were selected as representative sample tests from consumer
genetic testing companies. All subjects in the intervention group were informed of their
genotypes and given a corresponding DNA-based dietary recommendation for daily intake of
caffeine, vitamin C, added sugars and sodium (Nutrigenomix Inc., Toronto, Canada). Those who
possessed the genotype that has been associated with increased risk of a health outcome when
consuming above or below a certain daily amount were given a “targeted” dietary
recommendation. For caffeine and sodium, this recommendation was more stringent than the
current general recommendation for daily intake and was based on previous work that evaluated
health outcomes according to genotype at different levels of intake (Cornelis et al., 2006; Palatini
et al., 2009; Giner et al., 2000; Poch et al., 2001). For added sugars and vitamin C, subjects were
informed to be particularly mindful of meeting the current general recommendation for daily
intake, since no previous study has examined how individuals respond to consuming various
levels of these nutrients according to genotype and, therefore, a different intake level could not
be recommended. Subjects who possessed the genotype that has not been associated with
increased risk received the current general recommendation for daily intake (Nawrot et al., 2003;
Nishida et al., 2004; National Research Council, 2006). The control group was given a report of
current general recommendations for the same nutrients without genetic information (Table 5.1).
67
Information on serving sizes and dietary sources of the dietary components were
provided in the advice report. Subjects were e-mailed a monthly reminder of their dietary report
and additional FFQs were collected at 3- and 12-month follow-up assessments. Subjects were
given a $10 honorarium for each follow-up assessment they completed, for a total payment of
$20 if they completed the full 12-month study. Dietary intakes were self-reported by participants
on the FFQ with no assistance from study personnel, and the nutrient analyses were made
without knowledge of study group assignment.
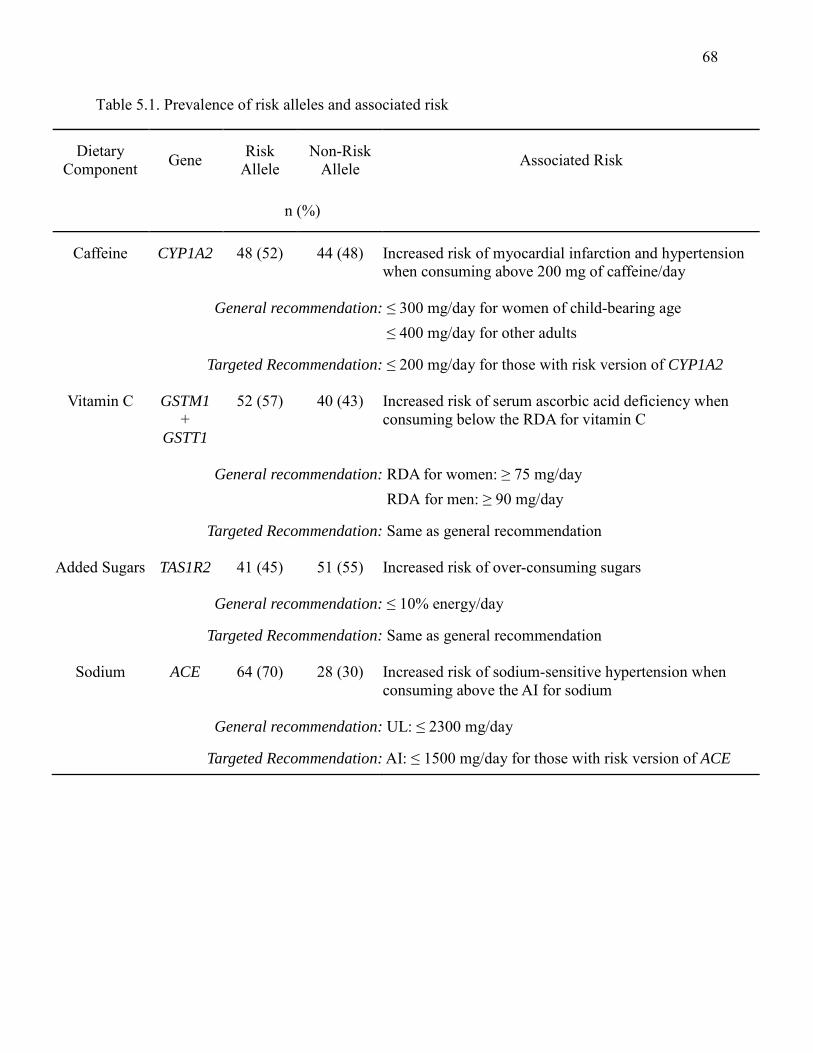
68
Table 5.1. Prevalence of risk alleles and associated risk
Dietary Component Gene Risk
Allele Non-Risk
Allele Associated Risk
n (%)
Caffeine CYP1A2 48 (52) 44 (48) Increased risk of myocardial infarction and hypertension when consuming above 200 mg of caffeine/day
General recommendation: ≤ 300 mg/day for women of child-bearing age ≤ 400 mg/day for other adults
Targeted Recommendation: ≤ 200 mg/day for those with risk version of CYP1A2
Vitamin C GSTM1 +
GSTT1
52 (57) 40 (43) Increased risk of serum ascorbic acid deficiency when consuming below the RDA for vitamin C
General recommendation: RDA for women: ≥ 75 mg/day RDA for men: ≥ 90 mg/day
Targeted Recommendation: Same as general recommendation
Added Sugars TAS1R2 41 (45) 51 (55) Increased risk of over-consuming sugars
General recommendation: ≤ 10% energy/day
Targeted Recommendation: Same as general recommendation
Sodium ACE 64 (70) 28 (30) Increased risk of sodium-sensitive hypertension when consuming above the AI for sodium
General recommendation: UL: ≤ 2300 mg/day
Targeted Recommendation: AI: ≤ 1500 mg/day for those with risk version of ACE
69
5.3.3 Statistical analysis
Statistical analyses were performed using the Statistical Analysis Software (version 9.2; SAS
Institute Inc., Cary, NC). The α error was set at 0.05 and all reported p-values are two-sided.
Subject characteristics between the intervention and control group were compared using a Chi-
square test for categorical variables and a Student’s t-test for continuous variables. The
distributions of nutrient intakes were examined and a log or square root transformation was
applied to those that deviated from normality. In these cases, the p-values from models using
transformed values are reported, but untransformed means and measures of spread are reported
to facilitate interpretation. Subjects who were likely under-reporters (consuming less than 800
kcal/day) were excluded from the analyses, since dietary intake data from these individuals may
not have been reliable.
Baseline mean intakes of vitamin C, sugar, sodium and caffeine were compared between
ethnocultural groups using general linear models to determine if any significant dietary
differences were present between groups at the start of the study. General linear models were
also conducted to test for changes in dietary intakes between baseline and 3-months, and baseline
and 12-months, in order to determine the effect of the dietary advice over a short- and long-term
period. The Tukey-Kramer test for multiple comparisons was applied to determine whether any
changes in intake of the intervention groups differed from the change in intake of the control
group. The Chi-square test was used to compare the proportion of subjects meeting the
recommendations for intake between baseline and the follow-up assessments. Fisher’s Exact Test
was used if a proportion category consisted of fewer than 5 subjects.
Changes in dietary sources that were included in the dietary advice report were assessed
70
for nutrients that significantly changed between study groups at either the short-term or long-
term follow-up assessment. Categorical FFQ food items were converted into continuous
servings/day variables and a square root transformation was applied if a variable’s distribution
deviated from normality. A general linear model with the Tukey-Kramer test for multiple
comparisons was used to compare intake changes between the control and intervention groups.
5.4 Results
5.4.1 Subject characteristics
Of the 157 subjects who were randomized, 125 completed the 12-month study giving an overall
retention rate of 80%. Moreover, 91% of subjects who were randomized (n=138) completed the
12-month study. The mean ± SD age of the participants was 26.5 ± 3.0 years and 78% were
female. The study population was multi-ethnic with Caucasian, East Asian, and South Asian
groups representing the majority of ethnic backgrounds. Over half of the population possessed at
least an undergraduate degree. There were no significant differences between the characteristics
of participants in the intervention group when compared to the control group (Table 5.2).
However, a significant difference in baseline sodium intake (mg/day) was observed between the
East Asian and Caucasian groups (mean ± SE: 1837 ± 147 vs. 2319 ± 88, p=0.03). As a result,
the general linear models examining changes in dietary intakes are adjusted for ethnocultural
group. At baseline, the proportion of subjects who did not meet the general recommendation for
caffeine, vitamin C, added sugars and sodium were 9%, 14%, 24% and 39%, respectively. Thirty
eight percent of subjects did not meet the targeted recommendation (for those with elevated risk)
for caffeine intake at baseline, while 80% did not meet the targeted recommendation for sodium
intake. The targeted recommendation for vitamin C and added sugars was the same as the
general recommendations.
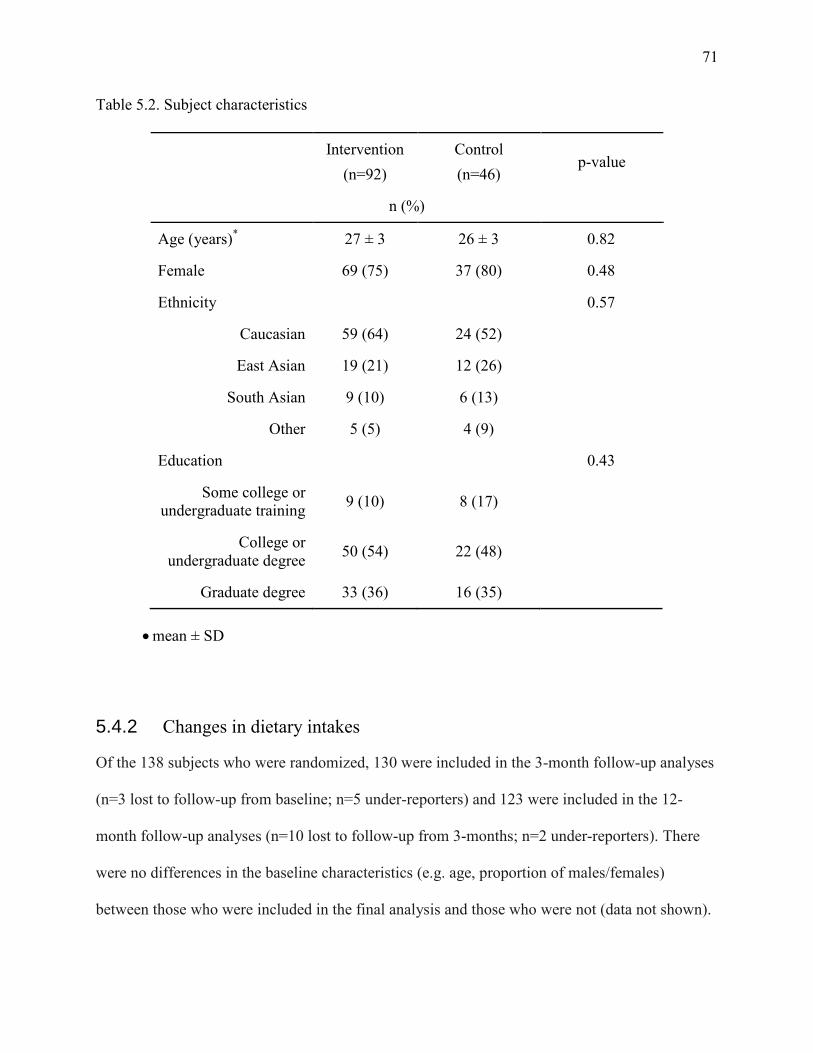
71
Table 5.2. Subject characteristics
Intervention
(n=92) Control (n=46)
p-value
n (%)
Age (years)* 27 ± 3 26 ± 3 0.82
Female 69 (75) 37 (80) 0.48
Ethnicity 0.57
Caucasian 59 (64) 24 (52)
East Asian 19 (21) 12 (26)
South Asian 9 (10) 6 (13)
Other 5 (5) 4 (9)
Education 0.43
Some college or undergraduate training 9 (10) 8 (17)
College or undergraduate degree 50 (54) 22 (48)
Graduate degree 33 (36) 16 (35)
• mean ± SD
5.4.2 Changes in dietary intakes
Of the 138 subjects who were randomized, 130 were included in the 3-month follow-up analyses
(n=3 lost to follow-up from baseline; n=5 under-reporters) and 123 were included in the 12-
month follow-up analyses (n=10 lost to follow-up from 3-months; n=2 under-reporters). There
were no differences in the baseline characteristics (e.g. age, proportion of males/females)
between those who were included in the final analysis and those who were not (data not shown).
72
Unadjusted results are shown in Table 5.3. In the adjusted analysis, no significant changes from
baseline were observed for intakes of caffeine, vitamin C, added sugars, or sodium at the 3-
month follow-up among subjects in the intervention group who carried a risk version of the
corresponding gene (intervention risk group) or among subjects who carried the non-risk version
(intervention non-risk group) when compared to the control group. At the 12-month follow-up,
subjects in the intervention group who were informed that they possessed the risk version of the
ACE gene, and who were given the targeted advice to consume below the Adequate Intake (AI)
of 1500 mg of sodium per day, significantly reduced their mean sodium intake (mg/day) from
baseline when compared to the control group (mean ± SE: -287.3 ± 114.1 vs. 129.8 ± 118.2, p =
0.008), which did not receive genetic information and was given the general recommendation for
sodium intake (Tolerable Upper Intake Level (UL): ≤2300 mg/day). The mean change in sodium
intake among subjects who were informed that they possessed the non-risk version of the ACE
gene, and who were advised to follow the general recommendation for sodium intake, did not
differ from the change in intake of the control group at 12-months (mean ± SE: -244.2 ± 150.2
vs. 129.8 ± 118.2, p=0.11). The mean changes in intakes from baseline for caffeine, vitamin C
and added sugars did not differ from the control group at the 12-month follow-up among either
the intervention-risk or intervention non-risk groups (Table 5.4). Table 5.5 shows results further
adjusted for energy intake, which did not materially alter the findings.
At the 12-month follow-up assessment 66% of subjects in the intervention risk group,
65% of subjects in the intervention non-risk group and 68% of subjects in the control group met
the general recommendation for sodium intake of ≤2300 mg/day. In addition, 34% of subjects in
the intervention risk group, 19% of subjects in the intervention non-risk group and 24% of
subjects in the control group met the targeted recommendation for sodium intake of ≤1500
73
mg/day. These proportions were not significantly different between the control and intervention
groups (data not shown). Among those in the intervention group who had the risk version of the
ACE gene, 19% met the targeted recommendation of ≤1500 mg/day at baseline compared to 34%
after 12 months (p=0.06) and 59% met the general recommendation of ≤2300 mg/day at baseline
compared to 66% after 12 months (p=0.41). No changes were observed in food items that were
included with the sodium advice between the control and intervention groups at 12-months
(Table 5.6).
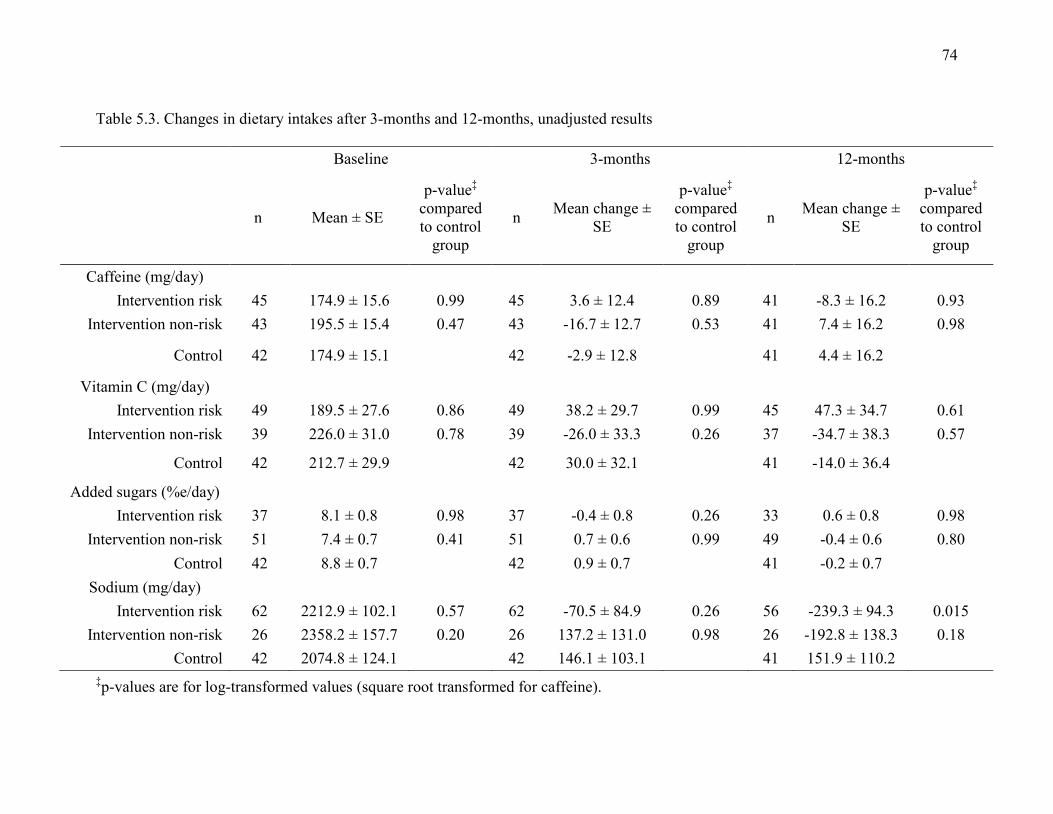
74
Table 5.3. Changes in dietary intakes after 3-months and 12-months, unadjusted results
Baseline 3-months 12-months
n Mean ± SE
p-value‡ compared to control
group
n Mean change ± SE
p-value‡ compared to control
group
n Mean change ± SE
p-value‡ compared to control
group
Caffeine (mg/day) Intervention risk 45 174.9 ± 15.6 0.99 45 3.6 ± 12.4 0.89 41 -8.3 ± 16.2 0.93
Intervention non-risk 43 195.5 ± 15.4 0.47 43 -16.7 ± 12.7 0.53 41 7.4 ± 16.2 0.98
Control 42 174.9 ± 15.1 42 -2.9 ± 12.8 41 4.4 ± 16.2
Vitamin C (mg/day) Intervention risk 49 189.5 ± 27.6 0.86 49 38.2 ± 29.7 0.99 45 47.3 ± 34.7 0.61
Intervention non-risk 39 226.0 ± 31.0 0.78 39 -26.0 ± 33.3 0.26 37 -34.7 ± 38.3 0.57
Control 42 212.7 ± 29.9 42 30.0 ± 32.1 41 -14.0 ± 36.4
Added sugars (%e/day) Intervention risk 37 8.1 ± 0.8 0.98 37 -0.4 ± 0.8 0.26 33 0.6 ± 0.8 0.98
Intervention non-risk 51 7.4 ± 0.7 0.41 51 0.7 ± 0.6 0.99 49 -0.4 ± 0.6 0.80 Control 42 8.8 ± 0.7 42 0.9 ± 0.7 41 -0.2 ± 0.7
Sodium (mg/day) Intervention risk 62 2212.9 ± 102.1 0.57 62 -70.5 ± 84.9 0.26 56 -239.3 ± 94.3 0.015
Intervention non-risk 26 2358.2 ± 157.7 0.20 26 137.2 ± 131.0 0.98 26 -192.8 ± 138.3 0.18 Control 42 2074.8 ± 124.1 42 146.1 ± 103.1 41 151.9 ± 110.2
‡p-values are for log-transformed values (square root transformed for caffeine).
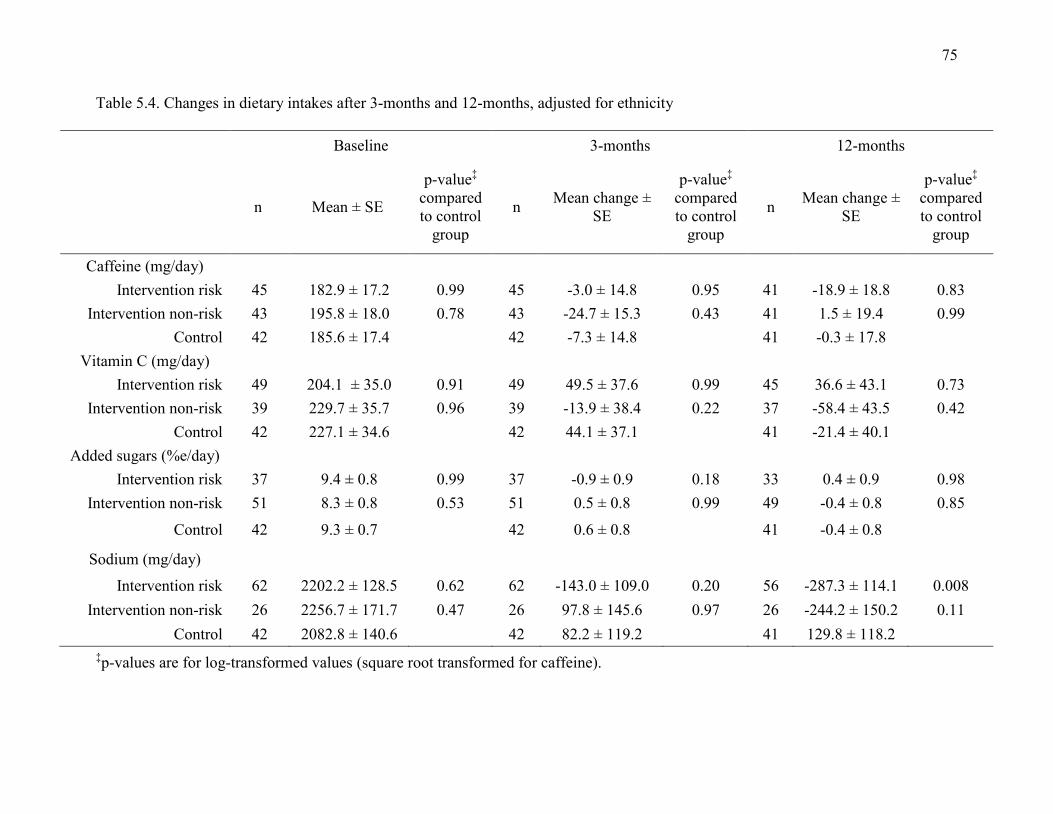
75
Table 5.4. Changes in dietary intakes after 3-months and 12-months, adjusted for ethnicity
Baseline 3-months 12-months
n Mean ± SE
p-value‡ compared to control
group
n Mean change ± SE
p-value‡ compared to control
group
n Mean change ± SE
p-value‡ compared to control
group
Caffeine (mg/day) Intervention risk 45 182.9 ± 17.2 0.99 45 -3.0 ± 14.8 0.95 41 -18.9 ± 18.8 0.83
Intervention non-risk 43 195.8 ± 18.0 0.78 43 -24.7 ± 15.3 0.43 41 1.5 ± 19.4 0.99 Control 42 185.6 ± 17.4 42 -7.3 ± 14.8 41 -0.3 ± 17.8
Vitamin C (mg/day) Intervention risk 49 204.1 ± 35.0 0.91 49 49.5 ± 37.6 0.99 45 36.6 ± 43.1 0.73
Intervention non-risk 39 229.7 ± 35.7 0.96 39 -13.9 ± 38.4 0.22 37 -58.4 ± 43.5 0.42 Control 42 227.1 ± 34.6 42 44.1 ± 37.1 41 -21.4 ± 40.1
Added sugars (%e/day) Intervention risk 37 9.4 ± 0.8 0.99 37 -0.9 ± 0.9 0.18 33 0.4 ± 0.9 0.98
Intervention non-risk 51 8.3 ± 0.8 0.53 51 0.5 ± 0.8 0.99 49 -0.4 ± 0.8 0.85
Control 42 9.3 ± 0.7 42 0.6 ± 0.8 41 -0.4 ± 0.8
Sodium (mg/day)
Intervention risk 62 2202.2 ± 128.5 0.62 62 -143.0 ± 109.0 0.20 56 -287.3 ± 114.1 0.008 Intervention non-risk 26 2256.7 ± 171.7 0.47 26 97.8 ± 145.6 0.97 26 -244.2 ± 150.2 0.11
Control 42 2082.8 ± 140.6 42 82.2 ± 119.2 41 129.8 ± 118.2 ‡p-values are for log-transformed values (square root transformed for caffeine).
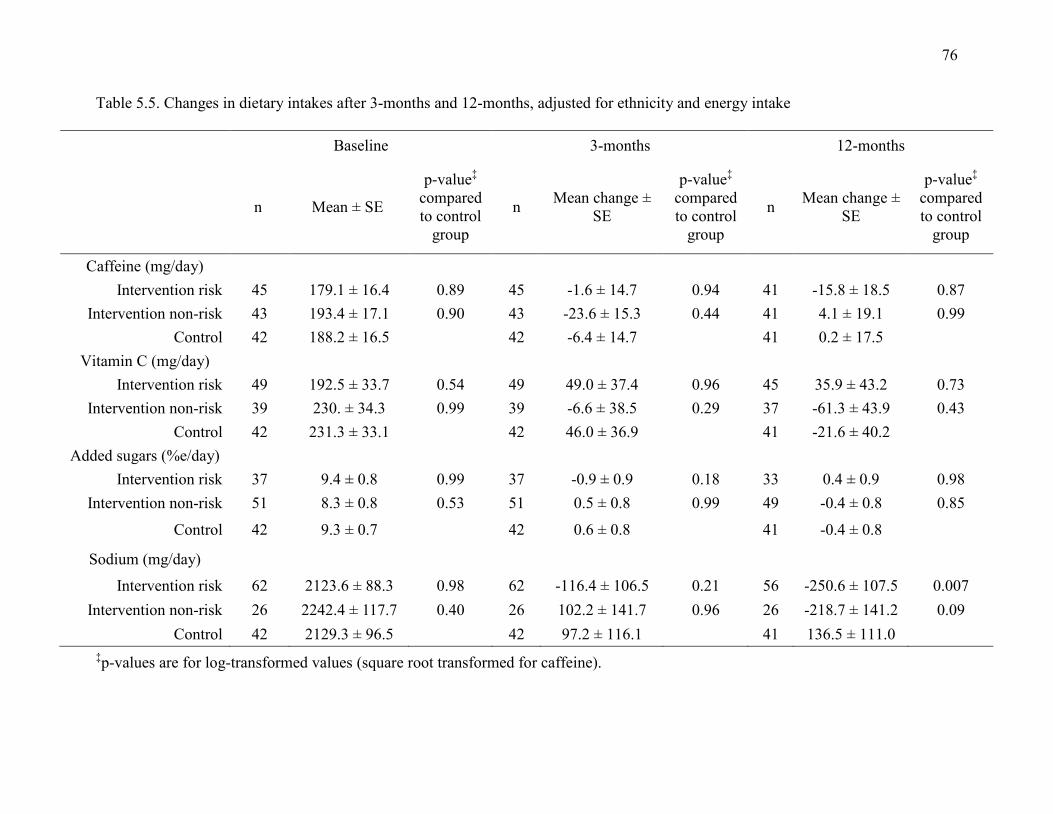
76
Table 5.5. Changes in dietary intakes after 3-months and 12-months, adjusted for ethnicity and energy intake
Baseline 3-months 12-months
n Mean ± SE
p-value‡ compared to control
group
n Mean change ± SE
p-value‡ compared to control
group
n Mean change ± SE
p-value‡ compared to control
group
Caffeine (mg/day) Intervention risk 45 179.1 ± 16.4 0.89 45 -1.6 ± 14.7 0.94 41 -15.8 ± 18.5 0.87
Intervention non-risk 43 193.4 ± 17.1 0.90 43 -23.6 ± 15.3 0.44 41 4.1 ± 19.1 0.99 Control 42 188.2 ± 16.5 42 -6.4 ± 14.7 41 0.2 ± 17.5
Vitamin C (mg/day) Intervention risk 49 192.5 ± 33.7 0.54 49 49.0 ± 37.4 0.96 45 35.9 ± 43.2 0.73
Intervention non-risk 39 230. ± 34.3 0.99 39 -6.6 ± 38.5 0.29 37 -61.3 ± 43.9 0.43 Control 42 231.3 ± 33.1 42 46.0 ± 36.9 41 -21.6 ± 40.2
Added sugars (%e/day) Intervention risk 37 9.4 ± 0.8 0.99 37 -0.9 ± 0.9 0.18 33 0.4 ± 0.9 0.98
Intervention non-risk 51 8.3 ± 0.8 0.53 51 0.5 ± 0.8 0.99 49 -0.4 ± 0.8 0.85
Control 42 9.3 ± 0.7 42 0.6 ± 0.8 41 -0.4 ± 0.8
Sodium (mg/day)
Intervention risk 62 2123.6 ± 88.3 0.98 62 -116.4 ± 106.5 0.21 56 -250.6 ± 107.5 0.007 Intervention non-risk 26 2242.4 ± 117.7 0.40 26 102.2 ± 141.7 0.96 26 -218.7 ± 141.2 0.09
Control 42 2129.3 ± 96.5 42 97.2 ± 116.1 41 136.5 ± 111.0 ‡p-values are for log-transformed values (square root transformed for caffeine).
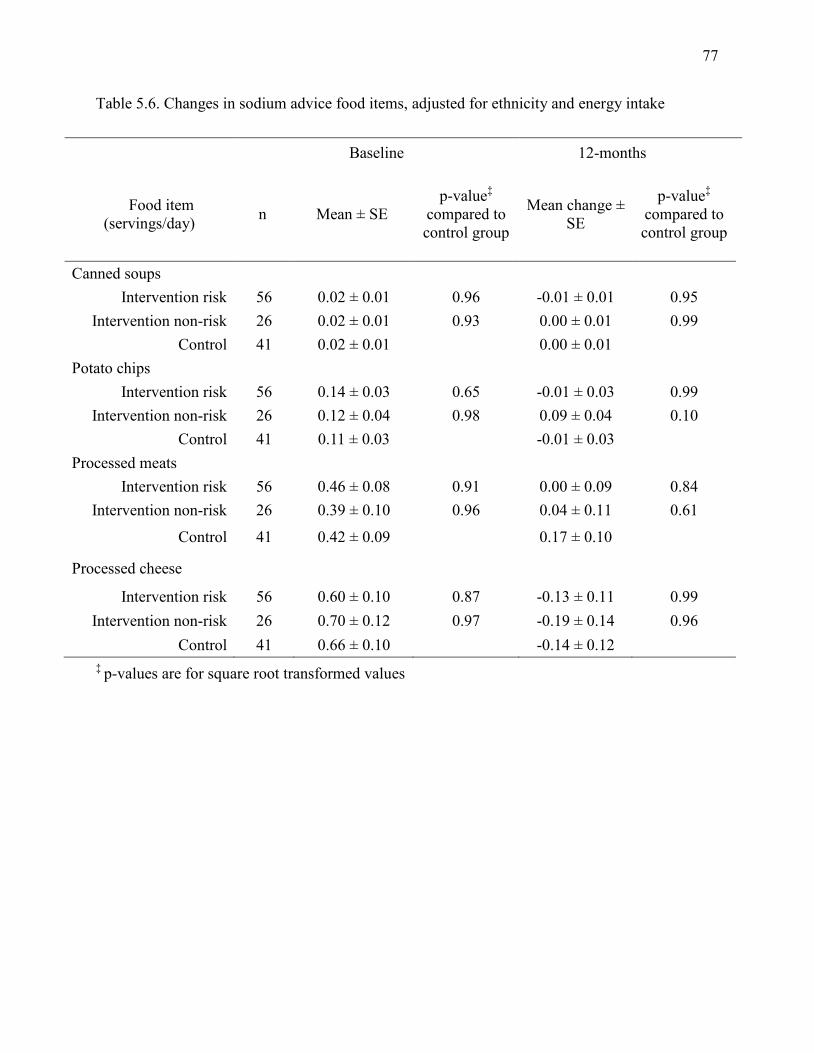
77
Table 5.6. Changes in sodium advice food items, adjusted for ethnicity and energy intake
Baseline 12-months
Food item (servings/day) n Mean ± SE
p-value‡ compared to control group
Mean change ± SE
p-value‡ compared to control group
Canned soups Intervention risk 56 0.02 ± 0.01 0.96 -0.01 ± 0.01 0.95
Intervention non-risk 26 0.02 ± 0.01 0.93 0.00 ± 0.01 0.99 Control 41 0.02 ± 0.01 0.00 ± 0.01
Potato chips Intervention risk 56 0.14 ± 0.03 0.65 -0.01 ± 0.03 0.99
Intervention non-risk 26 0.12 ± 0.04 0.98 0.09 ± 0.04 0.10 Control 41 0.11 ± 0.03 -0.01 ± 0.03
Processed meats Intervention risk 56 0.46 ± 0.08 0.91 0.00 ± 0.09 0.84
Intervention non-risk 26 0.39 ± 0.10 0.96 0.04 ± 0.11 0.61
Control 41 0.42 ± 0.09 0.17 ± 0.10
Processed cheese
Intervention risk 56 0.60 ± 0.10 0.87 -0.13 ± 0.11 0.99 Intervention non-risk 26 0.70 ± 0.12 0.97 -0.19 ± 0.14 0.96
Control 41 0.66 ± 0.10 -0.14 ± 0.12 ‡ p-values are for square root transformed values
78
5.5 Discussion
The present study is the first to evaluate the effect of disclosing genetic information related to
personalized nutrition on dietary intake and the findings show that DNA-based dietary advice
results in greater changes in self-reported intake for some dietary components compared to
population-based dietary advice. Dietary modification is an important health behavior for chronic
disease prevention. Changes in health behaviors have not been frequently reported in previous
studies that have investigated the effect of disclosing genetic information related to disease risk
(Bloss et al., 2011b; Bloss et al., 2011c; Collier, 2012; Grant et al., 2013) and a 2010 Cochrane
review concluded that disclosing genetic risk information for disease has little impact on actual
behavior, although it has a small effect on one’s intention to change (Marteau et al., 2010).
However, the genomic information provided in those studies was related to disease
susceptibility, not personalized nutrition, and the studies lacked a long-term follow-up
assessment. Moreover, participants in previous studies were not provided with personalized
recommendations on what behavioural strategies should be followed to mitigate disease risk.
Results from the present study provide evidence that genetic testing for personalized nutrition
may be more clinically useful than testing for disease susceptibility, since a change in sodium
intake was observed after 12-months among the intervention risk group. In line with this finding,
a previous study comparing a personalized, gene-based weight loss diet with a traditional weight
loss diet reported that subjects on the personalized diet had greater dietary adherence, longer-
term maintenance of weight loss and greater improvements in fasting blood glucose levels
(Arkadianos et al., 2007). In addition, a study investigating health behaviour changes after
revealing genetic risk for Alzheimer’s disease reported that the addition of a vitamin E
supplement was the most common change to vitamin or medication use among subjects who
79
were informed that they were at greater genetic risk (Chao et al., 2008).
Although changes were observed in dietary intakes of sodium among the intervention-
risk group of subjects at the 12-month follow-up, no changes in intakes of caffeine, vitamin C or
added sugars were observed at either follow-up assessment. This may be due to the baseline
intakes of these nutrients that were already mostly in line with the recommendations that were
given to the subjects who possessed a risk allele, which is a limitation of the present study.
Nevertheless, variants in other genes involved in reward pathways may play a role in one’s
ability to reduce consumption of some of these dietary components (Cornelis et al., 2011; Eny et
al., 2009). Indeed, the National Human Genome Research Institute has recommended
investigation into the potential for genomic information to improve behaviour change
interventions by customizing interventions to individuals based on genetic markers of adherence
(Green and Guyer, 2011; McBride et al., 2012). Despite the lack of an intervention effect on
intake of these three dietary components in the present study, it is worth noting that subjects who
possessed a non-risk allele for the corresponding genes did not shift to a less desirable level of
intake by increasing their consumption of caffeine, sodium or added sugars, or decreasing their
intake of vitamin C. Although we did not report a detrimental impact on dietary intake behaviour
as a result of disclosing genetic information indicating no increased risk, proper communication
of genetic test results is needed to prevent individuals from misunderstanding or misinterpreting
the information and to guide them toward making appropriate lifestyle changes where necessary
(Ferguson, 2012). As such, providing such information through a qualified healthcare
professional might be more appropriate than providing such information direct-to-consumer. If
the results of a genetic test require dietary modification then a dietitian might be best suited to
guide the consumer whereas a genetic counselor would be better suited for communicating
80
results of tests for high penetrance genes that may require a more severe intervention, such as
BRCA1 and breast cancer risk.
Another limitation of the present study is the use of a FFQ to assess dietary intake, which
is more useful in larger, population-based studies, as it provides a measure of relative intake
rather than actual intake. However, the objective of the present study was to assess change in
dietary intakes, which is a relative measure of intake. In addition, the sample size was small, yet
comparable to previous studies examining the impact of disclosing genetic information on
particular health behaviours (Arkadianos et al., 2007; Chao et al., 2008; Grant et al., 2013), and
subjects were highly educated and recruited from a previous nutrigenomics study. The reported
reduction of nearly 300 mg of sodium per day in the intervention risk group was not sufficient to
reduce the average sodium intake to the AI of 1500 mg/day, which was the targeted
recommendation provided in the dietary report. Nevertheless, a recent Institute of Medicine
report concluded that there is no benefit to sharply restricting sodium intake to the level of the AI
(Institute of Medicine, 2013) and a 2010 computer-simulated model examining the effect of
dietary salt reduction on future cardiovascular disease projected that a 1 g/day reduction in
average population salt intake, which is equivalent to about 400 mg of sodium, would prevent up
to 28,000 deaths from any cause and would be more cost-effective than using medications to
manage hypertension (Bibbins-Domingo et al., 2010). Therefore, the approximate 300 mg/day
reduction in sodium intake reported in the present study would be considered clinically relevant
for the prevention or management of hypertension and risk of cardiovascular disease.
Strengths of the present study are the inclusion of a control group, which provided a
method of comparing the utility of DNA-based dietary advice to population-based
81
recommendations, and the randomized design, which minimizes the potential for confounding
effects. Including a 3- and 12-month follow-up assessment enabled us to examine the short- and
long-term effects of the intervention. The finding that sodium intake was significantly reduced
compared to the control group after 12-months among subjects in the intervention group with the
risk version of the ACE gene suggests that longer-term studies are required to fully determine the
impact of disclosing genetic information. Moreover, conducting the present study so that it
closely resembles a consumer genetic test increases the validity of the findings to reflect the real
world effects among consumer genetic test users. Early adopters of consumer genetic testing are
more likely to be highly educated and Caucasian, with a substantial proportion of users between
the ages of 18-49 years (Bloss et al., 2011c; Gollust et al., 2012; Kaufman et al., 2012). One
study has reported a larger proportion of female consumers (Gollust et al., 2012). As a result, the
subjects in the present study may be representative of the early adopters of consumer genetic
testing.
The present study was the first to empirically test the effect of DNA-based personalized
nutritional advice on dietary intake behaviour compared to population-based dietary advice. The
findings show that DNA-based dietary advice can impact dietary intake to a greater extent than
general population-based recommendations and provide supportive evidence for the clinical
utility of personalized nutrition to assist in chronic disease prevention.
82
Chapter 6
Perceptions of genetic testing for personalized nutrition: a
randomized trial of DNA-based dietary advice
Adapted from: Nielsen DE, Shih S and El-Sohemy A. (2014) Perception of genetic testing for
personalized nutrition: a randomized trial of DNA-based dietary advice. J Nutrigenet
Nutrigenomics. (In press)
83
6.1 Abstract
Background: Consumer genetic tests have facilitated easy access to personal genetic information
related to health and nutrition, however, consumer perceptions of the nutritional information
provided from these tests have not been evaluated.
Objective: To assess individual perceptions of genetic testing and personalized nutrition and to
determine whether a personalized nutrition intervention modifies perceptions.
Design: A randomized controlled trial was conducted with adults aged 20-35 years (n=138).
Subjects in the intervention (I) group were given a report of genotype-based dietary advice and
those in the control (C) group and were given a report of general dietary advice. A survey was
completed at baseline and 3- and 12-months after distributing the reports to assess perceptions of
the advice between the two groups.
Results: As compared to baseline, subject responses increased significantly toward the positive
end of a Likert scale at 3-months for the statements “I am interested in the relationship between
diet and genetics” (mean change ± SD: 0.28 ± 0.99, p=0.0002) and “I would take a genetic test to
have my healthcare professional monitor my health more closely” (mean change ± SD: 0.20 ±
1.00, p=0.02). At 12-months, subject responses for the statement “I am interested in the
relationship between diet and genetics” remained significantly increased toward the positive end
of the scale, as compared to baseline (mean change ± SD: 0.20 ± 1.04, p=0.02). The majority of
subjects indicated that a university research lab (47%) or healthcare professional (41%) were the
best sources for obtaining accurate personal genetic information, while a DTC genetic testing
company received the fewest selections (12%). Most subjects (56%) considered dietitians to be
84
the best source of personalized nutrition followed by medical doctors (27%), naturopaths (8%)
and nurses (6%).
Conclusions: These results suggest that perceptions of genetic testing and personalized nutrition
changed over the course of the present intervention study. Individuals view a research lab or
healthcare professional as better providers of genetic information than a DTC genetic testing
company and registered dietitians are considered to be the best providers of personalized
nutrition advice.
85
6.2 Introduction
The direct-to-consumer (DTC) genetic testing industry has provided individuals with easy access
to their own personal genetic information. Many of these tests provide information on
susceptibility to different diseases and some provide nutrition information (Sterling, 2008). As a
result, proponents of this technology claim that the information may positively impact health
behaviours such as diet, smoking and exercise in an effort to prevent the development of chronic
diseases. However, controversies surrounding DTC genetic testing continue to arise, in part due
to the unregulated nature of the industry. The U.S. Food and Drug Administration (FDA)
recently ordered 23andMe, one of the largest DTC genetic testing companies, to stop the sales
and marketing of their health-related genetic test (Coghlan, 2013), and a class action lawsuit was
filed against the company shortly after claiming that the company’s advertising misled
consumers (O'Connor, 2013). Concerns over the analytical validity and clinical utility of the
tests, along with little information about what consumers do with the genetic test results have
sparked debate on how to properly regulate this emerging technology. Government bodies
around the world are working to create standards and guidelines to ensure appropriate
distribution of these tests to consumers (Borry et al., 2012; Human Genetics Commission, 2010;
Wagner, 2010), however, these efforts require a comprehensive understanding of the public’s
perceptions of these technologies, as well as evidence of the impact of test results on consumer
actions and behaviours.
Previous qualitative studies have shown substantial public interest in genetic testing and
personal genomics (Cherkas et al., 2010; Goddard et al., 2009; Kolor et al., 2012), including
interest in the field of nutrigenomics (Goddard et al., 2007; Ronteltap et al., 2009; Roosen et al.,
2008; Stewart-Knox et al., 2009), the study of how human genetic variations modify an
86
individual’s response to diet on various health outcomes. The benefits of the application of
nutrigenomics include the creation of gene-based dietary interventions to prevent chronic
diseases, personalized dietary recommendations to optimize an individual’s dietary response and
more precise public health advice for dietary intake and supplement use (Stenne et al., 2013). A
European survey reported that out of 5,967 respondents, 66% were willing to undergo
nutrigenomics testing and 27% would follow a personalized diet based on their test results
(Stewart-Knox et al., 2009). In addition, DNA-based dietary advice was considered to be more
useful and understandable than general population-based dietary recommendations in another
study and individuals in that study also reported that they would be more motivated to change
their diet if provided with gene-based personalized nutrition information (Nielsen and El-
Sohemy, 2012b). However, individual perceptions of sources and providers of personal genetic
information and personalized nutrition advice, as well as the utility of DNA-based dietary advice
compared with general dietary recommendations, have not been explored. Therefore, the
objective of the present study was to assess and compare perceptions of genetic testing and
personalized nutrition in a population of young adults who are given DNA-based dietary advice
or general dietary recommendations using a randomized controlled trial.
6.3 Methods
6.3.1 Study design and materials
Materials for the present study were distributed and completed in the mail or electronically and
no in-person contact was made with subjects, since the study was intended to mimic the nature of
a DTC genetic test. Ethics approval was obtained from the University of Toronto Institutional
87
Review Board and the study is registered with http://clinicaltrials.gov (NCT 01353014).
Recruitment took place at the University of Toronto, which does not offer a dietetics program.
Details on the study design have been published elsewhere (Nielsen and El-Sohemy, 2012b).
Briefly, eligible subjects (n=354) who had previously participated in a nutrigenomics research
study and had provided a blood sample were invited to take part in the present study. The dietary
recommendations provided in this study were based on caffeine, vitamin C, sugar, and sodium,
therefore, subjects were excluded if they consumed less than 100 mg of caffeine per day, less
than 10% of energy from total sugars per day, less than 1,500 mg of sodium per day and if they
used vitamin C-containing supplements. Women who were pregnant or breast-feeding at the time
of recruitment were also excluded. A total of 157 subjects expressed interest in participating in
the study and were sent a baseline survey to assess perceptions of genetic testing and
personalized nutrition. Those who completed the baseline survey were randomized to an
intervention or control group using Random Allocation Software (Figure 6.1). A 2:1 ratio of
subjects in the intervention group compared to the control group was used to account for the
proportion of subjects in the intervention group who would carry either the “risk” or “non-risk”
genotype for each of the genes that were tested in the study (Table 6.1).
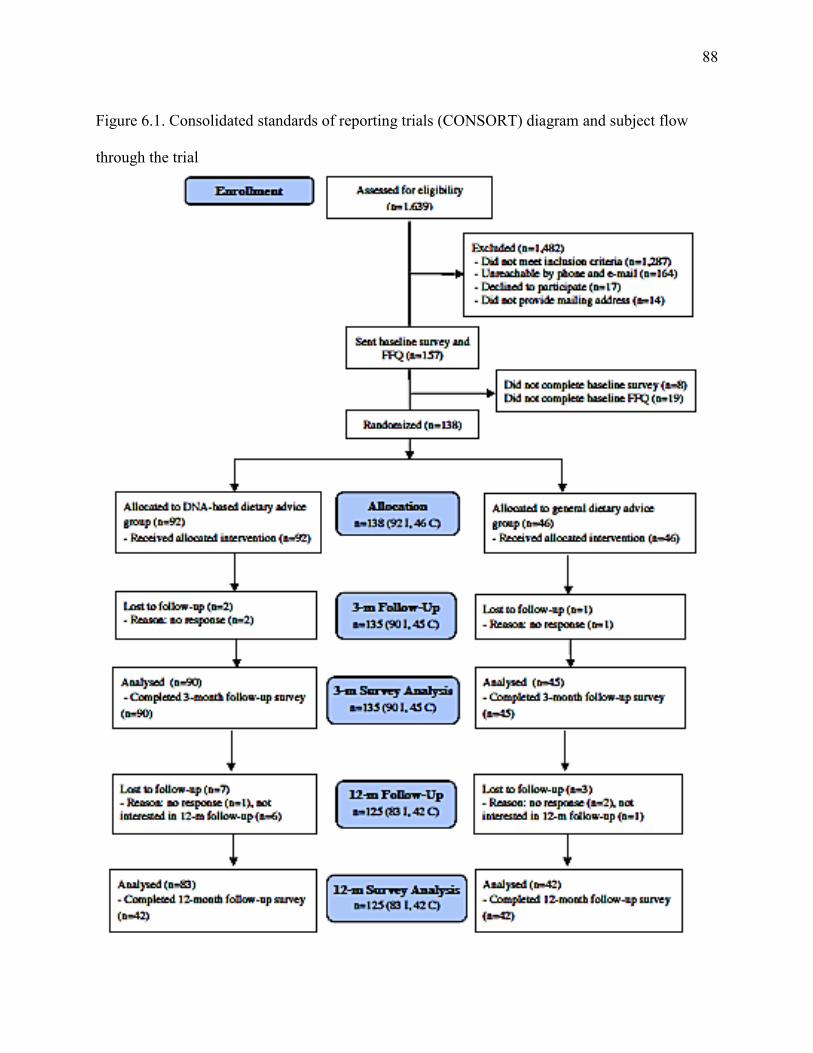
88
Figure 6.1. Consolidated standards of reporting trials (CONSORT) diagram and subject flow
through the trial
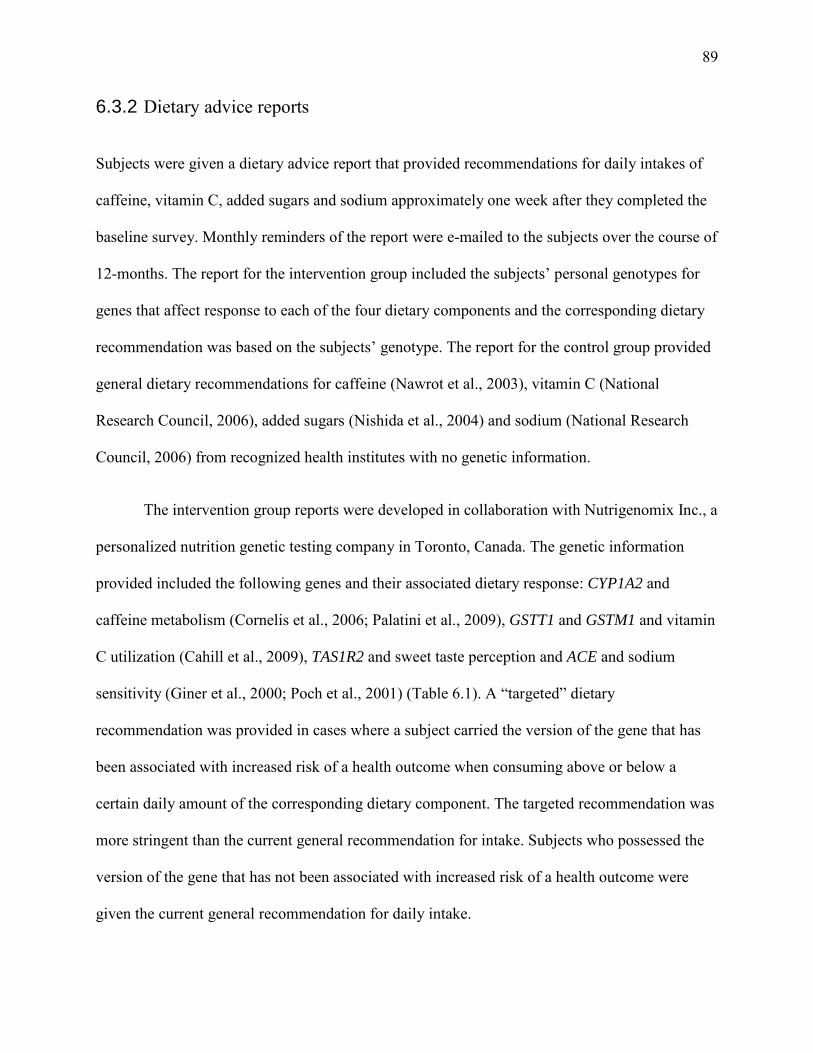
89
6.3.2 Dietary advice reports
Subjects were given a dietary advice report that provided recommendations for daily intakes of
caffeine, vitamin C, added sugars and sodium approximately one week after they completed the
baseline survey. Monthly reminders of the report were e-mailed to the subjects over the course of
12-months. The report for the intervention group included the subjects’ personal genotypes for
genes that affect response to each of the four dietary components and the corresponding dietary
recommendation was based on the subjects’ genotype. The report for the control group provided
general dietary recommendations for caffeine (Nawrot et al., 2003), vitamin C (National
Research Council, 2006), added sugars (Nishida et al., 2004) and sodium (National Research
Council, 2006) from recognized health institutes with no genetic information.
The intervention group reports were developed in collaboration with Nutrigenomix Inc., a
personalized nutrition genetic testing company in Toronto, Canada. The genetic information
provided included the following genes and their associated dietary response: CYP1A2 and
caffeine metabolism (Cornelis et al., 2006; Palatini et al., 2009), GSTT1 and GSTM1 and vitamin
C utilization (Cahill et al., 2009), TAS1R2 and sweet taste perception and ACE and sodium
sensitivity (Giner et al., 2000; Poch et al., 2001) (Table 6.1). A “targeted” dietary
recommendation was provided in cases where a subject carried the version of the gene that has
been associated with increased risk of a health outcome when consuming above or below a
certain daily amount of the corresponding dietary component. The targeted recommendation was
more stringent than the current general recommendation for intake. Subjects who possessed the
version of the gene that has not been associated with increased risk of a health outcome were
given the current general recommendation for daily intake.
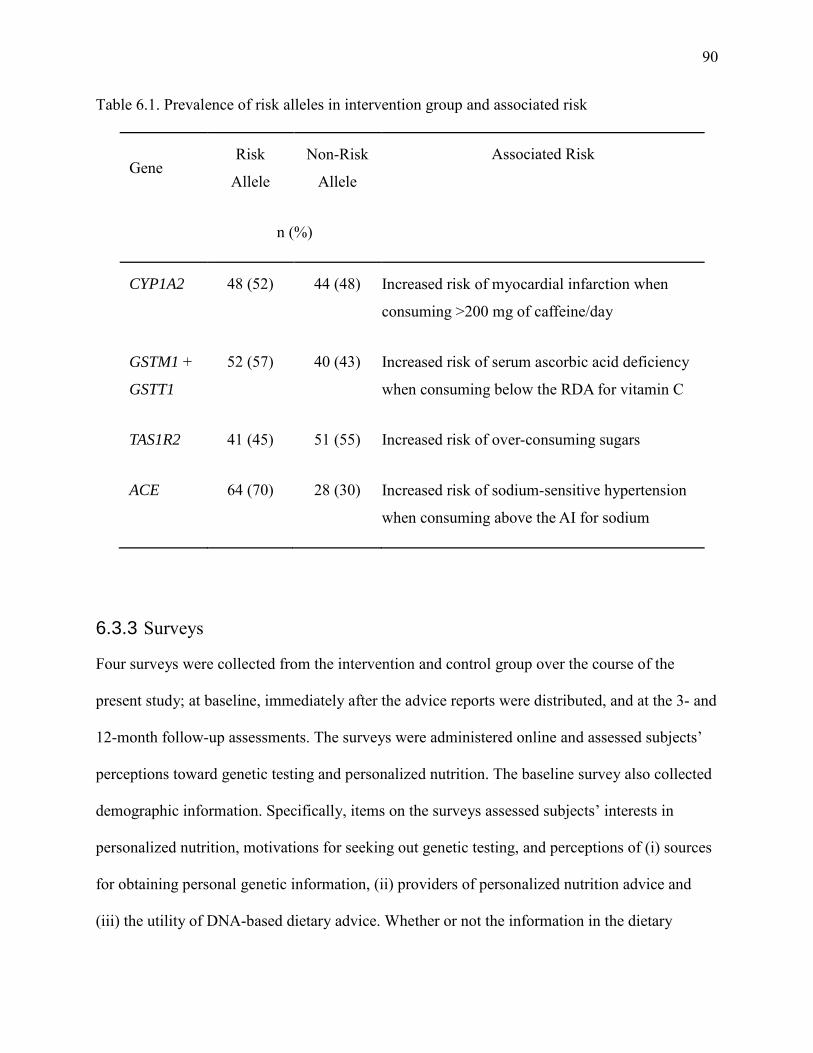
90
Table 6.1. Prevalence of risk alleles in intervention group and associated risk
Gene Risk
Allele
Non-Risk
Allele
Associated Risk
n (%)
CYP1A2 48 (52) 44 (48) Increased risk of myocardial infarction when
consuming >200 mg of caffeine/day
GSTM1 +
GSTT1
52 (57) 40 (43) Increased risk of serum ascorbic acid deficiency
when consuming below the RDA for vitamin C
TAS1R2 41 (45) 51 (55) Increased risk of over-consuming sugars
ACE 64 (70) 28 (30) Increased risk of sodium-sensitive hypertension
when consuming above the AI for sodium
6.3.3 Surveys
Four surveys were collected from the intervention and control group over the course of the
present study; at baseline, immediately after the advice reports were distributed, and at the 3- and
12-month follow-up assessments. The surveys were administered online and assessed subjects’
perceptions toward genetic testing and personalized nutrition. The baseline survey also collected
demographic information. Specifically, items on the surveys assessed subjects’ interests in
personalized nutrition, motivations for seeking out genetic testing, and perceptions of (i) sources
for obtaining personal genetic information, (ii) providers of personalized nutrition advice and
(iii) the utility of DNA-based dietary advice. Whether or not the information in the dietary
91
reports was shared with others was also assessed. The surveys consisted of five-point Likert-type
scales where subjects were asked to indicate the extent to which they agreed with various
statements on a scale that contained the following response options: strongly disagree, somewhat
disagree, neither agree or disagree, somewhat agree and strongly agree; multiple choice
questions where the subjects were instructed to select all response options that applied; and one
“yes”, “no” or “no opinion” question where the subjects could only select one response. A
number of items included in the surveys were adapted from questions used in a previous UK
survey of public interest in personal genome testing (Cherkas et al., 2010) and four of these items
that were present on the baseline survey were repeated at the follow-up points to determine if
responses to these items changed after the intervention.
6.3.4 Statistical analysis
Statistical analyses were conducted using the Statistical Analysis Software version 9.2 (SAS
Institute Inc., Cary, NC). Subject characteristics between the intervention and control group were
compared using a chi-square test for categorical variables and a Student’s t-test for continuous
variables. For the multiple choice and yes/no/no opinion questions, survey responses between the
intervention and control group were compared using the chi-square test. Fisher’s exact test was
used instead if a response category contained fewer than five counts. Responses of the
intervention and control group were combined if significant differences were not present
between the groups. To examine changes in responses to the repeated Likert-type survey items,
responses were coded from 1 to 5, with 1 denoting the negative end of the scale (strongly
disagree) and 5 denoting the positive end (strongly agree). Baseline responses were subtracted
from follow-up responses and the non-parametric Kruskal Wallis test was used to compare
92
changes of mean responses between the intervention and control group. Responses were
combined if a significant difference was not present between groups. The non-parametric
Wilcoxon signed-rank test was used to identify significant changes in the responses between
baseline and the 3- and 12-month follow-up surveys. The α error was set at 0.05 and all reported
p-values are two-sided.
6.4 Results
6.4.1 Subject characteristics
Of the 157 subjects who were sent the baseline survey, 135 subjects completed the 3-month
follow-up assessment and 125 completed the 12-month follow-up assessment giving an overall
retention rate of 80%. There were no significant differences between the characteristics of
subjects in the intervention group when compared to the control group (Table 6.2). The mean ±
SD age of the subjects was 26.5 ± 3.0 years and 78% were female. The study population was
multi-ethnic with Caucasian, East Asian, and South Asian groups representing the majority of
ethnic backgrounds. Over half of the population possessed at least an undergraduate degree.
Some survey results from the baseline and intervention time point surveys have been published
previously (Nielsen and El-Sohemy, 2012b).
Table 6.2. Subject Characteristics (See Chapter 4, Table 4.1.)
93
6.4.2 Opinions of sources for personal genetic information and personalized
nutrition advice
On the 3-month survey, subjects were asked to indicate which source they felt would provide
them with the most accurate personal genetic information. The response options were “university
research lab”, “healthcare professional”, and “direct-to-consumer genetic testing company” with
subjects being instructed to select all that applied. Since no significant differences were observed
between the responses of the intervention group when compared to the control group (data not
shown), the responses of both groups were combined. The most commonly selected response
among the 135 subjects was “university research lab” (47%), followed by “healthcare
professional” (41%) and “direct-to-consumer genetic testing company” (12%). Subjects were
also asked to indicate which source they felt would provide them with the best personalized
nutrition advice. The response options were “registered dietitian”, “medical doctor”, “registered
nurse”, “naturopath”, or “other” and subjects were instructed to select all that applied. The option
“other” required subjects to specify an open-ended response. Similar to the previous finding, no
significant differences were observed between the responses of the intervention group when
compared to the control group (data not shown), so the responses of both groups were combined.
The most commonly selected response was “registered dietitian” (56%), followed by “medical
doctor” (27%), “naturopath” (6%), “registered nurse” (8%), and “other” (3%). Four subjects
selected “other” and the open-ended responses were either “myself” (n=3: 2 subjects from the
intervention group, 1 from the control group) or “a researcher” (n=1: subject from the
intervention group).
94
6.4.3 Changes in perceptions of personalized nutrition and genetic testing
Four statements that were included on the baseline survey to assess individual interest in
personalized nutrition and motivations for seeking out genetic testing were repeated on the 3-
month and 12-month survey in order to determine whether perceptions of these statements
changed over the course of the study (Table 6.3). Subjects who completed the entire 12-month
study were included in these analyses (n=125). No significant differences in the mean response
changes were observed between the intervention and control group for any of the four statements
(data not shown) and, therefore, responses of the two groups were combined. At 3-months,
significant changes were observed for two statements as compared to baseline (Table 6.4).
Subject responses increased significantly toward the positive end of the scale for the statements
“I am interested in the relationship between diet and genetics” (mean change ± SD: 0.28 ± 0.99,
p=0.0002) and “I would take a genetic test to have my healthcare professional monitor my health
more closely” (mean change ± SD: 0.20 ± 1.00, p=0.02). At 12-months, subject responses for the
statement “I am interested in the relationship between diet and genetics” were also significantly
increased toward the positive end of the scale, as compared to baseline (mean change ± SD: 0.20
± 1.04, p=0.02).
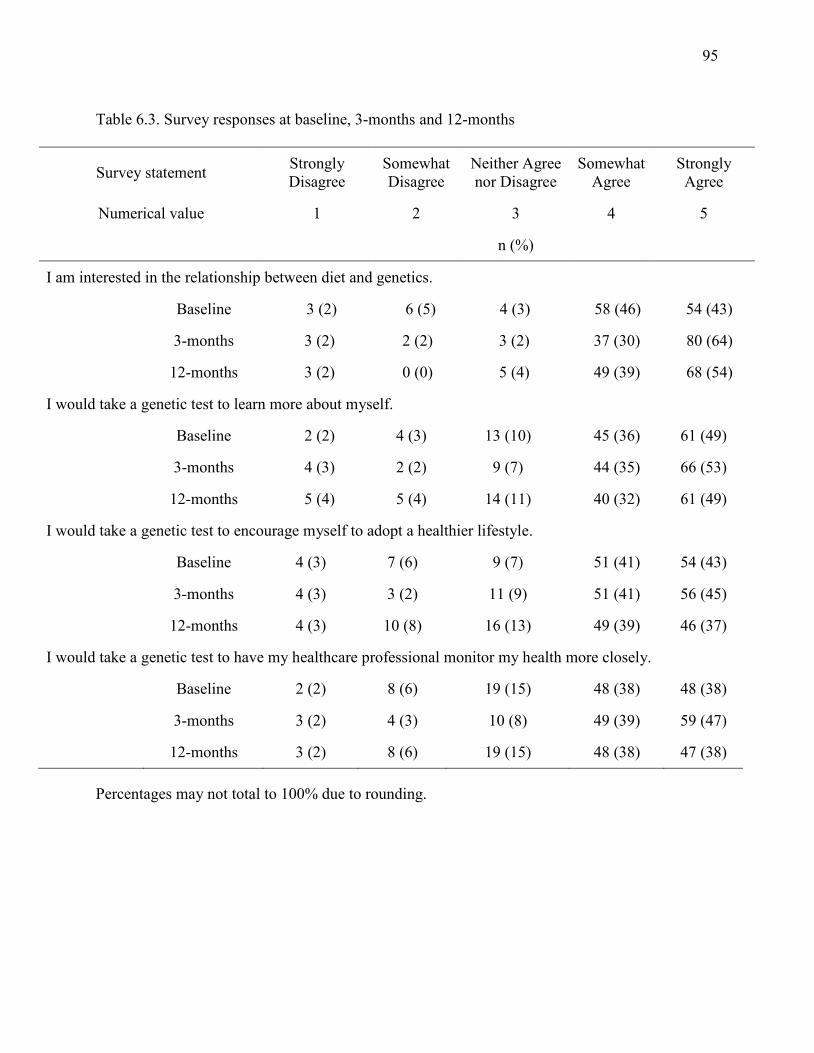
95
Table 6.3. Survey responses at baseline, 3-months and 12-months
Survey statement Strongly Disagree
Somewhat Disagree
Neither Agree nor Disagree
Somewhat Agree
Strongly Agree
Numerical value 1 2 3 4 5
n (%)
I am interested in the relationship between diet and genetics.
Baseline 3 (2) 6 (5) 4 (3) 58 (46) 54 (43)
3-months 3 (2) 2 (2) 3 (2) 37 (30) 80 (64)
12-months 3 (2) 0 (0) 5 (4) 49 (39) 68 (54)
I would take a genetic test to learn more about myself.
Baseline 2 (2) 4 (3) 13 (10) 45 (36) 61 (49)
3-months 4 (3) 2 (2) 9 (7) 44 (35) 66 (53)
12-months 5 (4) 5 (4) 14 (11) 40 (32) 61 (49)
I would take a genetic test to encourage myself to adopt a healthier lifestyle.
Baseline 4 (3) 7 (6) 9 (7) 51 (41) 54 (43)
3-months 4 (3) 3 (2) 11 (9) 51 (41) 56 (45)
12-months 4 (3) 10 (8) 16 (13) 49 (39) 46 (37)
I would take a genetic test to have my healthcare professional monitor my health more closely.
Baseline 2 (2) 8 (6) 19 (15) 48 (38) 48 (38)
3-months 3 (2) 4 (3) 10 (8) 49 (39) 59 (47)
12-months 3 (2) 8 (6) 19 (15) 48 (38) 47 (38)
Percentages may not total to 100% due to rounding.
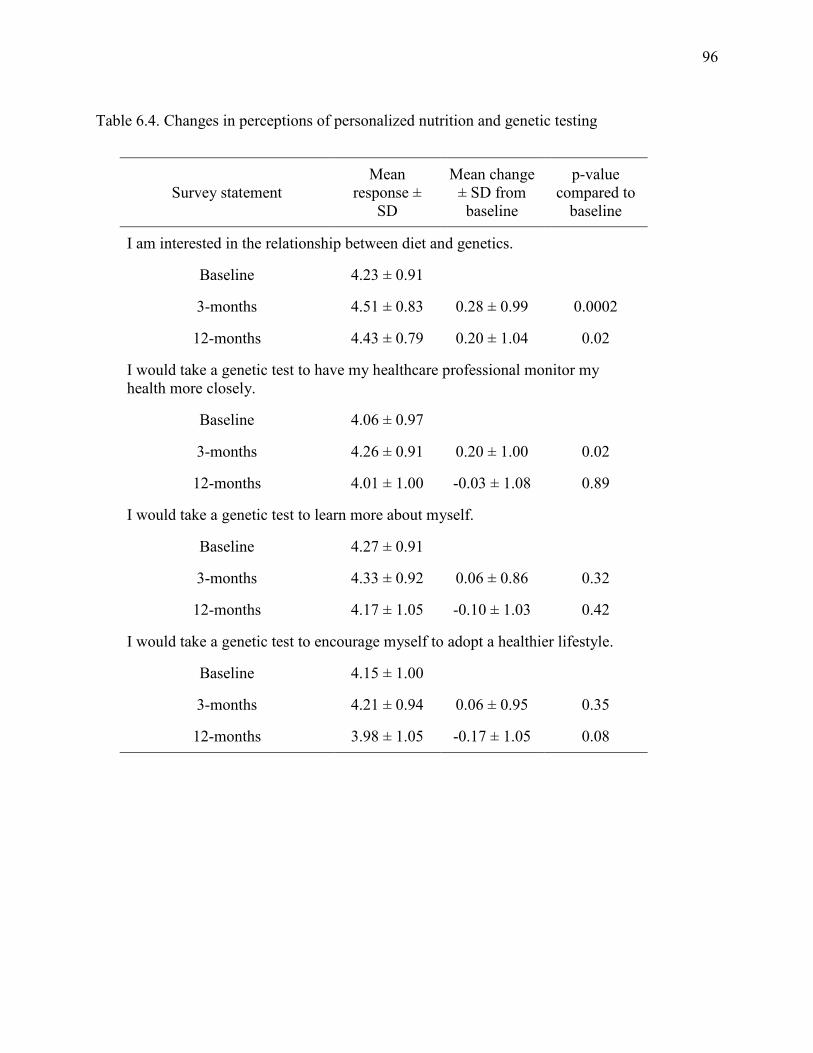
96
Table 6.4. Changes in perceptions of personalized nutrition and genetic testing
Survey statement Mean
response ± SD
Mean change ± SD from baseline
p-value compared to
baseline
I am interested in the relationship between diet and genetics.
Baseline 4.23 ± 0.91
3-months 4.51 ± 0.83 0.28 ± 0.99 0.0002
12-months 4.43 ± 0.79 0.20 ± 1.04 0.02
I would take a genetic test to have my healthcare professional monitor my health more closely.
Baseline 4.06 ± 0.97
3-months 4.26 ± 0.91 0.20 ± 1.00 0.02
12-months 4.01 ± 1.00 -0.03 ± 1.08 0.89
I would take a genetic test to learn more about myself.
Baseline 4.27 ± 0.91
3-months 4.33 ± 0.92 0.06 ± 0.86 0.32
12-months 4.17 ± 1.05 -0.10 ± 1.03 0.42
I would take a genetic test to encourage myself to adopt a healthier lifestyle.
Baseline 4.15 ± 1.00
3-months 4.21 ± 0.94 0.06 ± 0.95 0.35
12-months 3.98 ± 1.05 -0.17 ± 1.05 0.08
97
6.4.4 Sharing of information and utility of personalized nutrition
On the 12-month survey, subjects were asked if they shared the information in the report with
anyone. The available choices were “family member”, “significant other”, “friend”, “healthcare
professional”, and “I did not share the information with anyone”, and subjects were instructed to
select all that applied. A significantly greater proportion of subjects in the intervention group
shared the information with a family member (31% (I) vs. 9% (C), p=0.005) or a friend (33% (I)
vs. 7% (C), p=0.001). A significantly greater proportion of subjects in the control group selected
“I did not share the information with anyone” when compared to the intervention group (10% (I)
vs. 64% (C), p<0.0001). Only one subject in the study, who was in the intervention group, shared
the information with a healthcare professional. At 12-months, subjects were also asked if they
thought DNA-based dietary advice is more useful than general population-based dietary advice
and the possible responses were “yes”, “no”, or “no opinion”. Since no significant differences
were observed between the responses of the intervention group when compared to the control
group (data not shown), the responses of both groups were combined. The majority of the 125
subjects (73%) selected “yes”, 14% selected “no” and 14% selected “no opinion”.
6.5 Discussion
The present study is the first randomized controlled trial to compare attitudes and perceptions of
genetic testing and personalized nutrition between those who receive DNA-based dietary advice
and those who receive general dietary recommendations. The findings demonstrated that certain
perceptions of personalized nutrition and genetic testing changed over the course of the present
study. Since proponents of consumer genetic tests claim that the test results can positively impact
98
health behaviour, this finding may have clinically relevant behavioural implications. Theories of
health behaviour change, such as the Health Belief Model, assert that an individual’s beliefs
about a health risk and the effectiveness of a particular behaviour are indicative of one’s
likelihood of engaging in that behaviour (Rosenstock et al., 1988). Therefore, the reported
changes in perceptions may have an influence on individual health behaviours, such as changing
one’s diet or sharing genetic test results with a healthcare professional. Indeed, previous surveys
of individuals who have undergone consumer genetic testing have reported that the genetic
information impacted their dietary behaviours, although the information was not specifically
related to dietary response (Kaufman et al., 2012; Maher, 2011). Consequently, genetic
information for personalized nutrition may have an even greater impact on dietary behaviour.
A university research lab and healthcare professional were viewed more favorably than a
DTC genetic testing company as providers of accurate personal genetic information, and a
registered dietitian was selected as the best provider of personalized nutrition advice. The low
proportion of subjects who selected DTC genetic testing company may reflect a lack of
awareness of such companies, which we previously reported (Nielsen and El-Sohemy, 2012b).
Nevertheless, these findings are in line with other reports of consumer preferences for healthcare
professional involvement in genetic testing (Almeling and Gadarian, 2013; Morin, 2009) and
highlight an important consideration. While proper communication of genetic test results is
needed to prevent individuals from misinterpreting the information and to guide them toward
making appropriate lifestyle changes where necessary (Ferguson, 2012), healthcare professionals
in general, including dietitians, have expressed low genetic self-efficacy to be able to interpret
and explain genetic test results to patients (Birmingham et al., 2013; Collins et al., 2013; Cormier
et al., 2014; Weir et al., 2010). Some argue that genetic counselors should communicate genetic
99
test results to consumers (Harris et al., 2013), but it is important to note that genetic counselors
do not possess the required training to provide dietary advice. Increasing genomics education in
healthcare professional training programs is, therefore, an important priority that has been
acknowledged by a number of health centers (Salari et al., 2013). In fact, a recent study
demonstrated that incorporating personal genome testing in a course on personalized medicine
improved both self-reported and assessed genomics knowledge among medical students who
underwent testing (Salari et al., 2013). Since registered dietitians were viewed as the best
providers of personalized nutrition advice in the present study, dietetics curricula may benefit
from increasing education on genomics and genetic testing. Indeed, the Academy of Nutrition
and Dietetics recently acknowledged that dietitians with coursework in genetics and genomics
are needed to advance the field of nutrigenomics (Camp and Trujillo, 2014), while the
Partnership for Dietetic Education and Practice (Canada) identified ‘genetics and nutrigenomics’
as foundational knowledge areas for dietetics students (Partnership for Dietetic Education and
Practice, 2013).
Although healthcare professional involvement in personal genome testing is preferred by
the general public, there is concern that use of this technology could increase the burden on
healthcare systems (McBride et al., 2012). A previous study reported low levels of physician
involvement and no difference in use of medical screening tests 3-months after undergoing DTC
testing (Bloss et al., 2011c), but at 12-months it was reported that nearly 40% of subjects had
shared their genetic test results with their healthcare professional and undergone a greater
number of screening tests than those who did not share their test results (Bloss et al., 2013).
However, that study did not include a control group, so the interpretation of those findings is
limited. In the present study, only one subject in the intervention group shared their genetic
100
information with a healthcare professional, which suggests that genetic testing for personalized
nutrition might not impact healthcare resources in the manner that genetic testing for disease
susceptibility may. Nevertheless, subjects in the intervention group were more likely to share the
information from their dietary report with a family member or friend compared with subjects in
the control group, who mostly reported that they did not share their dietary information with
anyone. This finding may be reflective of individuals’ interests and enthusiasm for personalized
nutrition information. Indeed, the majority (73%) of subjects from both the intervention and
control group in the present study indicated that DNA-based dietary advice is more useful than
general recommendations. As a result, personalized dietary advice may be more effective at
motivating adherence to dietary recommendations than general population-based dietary advice.
Overall, the application of nutrigenomics is not considered to have substantial risk such as
potentially medicalizing food, hindering individual autonomy for food choices, or obliging
individuals to comply with DNA-based dietary recommendations (Hurlimann et al., 2014).
Limitations of the present study include the small sample size and selective group of
subjects that may not be representative of other populations. However, previous studies that have
examined individual responses following disclosure of personal genetic information have
consisted of comparable sample sizes (Arkadianos et al., 2007; Chao et al., 2008; Grant et al.,
2013). Moreover, while the subjects in the present study were highly educated and recruited from
a previous nutrigenomics study, they are representative of the early adopters of consumer genetic
testing who are more likely to be highly educated, Caucasian and between the ages of 18-49
years (Bloss et al., 2011c; Gollust et al., 2012; Kaufman et al., 2012). One previous study
reported that a larger proportion of consumers were female (Gollust et al., 2012). Nevertheless,
101
the survey findings reported in the present study may not be generalizable to populations that are
less educated, older, non-Caucasian or managing a chronic disease.
Strengths of the present study are the inclusion of a control group, which provided a
method of comparing the perceptions of DNA-based dietary advice to general population-based
recommendations, as well as the randomized design, which minimizes the potential for
confounding effects. In addition, conducting the study in a manner that closely resembled a DTC
genetic test increases the validity of the findings to reflect the perceptions among DTC genetic
test users. The present study was the first to examine and compare perceptions of genetic testing
and personalized nutrition among individuals who are given DNA-based advice or general
dietary recommendations. The findings provide novel information on individual perceptions
toward personalized nutrition and genetic testing, as well as perceptions of sources of personal
genetic information, providers of personalized nutrition advice and the utility of DNA-based
advice compared with general dietary recommendations.

102
Chapter 7
Overall Discussion

103
7.1 Summary
The overall aims of this thesis were to examine individual perceptions towards genetic testing for
personalized nutrition and to determine whether disclosing genetic information related to dietary
advice for caffeine, vitamin C, added sugars and sodium resulted in changes to dietary intakes of
these nutrients.
Objective 1: Examine the perceptions of individuals toward genetic testing and personalized
nutrition.
Results: At baseline, approximately half of the participants (52%) reported having heard
“nothing” about DTC genetic testing, while 18% reported hearing “a fair amount” or “a lot”. A
smaller proportion of participants reported knowing “nothing” about nutrigenomics (30%), with
just over half reporting that they knew “a little bit” about the science (52%). Interest in the
relationship between diet and genetics was high, with 90% of participants reporting either
“strongly agree” or “somewhat agree” to the survey statement. The majority of participants
(87%) also agreed that they would benefit from learning about how their genetic make-up would
affect their diet. Consistent with this, 75% of participants agreed that learning about their genetic
make-up would affect what they ate. The greatest motivators participants reported for
undergoing genetic testing were to learn more about themselves and to encourage themselves to
adopt a healthier lifestyle (86% and 83%, respectively), while 73% of participants agreed that
they would take a genetic test to have their doctor monitor their health more closely. Only 7% of
participants strongly agreed that they would be uncomfortable learning about their genetic make-
up. Compared to the control group, subjects in the intervention group who received gene-based
104
dietary advice were more likely to agree that they understood the dietary advice they were given
(93% (I) vs. 78% (C); p = 0.009), that the recommendations would be useful when considering
their diet (88% (I) vs. 72% (C); p = 0.02), and wanted to know more about the recommendations
(95% (I) vs. 76% (C); p<0.0001). Only 9% of subjects in the intervention group reported feeling
uneasy about learning their genetic information.
Objective 2: Determine the effect that dietary advice based on genetic information has on
dietary intake after a 3- and 12-month intervention.
Results: At baseline, the proportion of subjects who did not meet the general recommendation
for caffeine, vitamin C, added sugars and sodium were 9%, 14%, 24% and 39%, respectively.
Thirty eight percent of subjects did not meet the targeted recommendation for caffeine intake at
baseline, while 80% did not meet the targeted recommendation for sodium intake. No significant
changes in dietary intakes of caffeine, vitamin C, added sugars, or sodium were observed
between baseline and the 3-month follow-up. At 12-months, subjects in the intervention group
who possessed a risk version of the ACE gene, and were advised to limit their sodium intake,
significantly reduced their sodium intake (mg/day) compared to the control group (mean ± SE: -
287.3 ± 114.1 vs. 129.8 ± 118.2, p=0.008). Those who had the non-risk version of ACE did not
significantly change their sodium intake compared to the control group (12-months: -244.2 ±
150.2, p=0.11). Among those with the risk version of the ACE gene, the proportion who met the
targeted recommendation of 1500 mg/day increased from 19% at baseline to 34% after 12
months (p=0.06). No significant changes in dietary intakes of caffeine, vitamin C or added
sugars were observed between baseline and the 12-month follow-up.
105
Objective 3: Determine individual preferences for obtaining personal genetic information and
determine if perceptions toward genetic testing and personalized nutrition changed over the
course of the intervention.
Results: On the 3-month survey, subjects were asked to indicate which source they felt would
provide them with the most accurate personal genetic information. The most commonly selected
response was “university research lab” (47%), followed by “healthcare professional” (41%) and
“direct-to-consumer genetic testing company” (12%). Subjects were also asked to indicate which
source they felt would provide them with the best personalized nutrition advice. The most
commonly selected response was “registered dietitian” (56%), followed by “medical doctor”
(27%), “naturopath” (8%), “registered nurse” (6%), and “other” (3%). On the 12-month survey,
subjects were asked if they shared the information in the report with anyone. A significantly
greater proportion of subjects in the intervention group shared the information with a family
member (31% (I) vs. 9% (C), p=0.005) or a friend (33% (I) vs. 7% (C), p=0.001). A significantly
greater proportion of subjects in the control group selected “I did not share the information with
anyone” when compared to the intervention group (10% (I) vs. 64% (C), p<0.0001). Only one
subject in the study, who was in the intervention group, shared the information with a healthcare
professional. At 12-months, subjects were also asked if they thought DNA-based dietary advice
is more useful than general population-based dietary advice. The majority of subjects (73%)
selected “yes”, 14% selected “no” and 14% selected “no opinion”.
At 3-months, significant changes in survey responses were observed for two out of four
repeated survey statements as compared to baseline responses among the entire sample of
subjects. Subject responses increased significantly toward the positive end of a Likert-type scale
for the statements “I am interested in the relationship between diet and genetics” (mean change ±
106
SD: 0.28 ± 0.99, p=0.0002) and “I would take a genetic test to have my healthcare professional
monitor my health more closely” (mean change ± SD: 0.20 ± 1.00, p=0.02). At 12-months,
subject responses for the statement “I am interested in the relationship between diet and
genetics” remained significantly increased toward the positive end of the scale, as compared to
baseline (mean change ± SD: 0.20 ± 1.04, p=0.02).
7.2 Other Considerations
The present thesis provides novel information on the dietary behavioural response to a
personalized nutrition intervention, as well as individual perceptions toward personalized
nutrition and genetic testing. However, the present project did not apply a theory of health
behaviour change to its study design, so information on factors that influenced behaviour change
was not obtained. One particular theoretical framework of health behaviour change that could be
applied to future studies investigating the impact of genetic information on health behaviour is
the Precaution Adoption Process Model (PAPM; Figure 7.1). PAPM is a stage theory that aims
to explain how an individual comes to decisions to take action against a health risk and,
subsequently, how (and if) the decision is translated into action (Weinstein et al., 2008).
Specifically, PAPM considers an individual’s response to a new health risk, something one has
recently learned about as opposed to something one has been aware of previously (Weinstein et
al., 2008). Since individuals do not know what genetic variants they possess prior to undergoing
genetic testing (although family history may provide an indication for disease susceptibility),
PAPM can be applied to investigations of how individuals respond to genetic test results and
how they come to decisions about what actions to take against new risks they may discover.
Moreover, due to the concept of genetic exceptionalism, the perception that genetic information
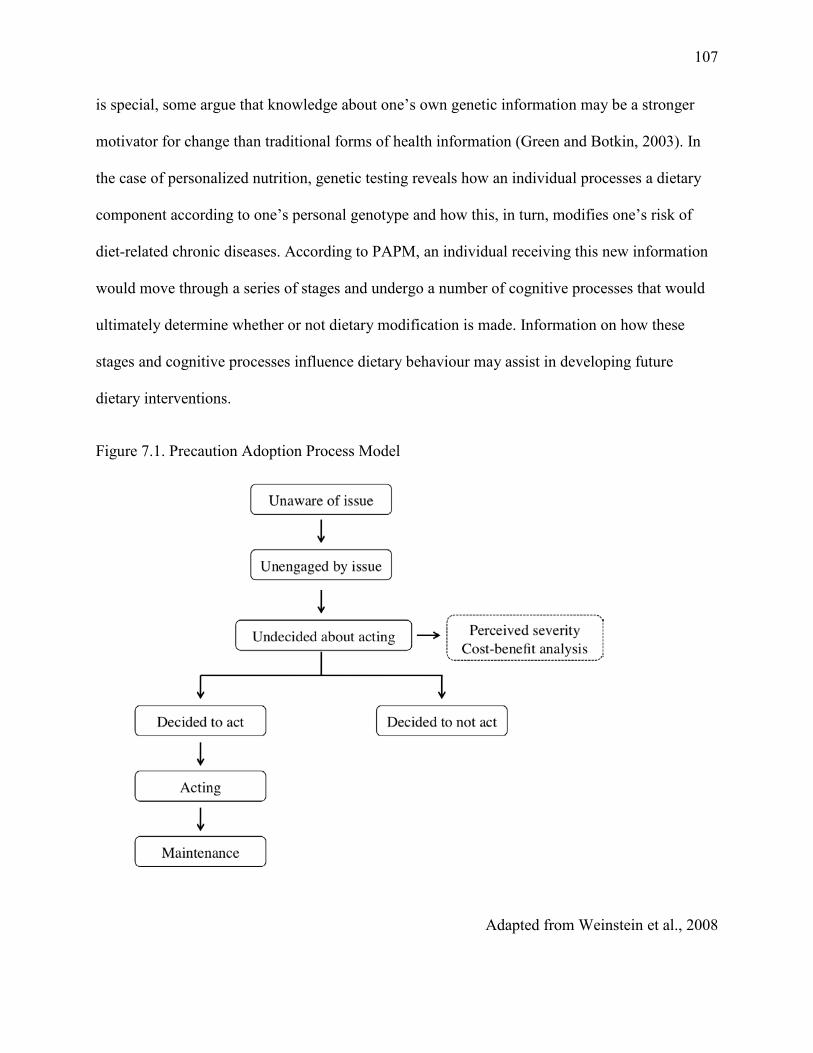
107
is special, some argue that knowledge about one’s own genetic information may be a stronger
motivator for change than traditional forms of health information (Green and Botkin, 2003). In
the case of personalized nutrition, genetic testing reveals how an individual processes a dietary
component according to one’s personal genotype and how this, in turn, modifies one’s risk of
diet-related chronic diseases. According to PAPM, an individual receiving this new information
would move through a series of stages and undergo a number of cognitive processes that would
ultimately determine whether or not dietary modification is made. Information on how these
stages and cognitive processes influence dietary behaviour may assist in developing future
dietary interventions.
Figure 7.1. Precaution Adoption Process Model
Adapted from Weinstein et al., 2008
108
In addition, the present thesis project reported a significant reduction in sodium intake
among the intervention risk group compared to the control group at 12-months (although sodium
intake was decreasing among this group at 3-months). Dietary behaviour change interventions
generally report success in the short-term, with long-term maintenance being difficult to achieve
(Crichton et al., 2012). One potential explanation for the impact of sodium advice mainly in the
long-term is the public health messaging that surrounds sodium and its association with
hypertension (Papadakis et al., 2010; Petrella et al., 2005). An online search of the media
archives of five leading health agencies between January 2011 and October 2012 (WHO, Centers
for Disease Control and Prevention (CDC), Health Canada, Public Health Agency of Canada,
and the Heart and Stroke Foundation) revealed that a greater number of media releases related to
sodium were issued during and after the 3-month follow-up assessment of the present study as
compared to the time that preceded the 3-month follow-up (Figure 7.2). These messages were
related to either newly published research papers reporting negative health effects of consuming
high amounts of sodium or to Canadian public health officials urging the federal government to
make sodium reduction a national priority.
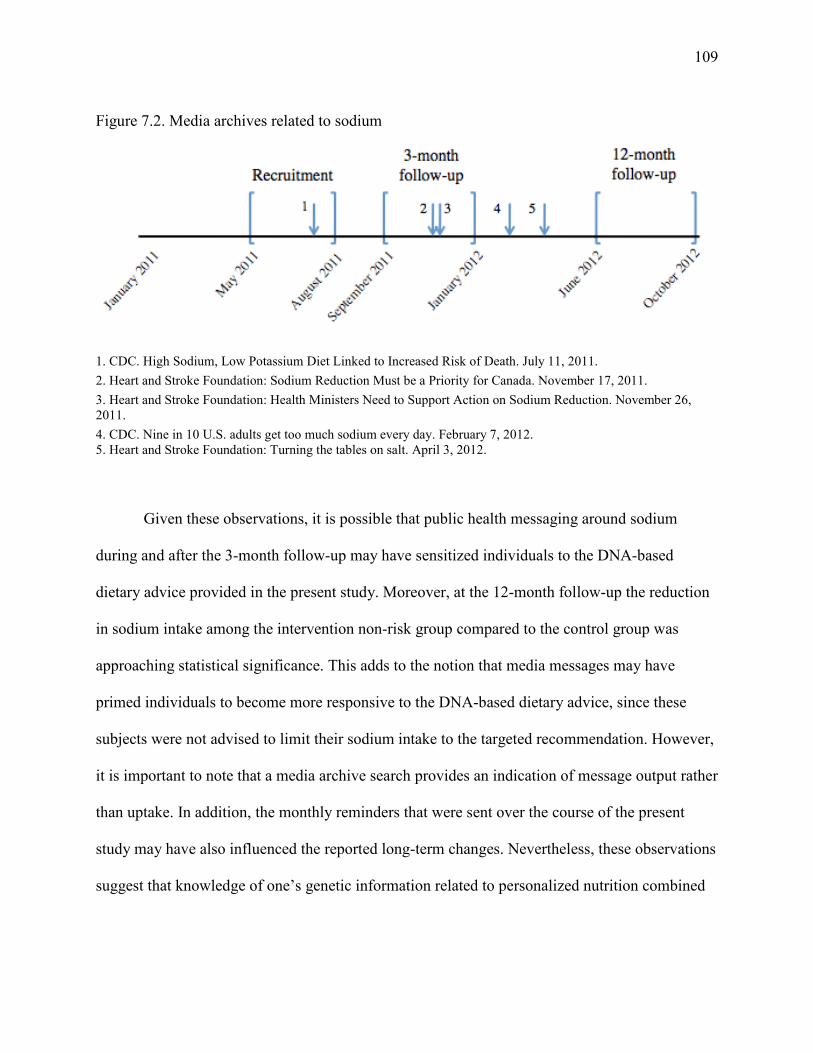
109
Figure 7.2. Media archives related to sodium
1. CDC. High Sodium, Low Potassium Diet Linked to Increased Risk of Death. July 11, 2011. 2. Heart and Stroke Foundation: Sodium Reduction Must be a Priority for Canada. November 17, 2011. 3. Heart and Stroke Foundation: Health Ministers Need to Support Action on Sodium Reduction. November 26, 2011. 4. CDC. Nine in 10 U.S. adults get too much sodium every day. February 7, 2012. 5. Heart and Stroke Foundation: Turning the tables on salt. April 3, 2012.
Given these observations, it is possible that public health messaging around sodium
during and after the 3-month follow-up may have sensitized individuals to the DNA-based
dietary advice provided in the present study. Moreover, at the 12-month follow-up the reduction
in sodium intake among the intervention non-risk group compared to the control group was
approaching statistical significance. This adds to the notion that media messages may have
primed individuals to become more responsive to the DNA-based dietary advice, since these
subjects were not advised to limit their sodium intake to the targeted recommendation. However,
it is important to note that a media archive search provides an indication of message output rather
than uptake. In addition, the monthly reminders that were sent over the course of the present
study may have also influenced the reported long-term changes. Nevertheless, these observations
suggest that knowledge of one’s genetic information related to personalized nutrition combined
110
with public health messaging may have the greatest impact on dietary behaviour and is a future
direction that warrants exploration.
7.3 Limitations
The work performed in this thesis has some potential limitations. First, dietary intake data was
assessed by self-report, which can be prone to errors such as underreporting of energy (Archer et
al., 2013; Brown, 2006; Garriguet, 2008b). As a result, some of the nutrient intakes, such as for
sodium or added sugars, may be underestimated. However, since the outcome measure in this
project was change in dietary intake and the same FFQ was used to assess intake throughout the
trial, the magnitude of change in intake should be a reliable estimate. Moreover, since the present
study was a randomized trial, any measurement errors in estimating dietary intake would apply
to both the intervention and control groups. As a result, the significant reduction in sodium
intake reported among the intervention risk group when compared to the change in sodium intake
of the control group would not be due to limitations of the dietary assessment tool used. While
FFQs are often used in large, population-based epidemiological studies assessing diet-disease
relationships, they have also been used in a number of intervention studies that have assessed
dietary change (Bhargava and Hays, 2004; Champagne et al., 2011; Collins et al., 2011; Hebert
et al., 1993; Helland-Kigen et al., 2013; Johansen et al., 2010; Kristal et al., 1994; Ochner and
Lowe, 2007; Potter J.D. et al., 1990; Prosser et al., 2010; Stern et al., 1993; Wright et al., 2011).
Significant changes in intakes of specific food items (Hebert et al., 1993; Helland-Kigen et al.,
2013; Johansen et al., 2010), macronutrients (Bhargava and Hays, 2004; Champagne et al., 2011;
Collins et al., 2011; Kristal et al., 1994; Potter J.D. et al., 1990; Stern et al., 1993) and
micronutrients (Bhargava and Hays, 2004; Ochner and Lowe, 2007; Prosser et al., 2010) were
111
reported in each of these studies, which demonstrates the ability of FFQs to capture changes in
dietary intake. However, the sensitivity of the Willett FFQ to measure within-person dietary
change has not been reported.
FFQ validation studies are commonly conducted to examine how accurately the tool
estimates dietary intake for certain nutrients or food items. A validation study typically involves
comparing FFQ dietary intake estimates with estimates obtained from other dietary instruments
such as 24-hour recalls or food records (Thompson and Byers, 1994). In the present thesis, a
Toronto-modified Willett FFQ was used to assess changes in dietary intake. A comparison was
made between the Toronto-modified questionnaire and a three day food record, although results
have yet to be published. A subset of subjects from the TNH study (n=100) were recruited to
complete a three day food record after they had completed the Toronto-modified FFQ. A
minimum of 24 hours needed to pass from completing the FFQ before subjects could begin the
three day food record. Nutrient intakes were assessed between the two instruments from food
sources only, since data on supplement intake was not recorded in the three day food records.
Pearson correlation coefficients for energy-adjusted nutrient intakes of interest to this thesis were
0.27 for sodium, 0.32 for vitamin C (food sources only), 0.57 for added sugars, and 0.84 for
caffeine (unpublished results; Table 7.1). These correlation coefficients were corrected for
attenuation arising from random error in within-person variability present in the data from the
food records, using the method described by Rosner and Willett (Rosner and Willett, 1988).
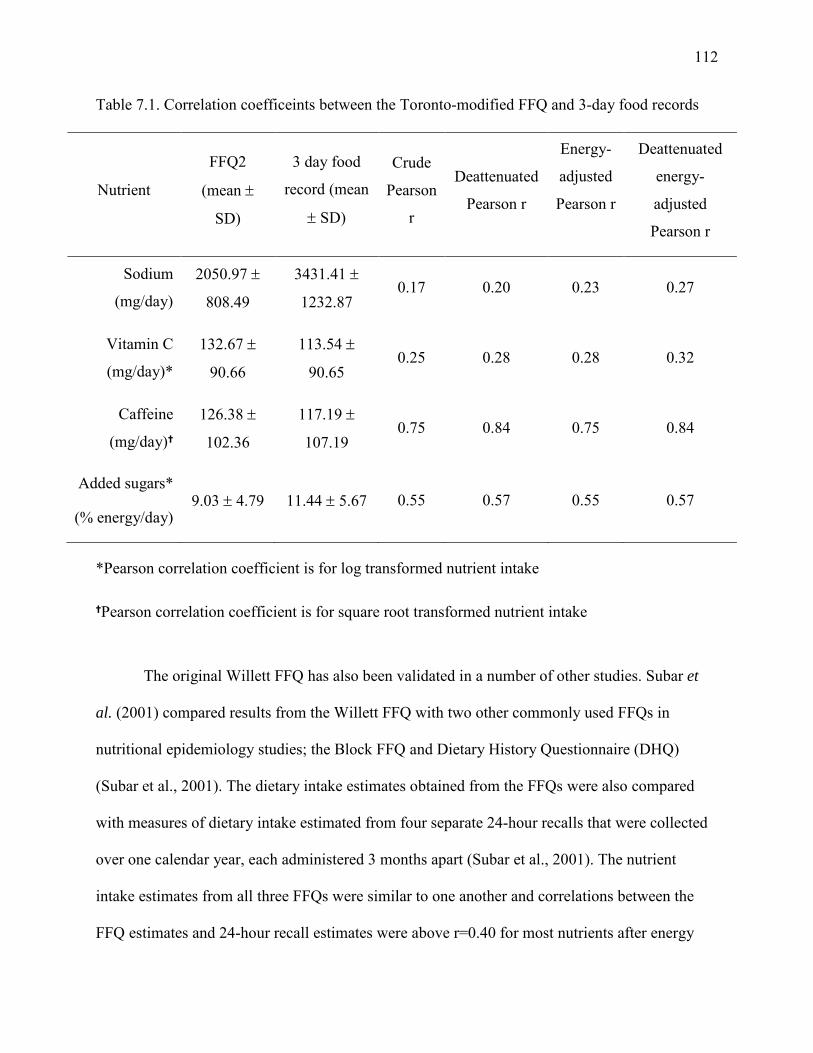
112
Table 7.1. Correlation coefficeints between the Toronto-modified FFQ and 3-day food records
Nutrient
FFQ2
(mean ±
SD)
3 day food
record (mean
± SD)
Crude
Pearson
r
Deattenuated
Pearson r
Energy-
adjusted
Pearson r
Deattenuated
energy-
adjusted
Pearson r
Sodium
(mg/day)
2050.97 ±
808.49
3431.41 ±
1232.87 0.17 0.20 0.23 0.27
Vitamin C
(mg/day)*
132.67 ±
90.66
113.54 ±
90.65 0.25 0.28 0.28 0.32
Caffeine
(mg/day)
126.38 ±
102.36
117.19 ±
107.19 0.75 0.84 0.75 0.84
Added sugars*
(% energy/day) 9.03 ± 4.79 11.44 ± 5.67 0.55 0.57 0.55 0.57
*Pearson correlation coefficient is for log transformed nutrient intake
Pearson correlation coefficient is for square root transformed nutrient intake
The original Willett FFQ has also been validated in a number of other studies. Subar et
al. (2001) compared results from the Willett FFQ with two other commonly used FFQs in
nutritional epidemiology studies; the Block FFQ and Dietary History Questionnaire (DHQ)
(Subar et al., 2001). The dietary intake estimates obtained from the FFQs were also compared
with measures of dietary intake estimated from four separate 24-hour recalls that were collected
over one calendar year, each administered 3 months apart (Subar et al., 2001). The nutrient
intake estimates from all three FFQs were similar to one another and correlations between the
FFQ estimates and 24-hour recall estimates were above r=0.40 for most nutrients after energy
113
adjustment (Subar et al., 2001). Therefore, Subar et al. (2001) concluded that all three FFQs
yielded similar results and all are comparable for nutritional epidemiology studies (Subar et al.,
2001). For the specific nutrients of interest to the present thesis, previous validation studies have
demonstrated a high degree of validity between the Willett FFQ and food records for assessing
caffeine (r=0.78 for coffee, r=0.93 for tea and r=0.85 for caffeinated soda) (Wu et al., 2005) and
moderate degrees for assessing added sugars (r=0.52-0.60 for sucrose) and vitamin C (r=0.53-
0.73) (Willet and Lenart, 1998). No study to date has published validation data demonstrating the
original Willett FFQ’s ability to measure sodium intake against food records, but one study
assessed its validity against multiple 24-hour recalls and reported correlation coefficients of
r=0.28 and r=0.30 for women and men, respectively, after energy adjustment (Subar et al., 2001).
For the nutrients of interest in the present study, the validity coefficients reported for the original
Willett FFQ are similar to those reported above for the Toronto-modified Willett FFQ.
Moreover, FFQs are generally used to assess relative intakes by grouping individuals into
quantiles of intake. The small sample size in the present study limits the ability to assess change
in relative intakes, so changes in absolute intake estimates were assessed. FFQs have been
documented to misclassify individual intakes (Tylavsky and Sharp, 1995), however, gross
misclassification into extreme quantiles is not common (Kroke et al., 1999; Shu et al., 2004;
Deschamps et al., 2007). In the present study, misclassification of dietary intake would bias the
findings towards the null rather than lead to a false positive result since a randomized design was
used. Nevertheless, the lower ability of the Toronto-modified Willett FFQ to estimate sodium
intake is a limitation of the present thesis. While a number of studies have assessed sodium
intake using FFQs (Ferreira-Sae et al., 2009; Geleijnse et al., 2007; Larsson et al., 2008; Nagata
et al., 2004; Umesawa et al., 2008), objective measures of sodium intake are preferred since they
114
provide more accurate estimates of intake compared to self-report. Urine samples provide an
objective biochemical measure of sodium intake and 24-hour urine collections, where
participants collect all urine output over a period of 24-hours, is considered the gold standard
because at least 90% of sodium intake is excreted in urine (Ji et al., 2012). One previous thesis
project compared self-reported sodium intake from a Willett FFQ with sodium intake measured
from single 24-hour urine samples and reported a correlation of r=0.66 among men (n= 127) and
r=0.56 among women (n=193) (Joseph, 1994). However, that project collected only a single
urine measurement. Since sodium intake varies day-to-day, multiple 24-hour urine collections
are required to obtain an accurate measurement of sodium consumption. One previous study
compared self-reported sodium intake from a FFQ with six 24-hour urine collections and
reported a correlation of r=0.13, however, that study examined absolute rather than energy-
adjusted nutrient intakes (Day et al., 2001). Moreover, 24-hour urine collections are costly, place
a great amount of burden on study participants and are prone to incompleteness (Ji et al., 2012).
Alternative measures, such as spot, overnight or timed urine samples, are available to assess
sodium intake, but these methods are prone to measurement error since sodium levels fluctuate
throughout the day (Ji et al., 2012). However, recent data from the INTERSALT study (n=5,696
men and women aged 20-59 years) provide supportive evidence for the use of spot urine samples
(from either morning, afternoon or evening) in combination with equations to estimate average
24-hour urine sodium excretion among populations of healthy, Western young adults (Brown et
al., 2013).
A second limitation of the present study is the selective group of subjects, who had been
recruited from a previous nutrigenomics study. Subjects in the present study were young adults,
mainly female and highly educated. These characteristics are representative of individuals with a
115
high degree of health literacy. Health literacy is defined by the WHO as “the cognitive and social
skills which determine the motivation and ability of individuals to gain access to, understand and
use information in ways which promote and maintain good health” (Nutbeam, 2008). Health
literacy better predicts health status than variables such as age, education, income, employment
and ethnicity (American Medical Association, 1999) and individuals with higher health literacy
have been shown to have improved health management compared to individuals with lower
health literacy in certain cases (Smith et al., 2013; Speirs et al., 2012; Taggart et al., 2012). A
2012 systematic review examined the effect of 52 different interventions aimed at increasing
health literacy on changes in smoking, nutrition, alcohol consumption, physical activity, or body
weight (SNAPW) (Taggart et al., 2012). Nearly all of the interventions (73%) improved health
literacy and 75% improved at least one outcome measure from SNAPW (Taggart et al., 2012).
Interventions that were of lower intensity (defined by the number of hours of contact with study
subjects) were somewhat more effective than higher intensity interventions at improving health
outcomes, and community interventions were more effective at improving nutrition and physical
activity outcomes than primary care interventions (Taggart et al., 2012). Primary care
interventions, however, were more effective than community interventions at supporting
smoking cessation (Taggart et al., 2012). However, not all studies support a positive association
between health literacy and improved health outcomes. A recent systematic review of 24
diabetes studies concluded that although higher health literacy was associated with higher
diabetes knowledge, it was not associated with clinical outcomes, self-reported complications,
self-efficacy or patient-provider interactions (Al Sayah et al., 2013).
Related to health literacy, nutrition literacy specifically describes “the degree to which
individuals can obtain, process, and understand the basic nutrition information and services they
116
need to make appropriate nutrition decisions” (Carbone, 2013). This is a relatively new term and
to date only one known nutrition literacy assessment exists; the 23-item Nutritional Literacy
Scale designed to measure an adult’s comprehension of nutrition information (Diamond, 2007).
However, this scale has only been used in one study to examine the association between nutrition
literacy and health indicators (Patel et al., 2013). As a result, little insight can presently be made
into the nutrition literacy of the general public.
A third limitation of the present study was the small sample size. A convenience sample
of subjects who previously participated in the TNH study was selected for the research in the
present thesis, since subjects’ genotypes were readily available along with dietary intake data.
The number of subjects included in final analyses of the present thesis varied slightly depending
on the outcome being assessed (e.g. under-reporters were excluded from dietary intake analyses,
but included in survey response analyses). A limitation of a previous study examining the
behavioural response to disclosure of health-related genetic information was that subjects were
already meeting the corresponding lifestyle recommendations at baseline (Bloss et al., 2011b).
Therefore, dietary exclusion criteria were applied to past TNH study participants prior to
enrolment in order to recruit subjects who were not already adhering to the dietary
recommendations that would be given in the randomized trial. The ideal dietary cut-off points
would have resulted in only 31 subjects eligible to be contacted for the trial (Table 4.3).
Therefore, these cut-off points were relaxed in order to increase the number of subjects who were
eligible to be contacted, while still excluding participants that were likely strongly adhering to
the dietary recommendations given in the trial. Although this resulted in a much larger eligible
pool of subjects (n=354, Table 4.2), only about 50% of these subjects responded to invitations to
participate in the present study and fewer (40%) were ultimately randomized. Re-contacting
117
previous study participants is a well-documented challenge in research studies and was one
factor that influenced the sample size of the present study (Hunt and White, 1998). Nevertheless,
the sample size of the present study is similar to previous studies that have assessed health
behaviour changes following disclosure of genetic information (Arkadianos et al., 2007; Chao et
al., 2008; Grant et al., 2013).
A fourth limitation of the present study was that changes in dietary intakes were assessed
separately over a short and long term period. This analysis was chosen since no previous study
had examined the short- and long-term effects of disclosing genetic information on health
behaviours at the time the present study was designed. Since then, only one study has reported on
short- and long-term outcomes, and in both cases the genetic information was not associated with
changes in dietary fat intake, exercise or anxiety (Bloss et al., 2011c; Bloss et al., 2013). An
alternative analysis is to use linear mixed models to assess the changes in dietary intakes over the
entire 1-year duration. This approach appropriately accounts for the effect of time and correlation
among measurements obtained from the same individual. As a result, linear mixed models
provide greater statistical power than the ANCOVA analysis conducted in the present thesis
(Sullivan, 2008).
7.3.1 Comparison of Nutrient Intake Estimates to Population Data
CCHS 2.2
The 2004 Canadian Community Health Survey, Cycle 2.2 (CCHS 2.2) collected dietary
intake data from 35,107 Canadians (n=18,820 were 19 years of age or older) using 24-hour
recalls. A second 24-hour recall was collected from a subset of the population in order to
estimate the day-to-day variation in usual dietary intake of the population using Software for
118
Intake Distribution Estimation (SIDE). A comparison of the reported nutrient intakes from the
present study with CCHS 2.2 data is provided below and demonstrates that the average intakes of
the nutrients assessed in the present study using the Toronto-modified Willett FFQ are similar to
the average intakes of the same nutrients assessed in the CCHS 2.2 using a 24-hour recall.
Caffeine
In the CCHS 2.2, coffee was the second most commonly consumed beverage following
water (Garriguet, 2008a). However, this finding was largely driven by the proportion of
individuals who were aged 31 years or older. Approximately 15% of women and 22% of men
between the ages of 31 and 70 years consumed above the recommendation of 400 mg of caffeine
per day (Garriguet, 2008a). Among younger individuals aged 19-31 years only 6.5% of women
and 9% of men consumed above the recommendation (Garriguet, 2008a). Moreover, CCHS 2.2
respondents aged 19-31 years were more likely to report consuming milk than coffee on the 24-
hour recall. Although population level average caffeine intakes have not been reported from the
CCHS 2.2, the aforementioned results are comparable to the small proportion of subjects in the
present study who consumed above 400 mg of caffeine per day at baseline and suggests that the
caffeine intakes of the subjects in the present study are similar to those of the Canadian
population in a similar age category.
Vitamin C
In the CCHS 2.2, nutrient intake assessments for nutrients with an EAR are made by
identifying the proportion of the sample with usual intakes below (considered inadequate intake)
or above (considered to meet or exceed requirements) the EAR, rather than comparing intakes to
the RDA because assessments made using the RDA would overestimate the prevalence of
inadequacy in a group (National Research Council, 2000). In the CCHS 2.2, 10% of females and
119
13% of males aged 19-30 years old had vitamin C intakes that were considered to be inadequate
(below the EAR for vitamin C) (Health Canada, 2012). However, the vitamin C intake estimate
from CCHS has a large coefficient of variation (16-33%) and CCHS 2.2 reports note that vitamin
C intake estimates should be interpreted with caution. In the present study, only 14% of subjects
consumed below the RDA for vitamin C at baseline, so even fewer would have consumed below
the EAR.
Sodium
Median sodium intakes in the CCHS 2.2 exceeded the AI (1500 mg/day for individuals
aged 9-50 years, 1300 mg/day for adults 51-70 years and 1200 mg/day for adults over 70 years
(Food and Nutrition Board, 1997)) for all Canadians and also exceeded the UL (2300mg/day
(Food and Nutrition Board, 1997)) for all Canadians over 19 years, with the exception of women
over 70 years. Sodium intakes in the present study were also high, with 39% of subjects
consuming above the UL and 80% of subjects consuming above the AI at baseline. However, the
larger proportion of subjects consuming sodium levels above the UL in the CCHS 2.2 as
compared to the present study indicates that sodium intakes may have been underestimated with
the modified Willett FFQ, or that the sample in the present study is not representative of the
broader Canadian population.
Added Sugars
The CCHS 2.2 dietary data provided total sugar intake as a percentage of energy per day,
but did not distinguish between added and naturally occurring sugars (Langlois and Garriguet,
2011). However, the average total sugar intake of approximately 20% energy per day reported in
the CCHS 2.2 (21.5% per day among respondents without diabetes) (Langlois and Garriguet,
2011) is similar to the baseline total sugar intake of 21% energy per day in the present study.
120
Moreover, a recent report from the Canadian Sugar Institute estimated the percentage of energy
intake from added sugars per day among Canadians to be between 10-13% (Brisbois and
Marsden, 2012), which is comparable to the baseline added sugars intake of 8% energy per day
reported in the present study. The Canadian Sugar Institute estimate is based from the CCHS 2.2
total sugar intake data and a finding from a United States Sugars Task Force, which reported that
added sugars account for roughly 50% of total sugar intake (Glinsmann et al., 1986).
7.4 Future Directions
The present thesis evaluated the effects of disclosing genetic information related to
personalized nutrition in a population of healthy, university educated young adults. These results
may not be generalizable to other populations, such as older individuals who may be managing
risk factors for chronic disease, or individuals who possess a lower degree of health literacy.
Therefore, additional studies are required to assess the effect of DNA-based dietary advice on
dietary intake in populations that differ demographically from the participants of the present
thesis. An assessment of health and nutrition literacy in future studies would demonstrate
whether these factors are associated with the behavioural response to DNA-based dietary advice.
Future studies would also benefit from collecting more objective measures of dietary intake, such
as 24-hour urine collections to assess sodium intake (Ji et al., 2012). Such measures of dietary
intake, as opposed to self-reported intake, would reduce the sample size required to detect an
effect of the intervention (Freedman et al., 2010). In addition, assessing changes in biomarkers of
health such as blood pressure, BMI, and HOMA-IR and HOMA-B, or hard outcomes (e.g. heart
121
attack or stroke) would demonstrate whether changes in dietary intake that follow disclosure of
DNA-based dietary advice have favourable effects on clinical outcomes.
While the present study was informed by certain aspects of health behaviour change
theories, such as cues to action from the Health Belief Model, a greater consideration of these
theories in future studies may provide additional insight into the process of dietary behaviour
change. In addition, the observation that a greater number of media messages surrounding
sodium occurred predominantly after the 3-month follow-up assessment of the present project
propose that an investigation into the combined impact of public health messaging and
personalized nutrition should be explored. Indeed, health communication through the media is
known to influence the health behaviours of individuals (Finnegan and Viswanath, 2008) and
assessing how public health messages interact with personalized nutrition information to impact
one’s actions may provide valuable insight on how population-based and individual-based
approaches can potentially be combined.
Moreover, while this thesis sheds light on individual perceptions toward genetic testing
for personalized nutrition through surveys, additional research applying qualitative research
methods may provide a greater understanding of critical issues that impact the clinical
application of personalized nutrition. Qualitative methods, such as focus groups and one-on-one
interviews, are useful for discovering and explaining observations, and can provide answers to
the “how” and “why” questions that are important to understand in order to appropriately
translate research findings into clinical practice (Green and Britten, 1998; Shuval et al., 2011).
Indeed, qualitative methods have been used extensively in research that examines both
healthcare professional and patient attitudes, beliefs, preferences and behaviours and is therefore
an important component of health services research (Mays and Pope, 1995; Pope et al., 2000;
122
Shuval et al., 2011). Specifically, interviews explore what research participants say about topics
in great detail and are useful for uncovering themes or ideas that were not anticipated when the
research was initiated (Britten, 1995). Interviews can vary in their degree of organization and
fixed vs. open-ended responses (structured, semi-structured or in depth), and require a trained
interviewer who is able to maintain control of the interview without influencing (or leading) the
participant’s responses (Britten, 1995). Focus groups are group interviews that utilize
communication between research participants to generate data (Kitzinger, 1995). They stem from
a belief that group conversations assist individuals in exploring and clarifying their views on a
topic (Kitzinger, 1995).
Strengths of qualitative research methods include their emphasis on “naturalism”, or
understanding observations in their everyday context, as well as an ability to take an inductive
approach to analysis where interpretation is derived from the data, rather than fitting data to pre-
existing concepts (deductive approach) (Green and Britten, 1998; Kuper et al., 2008; Pope and
Mays, 1995; Pope et al., 2000). Limitations of qualitative research are that the quality of the data
can depend on the skill of the interviewer and findings from qualitative studies may not be
generalizable to large populations since sample sizes are generally small (Kuper et al., 2008;
Pope et al., 2000). Nevertheless, an application of qualitative methods in future studies
examining the impact of DNA-based dietary advice on dietary behaviour could shed light on
how participants interpret DNA-based dietary advice and what factors contribute to whether or
not they decide to adhere to the advice. In addition, a qualitative component would allow for a
deeper exploration of why certain types of DNA-based advice are more effective at motivating
dietary change than others. For example, DNA-based advice for sodium in the present thesis
appeared to be the most impactful, but it is not clear what factors contributed to this effect.
123
The present thesis also provided novel insight into individual preferences for obtaining
personalized nutrition advice. Registered dietitians (RDs) were considered to be the best
providers of personalized nutrition advice, yet RDs have expressed low levels of genomics
knowledge and a lack of confidence to be able to counsel on genetic test results (Cormier et al.,
2014; Rosen et al., 2006). The development of clinical practice guidelines to create a
standardized approach to counselling has been proposed as one potential strategy for increasing
RDs’ confidence and comfort with personalized nutrition (Cormier et al., 2014). In addition,
incorporating greater genetics education in dietetics university curricula has also been proposed
(Prasad et al., 2011). Indeed, the Academy of Nutrition and Dietetics recently acknowledged that
dietitians with coursework in genetics and genomics are needed to advance the field of
nutrigenomics (Camp and Trujillo, 2014), while the Partnership for Dietetic Education and
Practice (Canada) identified ‘genetics and nutrigenomics’ as foundational knowledge areas for
dietetics students (Partnership for Dietetic Education and Practice, 2013). RDs with less than five
years of work experience have been reported to be the most familiar with nutrigenomics
(Cormier et al., 2014), which may indicate that this group received greater exposure to the
science during their educational training and could feel more comfortable with integrating
personalized nutrition into clinical practice (Rosen et al., 2006). Additional studies that provide
RDs with genetic tests for personalized nutrition and examine their perceptions of the testing and
counselling processes with their patients would provide insight into what specific challenges may
be present that would affect the clinical use of genetic tests for personalized nutrition.
Finally, the selection process for identifying genetic variants to include in a
nutrigenomics test should be considered in future studies. The present thesis examined the
behavioural response to genetic information derived from candidate gene analyses, some of
124
which had been replicated in independent studies. However, replication of an initial finding
should be a requirement for inclusion of a genetic variant in a genetic test. Methodologies, such
as genome-wide association studies (GWAS), are being used and provide novel genotype-
phenotype associations, including associations for caffeine and macronutrient intake (Cornelis et
al., 2011; Chu et al., 2013; Tanaka et al., 2013). The validity of initial findings (either from
candidate gene or genome-wide approaches) must be confirmed through replication studies, as a
number of false positives have been reported (Lohmueller et al., 2003; Tabangin et al., 2009;
Sionis et al., 2010). The National Cancer Institute-National Human Genome Research Institute
(NCI-NHGRI) assembled a working group to propose principles for the replication of genotype-
phenotype associations. Their report provided points for researchers and editors to consider when
evaluating initial association findings and their replication (Chanock et al., 2007). The following
criteria were suggested to establish a positive replication: the sample size of the replication
should be sufficient to distinguish the proposed effect from no effect, independent data sets
should be used consisting of a similar study population, the same or a very similar phenotype
should be assessed, the same genetic model used in the initial study should be used in replication
analyses, the effect size and statistical significance should be similar and the same SNP or a SNP
in very high linkage disequilibrium should be assessed (Chanock et al., 2007). These criteria
should be considered when identifying genetic variants to include in a nutrigenomics test.
125
7.5 Implications
The present study is the first randomized trial to evaluate the effects of disclosing genetic
information related to personalized nutrition on dietary intake and also the first trial to compare
perceptions of genetic testing and personalized nutrition between those who receive DNA-based
dietary advice and those who receive general dietary recommendations. The findings show that
DNA-based dietary advice results in greater changes in intake for some dietary components
compared to population-based dietary advice. Changes in health behaviours have not been
frequently reported in previous studies that have investigated the effect of disclosing genetic
information related to disease risk (Bloss et al., 2011b; Bloss et al., 2011c; Collier, 2012; Grant
et al., 2013) and a 2010 Cochrane review concluded that disclosing genetic risk information for
disease has little impact on actual behaviour, although it has a small effect on one’s intention to
change (Marteau et al., 2010). However, the genomic information provided in those studies was
related to disease susceptibility, not personalized nutrition, and the studies lacked a long-term
follow-up assessment. Moreover, participants in previous studies were not provided with
personalized recommendations on what behavioural strategies should be followed to mitigate
disease risk.
Results from the present study provide evidence that genetic testing for personalized
nutrition may be more clinically useful than testing for disease susceptibility, since a change in
sodium intake was observed after 12-months among the intervention risk group. Excessive
sodium intake at the population level is a significant public health issue and population-wide
strategies are being developed in an attempt to reduce the levels of sodium consumption. In fact,
Ontario recently proposed a bill requiring menu-labeling in restaurants to include sodium content
126
in addition to calories on menu items to target consumer behaviours (Ogilve, 2014). Providing
personalized DNA-based dietary advice for sodium intake may be a useful strategy for reducing
sodium intake among individuals who would benefit the most from sodium reduction, and could
potentially enhance the impact of public health messages around sodium and cardiovascular
health. In addition, the findings from the present thesis provide the first evidence of individual
preferences for obtaining personal genetic information and personalized nutritional advice. A
university research lab and healthcare professional were viewed more favorably than a DTC
genetic testing company as providers of accurate personal genetic information, and a registered
dietitian was selected as the best provider of personalized nutrition advice. Perceptions of
personalized nutrition and nutrigenomics testing changed over the course of the study, which
may have impacted dietary intake behaviour. Results from the present thesis demonstrate the
dietary behavioural response to disclosure of genetic information for personalized nutrition and
suggest that DNA-based dietary advice may be more useful than general population-based
recommendations at motivating individuals to adopt favourable dietary changes.
References
Abraham, C. 2012. Canadians answer call to share genetic data. The Globe and Mail. December 21, 2012. Available online at: http://www.theglobeandmail.com/news/national/time-to-lead/canadians-answer-call-to-share-genetic-data/article6635351/
Al Sayah, F., S.R. Majumdar, B. Williams, S. Robertson, and J.A. Johnson. 2013. Health literacy and health outcomes in diabetes: a systematic review. J Gen Intern Med. 28:444-452.
Allison, M. 2012. Direct-to-consumer genomics reinvents itself. Nat Biotechnol. 30:1027-1029.
Almeling, R., and S.K. Gadarian. 2013. Public opinion on policy issues in genetics and genomics. Genet Med. (Epud ahead of print).
American Medical Association, 1999. Health literacy: report of the Council on Scientific Affairs. Ad Hoc Committee on Health Literacy for the Council on Scientific Affairs, American Medical Association. JAMA. 281:552-557.
Anderson, J.W., E.C. Konz, R.C. Frederich, and C.L. Wood. 2001. Long-term weight-loss maintenance: a meta-analysis of US studies. Am J Clin Nutr. 74:579-584.
Annas, G.J., and S. Elias. 2014. 23andMe and the FDA. N Engl J Med. 370(11):985-8.
Archer, E., G.A. Hand, and S.N. Blair. 2013. Validity of U.S. nutritional surveillance:National Health and Nutrition Examination Survey caloric energy intake data, 1971-2010. PLoS One. 8:e76632.
Arkadianos, I., A.M. Valdes, E. Marinos, A. Florou, R.D. Gill, and K.A. Grimaldi. 2007. Improved weight management using genetic information to personalize a calorie controlled diet. Nutr J. 6:29.
Atwater, W.O. 1894. Foods: Nutritive value and cost. U.S. Department of Agriculture, Farmer's Bulletin No. 23.
Audrain, J., N.R. Boyd, J. Roth, D. Main, N.F. Caporaso, and C. Lerman. 1997. Genetic susceptibility testing in smoking-cessation treatment: one-year outcomes of a randomized trial. Addict Behav. 22:741-751.
Bandura, A. 1977. Self-efficacy: toward a unifying theory of behavioral change. Psychol Rev. 84:191-215.
Barte, J.C., N.C. ter Bogt, R.P. Bogers, P.J. Teixeira, B. Blissmer, T.A. Mori, and W.J. Bemelmans. 2010. Maintenance of weight loss after lifestyle interventions for overweight and obesity, a systematic review. Obes Rev. 11:899-906.
128
Bartsch, H., M. Rojas, U. Nair, J. Nair, and K. Alexandrov. 1999. Genetic cancer susceptibility and DNA adducts: studies in smokers, tobacco chewers, and coke oven workers. Cancer Detect Prev. 23:445-453.
Becker, G.S., M. Grossman, and K.M. Murphy. 1994. An empirical analysis of cigarette addiction. Am Economic Rev. 84:396e418.
Bedard, D., B. Shatenstein, and S. Nadon. 2004. Underreporting of energy intake from a self-administered food-frequency questionnaire completed by adults in Montreal. Public Health Nutr. 7:675-681.
Beynen, A.C., R.J. Hermus, and J.G. Hautvast. 1980. A mathematical relationship between the fatty acid composition of the diet and that of the adipose tissue in man. Am J Clin Nutr. 33:81-85.
Bhargava, A., R. Forthofer, S. McPherson, and M. Nichaman. 1994. Estimating the variations and autocorrelations in dietary intakes on weekdays and weekends. Stat Med. 13:113-126.
Bhargava, A., and J. Hays. 2004. Behavioral variables and education are predictors of dietary change in the Women's Health Trial: Feasibility Study in Minority Populations. Prev Med. 38:442-451.
Bibbins-Domingo, K., G.M. Chertow, P.G. Coxson, A. Moran, J.M. Lightwood, M.J. Pletcher, and L. Goldman. 2010. Projected effect of dietary salt reductions on future cardiovascular disease. N Engl J Med. 362:590-599.
Bingham, S.A., and J.H. Cummings. 1985. Urine nitrogen as an independent validatory measure of dietary intake: a study of nitrogen balance in individuals consuming their normal diet. Am J Clin Nutr. 42:1276-1289.
Birmingham, W.C., N. Agarwal, W. Kohlmann, L.G. Aspinwall, M. Wang, J. Bishoff, C. Dechet, and A.Y. Kinney. 2013. Patient and provider attitudes toward genomic testing for prostate cancer susceptibility: a mixed method study. BMC Health Serv Res. 13:279.
Bloss, C.S., B.F. Darst, E.J. Topol, and N.J. Schork. 2011a. Direct-to-consumer personalized genomic testing. Hum Mol Genet. 20:R132-141.
Bloss, C.S., L. Madlensky, N.J. Schork, and E.J. Topol. 2011b. Genomic information as a behavioral health intervention: can it work? Per Med. 8:659-667.
Bloss, C.S., N.J. Schork, and E.J. Topol. 2011c. Effect of direct-to-consumer genomewide profiling to assess disease risk. N Engl J Med. 364:524-534.
Bloss, C.S., N.E. Wineinger, B.F. Darst, N.J. Schork, and E.J. Topol. 2013. Impact of direct-to-consumer genomic testing at long term follow-up. J Med Genet. 50:393-400.
129
Booth, G.L., M.I. Creatore, R. Moineddin, P. Gozdyra, J.T. Weyman, F.I. Matheson, and R.H. Glazier. 2013. Unwalkable neighborhoods, poverty, and the risk of diabetes among recent immigrants to Canada compared with long-term residents. Diabetes Care. 36:302-308.
Borry, P., R.E. van Hellemondt, D. Sprumont, C.F. Jales, E. Rial-Sebbag, T.M. Spranger, L. Curren, J. Kaye, H. Nys, and H. Howard. 2012. Legislation on direct-to-consumer genetic testing in seven European countries. Eur J Hum Genet. 20:715-721.
Brewer, N.T., and B.K. Rimer. 2008. Perspectives on health behavior theories that focus on individuals. In Health behaviour and health education: theory, research, and practice. K. Glanz, B.K. Rimer, and K. Viswanath, editors. Jossey-Bass, San Francisco. 149-162.
Brisbois T.D., and S.L. Marsden. 2012. Estimated intakes of added sugars in Canada and relationship to trends in body weight. Can J Diabetes. 36:S66.
Britten, N. 1995. Qualitative interviews in medical research. BMJ. 311:251-253.
Brown, D. 2006. Do food frequency questionnaires have too many limitations? J Am Diet Assoc. 106:1541-1542.
Brown, I.J., A.R. Dyer, Q. Chan, M.E. Cogswell, H. Ueshima, J. Stamler, P. Elliott, and I.C.-O.R. Group. 2013. Estimating 24-hour urinary sodium excretion from casual urinary sodium concentrations in Western populations: the INTERSALT study. Am J Epidemiol. 177:1180-1192.
Burk-Braxton, C.L. 1996. Is shame a factor in overweight relapse? Diss Abstr Int B Sci Eng. 57:4052.
Burke, W. 2009. Clinical validity and clinical utility of genetic tests. Curr Protoc Hum Genet. Chapter 9:Unit 9 15.
Burton, H., G.S. Sagoo, P. Pharoah, and R.L. Zimmern. 2012. Time to revisit Geoffrey Rose: strategies for prevention in the genomic era? Italian Journal of Public Health. 9:e8665.
Buzzard, M. 1998. 24-hour dietary recall and food record methods. In Nutritional Epidemiology. W. Willet, editor. Oxford University Press, New York, NY. 50-73.
Cahill L.E. and El-Sohemy A. 2011. Nutrigenomics: A Possible Road to Personalized Nutrition. In Comprehensive Biotechnology. Vol. 4. M. Moo-Young, editor. Elsevier. 703-712.
Cahill, L.E., B. Fontaine-Bisson, and A. El-Sohemy. 2009. Functional genetic variants of glutathione S-transferase protect against serum ascorbic acid deficiency. Am J Clin Nutr. 90:1411-1417.
Camp, K.M., and E. Trujillo. 2014. Position of the Academy of Nutrition and Dietetics: Nutritional Genomics. J Acad Nutr Diet. 114:299-312.
130
Carbone, E.T. 2013. Measuring Nutrition Literacy: Problems and Potential Solution. J Nutr Disorders Ther. 3:e105.
Carlsten C., G.S. Sagoo, A.J. Frodsham, W. Burke, and J.P. Higgins. 2008. Glutathione S-transferase M1 (GSTM1) polymorphisms and lung cancer: a literature-based systematic HuGE review and meta-analysis. Am J Epidemiol. 167(7):759-74.
Caulfield, T., and A.L. McGuire. 2012. Direct-to-consumer genetic testing: perceptions, problems, and policy responses. Annu Rev Med. 63:23-33.
Caulfield, T., N.M. Ries, P.N. Ray, C. Shuman, and B. Wilson. 2010. Direct-to-consumer genetic testing: good, bad or benign? Clin Genet. 9:48-50.
Cawley, J., S. Markowitz, and J. Tauras. 2004. Lighting up and slimming down: the effects of body weight and cigarette prices on adolescent smoking initiation. J Health Econ. 23:293-311.
Chaloupka, F.J., K. Straif, M.E. Leon, and International Agency for Research on Cancer Working Group. 2011. Effectiveness of tax and price policies in tobacco control. Tob Control. 20:235-238.
Champagne, C.M., S.T. Broyles, L.D. Moran, K.C. Cash, E.J. Levy, P.H. Lin, B.C. Batch, L.F. Lien, K.L. Funk, A. Dalcin, C. Loria, and V.H. Myers. 2011. Dietary intakes associated with successful weight loss and maintenance during the Weight Loss Maintenance trial. J Am Diet Assoc. 111:1826-1835.
Champion V.L., and S.C. Skinner. 2008. The Health Belief Model. In Health behaviour and health education: theory, research, and practice. K. Glanz, B.K. Rimer, and K. Viswanath, editors. Jossey-Bass, San Francisco. 45-62.
Chanock, S.J., T. Manolio, M. Boehnke, E. Boerwinkle, D.J. Hunter, G. Thomas, J.N. Hirschhorn, G. Abecasis, D. Altshuler, J.E. Bailey-Wilson, L.D. Brooks, L.R. Cardon, M. Daly, P. Donnelly, J.F. Fraumeni, Jr., N.B. Freimer, D.S. Gerhard, C. Gunter, A.E. Guttmacher, M.S. Guyer, E.L. Harris, J. Hoh, R. Hoover, C.A. Kong, K.R. Merikangas, C.C. Morton, L.J. Palmer, E.G. Phimister, J.P. Rice, J. Roberts, C. Rotimi, M.A. Tucker, K.J. Vogan, S. Wacholder, E.M. Wijsman, D.M. Winn, and F.S. Collins. 2007. Replicating genotype-phenotype associations. Nature. 447:655-660.
Chao, S., J.S. Roberts, T.M. Marteau, R. Silliman, L.A. Cupples, and R.C. Green. 2008. Health behavior changes after genetic risk assessment for Alzheimer disease: The REVEAL Study. Alzheimer Dis Assoc Disord. 22:94-97.
Cherkas, L.F., J.M. Harris, E. Levinson, T.D. Spector, and B. Prainsack. 2010. A survey of UK public interest in internet-based personal genome testing. PLoS One. 5:e13473.
Cho A.H., Killeya-Jones L.A., Suchindran S., and e. al. 2012. Preliminary outcomes of genetic risk testing in primary care for common DNA variants associated with Type 2 diabetes.
131
Abstracts from the 35th Annual Meeting of the Society of General Internal Medicine. Orlando, FL, USA, 9–12 May 2012. J Gen Intern Med. 27:S278.
Cho, A.H., L.A. Killeya-Jones, J.M. O'Daniel, K. Kawamoto, P. Gallagher, S. Haga, J.E. Lucas, G.M. Trujillo, S.V. Joy, and G.S. Ginsburg. 2012. Effect of genetic testing for risk of type 2 diabetes mellitus on health behaviors and outcomes: study rationale, development and design. BMC Health Serv Res. 12:16.
Chu, A.Y., T. Workalemahu, N.P. Paynter, L.M. Rose, F. Giulianini, et al. 2013. Novel locus including FGF21 is associated with dietary macronutrient intake. Hum Mol Genet. 22(9):1895-902.
Christensen, K.D., Green R.C. 2013. How could disclosing incidental information from whole-genome sequencing affect patient behavior? Per Med. 10:377-386.
Claes, E., L. Denayer, G. Evers-Kiebooms, A. Boogaerts, K. Philippe, S. Tejpar, K. Devriendt, and E. Legius. 2005. Predictive testing for hereditary nonpolyposis colorectal cancer: subjective perception regarding colorectal and endometrial cancer, distress, and health-related behavior at one year post-test. Genet Test. 9:54-65.
Coghlan, A. 2013. 23andMe ordered to stop selling $99 genetic test. New Scientist. 18(51).
Collier, R. 2012. Predisposed to risk but not change. CMAJ. 184:E407-408.
Collins, C.E., P.J. Morgan, J.M. Warren, D.R. Lubans, and R. Callister. 2011. Men participating in a weight-loss intervention are able to implement key dietary messages, but not those relating to vegetables or alcohol: the Self-Help, Exercise and Diet using Internet Technology (SHED-IT) study. Public Health Nutr. 14:168-175.
Collins, J., B. Bertrand, V. Hayes, S.X. Li, J. Thomas, H. Truby, and K. Whelan. 2013. The application of genetics and nutritional genomics in practice: an international survey of knowledge, involvement and confidence among dietitians in the US, Australia and the UK. Genes Nutr. 8:523-533.
Collins, V., B. Meiser, C. Gaff, D.J. St John, and J. Halliday. 2005. Screening and preventive behaviors one year after predictive genetic testing for hereditary nonpolyposis colorectal carcinoma. Cancer. 104:273-281.
Conradt, M., J.M. Dierk, P. Schlumberger, C. Albohn, E. Rauh, A. Hinney, J. Hebebrand, and W. Rief. 2009. A consultation with genetic information about obesity decreases self-blame about eating and leads to realistic weight loss goals in obese individuals. J Psychosom Res. 66:287-295.
Cormier, H., B.L. Tremblay, A.M. Paradis, V. Garneau, S. Desroches, J. Robitaille, and M.C. Vohl. 2014. Nutrigenomics - perspectives from registered dietitians: a report from the Quebec-wide e-consultation on nutrigenomics among registered dietitians. J Hum Nutr Diet.
132
Cornelis, M.C., A. El-Sohemy, E.K. Kabagambe, and H. Campos. 2006. Coffee, CYP1A2 genotype, and risk of myocardial infarction. JAMA. 295:1135-1141.
Cornelis, M.C., K.L. Monda, K. Yu, N. Paynter, E.M. Azzato, S.N. Bennett, S.I. Berndt, E. Boerwinkle, S. Chanock, N. Chatterjee, D. Couper, G. Curhan, G. Heiss, F.B. Hu, D.J. Hunter, K. Jacobs, M.K. Jensen, P. Kraft, M.T. Landi, J.A. Nettleton, M.P. Purdue, P. Rajaraman, E.B. Rimm, L.M. Rose, N. Rothman, D. Silverman, R. Stolzenberg-Solomon, A. Subar, M. Yeager, D.I. Chasman, R.M. van Dam, and N.E. Caporaso. 2011. Genome-wide meta-analysis identifies regions on 7p21 (AHR) and 15q24 (CYP1A2) as determinants of habitual caffeine consumption. PLoS Genet. 7:e1002033.
Day, N.E., N. McKeown, M.Y. Wong, A. Welch, and S. Bingham. 2001. Epidemiological assessment of diet: comparison of a 7-day diary with a food frequency questionnaire using urinary markers of nitrogen, potassium and sodium. Int J Epi. 30:309-17.
de Vet, E., J. de Nooijer, N.K. de Vries, and J. Brug. 2007. Comparing stage of change and behavioral intention to understand fruit intake. Health Educ Res. 22:599-608.
Deschamps V., B. de Lauzon-Guillain, L. Lafay, J.M. Borys, M.A. Charles, and M. Romon. 2007. Reproducibility and relative validity of a food-frequency questionnaire among French adults and adolescents. Eur J Clin Nutr. 63(2):282-91.
Desroches, S., A. Lapointe, S. Ratte, K. Gravel, F. Legare, and J. Thirsk. 2011. Interventions to enhance adherence to dietary advice for preventing and managing chronic diseases in adults: a study protocol. BMC Public Health. 11:111.
Diamond, J.J. 2007. Development of a reliable and construct valid measure of nutritional literacy in adults. Nutr J. 6:5.
El-Sohemy, A. 2007. Nutrigenetics. Forum Nutr. 60:25-30.
Eng, C., and R.R. Sharp. 2010. Bioethical and clinical dilemmas of direct-to-consumer personal genomic testing: the problem of misattributed equivalence. Sci Transl Med. 2:17cm15.
Eny K.M., and A. El-Sohemy. 2010. The Genetic Determinants of Ingestive Behaviour: Sensory, Energy Homeostasis and Food Reward aspects of Ingestive Behaviour. In Obesity Prevention: the role of brain and society on individual behavior. B.A. Dube L, Dagher A, Drewnowski A, LeBel J, James P, Yada RY, and Laflamme-Sanders M.-C., editors. Elsevier. 149–160.
Eny, K.M., P.N. Corey, and A. El-Sohemy. 2009. Dopamine D2 receptor genotype (C957T) and habitual consumption of sugars in a free-living population of men and women. J Nutrigenet Nutrigenomics. 2:235-242.
Eny, K.M., T.M. Wolever, P.N. Corey, and A. El-Sohemy. 2010. Genetic variation in TAS1R2 (Ile191Val) is associated with consumption of sugars in overweight and obese individuals in 2 distinct populations. Am J Clin Nutr. 92:1501-1510.
133
Farrer, L.A., L.A. Cupples, J.L. Haines, B. Hyman, W.A. Kukull, R. Mayeux, R.H. Myers, M.A. Pericak-Vance, N. Risch, and C.M. van Duijn. 1997. Effects of age, sex, and ethnicity on the association between apolipoprotein E genotype and Alzheimer disease. A meta-analysis. APOE and Alzheimer Disease Meta Analysis Consortium. JAMA. 278:1349-1356.
Ferguson, L.R., Barnett MPG. 2012. Research in nutrigenomics and potential applications to practice. Nutr & Dietet. 69:198-202.
Ferreira-Sae, M.C., M.C. Gallani, W. Nadruz, R.C. Rodrigues, K.G. Franchini, P.C. Cabral, and M.L. Sales. 2009. Reliability and validity of a semi-quantitative FFQ for sodium intake in low-income and low-literacy Brazilian hypertensive subjects. Public Health Nutr. 12:2168-2173.
Finnegan, J.R., and K. Viswanath. 2008. Communication Theory and Health Behaviour Change. In Health behaviour and health education: theory, research, and practice. K. Glanz, B.K. Rimer, and K. Viswanath, editors. Jossey-Bass, San Francisco. 363-387.
Fontaine-Bisson, B., and A. El-Sohemy. 2008. Genetic polymorphisms of tumor necrosis factor-alpha modify the association between dietary polyunsaturated fatty acids and plasma high-density lipoprotein-cholesterol concentrations in a population of young adults. J Nutrigenet Nutrigenomics. 1(5):215-23.
Food and Drug Administration. 2013. 23and Me, Inc. 11/22/13. Available online at: http://www.fda.gov/iceci/enforcementactions/warningletters/2013/ucm376296.htm
Food and Nutrition Board. 1994. How should the recommended dietary allowances be revised? A concept paper from the Food and Nutrition Board. Nutr Rev. 52:216-219.
Food and Nutrition Board. 1997. Dietary reference intakes. Nutr Rev. 55:319-326.
Francke, U., C. Dijamco, A.K. Kiefer, N. Eriksson, B. Moiseff, J.Y. Tung, and J.L. Mountain. 2013. Dealing with the unexpected: consumer responses to direct-access BRCA mutation testing. PeerJ 1:e8.
Frank, L.D., and P. Engelke. 2011. How land use and transportation systems impact public health: a literature review of the relationship between physical activity and built form. Active Community Environments Initiative Working Paper #1. Centers for Disease Control and Prevention.
Franz, G.A. 2008. Price effects on the smoking behaviour of adult age groups. Public Health. 122:1343-1348.
Frayling, T.M., N.J. Timpson, M.N. Weedon, E. Zeggini, R.M. Freathy, C.M. Lindgren, J.R. Perry, K.S. Elliott, H. Lango, N.W. Rayner, B. Shields, L.W. Harries, J.C. Barrett, S. Ellard, C.J. Groves, B. Knight, A.M. Patch, A.R. Ness, S. Ebrahim, D.A. Lawlor, S.M. Ring, Y. Ben-Shlomo, M.R. Jarvelin, U. Sovio, A.J. Bennett, D. Melzer, L. Ferrucci, R.J. Loos, I. Barroso, N.J. Wareham, F. Karpe, K.R. Owen, L.R. Cardon, M. Walker, G.A.
134
Hitman, C.N. Palmer, A.S. Doney, A.D. Morris, G.D. Smith, A.T. Hattersley, and M.I. McCarthy. 2007. A common variant in the FTO gene is associated with body mass index and predisposes to childhood and adult obesity. Science. 316:889-894.
Freedman, L.S., V. Kipnis, A. Schatzkin, N. Tasevska, and N. Potischman. 2010. Can we use biomarkers in combination with self-reports to strengthen the analysis of nutritional epidemiologic studies? Epidemiol Perspect Innov. 7:2.
Frohlich, K.L., and L. Potvin. 2008. Transcending the known in public health practice: the inequality paradox: the population approach and vulnerable populations. Am J Public Health. 98:216-221.
Frosch, D.L., P. Mello, and C. Lerman. 2005. Behavioral consequences of testing for obesity risk. Cancer Epidemiol Biomarkers Prev. 14:1485-1489.
Garcia-Bailo, B., C. Toguri, K.M. Eny, and A. El-Sohemy. 2009. Genetic variation in taste and its influence on food selection. OMICS. 13:69-80.
Garriguet, D. 2008a. Beverage consumption of Canadian adults. Health Rep. 19:23-29.
Garriguet, D. 2008b. Under-reporting of energy intake in the Canadian Community Health Survey. Health Rep. 19:37-45.
Geleijnse, J.M., J.C. Witteman, T. Stijnen, M.W. Kloos, A. Hofman, and D.E. Grobbee. 2007. Sodium and potassium intake and risk of cardiovascular events and all-cause mortality: the Rotterdam Study. Eur J Epidemiol. 22:763-770.
Giner, V., E. Poch, E. Bragulat, J. Oriola, D. Gonzalez, A. Coca, and A. De La Sierra. 2000. Renin-angiotensin system genetic polymorphisms and salt sensitivity in essential hypertension. Hypertension. 35:512-517.
Gittelsohn, J., S.H. Lee-Kwan, and B. Batorsky. 2013. Community-based interventions in prepared-food sources: a systematic review. Prev Chronic Dis. 10:E180.
Glazier, R.H., M.I. Creatore, J.T. Weyman, G. Fazli, F.I. Matheson, P. Gozdyra, R. Moineddin, V.K. Shriqui, and G.L. Booth. 2014. Density, destinations or both? A comparison of measures of walkability in relation to transportation behaviors, obesity and diabetes in Toronto, Canada. PLoS One. 9:e85295.
Glenn K.L., Z.Q. Du, J.C. Eisenmann, M.F. Rothschild. 2009. An alternative method for genotyping of the ACE I/D polymorphism. Mol Biol Rep. 36(6):1305-10.
Glinsmann, W.H., H. Irausquin, and Y.K. Park. 1986. Evaluation of health aspects of sugars contained in carbohydrate sweeteners. Report of Sugars Task Force, 1986. J Nutr. 116:S1-216.
Goddard, K.A., D. Duquette, A. Zlot, J. Johnson, A. Annis-Emeott, P.W. Lee, M.P. Bland, K.L. Edwards, K. Oehlke, R.T. Giles, A. Rafferty, M.L. Cook, and M.J. Khoury. 2009. Public
135
awareness and use of direct-to-consumer genetic tests: results from 3 state population-based surveys, 2006. Am J Public Health. 99:442-445.
Goddard, K.A., C. Moore, D. Ottman, K.L. Szegda, L. Bradley, and M.J. Khoury. 2007. Awareness and use of direct-to-consumer nutrigenomic tests, United States, 2006. Genet Med. 9:510-517.
Gollust, S.E., E.S. Gordon, C. Zayac, G. Griffin, M.F. Christman, R.E. Pyeritz, L. Wawak, and B.A. Bernhardt. 2012. Motivations and perceptions of early adopters of personalized genomics: perspectives from research participants. Public Health Genomics. 15:22-30.
Grant, R.W., K.E. O'Brien, J.L. Waxler, J.L. Vassy, L.M. Delahanty, L.G. Bissett, R.C. Green, K.G. Stember, C. Guiducci, E.R. Park, J.C. Florez, and J.B. Meigs. 2013. Personalized genetic risk counseling to motivate diabetes prevention: a randomized trial. Diabetes Care. 36:13-19.
Green, E.D., and M.S. Guyer. 2011. Charting a course for genomic medicine from base pairs to bedside. Nature. 470:204-213.
Green, J., and N. Britten. 1998. Qualitative research and evidence based medicine. BMJ. 316:1230-1232.
Green, M.J., and J.R. Botkin. 2003. "Genetic exceptionalism" in medicine: clarifying the differences between genetic and nongenetic tests. Ann Intern Med. 138:571-575.
Green, R.C., L.A. Cupples, R. Go, K.S. Benke, T. Edeki, P.A. Griffith, M. Williams, Y. Hipps, N. Graff-Radford, D. Bachman, and L.A. Farrer. 2002. Risk of dementia among white and African American relatives of patients with Alzheimer disease. JAMA. 287:329-336.
Green, R.C., and N.A. Farahany. 2014. Regulation: The FDA is overcautious on consumer genomics. Nature. 505:286-287.
Hadley, D.W., J.F. Jenkins, E. Dimond, M. de Carvalho, I. Kirsch, and C.G. Palmer. 2004. Colon cancer screening practices after genetic counseling and testing for hereditary nonpolyposis colorectal cancer. J Clin Oncol. 22:39-44.
Halbert, C.H., H. Lynch, J. Lynch, D. Main, S. Kucharski, A.K. Rustgi, and C. Lerman. 2004. Colon cancer screening practices following genetic testing for hereditary nonpolyposis colon cancer (HNPCC) mutations. Arch Intern Med. 164:1881-1887.
Harris, A., S.E. Kelly, and S. Wyatt. 2013. Counseling customers: emerging roles for genetic counselors in the direct-to-consumer genetic testing market. J Genet Couns. 22:277-288.
Health Canada. 2010. The Development of the Dietary Reference Intakes. Available online at: http://www.hc-sc.gc.ca/fn-an/nutrition/reference/dri_dev-elab_anref-eng.php
136
Health Canada. 2012. Do Canadian Adults Meet their Nutrient Requirements through Food Intake Alone? Available online at: http://www.hc-sc.gc.ca/fn-an/surveill/nutrition/commun/art-nutr-adult-eng.php
Health Canada. 2013. Nomination for New Dietary Reference Intakes Reviews. Available online at: http://www.hc-sc.gc.ca/fn-an/nutrition/reference/dri_nominations-eng.php
Hebert, J.R., A.M. Stoddard, D.R. Harris, G. Sorensen, M.K. Hunt, D.H. Morris, and J.K. Ockene. 1993. Measuring the effect of a worksite-based nutrition intervention on food consumption. Ann Epidemiol. 3:629-635.
Helland-Kigen, K.M., M.K. Raberg Kjollesdal, V.T. Hjellset, B. Bjorge, G. Holmboe-Ottesen, and M. Wandel. 2013. Maintenance of changes in food intake and motivation for healthy eating among Norwegian-Pakistani women participating in a culturally adapted intervention. Public Health Nutr. 16:113-122.
Hicken, B., and D. Tucker. 2002. Impact of genetic risk feedback: Perceived risk and motivation for health protective behaviours. Psychol Health Med. 7:25-36.
Hishida, A., T. Terazawa, T. Mamiya, H. Ito, K. Matsuo, K. Tajima, and N. Hamajima. 2010. Efficacy of genotype notification to Japanese smokers on smoking cessation--an intervention study at workplace. Cancer Epidemiol. 34:96-100.
Hoffmann, K., H. Boeing, A. Dufour, J.L. Volatier, J. Telman, M. Virtanen, W. Becker, S. De Henauw, and E. Group. 2002. Estimating the distribution of usual dietary intake by short-term measurements. Eur J Clin Nutr. 56 Suppl 2:S53-62.
Hollands, G.J., S.C. Whitwell, R.A. Parker, N.J. Prescott, A. Forbes, J. Sanderson, C.G. Mathew, C.M. Lewis, S. Watts, S. Sutton, D. Armstrong, A.L. Kinmonth, A.T. Prevost, and T.M. Marteau. 2012. Effect of communicating DNA based risk assessments for Crohn's disease on smoking cessation: randomised controlled trial. BMJ. 345:e4708.
Horska, A., C. Mislanova, S. Bonassi, M. Ceppi, K. Volkovova, and M. Dusinska. 2011. Vitamin C levels in blood are influenced by polymorphisms in glutathione S-transferases. Eur J Nutr. 50:437-446.
Human Genetics Commission. 2010. A Common Framework of Principles for Direct-to- Consumer Genetic Testing Services. Available online at: http://www.cellmark.co.uk/pdfs/HGCprinciples.pdf
Hunt, J.R., and E. White. 1998. Retaining and tracking cohort study members. Epidemiol Rev. 20:57-70.
Hunter, D. 1998. Biochemical indicators of dietary intake. In Nutritional Epidemiology. W. Willet, editor. Oxford University Press, New York, NY. 174-243.
Hurlimann, T., V. Menuz, J. Graham, J. Robitaille, M.C. Vohl, and B. Godard. 2014. Risks of nutrigenomics and nutrigenetics? What the scientists say. Genes Nutr. 9:370.
137
Institute of Medicine. 2013. Sodium Intake in Populations: Assessment of Evidence. Washington, DC: The National Academies Press.
Ito, H., K. Matsuo, K. Wakai, T. Saito, H. Kumimoto, K. Okuma, K. Tajima, and N. Hamajima. 2006. An intervention study of smoking cessation with feedback on genetic cancer susceptibility in Japan. Prev Med. 42:102-108.
Janssens, A.C., and C.M. van Duijn. 2010. An epidemiological perspective on the future of direct-to-consumer personal genome testing. Investig Genet. 1:10.
Janssens, A.C., A.A. Wilde, and I.M. van Langen. 2011. The sense and nonsense of direct-to-consumer genetic testing for cardiovascular disease. Neth Heart J. 19:85-88.
Jenab, M., N. Slimani, M. Bictash, P. Ferrari, and S.A. Bingham. 2009. Biomarkers in nutritional epidemiology: applications, needs and new horizons. Human genetics. 125:507-525.
Ji, C., L. Sykes, C. Paul, O. Dary, B. Legetic, N.R. Campbell, F.P. Cappuccio, R. Sub-Group for Research and Surveillance of the PAHO–WHO Regional Expert Group for Cardiovascular Disease Prevention Through Population-wide Dietary Salt Reduction. 2012. Systematic review of studies comparing 24-hour and spot urine collections for estimating population salt intake. Rev Panam Salud Publica. 32:307-315.
Jimenez-Martin, S., J.M. Labeaga, and A. Lopez. 1998. Participation, heterogeneity and dynamics in tobacco consumption: evidence from cohort data. Health Econ. 7:401-414.
Johansen, K.S., B. Bjorge, V.T. Hjellset, G. Holmboe-Ottesen, M. Raberg, and M. Wandel. 2010. Changes in food habits and motivation for healthy eating among Pakistani women living in Norway: results from the InnvaDiab-DEPLAN study. Public Health Nutr. 13:858-867.
Joseph, H.M. 1994. Assessment of dietary intakes for sodium, potassium, calcium, and magnesium, and factors influencing salt intake. In School of Nutrition. Vol. PhD. Tufts University, Boston.
Josse, A.R., L.A. Da Costa, H. Campos, and A. El-Sohemy. 2012. Associations between polymorphisms in the AHR and CYP1A1-CYP1A2 gene regions and habitual caffeine consumption. Am J Clin Nutr. 96(3):665-71.
Kaput, J. 2008. Nutrigenomics research for personalized nutrition and medicine. Curr Opin Biotechnol. 19:110-120.
Kaufman, D.J., J.M. Bollinger, R.L. Dvoskin, and J.A. Scott. 2012. Risky business: risk perception and the use of medical services among customers of DTC personal genetic testing. J Genet Couns. 21:413-422.
Kinney, A.Y., S.E. Simonsen, B.J. Baty, D. Mandal, S.L. Neuhausen, K. Seggar, R. Holubkov, L. Bloor, and K. Smith. 2006. Risk reduction behaviors and provider communication
138
following genetic counseling and BRCA1 mutation testing in an African American kindred. J Genet Couns. 15:293-305.
Kitzinger, J. 1995. Qualitative research. Introducing focus groups. BMJ. 311:299-302.
Kolor, K., D. Duquette, A. Zlot, J. Foland, B. Anderson, R. Giles, J. Wrathall, and M.J. Khoury. 2012. Public awareness and use of direct-to-consumer personal genomic tests from four state population-based surveys, and implications for clinical and public health practice. Genet Med. 14:860-867.
Kolor, K., T. Liu, J. St Pierre, and M.J. Khoury. 2009. Health care provider and consumer awareness, perceptions, and use of direct-to-consumer personal genomic tests, United States, 2008. Genet Med. 11:595.
Kristal, A.R., S.A. Beresford, and D. Lazovich. 1994. Assessing change in diet-intervention research. Am J Clin Nutr. 59:185S-189S.
Kroke, A., K. Klipstein-Grobusch, S. Voss, J. Möseneder, F. Thielecke, R. Noack, and H. Boeing. 1999.Validation of a self-administered food-frequency questionnaire administered in the European Prospective Investigation into Cancer and Nutrition (EPIC) Study:comparison of energy, protein, and macronutrient intakes estimated withthe doubly labeled water, urinary nitrogen, and repeated 24-h dietary recall methods. Am J Clin Nutr. 70(4):439-47.
Kumimoto, H., N. Hamajima, Y. Nishimoto, K. Matsuo, M. Shinoda, S. Hatooka, and K. Ishizaki. 2002. L-myc genotype is associated with different susceptibility to lung cancer in smokers. Jpn J Cancer Res. 93:1-5.
Kumimoto, H., N. Hamajima, K. Nishizawa, Y. Nishimoto, K. Matsuo, H. Harada, M. Shinoda, S. Hatooka, and K. Ishizaki. 2001. Different susceptibility of each L-myc genotype to esophageal cancer risk factors. Jpn J Cancer Res. 92:735-739.
Kuper, A., L. Lingard, and W. Levinson. 2008. Critically appraising qualitative research. BMJ. 337:a1035.
Lachance, C.R., L.A. Erby, B.M. Ford, V.C. Allen, Jr., and K.A. Kaphingst. 2010. Informational content, literacy demands, and usability of websites offering health-related genetic tests directly to consumers. Genet Med. 12:304-312.
Lancet Oncology. 2014. Black-box warning: direct-to-consumer marketing. Lancet Oncol. 15:1.
Landi M.T., N. Chatterjee, K. Yu, L.R. Goldin, A.M. Goldstein, M. Rotunno, et al. 2009. A genome-wide association study of lung cancer identifies a region of chromosome 5p15 associated with risk for adenocarcinoma. Am J Hum Genet. 85(5): 679-91.
Langlois, K., and D. Garriguet. 2011. Sugar consumption among Canadians of all ages. Health Rep. 22:23-27.
139
Larkin, F.A., H.L. Metzner, and K.E. Guire. 1991. Comparison of three consecutive-day and three random-day records of dietary intake. J Am Diet Assoc. 91:1538-1542.
Larsson, S.C., M.J. Virtanen, M. Mars, S. Mannisto, P. Pietinen, D. Albanes, and J. Virtamo. 2008. Magnesium, calcium, potassium, and sodium intakes and risk of stroke in male smokers. Arch Intern Med. 168:459-465.
Law, M.R., M.R. Hetzel, and J.R. Idel. 1989. Debrisoquine metabolism and genetic predisposition to lung cancer. Br J Cancer. 59:686-687.
Leighton, J.W., K. Valverde, and B.A. Bernhardt. 2011. The general public's understanding and perception of direct-to-consumer genetic test results. Public Health Genomics. 15:11-21.
Lerman, C., R.T. Croyle, K.P. Tercyak, and H. Hamann. 2002. Genetic testing: psychological aspects and implications. J Consult Clin Psychol. 70:784-797.
Lerman, C., K. Gold, J. Audrain, T.H. Lin, N.R. Boyd, C.T. Orleans, B. Wilfond, G. Louben, and N. Caporaso. 1997. Incorporating biomarkers of exposure and genetic susceptibility into smoking cessation treatment: effects on smoking-related cognitions, emotions, and behavior change. Health Psychol. 16:87-99.
Levine, D.M., W.E. Ek, R. Zhang, X. Liu, L. Onstad, C. Sather, P. Lao-Sirieix, M.D. Gammon, D.A Corley, N.J. Shaheen, N.C. Bird, L.J. Hardie, L.J. Murray, B.J. Reid, W.H. Chow, H.A. Risch, O. Nyrén, W. Ye, G. Liu, Y. Romero, L. Bernstein, A.H. Wu, A.G. Casson, S.J. Chanock, P. Harrington, I. Caldas, I. Debiram-Beecham, C. Caldas, N.K. Hayward, P.D. Pharoah, R.C. Fitzgerald, S. Macgregor, D.C. Whiteman, and T.L. Vaughan. 2013. A genome-wide association study identifies new susceptibility loci for esophageal adenocarcinoma and Barrett's esophagus. Nat Genet. 45(12): 1487-93.
Lewis, C.M., S.C. Whitwell, A. Forbes, J. Sanderson, C.G. Mathew, and T.M. Marteau. 2007. Estimating risks of common complex diseases across genetic and environmental factors: the example of Crohn disease. J Med Genet. 44:689-694.
Lewit, E.M., D. Coate, and M. Grossman. 1981. The effects of government regulation on teenage smoking. J Law Econ. 24:24.
Littell, R.C., P.R. Henry, and C.B. Ammerman. 1998. Statistical analysis of repeated measures data using SAS procedures. J Anim Sci. 76:1216-1231.
Lohmueller, K.E., C.L. Pearce, M. Pike, E.S. Lander, and J.N. Hirschhorn. 2003. Meta-analysis of genetic association studies supports a contribution of common variants to susceptibility to common disease. Nat Genet. 33 (2):177-82.
Lynch, J., A. Parrott, R.J. Hopkin, and M. Myers. 2011. Media coverage of direct-to-consumer genetic testing. J Genet Couns. 20:486-494.
Maher, B. 2011. Nature readers flirt with personal genomics. Nature. 478:19.
140
Manuel, D.G., J. Lim, P. Tanuseputro, G.M. Anderson, D.A. Alter, A. Laupacis, and C.A. Mustard. 2006. Revisiting Rose: strategies for reducing coronary heart disease. BMJ. 332:659-662.
Marteau, T., V. Senior, S.E. Humphries, M. Bobrow, T. Cranston, M.A. Crook, L. Day, M. Fernandez, R. Horne, A. Iversen, Z. Jackson, J. Lynas, H. Middleton-Price, R. Savine, J. Sikorski, M. Watson, J. Weinman, A.S. Wierzbicki, and R. Wray. 2004. Psychological impact of genetic testing for familial hypercholesterolemia within a previously aware population: a randomized controlled trial. Am J Med Genet A. 128A:285-293.
Marteau, T.M., D.P. French, S.J. Griffin, A.T. Prevost, S. Sutton, C. Watkinson, S. Attwood, and G.J. Hollands. 2010. Effects of communicating DNA-based disease risk estimates on risk-reducing behaviours. Cochrane Database Syst Rev:CD007275.
Marteau, T.M., and J. Weinman. 2006. Self-regulation and the behavioural response to DNA risk information: a theoretical analysis and framework for future research. Soc Sci Med. 62:1360-1368.
Mays, N., and C. Pope. 1995. Rigour and qualitative research. BMJ. 311:109-112.
McBride, C.M., G. Bepler, I.M. Lipkus, P. Lyna, G. Samsa, J. Albright, S. Datta, and B.K. Rimer. 2002. Incorporating genetic susceptibility feedback into a smoking cessation program for African-American smokers with low income. Cancer Epidemiol Biomarkers Prev. 11:521-528.
McBride, C.M., A.D. Bryan, M.S. Bray, G.E. Swan, and E.D. Green. 2012. Health behavior change: can genomics improve behavioral adherence? Am J Public Health. 102:401-405.
McBride, C.M., L.M. Koehly, S.C. Sanderson, and K.A. Kaphingst. 2010. The behavioral response to personalized genetic information: will genetic risk profiles motivate individuals and families to choose more healthful behaviors? Annu Rev Public Health. 31:89-103.
McGuire, A.L., and W. Burke. 2008. An unwelcome side effect of direct-to-consumer personal genome testing: raiding the medical commons. JAMA. 300:2669-2671.
McGuire, A.L., C.M. Diaz, T. Wang, and S.G. Hilsenbeck. 2009. Social networkers' attitudes toward direct-to-consumer personal genome testing. Am J Bioeth. 9:3-10.
McGuire, A.L., B.J. Evans, T. Caulfield, and W. Burke. 2010. Science and regulation. Regulating direct-to-consumer personal genome testing. Science. 330:181-182.
McWilliams, J.E., B.J. Sanderson, E.L. Harris, K.E. Richert-Boe, and W.D. Henner. 1995. Glutathione S-transferase M1 (GSTM1) deficiency and lung cancer risk. Cancer Epidemiol Biomarkers Prev. 4:589-594.
Meigs, J.B., P. Shrader, L.M. Sullivan, J.B. McAteer, C.S. Fox, J. Dupuis, A.K. Manning, J.C. Florez, P.W. Wilson, R.B. D'Agostino, Sr., and L.A. Cupples. 2008. Genotype score in
141
addition to common risk factors for prediction of type 2 diabetes. N Engl J Med. 359:2208-2219.
Meisel, S.F., C. Walker, and J. Wardle. 2012. Psychological responses to genetic testing for weight gain: a vignette study. Obesity (Silver Spring). 20:540-546.
Meiselman, H.L. 1996. Food preferences and chemical senses: comments on the food attitude survey of Frank and van der Klaauw. Appetite. 27:193-195; discussion 196.
Mihaescu, R., M. van Hoek, E.J. Sijbrands, A.G. Uitterlinden, J.C. Witteman, A. Hofman, C.M. van Duijn, and A.C. Janssens. 2009. Evaluation of risk prediction updates from commercial genome-wide scans. Genet Med. 11:588-594.
Montano and D.E. Kasprzyk. 2008. Theory of Reasoned Action, Theory of Planned Behaviour, and the Integrated Behavioral Model. In Health behaviour and health education: theory, research, and practice. K. Glanz, B.K. Rimer, and K. Viswanath, editors. Jossey-Bass, San Francisco. 67-92.
Morin, K. 2009. Knowledge and attitudes of Canadian consumers and health care professionals regarding nutritional genomics. OMICS. 13:37-41.
Nagata, C., N. Takatsuka, N. Shimizu, and H. Shimizu. 2004. Sodium intake and risk of death from stroke in Japanese men and women. Stroke. 35:1543-1547.
National Research Council. 1941. Recommended Dietary Allowances. The National Academies Press: Washington, DC.
National Research Council. 2000. Dietary Reference Intakes: Applications in Dietary Assessment. The National Academies Press: Washington, DC.
National Research Council. 2006. Dietary Reference Intakes: The Essential Guide to Nutrient Requirements. The National Academies Press: Washington, DC.
National Research Council. 2011. Dietary Reference Intakes for Calcium and Vitamin D Washington, DC.
Nawrot, P., S. Jordan, J. Eastwood, J. Rotstein, A. Hugenholtz, and M. Feeley. 2003. Effects of caffeine on human health. Food Addit Contam. 20:1-30.
Neumann, P.J., J.T. Cohen, J.K. Hammitt, T.W. Concannon, H.R. Auerbach, C. Fang, and D.M. Kent. 2010. Willingness-to-pay for predictive tests with no immediate treatment implications: a survey of US residents. Health Econ. 21(3):238-51.
Nielsen, D.E., and A. El-Sohemy. 2012a. Applying genomics to nutrition and lifestyle modification. Per Med. 9:739-749.
Nielsen, D.E., and A. El-Sohemy. 2012b. A randomized trial of genetic information for personalized nutrition. Genes Nutr. 7(4):559-66.
142
Nishida, C., R. Uauy, S. Kumanyika, and P. Shetty. 2004. The joint WHO/FAO expert consultation on diet, nutrition and the prevention of chronic diseases: process, product and policy implications. Public Health Nutr. 7:245-250.
Norrgard, K. 2008. DTC genetic testing for diabetes, breast cancer, heart disease and paternity. Nature Education. 1.
Nutbeam, D. 2008. The evolving concept of health literacy. Soc Sci Med. 67:2072-2078.
O'Connor, L. 2013. 23andMe faces $5 million lawsuit days after being banned by FDA. The Huffington Post. December 3, 2013. Available online at: http://www.huffingtonpost.com/2013/12/04/23andme-lawsuit_n_4387699.html
Ochner, C.N., and M.R. Lowe. 2007. Self-reported changes in dietary calcium and energy intake predict weight regain following a weight loss diet in obese women. J Nutr. 137:2324-2328.
Ogden, J., L. Karim, A. Choudry, and K. Brown. 2007. Understanding successful behaviour change: the role of intentions, attitudes to the target and motivations and the example of diet. Health Educ Res. 22:397-405.
Ogilve, M. 2014. Sodium should be included on menus alongside basic calories. The Toronto Star. February 28, 2014. Available online at: http://www.thestar.com/life/health_wellness/2014/02/28/sodium_should_be_included_on_menus_alongside_basic_calories.html
Palatini, P., G. Ceolotto, F. Ragazzo, F. Dorigatti, F. Saladini, I. Papparella, L. Mos, G. Zanata, and M. Santonastaso. 2009. CYP1A2 genotype modifies the association between coffee intake and the risk of hypertension. J Hypertens. 27:1594-1601.
Pascoe, L., H. Zouali, M. Sahbatou, and J.P. Hugot. 2007. Estimating the odds ratios of Crohn disease for the main CARD15/NOD2 mutations using a conditional maximum likelihood method in pedigrees collected via affected family members. Eur J Hum Genet. 15:864-871.
Papadakis, S., A.L. Pipe, I.A. Moroz, R.D. Reid, C.M. Blanchard, D.F. Cote, and A.E. Mark. 2010. Knowledge, attitudes and behaviours related to dietary sodium among 35- to 50-year-old Ontario residents. Can J Cardiol. 26:e164-169.
Partnership for Dietetic Education and Practice. 2013. The Integrated Competencies for Dietetic Education and Practice. Available online at: http://www.pdep.ca/page.aspx?page=390&app=77&cat1=338&tp=12&lk=no&menu=42
Patel, P., S. Panaich, J. Steinberg, S. Zalawadiya, A. Kumar, A. Aranha, and L. Cardozo. 2013. Use of nutrition literacy scale in elderly minority population. J Nutr Health Aging. 17:894-897.
143
Persky, S., K.A. Kaphingst, C.M. Condit, and C.M. McBride. 2007. Assessing hypothetical scenario methodology in genetic susceptibility testing analog studies: a quantitative review. Genet Med. 9:727-738.
Personal Genetics Education Project: Harvard Medical School Department of Genetics. 2010. Ethical considerations and personal genome sequencing. Available online at: http://genepath.med.harvard.edu/WuLab/pgEd/questions.html.
Petrella, R.J., M. Speechley, P.W. Kleinstiver, and T. Ruddy. 2005. Impact of a social marketing media campaign on public awareness of hypertension. Am J Hypertens. 18:270-275.
Pierce, J.P. 2007. Tobacco industry marketing, population-based tobacco control, and smoking behavior. Am J Prev Med. 33:S327-334.
Poch, E., D. Gonzalez, V. Giner, E. Bragulat, A. Coca, and A. de La Sierra. 2001. Molecular basis of salt sensitivity in human hypertension. Evaluation of renin-angiotensin-aldosterone system gene polymorphisms. Hypertension. 38:1204-1209.
Pomeranz, J.L. 2014. Sugary beverage tax policy: lessons learned from tobacco. Am J Public Health. 104:e13-15.
Pope, C., and N. Mays. 1995. Reaching the parts other methods cannot reach: an introduction to qualitative methods in health and health services research. BMJ. 311:42-45.
Pope, C., S. Ziebland, and N. Mays. 2000. Qualitative research in health care. Analysing qualitative data. BMJ. 320:114-116.
Potter J.D., Graves K.L., and F. J.R. 1990. The Cancer and Diet Intervention Project: a community based intervention to reduce nutrition-related risk of cancer. Health Educ Res. 5:489-503.
Prasad, C., V. Imrhan, and M. Rew. 2011. Introducing nutritional genomics teaching in undergraduate dietetic curricula. J Nutrigenet Nutrigenomics. 4:165-172.
Prentice, R.L. 1996. Measurement error and results from analytic epidemiology: dietary fat and breast cancer. J Natl Cancer Inst. 88:1738-1747.
Prochaska, J.O., C.A. Redding, and K.E. Evers. 2008. The Transtheoretical Model and Stages of Change. In Health behaviour and health education: theory, research, and practice. K. Glanz, B.K. Rimer, and K. Viswanath, editors. Jossey-Bass, San Francisco. 97-117.
Prosser, N.R., A.L. Heath, S.M. Williams, and R.S. Gibson. 2010. Influence of an iron intervention on the zinc status of young adult New Zealand women with mild iron deficiency. Br J Nutr. 104:742-750.
Public Health Agency of Canada 2011. Chronic Diseases – Most Significant Cause of Death Globally. Available online at: http://www.phac-aspc.gc.ca/media/nr-rp/2011/2011_0919-bg-di-eng.php
144
Reed, D.R., and A. Knaapila. 2010. Genetics of taste and smell poisons and pleasures. Prog Mol Biol Transl Sci. 94:213-240.
Resnicow, K., and S.E. Page. 2008. Embracing chaos and complexity: a quantum change for public health. Am J Public Health. 98:1382-1389.
Resnicow, K., and R. Vaughan. 2006. A chaotic view of behavior change: a quantum leap for health promotion. Int J Behav Nutr Phys Act. 3:25.
Rief, W., M. Conradt, J.M. Dierk, E. Rauh, P. Schlumberger, A. Hinney, and J. Hebebrand. 2007. Is information on genetic determinants of obesity helpful or harmful for obese people?--A randomized clinical trial. J Gen Intern Med. 22:1553-1559.
Ries, N.M., R. Hyde-Lay, and T. Caulfield. 2010. Willingness to pay for genetic testing: a study of attitudes in a Canadian population. Public Health Genomics. 13:292-300.
Rimer, B.K. 2008. Models of Individual Health Behavior. In Health behaviour and health education: theory, research, and practice. K. Glanz, B.K. Rimer, and K. Viswanath, editors. Jossey-Bass, San Francisco. 41-44.
Ronteltap, A., J.C.M. van Trijp, and R.J. Renes. 2009. Consumer acceptance of nutrigenomics-based personalised nutrition. The British journal of nutrition. 101:132-144.
Roosen, J., M. Bruhn, R.A. Mecking, and L.S. Drescher. 2008. Consumer demand for personalized nutrition and functional food. Int J Vitam Nutr Res. 78:269-274.
Rose, G. 1985. Sick individuals and sick populations. Int J Epidemiol. 14:32-38.
Rosen, R., C. Earthman, L. Marquart, and M. Reicks. 2006. Continuing education needs of registered dietitians regarding nutrigenomics. J Am Diet Assoc. 106:1242-1245.
Rosenstock, I.M., V.J. Strecher, and M.H. Becker. 1988. Social learning theory and the Health Belief Model. Health Educ Q. 15:175-183.
Rotunno, M., T.K. Lam, A. Vogt, P.A. Bertazzi, J.H. Lubin, N.E. Caporaso, and M.T. Landi. 2012. GSTM1 and GSTT1 copy numbers and mRNA expression in lung cancer. Mol Carcinog. 51 Suppl 1:E142-50.
Salari, K., K.J. Karczewski, L. Hudgins, and K.E. Ormond. 2013. Evidence that personal genome testing enhances student learning in a course on genomics and personalized medicine. PLoS One. 8:e68853.
Sanderson, S.C., S.E. Humphries, C. Hubbart, E. Hughes, M.J. Jarvis, and J. Wardle. 2008. Psychological and behavioural impact of genetic testing smokers for lung cancer risk: a phase II exploratory trial. J Health Psychol. 13:481-494.
Sanderson, S.C., and S. Michie. 2007. Genetic testing for heart disease susceptibility: potential impact on motivation to quit smoking. Clin Genet. 71:501-510.
145
Sanderson, S.C., S. Persky, and S. Michie. 2010. Psychological and behavioral responses to genetic test results indicating increased risk of obesity: does the causal pathway from gene to obesity matter? Public Health Genomics. 13:34-47.
Schoeller, D.A. 1990. How accurate is self-reported dietary energy intake? Nutr Rev. 48:373-379.
Schoeller, D.A., E. Ravussin, Y. Schutz, K.J. Acheson, P. Baertschi, and E. Jequier. 1986. Energy expenditure by doubly labeled water: validation in humans and proposed calculation. Am J Physiol. 250:R823-830.
Shu XO, G. Yang, F. Jin, D. Liu, L. Kushi, W. Wen, Y.T. Gao, and W. Zheng. 2004. Validity and reproducibility of the food frequency questionnaire used in the Shanghai Women's Health Study. Eur J Clin Nutr. 58(1):17-23.
Shuval, K., K. Harker, B. Roudsari, N.E. Groce, B. Mills, Z. Siddiqi, and A. Shachak. 2011. Is qualitative research second class science? A quantitative longitudinal examination of qualitative research in medical journals. PLoS One. 6:e16937.
Siahpush, M., M.A. Wakefield, M.J. Spittal, S.J. Durkin, and M.M. Scollo. 2009. Taxation reduces social disparities in adult smoking prevalence. Am J Prev Med. 36:285-291.
Sionis, K.C.M., N.A. Patsopoulos, J.P.A. Ioannidis. 2010. Replication of past candidate loci for common diseases and phenotypes in 100 genome-wide association studies. Eur J Hum Genet. 18(7):832-7.
Smemo, S., J.J. Tena, K-H. Kim, E.R. Gamazon, N.K. Sakabe, et al. 2014. Obesity-associated variants within FTO form long-range functional connections with IRX3. Nature. 507(7492):371-5.
Smith, S.G., L.M. Curtis, J. Wardle, C. von Wagner, and M.S. Wolf. 2013. Skill set or mind set? Associations between health literacy, patient activation and health. PLoS One. 8:e74373.
Speirs, K.E., L.A. Messina, A.L. Munger, and S.K. Grutzmacher. 2012. Health literacy and nutrition behaviors among low-income adults. J Health Care Poor Underserved. 23:1082-1091.
Stenne, R., T. Hurlimann, and B. Godard. 2013. Benefits associated with nutrigenomics research and their reporting in the scientific literature: researchers' perspectives. Account Res. 20:167-183.
Sterling, R. 2008. The on-line promotion and sale of nutrigenomic services. Genet Med. 10:784-796.
Stern, M.P., C. Gonzalez, M. Hernandex, J.A. Knapp, H.P. Hazuda, E. Villapando, R.A. Valdez, S.M. Haffner, and B.D. Mitchell. 1993. Performance of semiquantitative food frequency questionnaires in international comparisons. Mexico City versus San Antonio, Texas. Ann Epidemiol. 3:300-307.
146
Stewart-Knox, B.J., B.P. Bunting, S. Gilpin, H.J. Parr, S. Pinhao, J.J. Strain, M.D. de Almeida, and M. Gibney. 2009. Attitudes toward genetic testing and personalised nutrition in a representative sample of European consumers. Br J Nutr. 101:982-989.
Stover, P.J. 2006. Influence of human genetic variation on nutritional requirements. Am J Clin Nutr. 83:436S-442S.
Strong, K., C. Mathers, J. Epping-Jordan, and R. Beaglehole. 2006. Preventing chronic disease: a priority for global health. Int J Epidemiol. 35:492-494.
Su, P. 2013. Direct-to-consumer genetic testing: a comprehensive view. Yale J Biol Med. 86:359-365.
Subar, A.F., F.E. Thompson, V. Kipnis, D. Midthune, P. Hurwitz, S. McNutt, A. McIntosh, and S. Rosenfeld. 2001. Comparative validation of the Block, Willett, and National Cancer Institute food frequency questionnaires the Eating at America's Table Study. Am J Epidemiol. 154:1089-1099.
Sullivan, L.M. 2008. Repeated measures. Circulation. 117:1238-1243.
Tabangin, M.E., J.G. Woo, and L.J. Martin. 2009. The effect of minor allele frequency on the likelihood of obtaining false positives. BMC Proc. 3 Suppl 7:S41.
Taggart, J., A. Williams, S. Dennis, A. Newall, T. Shortus, N. Zwar, E. Denney-Wilson, and M.F. Harris. 2012. A systematic review of interventions in primary care to improve health literacy for chronic disease behavioral risk factors. BMC Fam Pract. 13:49.
Tanaka, T., J.S. Ngwa, F.J. van Rooij, M.C. Zillikens, M.K. Wojczynski. 2013. Genome-wide meta-analysis of observational studies shows common genetic variants associated with macronutrient intake. Am J Clin Nutr. 97(6):1395-1402.
Taylor, S. 2011. A population-based survey in Australia of men's and women's perceptions of genetic risk and predictive genetic testing and implications for primary care. Public Health Genomics. 14(6):325-36.
Thompson, F.E., and T. Byers. 1994. Dietary assessment resource manual. J Nutr. 124:2245S-2317S.
Timofeeva, M.N., R.J. Hung, T. Rafnar, D.C. Christiani, J.K. Field, et al. 2012. Influence of common genetic variation on lung cancer risk: meta-analysis of 14 900 cases and 29 485 controls. Hum Mol Genet. 21(22):4980-95.
Townsend, J., P. Roderick, and J. Cooper. 1994. Cigarette smoking by socioeconomic group, sex, and age: effects of price, income, and health publicity. BMJ. 309:923-927.
Trowbridge, M.J., and T.L. Schmid. 2013. Built environment and physical activity promotion: place-based obesity prevention strategies. J Law Med Ethics. 41 Suppl 2:46-51.
147
Twells, L.K., D.M. Gregory, J. Reddigan, and K.W. Midodzi. 2014. Current and predicted prevalence of obesity in Canada: a trend analysis. CMAJO. 2:E18-E26.
Tylavsky, F. A., and G.B. Sharp. 1995. Misclassification of nutrient and energy intake and use of closed-ended questions in epidemiologic research. Am J Epidemiol. 142(3):342-352.
Umesawa, M., H. Iso, C. Date, A. Yamamoto, H. Toyoshima, Y. Watanabe, S. Kikuchi, A. Koizumi, T. Kondo, Y. Inaba, N. Tanabe, A. Tamakoshi, and J.S. Group. 2008. Relations between dietary sodium and potassium intakes and mortality from cardiovascular disease: the Japan Collaborative Cohort Study for Evaluation of Cancer Risks. Am J Clin Nutr. 88:195-202.
Vallone, R.P., D.W. Griffin, S. Lin, and L. Ross. 1990. Overconfident prediction of future actions and outcomes by self and others. J Pers Soc Psychol. 58:582-592.
Vernarelli, J.A., J.S. Roberts, S. Hiraki, C.A. Chen, L.A. Cupples, and R.C. Green. 2010. Effect of Alzheimer disease genetic risk disclosure on dietary supplement use. Am J Clin Nutr. 91:1402-1407.
von Tigerstrom, B., T. Larre, and J. Sauder. 2011. Using the tax system to promote physical activity: critical analysis of Canadian initiatives. Am J Public Health. 101:e10-16.
Wagner, J.K. 2010. Understanding FDA regulation of DTC genetic tests within the context of administrative law. Am J Hum Genet. 87:451-456.
Watson, M., C. Foster, R. Eeles, D. Eccles, S. Ashley, R. Davidson, J. Mackay, P.J. Morrison, P. Hopwood, and D.G. Evans. 2004. Psychosocial impact of breast/ovarian (BRCA1/2) cancer-predictive genetic testing in a UK multi-centre clinical cohort. Br J Cancer. 91:1787-1794.
Watson, R.L., and H.G. Langford. 1970. Usefulness of overnight urines in population groups. Pilot studies of sodium, potassium, and calcium excretion. Am J Clin Nutr. 23:290-304.
Webb, T.L., Sniehotta, F.F., Michie, S. 2010. Using theories of behaviour change to inform interventions for addictive behaviours. Addiction. 105:1879-1892.
Weinstein, N.D., P.M. Sandman, and S.J. Blalock. 2008. The Precaution Adoption Process Model. In Health behaviour and health education: theory, research, and practice. K. Glanz, B.K. Rimer, and K. Viswanath, editors. Jossey-Bass, San Francisco. 123-145.
Weir, M., K. Morin, N. Ries, and D. Castle. 2010. Canadian health care professionals' knowledge, attitudes and perceptions of nutritional genomics. Br J Nutr. 104(8):1112-9.
Wilder, R.M. 1945. Misinterpretation and Misuse of the Recommended Dietary Allowances. Science. 101:285-288.
Willet, W. 1998. Food frequency methods. In Nutritional Epidemiology. W. Willet, editor. Oxford University Press, New York, NY. 74-100.
148
Willet, W., and E. Lenart. 1998. Reproducibility and validity of food-frequency questionnaires. In Nutritional Epidemiology. W. Willet, editor. Oxford University Press, New York, NY. 101-147.
Willett, W.C., J.P. Kaplan, R. Nugent, C. Dusenbury, P. Puska, and T.A. Gaziano. 2006. Chapter 44: Prevention of Chronic Disease by Means of Diet and Lifestyle Changes. In Disease Control Priorities in Developing Countries, 2nd edition. D.T. Jamieson et al, editors. World Bank, Washington, DC. 833-850.
Wootan, M.G. 2007. Need for and effectiveness of menu labeling. J Am Diet Assoc. 107:33-34; author reply 34-35.
World Health Organization. 2004. Diet, nutrition and the prevention of chronic diseases. Available online at: http://www.who.int/dietphysicalactivity/publications/trs916/download/en/index.html.
World Health Organization, 2005. Preventing chronic disease: a vital investment. Available online at: http://www.who.int/chp/chronic_disease_report/en/
Word Health Organization, 2011. WHO maps noncommunicable disease trends in all countries: country profiles on noncommunicable disease trends in 193 countries. Cent Eur J Public Health. 19:130, 138.
Wright, A.J., D.P. French, J. Weinman, and T.M. Marteau. 2006. Can genetic risk information enhance motivation for smoking cessation? An analogue study. Health Psychol. 25:740-752.
Wright, A.J., C. Takeichi, S.C. Whitwell, M. Hankins, and T.M. Marteau. 2008. The impact of genetic testing for Crohn's disease, risk magnitude and graphical format on motivation to stop smoking: an experimental analogue study. Clin Genet. 73:306-314.
Wright, J.L., J.L. Sherriff, S.S. Dhaliwal, and J.C. Mamo. 2011. Tailored, iterative, printed dietary feedback is as effective as group education in improving dietary behaviours: results from a randomised control trial in middle-aged adults with cardiovascular risk factors. Int J Behav Nutr Phys Act. 8:43.
Wu, C., Z. Hu, Z. He, W. Jia, F. Wang, Y. Zhou, Z. Liu, Q. Zhan, Y. Liu, D. Yu, K. Zhai, J. Chang, Y. Qiao, G. Jin, Z. Liu, Y. Shen, C. Guo, J. Fu, X. Miao, W. Tan, H. Shen, Y. Ke, Y. Zeng, T. Wu, and D. Lin. 2011. Genome-wide association study identifies three new susceptibility loci for esophageal squamous-cell carcinoma in Chinese populations. Nat Genet. 43(7):679-84.
Wu, T., W.C. Willett, S.E. Hankinson, and E. Giovannucci. 2005. Caffeinated coffee, decaffeinated coffee, and caffeine in relation to plasma C-peptide levels, a marker of insulin secretion, in U.S. women. Diabetes Care. 28:1390-1396.
Yates, T., M.J. Davies, and K. Khunti. 2012. Obesity and chronic disease in younger people: an unfolding crisis. Br J Gen Pract. 62:4-5.

149
Zablocki, R.W., S.D. Edland, M.G. Myers, D.R. Strong, C.R. Hofstetter, and W.K. Al-Delaimy. 2014. Smoking ban policies and their influence on smoking behaviors among current California smokers: a population-based study. Prev Med. 59:73-78.
Zhang, R., M. Chu, Y. Zhao, C. Wu, H. Guo, Y. Shi, J. Dai, Y. Wei, G. Jin, H. Ma, J. Dong, H. Yi, J. Bai, J. Gong, C. Sun, M. Zhu, T. Wu, Z. Hu, D. Lin, H. Shen, and F. Chen. 2014. A genome-wide gene-environment interaction analysis for tabacco smoke and lung cancer susceptibility. Carcinogenesis. (Epub ahead of print)

Appendix
150

Sample pages from FFQ
151
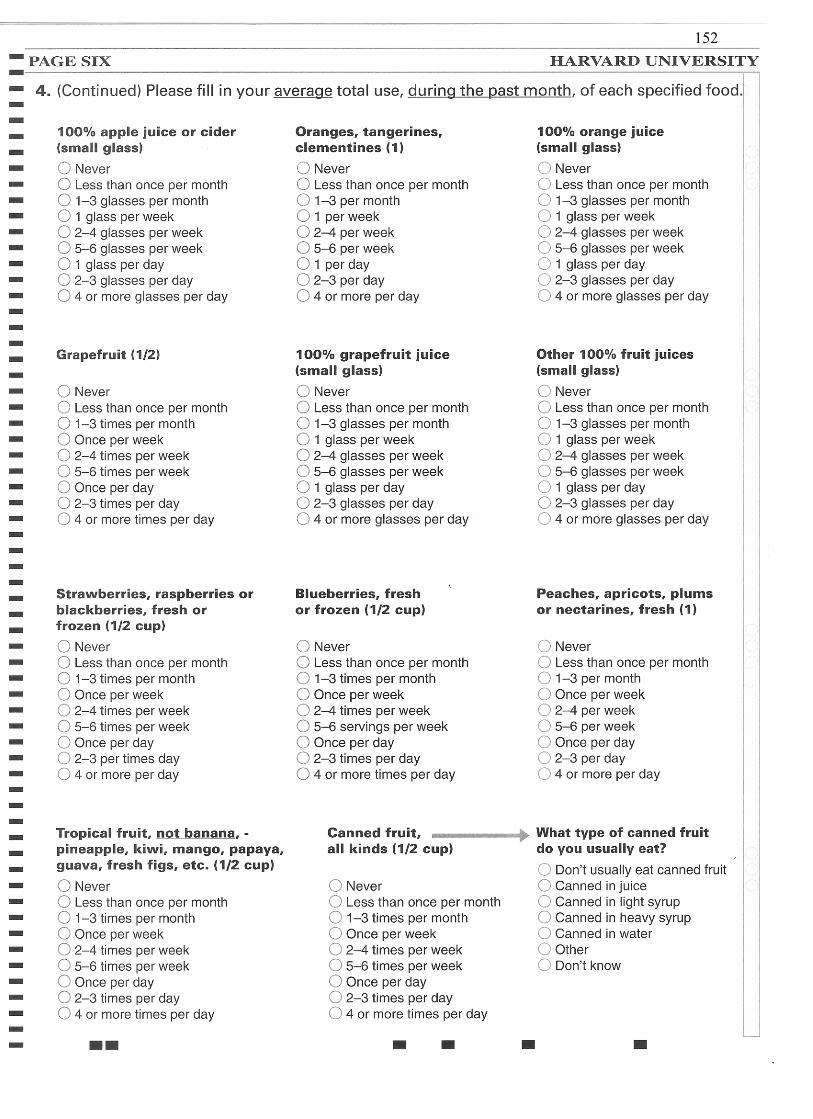
152

153

Dietary Advice Report
Control Group
154
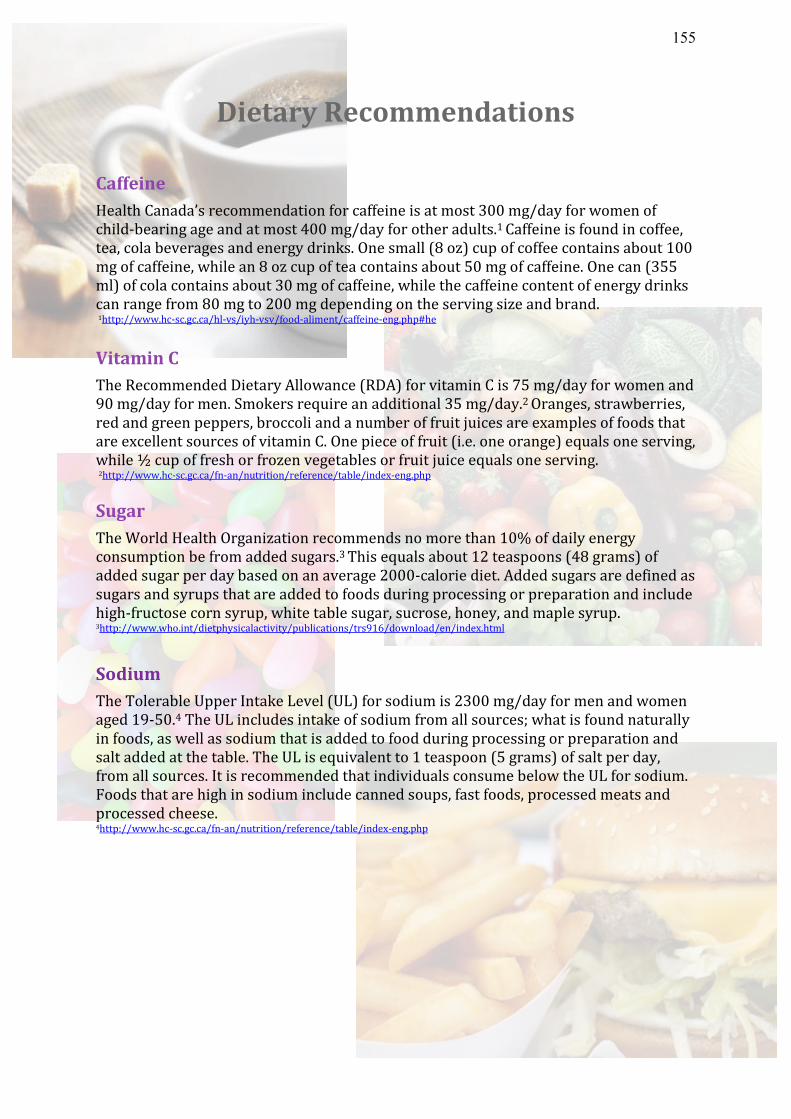
Dietary Recommendations Caffeine Health Canada’s recommendation for caffeine is at most 300 mg/day for women of child-bearing age and at most 400 mg/day for other adults.1 Caffeine is found in coffee, tea, cola beverages and energy drinks. One small (8 oz) cup of coffee contains about 100 mg of caffeine, while an 8 oz cup of tea contains about 50 mg of caffeine. One can (355 ml) of cola contains about 30 mg of caffeine, while the caffeine content of energy drinks can range from 80 mg to 200 mg depending on the serving size and brand. 1http://www.hc-sc.gc.ca/hl-vs/iyh-vsv/food-aliment/caffeine-eng.php#he
Vitamin C The Recommended Dietary Allowance (RDA) for vitamin C is 75 mg/day for women and 90 mg/day for men. Smokers require an additional 35 mg/day.2 Oranges, strawberries, red and green peppers, broccoli and a number of fruit juices are examples of foods that are excellent sources of vitamin C. One piece of fruit (i.e. one orange) equals one serving, while ½ cup of fresh or frozen vegetables or fruit juice equals one serving. 2http://www.hc-sc.gc.ca/fn-an/nutrition/reference/table/index-eng.php Sugar The World Health Organization recommends no more than 10% of daily energy consumption be from added sugars.3 This equals about 12 teaspoons (48 grams) of added sugar per day based on an average 2000-calorie diet. Added sugars are defined as sugars and syrups that are added to foods during processing or preparation and include high-fructose corn syrup, white table sugar, sucrose, honey, and maple syrup. 3http://www.who.int/dietphysicalactivity/publications/trs916/download/en/index.html
Sodium The Tolerable Upper Intake Level (UL) for sodium is 2300 mg/day for men and women aged 19-50.4 The UL includes intake of sodium from all sources; what is found naturally in foods, as well as sodium that is added to food during processing or preparation and salt added at the table. The UL is equivalent to 1 teaspoon (5 grams) of salt per day, from all sources. It is recommended that individuals consume below the UL for sodium. Foods that are high in sodium include canned soups, fast foods, processed meats and processed cheese. 4http://www.hc-sc.gc.ca/fn-an/nutrition/reference/table/index-eng.php
155

Dietary Advice Report
Intervention Group
Non-Risk
156
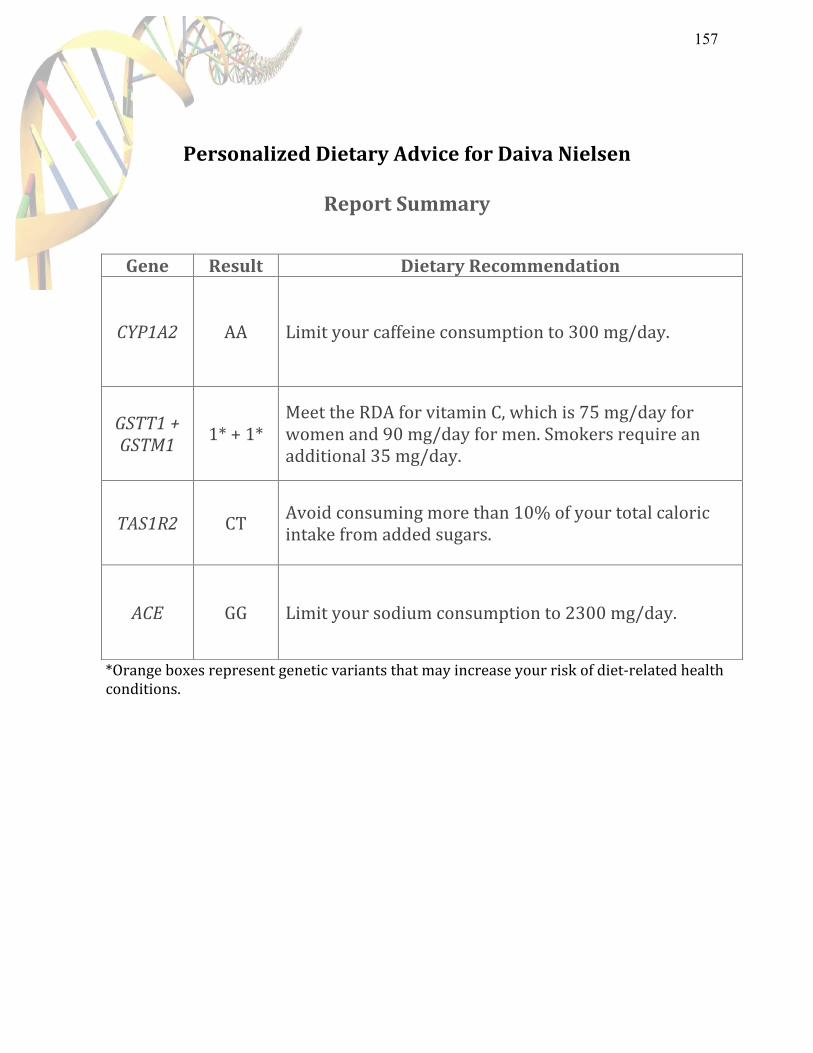
Personalized Dietary Advice for Daiva Nielsen
Report Summary
*Orange boxes represent genetic variants that may increase your risk of diet-‐related health conditions.
Gene Result Dietary Recommendation
CYP1A2 AA Limit your caffeine consumption to 300 mg/day.
GSTT1 + GSTM1
1* + 1* Meet the RDA for vitamin C, which is 75 mg/day for women and 90 mg/day for men. Smokers require an additional 35 mg/day.
TAS1R2 CT Avoid consuming more than 10% of your total caloric intake from added sugars.
ACE GG Limit your sodium consumption to 2300 mg/day.
157
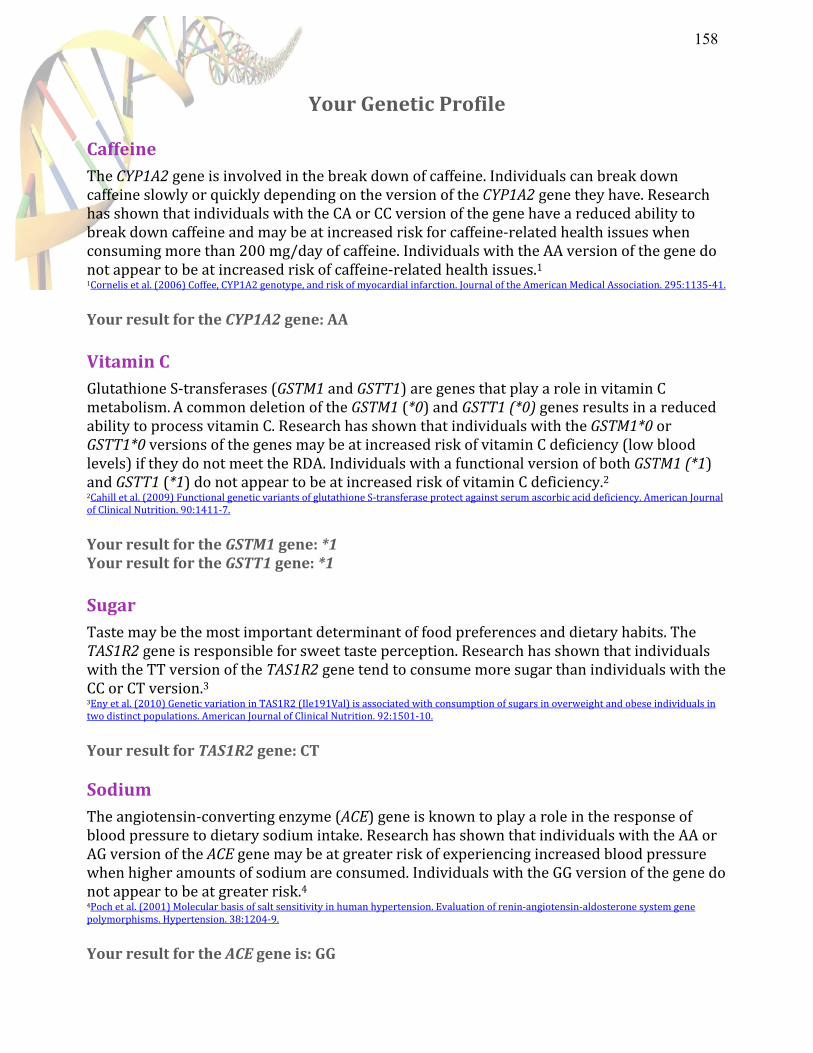
Your Genetic Profile
Caffeine The CYP1A2 gene is involved in the break down of caffeine. Individuals can break down caffeine slowly or quickly depending on the version of the CYP1A2 gene they have. Research has shown that individuals with the CA or CC version of the gene have a reduced ability to break down caffeine and may be at increased risk for caffeine-‐related health issues when consuming more than 200 mg/day of caffeine. Individuals with the AA version of the gene do not appear to be at increased risk of caffeine-‐related health issues.1 1Cornelis et al. (2006) Coffee, CYP1A2 genotype, and risk of myocardial infarction. Journal of the American Medical Association. 295:1135-‐41. Your result for the CYP1A2 gene: AA
Vitamin C Glutathione S-‐transferases (GSTM1 and GSTT1) are genes that play a role in vitamin C metabolism. A common deletion of the GSTM1 (*0) and GSTT1 (*0) genes results in a reduced ability to process vitamin C. Research has shown that individuals with the GSTM1*0 or GSTT1*0 versions of the genes may be at increased risk of vitamin C deficiency (low blood levels) if they do not meet the RDA. Individuals with a functional version of both GSTM1 (*1) and GSTT1 (*1) do not appear to be at increased risk of vitamin C deficiency.2 2Cahill et al. (2009) Functional genetic variants of glutathione S-‐transferase protect against serum ascorbic acid deficiency. American Journal of Clinical Nutrition. 90:1411-‐7. Your result for the GSTM1 gene: *1 Your result for the GSTT1 gene: *1
Sugar Taste may be the most important determinant of food preferences and dietary habits. The TAS1R2 gene is responsible for sweet taste perception. Research has shown that individuals with the TT version of the TAS1R2 gene tend to consume more sugar than individuals with the CC or CT version.3 3Eny et al. (2010) Genetic variation in TAS1R2 (Ile191Val) is associated with consumption of sugars in overweight and obese individuals in two distinct populations. American Journal of Clinical Nutrition. 92:1501-‐10. Your result for TAS1R2 gene: CT Sodium The angiotensin-‐converting enzyme (ACE) gene is known to play a role in the response of blood pressure to dietary sodium intake. Research has shown that individuals with the AA or AG version of the ACE gene may be at greater risk of experiencing increased blood pressure when higher amounts of sodium are consumed. Individuals with the GG version of the gene do not appear to be at greater risk.4 4Poch et al. (2001) Molecular basis of salt sensitivity in human hypertension. Evaluation of renin-‐angiotensin-‐aldosterone system gene polymorphisms. Hypertension. 38:1204-‐9. Your result for the ACE gene is: GG
158
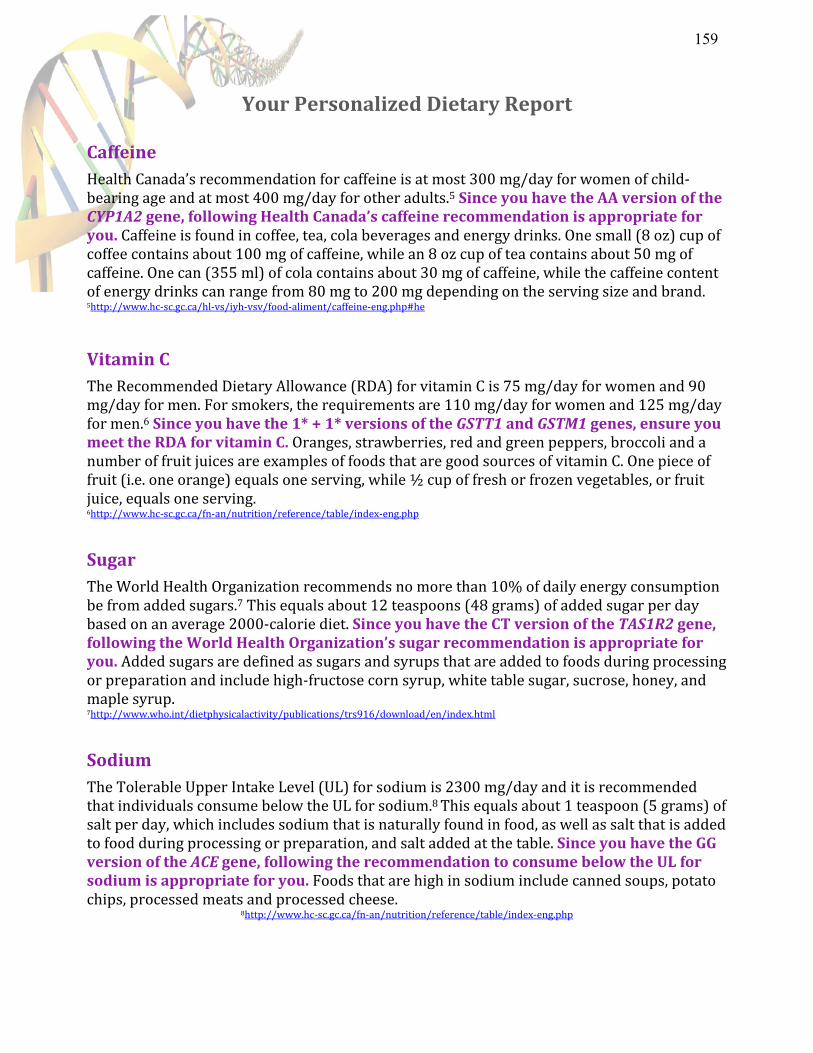
Your Personalized Dietary Report
Caffeine Health Canada’s recommendation for caffeine is at most 300 mg/day for women of child-‐bearing age and at most 400 mg/day for other adults.5 Since you have the AA version of the CYP1A2 gene, following Health Canada’s caffeine recommendation is appropriate for you. Caffeine is found in coffee, tea, cola beverages and energy drinks. One small (8 oz) cup of coffee contains about 100 mg of caffeine, while an 8 oz cup of tea contains about 50 mg of caffeine. One can (355 ml) of cola contains about 30 mg of caffeine, while the caffeine content of energy drinks can range from 80 mg to 200 mg depending on the serving size and brand. 5http://www.hc-‐sc.gc.ca/hl-‐vs/iyh-‐vsv/food-‐aliment/caffeine-‐eng.php#he
Vitamin C The Recommended Dietary Allowance (RDA) for vitamin C is 75 mg/day for women and 90 mg/day for men. For smokers, the requirements are 110 mg/day for women and 125 mg/day for men.6 Since you have the 1* + 1* versions of the GSTT1 and GSTM1 genes, ensure you meet the RDA for vitamin C. Oranges, strawberries, red and green peppers, broccoli and a number of fruit juices are examples of foods that are good sources of vitamin C. One piece of fruit (i.e. one orange) equals one serving, while ½ cup of fresh or frozen vegetables, or fruit juice, equals one serving. 6http://www.hc-‐sc.gc.ca/fn-‐an/nutrition/reference/table/index-‐eng.php
Sugar The World Health Organization recommends no more than 10% of daily energy consumption be from added sugars.7 This equals about 12 teaspoons (48 grams) of added sugar per day based on an average 2000-‐calorie diet. Since you have the CT version of the TAS1R2 gene, following the World Health Organization’s sugar recommendation is appropriate for you. Added sugars are defined as sugars and syrups that are added to foods during processing or preparation and include high-‐fructose corn syrup, white table sugar, sucrose, honey, and maple syrup. 7http://www.who.int/dietphysicalactivity/publications/trs916/download/en/index.html
Sodium The Tolerable Upper Intake Level (UL) for sodium is 2300 mg/day and it is recommended that individuals consume below the UL for sodium.8 This equals about 1 teaspoon (5 grams) of salt per day, which includes sodium that is naturally found in food, as well as salt that is added to food during processing or preparation, and salt added at the table. Since you have the GG version of the ACE gene, following the recommendation to consume below the UL for sodium is appropriate for you. Foods that are high in sodium include canned soups, potato chips, processed meats and processed cheese.
8http://www.hc-‐sc.gc.ca/fn-‐an/nutrition/reference/table/index-‐eng.php
159

Dietary Advice Report
Intervention Group
Risk
160
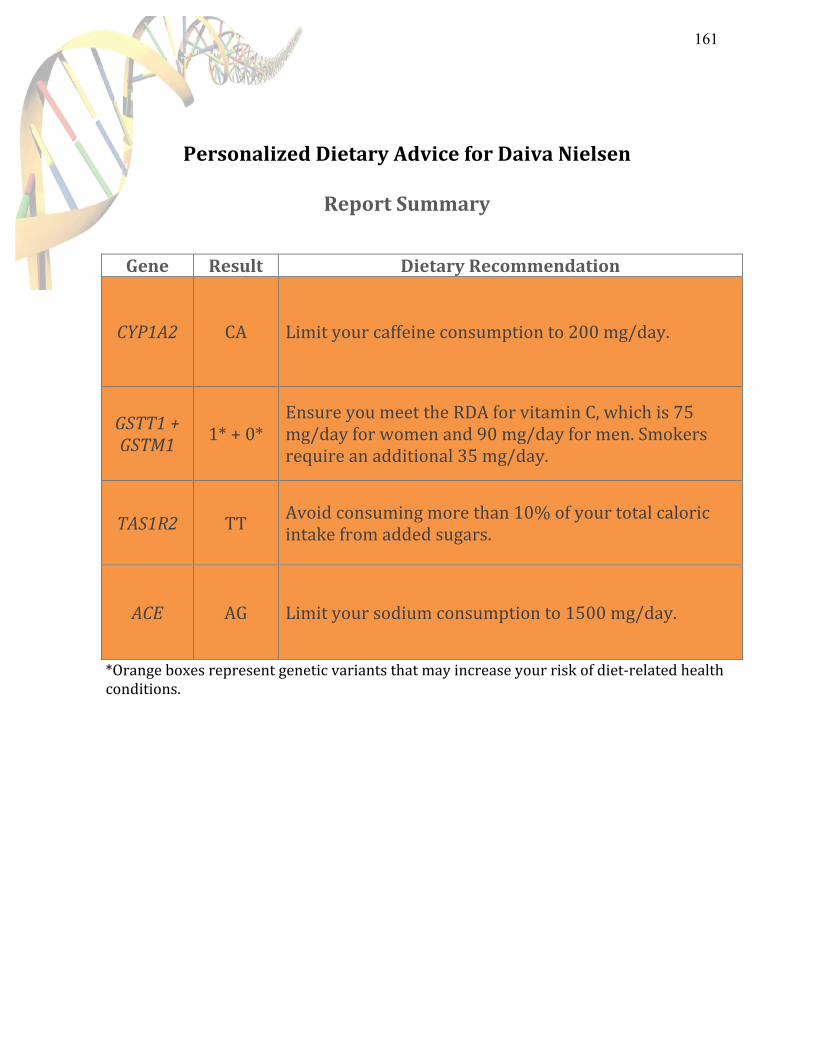
Personalized Dietary Advice for Daiva Nielsen
Report Summary
*Orange boxes represent genetic variants that may increase your risk of diet-‐related health conditions.
Gene Result Dietary Recommendation
CYP1A2 CA Limit your caffeine consumption to 200 mg/day.
GSTT1 + GSTM1
1* + 0* Ensure you meet the RDA for vitamin C, which is 75 mg/day for women and 90 mg/day for men. Smokers require an additional 35 mg/day.
TAS1R2 TT Avoid consuming more than 10% of your total caloric intake from added sugars.
ACE AG Limit your sodium consumption to 1500 mg/day.
161

Your Genetic Profile
Caffeine The CYP1A2 gene is involved in the break down of caffeine. Individuals can break down caffeine slowly or quickly depending on the version of the CYP1A2 gene they have. Research has shown that individuals with the CA or CC version of the gene have a reduced ability to break down caffeine and may be at increased risk for caffeine-‐related health issues when consuming more than 200 mg/day of caffeine. Individuals with the AA version of the gene do not appear to be at increased risk of caffeine-‐related health issues.1 1Cornelis et al. (2006) Coffee, CYP1A2 genotype, and risk of myocardial infarction. Journal of the American Medical Association. 295:1135-‐41. Your result for the CYP1A2 gene: CA
Vitamin C Glutathione S-‐transferases (GSTM1 and GSTT1) are genes that play a role in vitamin C metabolism. A common deletion of the GSTM1 (*0) and GSTT1 (*0) genes results in a reduced ability to process vitamin C. Research has shown that individuals with the GSTM1*0 or GSTT1*0 versions of the genes may be at increased risk of vitamin C deficiency (low blood levels) if they do not meet the RDA. Individuals with a functional version of both GSTM1 (*1) and GSTT1 (*1) do not appear to be at increased risk of vitamin C deficiency.2 2Cahill et al. (2009) Functional genetic variants of glutathione S-‐transferase protect against serum ascorbic acid deficiency. American Journal of Clinical Nutrition. 90:1411-‐7. Your result for the GSTM1 gene: *1 Your result for the GSTT1 gene: *0
Sugar Taste may be the most important determinant of food preferences and dietary habits. The TAS1R2 gene is responsible for sweet taste perception. Research has shown that individuals with the TT version of the TAS1R2 gene tend to consume more sugar than individuals with the CC or CT version.3 3Eny et al. (2010) Genetic variation in TAS1R2 (Ile191Val) is associated with consumption of sugars in overweight and obese individuals in two distinct populations. American Journal of Clinical Nutrition. 92:1501-‐10. Your result for TAS1R2 gene: TT Sodium The angiotensin-‐converting enzyme (ACE) gene is known to play a role in the response of blood pressure to dietary sodium intake. Research has shown that individuals with the AA or AG version of the ACE gene may be at greater risk of experiencing increased blood pressure when higher amounts of sodium are consumed. Individuals with the GG version of the gene do not appear to be at greater risk.4 4Poch et al. (2001) Molecular basis of salt sensitivity in human hypertension. Evaluation of renin-‐angiotensin-‐aldosterone system gene polymorphisms. Hypertension. 38:1204-‐9. Your result for the ACE gene is: AG
162

Your Personalized Dietary Report
Caffeine Health Canada’s recommendation for caffeine is at most 300 mg/day for women of child-‐bearing age and at most 400 mg/day for other adults.5 Since you have the CA version of the CYP1A2 gene, you might benefit from limiting your caffeine intake to no more than 200 mg/day. Caffeine is found in coffee, tea, cola beverages and energy drinks. One small (8 oz) cup of coffee contains about 100 mg of caffeine, while an 8 oz cup of tea contains about 50 mg of caffeine. One can (355 ml) of cola contains about 30 mg of caffeine, while the caffeine content of energy drinks can range from 80 mg to 200 mg depending on the serving size and brand. 5http://www.hc-‐sc.gc.ca/hl-‐vs/iyh-‐vsv/food-‐aliment/caffeine-‐eng.php#he
Vitamin C The Recommended Dietary Allowance (RDA) for vitamin C is 75 mg/day for women and 90 mg/day for men. Smokers require an additional 35 mg/day.6 Since you have the 1* + 0* versions of the GSTT1 and GSTM1 genes, you should ensure you meet the RDA for vitamin C to reduce the risk of deficiency. Oranges, strawberries, red and green peppers, broccoli and a number of fruit juices are examples of foods that are excellent sources of vitamin C. One piece of fruit (i.e. one orange) equals one serving, while ½ cup of fresh or frozen vegetables, or fruit juice, equals one serving. 6http://www.hc-‐sc.gc.ca/fn-‐an/nutrition/reference/table/index-‐eng.php
Sugar The World Health Organization recommends no more than 10% of daily energy consumption be from added sugars.7 This equals about 12 teaspoons (48 grams) of added sugar per day based on an average 2000-‐calorie diet. Since you have the TT version of the TAS1R2 gene, you may have a tendency to over consume sugar and might benefit from limiting your consumption of sweetened foods and beverages with added sugars. Added sugars are defined as sugars and syrups that are added to foods during processing or preparation and include high-‐fructose corn syrup, white table sugar, sucrose, honey, and maple syrup. 7http://www.who.int/dietphysicalactivity/publications/trs916/download/en/index.html Sodium The Tolerable Upper Intake Level (UL) for sodium is 2300 mg/day. 8 This equals about 1 teaspoon (5 grams) of salt per day, which includes sodium that is naturally found in food as well as salt that is added to food during processing or preparation. Since you have the AG version of the ACE gene, limiting your sodium consumption to the Adequate Intake (AI) level of 1500 mg/day should reduce the risk of increased blood pressure associated with high sodium intake. The AI is equivalent to 3/4 teaspoon (3.75 grams) of salt per day, from all sources. Foods that are high in sodium include canned soups, potato chips, processed meats and processed cheese. 8http://www.hc-‐sc.gc.ca/fn-‐an/nutrition/reference/table/index-‐eng.php
163