Embed Size (px)
Citation preview

Disclosure of long-term
business valueWhat matters?

We wish to thank Bruno Bertocci and Erika Karp (UBS AG), Emma Coles (Royal Ahold N.V.), Mark Fulton (Deutsche Bank Climate Change Advisors), Daniel Hanson (BlackRock, Inc.), Bob Laux (Microsoft Corporation), Linda-Eling Lee (MSCI, Inc.), Steve Leffin (United Parcel Service of America, Inc.), Ernst Ligteringen (GRI), Curtis Ravenel (Bloomberg LP), Brian Rice (CalSTRS), Elizabeth Seeger (Kohlberg Kravis Roberts & Co. LP), Dave Stangis (CSC Brands LP), and Susanne Stormer (Novo Nordisk A/S) for their helpful comments to our research. We are grateful for the contributions of our colleagues Charles Alsdorf (Deloitte FAS LLP), Daniel Aronson (Deloitte Consulting LLP), Jessica Bramhall (Deloitte and Touche LLP), Valerie Chort (Deloitte and Touche LLP, Canada), John DeRose (Deloitte and Touche LLP), Eric Dugelay (Deloitte France), Nick Main (DTTL), Will Sarni (Deloitte Consulting LLP), Beth Schneider (Deloitte and Touche LLP), Kristen Sullivan (Deloitte and Touche LLP), Chaim Schneider (Deloitte Services LP), and Val Srinivas (Deloitte Services LP).
Acknowledgements
About the authorsEric J. HespenheideTel: +313 396 3163E-mail: [email protected] Eric J. Hespenheide is a retired partner with Deloitte & Touche LLP. While active at Deloitte & Touche LLP, he served as a global leader in DTTL’s Sustainability group within Audit and Enterprise Risk Services. He represented DTTL in various forums such as the World Business Council for Sustainable Development. He was DTTL’s organizational stakeholder at the Global Reporting Initiative and was also a member of the Working Group of the International Integrated Reporting Committee.
Dr. Dinah A. KoehlerTel: +212 436 5664E-mail: [email protected] Dr. Dinah A. Koehler leads research on sustainability as senior manager at Deloitte Research, Deloitte Services LP.
Disclosure of long-term business value

Contents
Executive summary | 2
The changing view of business value | 3
Information vortex | 5
Corporate ESG disclosure | 7
Challenges to ESG materiality determination | 9
Consequences for data users | 12
The path forward: Enhanced stakeholder engagement | 14
Recalibrating materiality | 17
Endnotes | 20
What matters?
1

Executive summary
Sustained and superior performance depends, in part, on effective measure-
ment, management, and disclosure of tra-ditional financial metrics. There are many other metrics, such as those used to evaluate environmental, social, and governance (ESG) performance; resource efficiency; business model resilience; innovative capacity; brand strength and corporate culture, which can be just as informative on how a business is creating value. There is a lot to be said for building a business that outperforms on these metrics—especially when competitors miss, ignore, or simply misunderstand how they can drive business value and growth opportuni-ties. CFOs, with their unique, cross-functional vantage point, need to consider more than their results for the next quarter and a wider range of stakeholders—customers, suppliers, consumers, employees, non-governmental organizations, and communities—that play an important role in an organization’s success.
This research takes an in-depth look at how companies determine materiality in the ESG context, and discusses the challenges managers face and how these impact what type of data is disclosed. Today, most companies that measure these nontraditional metrics disclose most of the information in a separate sustainability report—yet this is likely to change. The chal-lenge faced by all public and private compa-nies is how to determine what information to
disclose. Many companies are trying to apply the principle of materiality from traditional financial reporting to this new set of perfor-mance metrics, but this remains difficult ter-rain because there is little hands-on guidance about precisely what to do. Simply put, manag-ers have neither the tools nor the approach to make these decisions efficiently and rigor-ously. The result is data that is difficult to use for making business decisions, both inside a company and externally.
Materiality determination is one of the most complicated ESG-related decisions for senior management, which faces considerable uncertainty related to ESG topics. With limited resources at hand, managers should choose a small set of material performance indicators that inform on valuation impacts and consis-tently report data, and they should focus less on trying to satisfy every one of the company’s stakeholders. Furthermore, ESG materiality determination need not be a qualitative “finger to the wind” exercise. Decision science meth-ods can help corporate leaders and CFOs effec-tively leverage the intelligence that is gained from all key stakeholders by applying a more structured approach to stakeholder engage-ment. They can also help management make strategic choices, including capital budgeting decisions. More importantly, the result is quan-titative and based upon fundamental insights into how complex decisions are made.
Disclosure of long-term business value
2

Emergent natural resource constraints, global demographics and politics, envi-
ronmental degradation, and increasing severity of weather events will continue to generate volatility and uncertainty in the global marketplace. At the same time, social movements, combined with Internet-enabled interconnectivity, have unleashed a significant leap in transparency, some of it forced on com-panies. Corporate leaders are con-stantly reminded that the public and other stakeholders expect companies to demonstrate their social value and ensure long-term sustainability and profitability. Indeed, when it comes to hot-button issues like sustainable forestry or employ-ment policies, social activists tend to pressure not only one company but also its industry peers.1 Furthermore, one company’s nega-tive reputation event can be felt across sev-eral industries.2 As these forces converge and intensify, they challenge CFOs to reconsider a traditional reporting model that may not effec-tively meet today’s information needs. Those that do are in good company. Today, 60 percent of CFOs at large global enterprises—with aver-age annual revenue of $17 billion—believe that
sustainability challenges will change financial reporting and auditing.3
A sharper focus on long-term success reveals that business value can only be created and sustained if the underlying assets—finan-cial, human, manufactured, social, or natural—are not depleted but in many cases increased.
What matters is not only a company’s financial perfor-mance but also its performance on dimensions that are “intangible” and measured in non-financial units. Non-financial metrics can pro-vide insights into long-term organi-zational strategies that depend on a company’s intel-lectual capital, customer loyalty, and resilience in the face of rap-
idly shifting marketplace demands, among other intangibles. Research finds that most businesses face a large gap between how well they measure non-financial performance and what in fact drives stock market and long-term financial performance.4 Furthermore, closing that gap is likely to lead to improved financial performance. Historical data shows that capital markets today more closely track a company’s intangible assets than its tangible assets. Intangible assets include a company’s
The changing view of business value
“ESG performance needs to be understood by CFOs “as generating long-term shareholder value.””—Dave Stangis, vice president, CSR and
Sustainability, Campbell’s Soup Company
What matters?
3
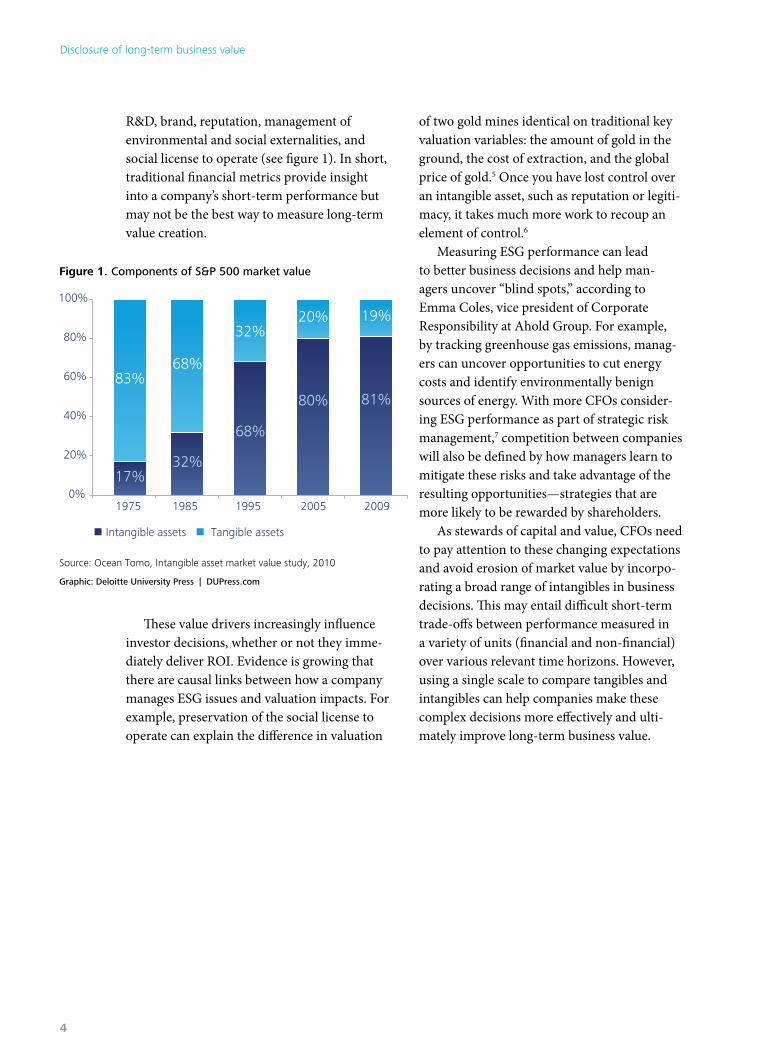
R&D, brand, reputation, management of environmental and social externalities, and social license to operate (see figure 1). In short, traditional financial metrics provide insight into a company’s short-term performance but may not be the best way to measure long-term value creation.
These value drivers increasingly influence investor decisions, whether or not they imme-diately deliver ROI. Evidence is growing that there are causal links between how a company manages ESG issues and valuation impacts. For example, preservation of the social license to operate can explain the difference in valuation
of two gold mines identical on traditional key valuation variables: the amount of gold in the ground, the cost of extraction, and the global price of gold.5 Once you have lost control over an intangible asset, such as reputation or legiti-macy, it takes much more work to recoup an element of control.6
Measuring ESG performance can lead to better business decisions and help man-agers uncover “blind spots,” according to Emma Coles, vice president of Corporate Responsibility at Ahold Group. For example, by tracking greenhouse gas emissions, manag-ers can uncover opportunities to cut energy costs and identify environmentally benign sources of energy. With more CFOs consider-ing ESG performance as part of strategic risk management,7 competition between companies will also be defined by how managers learn to mitigate these risks and take advantage of the resulting opportunities—strategies that are more likely to be rewarded by shareholders.
As stewards of capital and value, CFOs need to pay attention to these changing expectations and avoid erosion of market value by incorpo-rating a broad range of intangibles in business decisions. This may entail difficult short-term trade-offs between performance measured in a variety of units (financial and non-financial) over various relevant time horizons. However, using a single scale to compare tangibles and intangibles can help companies make these complex decisions more effectively and ulti-mately improve long-term business value.
Graphic: Deloitte University Press | DUPress.com
Source: Ocean Tomo, Intangible asset market value study, 2010
Figure 1. Components of S&P 500 market value
17%32%
68%
80% 81%83%
68%
32%20% 19%
0%
20%
40%
60%
80%
100%
1975 1985 1995 2005 2009
n Intangible assets n Tangible assets
Disclosure of long-term business value
4

Information vortex
Of the 250 largest companies in the world (G250 companies), 95 percent
now issue separate sustainability reports.8 Moving forward, it is likely that there will be greater alignment of traditional financial reporting and reporting on ESG topics.9 The international initiative for integrated report-ing is proposing integrating the disclosure of standard financial information with ESG information to provide a more complete view of the commercial, social, and environmental context within which a company operates.10 Importantly, integrated reporting will likely require reporters to make valuation impacts of ESG information more explicit. The “total mix” of information involved in these decisions can be overwhelming.
Right now, there is often a disconnect between what ESG information companies disclose to their stakeholders and the data that actually drives management and investment decisions. Some think companies disclose too much information, others complain about too little information, and most agree that it is hard to know which information is business-critical for the long run.
For this reason, the discussion among reporters and users of ESG information has focused on the principle of materiality—a term drawn from financial accounting prac-tice—as the essential filter for disclosing ESG information that is useful to the economic decisions of an interested user. Although based on the traditional definition of material-ity from financial reporting, commonly used guidance on ESG materiality determination more explicitly incorporates a company’s (internal and external) stakeholders in the pro-cess (see right).11 A stakeholder is any group or
ma·te·ri·al·i·ty Definitions of materiality
A matter is “material” if there is a substantial likelihood that a reasonable person . . . relying upon the report would have been changed or influenced by the inclusion or correction of the item . . . financial management and the auditor must consider both “quantitative” and “qualitative” factors in assessing an item’s materiality.
SAB 99
Information is material if its omission or misstatement could influence the economic decisions of users taken on the basis of the financial statements. Materiality depends on the size of the item or error judged in the particular circumstances of its omission or misstatement. Thus, materiality provides a threshold or cut-off point rather than being a primary qualitative characteristic that information must have if it is to be useful.
IAASB Framework for the Preparation & Presentation of Financial Statements, paragraph 30.
A meaningful definition of materiality must effectively identify information that, if omitted or misstated, would significantly misrepresent an organization to its stakeholders and thereby influence their conclusions, decisions, and actions for a particular company at a specified place and point in time.
AA1000 Assurance Standard
Material topics include direct and indirect impacts (immediate, gradual/cumulative, and visible/invisible) on an organization’s ability to create, preserve, or erode economic, environmental and social value for itself, its stakeholders, and society at large.
GRI Technical Protocol
Materiality threshold is a concept employed in the process of verification. It is often used to determine whether an error or omission is a material discrepancy or not. It should not be viewed as a de minimis for defining a complete inventory or a permissible quantity of emissions that a company can leave out of its inventory.
WBCSD/WRI GHG Protocol, revised
What matters?
5

individual who can affect or is affected by the actions of an organization, and whose interests should be considered.12 Stakeholders may be helped (or harmed) by a particular business strategy, and it is up to managers to determine whether this might be material.
Companies that follow the Global Reporting Initiative (GRI) guidelines should consult with internal and external stakeholders when undertaking an ESG materiality determi-nation to assess (among others):
• An organization’s overall mission and competitive strategy
• Significant financial impacts, both in the near term and over longer time horizons
• An organization’s influence on upstream (e.g., supply chain) and downstream (e.g., customers) entities
• International standards and agreements with which an organization is expected to comply
• Issues identified by expert communities or through impact assessment methodologies
• Broader social expectations
• Impacts that affect the ability to meet current needs without compromising future generations
Materiality of ESG data—like materiality for any input in investment decision-making—should be related to valuation impacts (e.g., through future earnings growth prospects, or potential impacts on balance sheet liabilities and risks). Both managers and investors need to understand that ESG performance is material to financial and stock market per-formance, according to Erika Karp, head of Global Sector Research, UBS Investment Bank. For example, during a 2004 drought in
the Indian state of Kerala, the local govern-ment revoked Coca-Cola’s license to operate and ordered the company to shut down its $25 million plant. In the United States, col-lege students began boycotting Coke products. At its peak, the plant filled approximately 1.1 million bottles a day and injected more than $50 million a year into the Indian economy. After a two-year trial, Coca-Cola convinced a court that drought was to blame for the dry wells and not the company, which was draw-ing water from a different aquifer. Coca-Cola has since established itself as an industry leader on water management. Nevertheless, the Kerala case presents a long-tailed risk: The bottling plant remains shut and, in 2011, the local government passed a law holding Coca-Cola liable for $48 million in damages to the local community.13
Yet to more successfully integrate ESG data into valuation analysis by the full range of investors, investors want it to be quantitative, reported consistently over several years, and conducive to comparisons both within and between industries. This is usually not the case. Rather than rely on ESG information disclosed by companies, a growing number of investors prefer to build their own ESG databases (e.g., Goldman Sachs’s GS Sustain and UBS) or use data from ESG data providers, such as MSCI, Asset4, or Trucost. Where possible, interested investors use ESG information to assess risk and return implications, evaluate management quality, engage with companies and inform proxy voting, and develop customized invest-ment products or portfolios.14 According to Dan Hanson, portfolio manager at BlackRock, regardless of whether investors explicitly apply the “ESG” label to these characteristics, investors routinely consider corporate culture, management behavior, employee and customer engagement, and governance issues as funda-mental inputs in investment decision making.
Disclosure of long-term business value
6

The GRI G3/G3.1 Sustainability Reporting Guidelines have become the de facto
global framework for ESG disclosure. Since the release of the first version (G1) in 2000, usage of the guidelines continues to grow compared to growth in publicly listed companies (see figure 2). In total, the fraction of publicly listed companies that issue a sustainability report is small; however, the largest global companies are the most likely to dis-close ESG information,15 and already in 2007 constituted an aggregate market value of over 10 percent of US market capitalization.16
Since its establishment 13 years ago, the GRI has emphasized disclosure. To this end, the GRI created various application levels that offer companies a gradu-ated approach to reporting.17
Companies at the highest application level (A) disclose more than 100 indicators in some industry sectors. In 2010, 28 percent (526) of GRI reports achieved applica-tion level A, including 378 that were exter-nally assured (A+) (see figure 3). As the list of performance indicators grew, so did concerns that many were irrelevant to business and sustainability decisions. Consequently, GRI has reduced the number of key performance indicators (KPIs) over time (see figure 4). The 53 G3.1 core KPIs are assumed to be more material by GRI—such as energy consumption, materials used, employee turnover, fines and penalties under regulations, and screening of suppliers on human rights issues.
In practice, interpretations of what is material vary greatly. Many companies dis-close only a handful of indicators, and few explain why an indicator is not disclosed. For example, research finds that of the 100 Best Corporate Citizens in 2010, fewer than half assess which ESG issues might be material, and less than a quarter disclose the results or their methodology in a sustainability report or
Corporate ESG disclosure
Graphic: Deloitte University Press | DUPress.com
Source: Deloitte analysis, GRI, World Federation of Exchanges
Figure 2. Growth in GRI reports18
No. of publicly listed firms, global No. of GRI reporters, global
05,000
10,00015,00020,00025,00030,00035,00040,00045,00050,000
1999 2000 2001 2002 2003 2004 2005 2006 2007 2008 2009 201002004006008001,0001,2001,4001,6001,8002,000
GRI reporters Publicly listed firms
Graphic: Deloitte University Press | DUPress.com
Source: Deloitte analysis, GRI
Figure 3. Application level, GRI 2010 reporters
22%
23%27%
28%Undeclared
Application level C/C+
Application level B/B+
Application level A/A+
What matters?
7

SEC Form10-K.19 While GRI recommends that materiality determination should be conducted at all GRI application levels, companies issuing an A-level report are more likely to do this and disclose their results.
Companies that undertake a material-ity analysis tend to consult with internal and external stakeholders, industry peers, and media reports. The extent to which a company can influence an issue also figures in the iden-tification of material ESG topics. Some com-panies disclose a summary of their materiality determination in a materiality matrix on the company website. These matrices frequently follow the template provided by the GRI in its G3 guidelines to help companies identify which topics should be covered more in the report (see figure 5).20
It is plausible that disclosure of more ESG information is an indication of better-informed management and higher-quality data. Research finds that companies with better sustainabil-ity performance tend to issue sustainability reports and seek third-party assurance.21 GRI application level A reporters, who disclose more information, are more likely to engage third-party assurers, opposed to having the GRI spot-check the report or self-declaring the application level of the report (see figure 6). For example, sustainability reports that are audited tend to include more environmental information compared with those that are not audited, shown here as a percent of the num-ber of environmental metrics a company can disclose relative to the set of environmental metrics available via Bloomberg terminals (see figure 7).
Graphic: Deloitte University Press | DUPress.com
Source: Deloitte analysis, Bloomberg data, 2009
Figure 7. Percent of environmental data disclosed given audit status
0%
10%
20%
30%
40%
50%
60%
Auditor No auditor
Graphic: Deloitte University Press | DUPress.com
Source: Deloitte analysis, GRI data, 2010
Figure 6. Validation status22
0%
20%
40%
60%
80%
100%
Applicationlevel A/A+
Applicationlevel B/B+
Applicationlevel C/C+
3rd party GRI Self
16%
48%
35%
47%
27%
27%
58%
19%
23%
Graphic: Deloitte University Press | DUPress.com
Source: Deloitte analysis, GRI
Figure 4. Moving target: GRI KPIs
G2: 97 KPIs
G3.1: 84 KPIs
G3.1: 53 coreindicators
Graphic: Deloitte University Press | DUPress.com
Figure 5. GRI materiality matrix
Significance to the organization
Sign
ifica
nce
to s
take
hold
ers
Level of coverage
Disclosure of long-term business value
8

Living up to the spirit of the GRI guidelines can be difficult, and disclosure decisions
based upon stakeholder judgment are prob-lematic. Broad-based stakeholder engage-ment is often perceived as either risky or too expensive and may not be widely supported by management. Today, many organizations disclose what data they have available, in areas where they invest considerable resources, and believe they can influence or demonstrate progress. As a result, sustainability reports are often criticized for only including information that paints a favorable picture of a company’s sustainability efforts. If, and once, ESG data is intended to support investor decisions, omission of negative information may be considered misleading.
Scaling ESG materiality
For many managers, understanding ESG materiality means constant one-on-one stakeholder consultation and risk management throughout the year. The intelligence gained is often used to inform the reporting process and to improve a company’s responsiveness to stakeholder demands. Shell, SAP, and others bring together stakeholder panels to discuss topics that might be material. Yet other compa-nies design surveys to understand stakeholder sentiment. Not all paths necessarily lead to a complete list of material ESG topics.
Figuring out what information is mate-rial both to the business and its stakeholders means that managers need to balance financial outcomes with a multitude of non-financial outcomes measured in a variety of units and over varying time horizons. They also need to
understand how stakeholders view a com-pany’s behavior and what marks the threshold between responsible and irresponsible corpo-rate behavior.23 Without a robust method for addressing these challenges, “few companies are thinking about materiality in terms of rigor and replication,” notes Dave Stangis, vice president, CSR and Sustainability at Campbell’s Soup. No surprise then that the GRI has con-cluded that identification of material ESG top-ics is one of the most difficult, underdeveloped, and least systematized aspects of reporting for many companies.24
Fundamentally, what is needed to rank ESG material topics by their relative importance is a credible numeric scale. For the purpose of business decisions the scale should be in currency units. Many organizations, due in part to disclosure requirements,25 are monetiz-ing the costs imposed by mandated clean-up, resource conservation, ecosystem restora-tion, or broader environmental impacts. For example, Puma recently issued a revised profit/loss statement adjusted to incorporate the costs of carbon emissions and water use.26 However, for many potentially material ESG issues, valuation is difficult, missing, or based upon assumptions that are often challenged.
Consequently, prioritizing and select-ing material ESG topics is a highly subjective exercise in understanding and sorting through what information might be important to vari-ous stakeholders. The problem is that prepar-ers, auditors, and report users don’t agree on ESG materiality. Research shows that report users tend to adopt lower materiality thresh-olds than either preparers or auditors,27 and interest in ESG data varies between equity
Challenges to ESG materiality determination
What matters?
9
analysts and fixed income investors.28 For example, the former are more interested in ESG disclosures and greenhouse gas emis-sions, while the latter are more interested in governance disclosure.
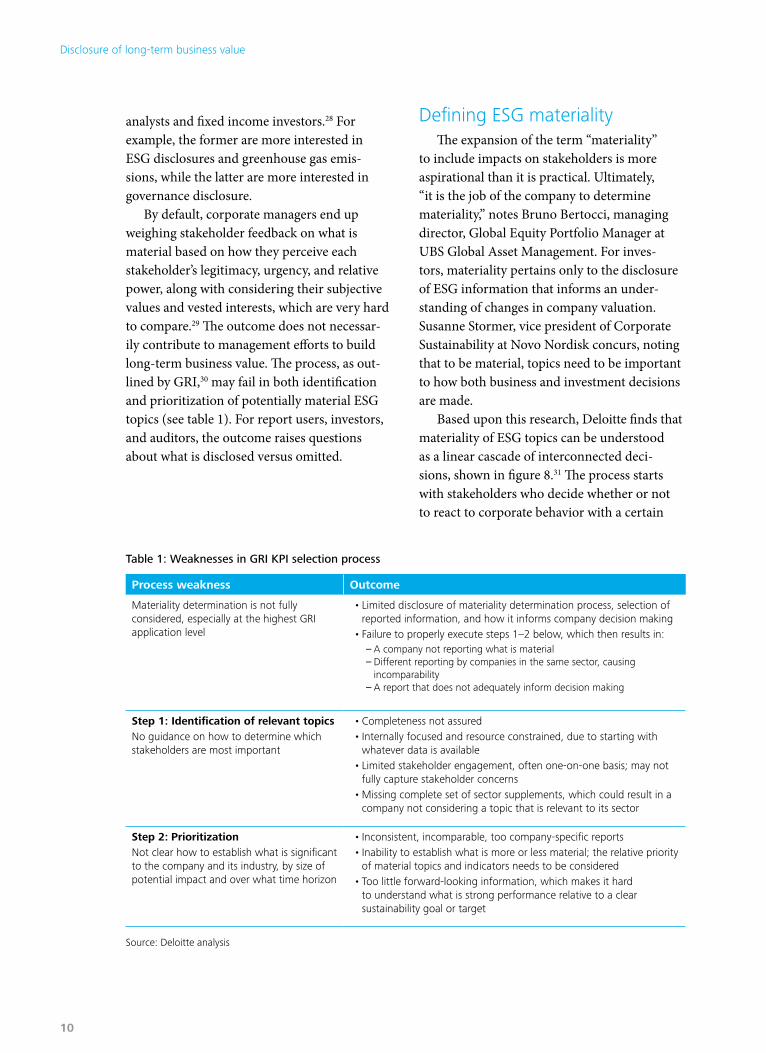
By default, corporate managers end up weighing stakeholder feedback on what is material based on how they perceive each stakeholder’s legitimacy, urgency, and relative power, along with considering their subjective values and vested interests, which are very hard to compare.29 The outcome does not necessar-ily contribute to management efforts to build long-term business value. The process, as out-lined by GRI,30 may fail in both identification and prioritization of potentially material ESG topics (see table 1). For report users, investors, and auditors, the outcome raises questions about what is disclosed versus omitted.
Defining ESG materialityThe expansion of the term “materiality”
to include impacts on stakeholders is more aspirational than it is practical. Ultimately, “it is the job of the company to determine materiality,” notes Bruno Bertocci, managing director, Global Equity Portfolio Manager at UBS Global Asset Management. For inves-tors, materiality pertains only to the disclosure of ESG information that informs an under-standing of changes in company valuation. Susanne Stormer, vice president of Corporate Sustainability at Novo Nordisk concurs, noting that to be material, topics need to be important to how both business and investment decisions are made.
Based upon this research, Deloitte finds that materiality of ESG topics can be understood as a linear cascade of interconnected deci-sions, shown in figure 8.31 The process starts with stakeholders who decide whether or not to react to corporate behavior with a certain
table 1: Weaknesses in gri KPi selection process
Process weakness Outcome
Materiality determination is not fully considered, especially at the highest GRI application level
• Limited disclosure of materiality determination process, selection of reported information, and how it informs company decision making
• Failure to properly execute steps 1–2 below, which then results in: – A company not reporting what is material – Different reporting by companies in the same sector, causing incomparability – A report that does not adequately inform decision making
Step 1: Identification of relevant topics No guidance on how to determine which stakeholders are most important
• Completeness not assured • Internally focused and resource constrained, due to starting with
whatever data is available • Limited stakeholder engagement, often one-on-one basis; may not
fully capture stakeholder concerns • Missing complete set of sector supplements, which could result in a
company not considering a topic that is relevant to its sector
Step 2: Prioritization Not clear how to establish what is significant to the company and its industry, by size of potential impact and over what time horizon
• Inconsistent, incomparable, too company-specific reports • Inability to establish what is more or less material; the relative priority
of material topics and indicators needs to be considered• Too little forward-looking information, which makes it hard
to understand what is strong performance relative to a clear sustainability goal or target
Source: Deloitte analysis
Disclosure of long-term business value
10
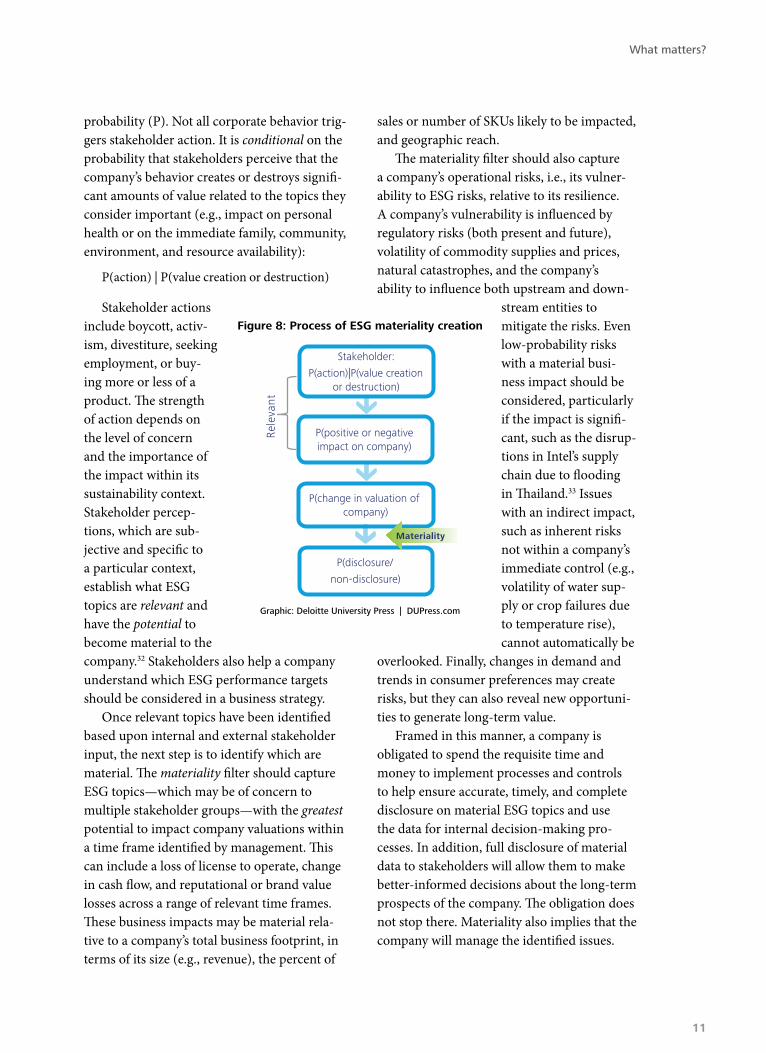
probability (P). Not all corporate behavior trig-gers stakeholder action. It is conditional on the probability that stakeholders perceive that the company’s behavior creates or destroys signifi-cant amounts of value related to the topics they consider important (e.g., impact on personal health or on the immediate family, community, environment, and resource availability):
P(action) | P(value creation or destruction)
Stakeholder actions include boycott, activ-ism, divestiture, seeking employment, or buy-ing more or less of a product. The strength of action depends on the level of concern and the importance of the impact within its sustainability context. Stakeholder percep-tions, which are sub-jective and specific to a particular context, establish what ESG topics are relevant and have the potential to become material to the company.32 Stakeholders also help a company understand which ESG performance targets should be considered in a business strategy.
Once relevant topics have been identified based upon internal and external stakeholder input, the next step is to identify which are material. The materiality filter should capture ESG topics—which may be of concern to multiple stakeholder groups—with the greatest potential to impact company valuations within a time frame identified by management. This can include a loss of license to operate, change in cash flow, and reputational or brand value losses across a range of relevant time frames. These business impacts may be material rela-tive to a company’s total business footprint, in terms of its size (e.g., revenue), the percent of
sales or number of SKUs likely to be impacted, and geographic reach.
The materiality filter should also capture a company’s operational risks, i.e., its vulner-ability to ESG risks, relative to its resilience. A company’s vulnerability is influenced by regulatory risks (both present and future), volatility of commodity supplies and prices, natural catastrophes, and the company’s ability to influence both upstream and down-
stream entities to mitigate the risks. Even low-probability risks with a material busi-ness impact should be considered, particularly if the impact is signifi-cant, such as the disrup-tions in Intel’s supply chain due to flooding in Thailand.33 Issues with an indirect impact, such as inherent risks not within a company’s immediate control (e.g., volatility of water sup-ply or crop failures due to temperature rise), cannot automatically be
overlooked. Finally, changes in demand and trends in consumer preferences may create risks, but they can also reveal new opportuni-ties to generate long-term value.
Framed in this manner, a company is obligated to spend the requisite time and money to implement processes and controls to help ensure accurate, timely, and complete disclosure on material ESG topics and use the data for internal decision-making pro-cesses. In addition, full disclosure of material data to stakeholders will allow them to make better-informed decisions about the long-term prospects of the company. The obligation does not stop there. Materiality also implies that the company will manage the identified issues.
Graphic: Deloitte University Press | DUPress.com
Figure 8: Process of ESG materiality creation
P(positive or negative impact on company)
Rele
vant
Stakeholder:
P(action)|P(value creation or destruction)
P(change in valuation of company)
P(disclosure/
non-disclosure)
Materiality
What matters?
11

Consequences for data users
Because most ESG disclosure is still voluntary and only loosely validated by
many market players, the data can be incon-sistent and incomparable across companies. Qualitative analysis of eight companies in the automotive, financial services, pharmaceuti-cals, and sporting goods industries finds that comparability has not improved over several iterations of G3 reporting.34 Even companies within the same industry that report at the A level do not disclose the same core set of GRI indicators and do not disclose in the same units or geo-graphic scope. For example, Citigroup and Barclays disclose only 26 percent of the same indicators in their first G3 report, which falls to 20 percent in the second G3 report. Reporting also differs in the apparel companies even though they have a similar supply-chain geographic footprint. In fact, the amount of data disclosed either increases or decreases from year to year for even this small sample, making it doubtful that the data is comparable over time.
More recent research of over 4,000 sus-tainability reports from 2005–2009 finds a significant number of data omissions, unsub-stantiated claims, and inaccurate figures. Irregularities in carbon emissions are evident
in almost half of the companies studied, including data omitted from subsidiaries or operations in certain countries.35
Consider a snapshot of voluntary disclosure of environmental data—commonly believed to be more complete and quantitative com-pared with social and governance data. As of 2009, Bloomberg has been collecting ESG data (120 core variables, some dating back to 2007) from corporate sustainability reports and greenhouse gas (GHG) data submit-
ted to the Carbon Disclosure Project. Deloitte’s analysis of Bloomberg’s 2009 data shows that disclosure of environmental measures varies considerably between industry sectors for the subset of actively traded public com-panies that follow GRI guidelines (see table 2 on next page). Disclosure tends to be greatest in the Energy and Basic Materials sectors and overall is
biased toward qualitative information (coded as a binary variable) related to policies (see also figure 9), which is more challenging to integrate into quantitative financial analysis.36 Surprisingly, there is limited disclosure of compliance costs, which is mandated in many jurisdictions by regulatory entities (e.g., the United States EPA’s ECHO database).
Graphic: Deloitte University Press | DUPress.com
Source: Deloitte analysis, Bloomberg ESG data, 2009
Figure 9. Percent available vs. missing data per data category
30%
84%
14%
46%
70%
16%
86%
54%
0%
20%
40%
60%
80%
100%
QuantitativeE data
QualitativeE data
QuantitativeCDP data
QualitativeCDP data
Available Missing
Disclosure of long-term business value
12

Table 2. Percent environmental data disclosed by indicator type and industry, N=873 companies
Industry sector PolicyPackaging/waste
GHG emissions
EnergyCompliance cost
Energy 90% 41% 37% 34% 13%
Basic materials 90% 49% 34% 42% 16%
Consumer, cyclical 82% 37% 33% 34% 14%
Utilities 80% 50% 35% 32% 13%
Consumer, non-cyc 79% 42% 30% 42% 18%
Technology 77% 38% 31% 38% 16%
Industrial 76% 40% 29% 32% 14%
Financial 75% 24% 30% 40% 18%
Communications 72% 36% 33% 41% 19%
Diversified 64% 27% 30% 35% 18%
Overall data 79% 39% 32% 37% 16%
Table 2 Legend:
PolicySustainable packaging, investments in sustainability, emission reduction initiatives, environmental supply chain management, green building policy, waste reduction policy, environmental quality management policy, climate change opportunities discussed, climate change policy, new products climate change, biodiversity policy, energy efficiency
MaterialsHazardous waste, total waste, waste recycled
GHGTotal CO2 emissions, CO2 intensity per sales, CO2 intensity per EBITDA, GHG scope 1, GHG scope 2, GHG scope 3, total GHG emissions
EnergyTotal energy consumption, renewable energy use
Compliance CostEnvironmental fines number, environmental fines amount, environmental accounting cost
Source: Deloitte analysis, Bloomberg ESG data, 2009
What matters?
13

The path forward: Enhanced stakeholder engagement
Solutions that improve both the quality and utility of the ESG information range
from mandated disclosure to a more rigorous materiality determination process. At one end of the spectrum, mandating ESG disclosure may drive transparency on how companies create long-term value. It may help managers regain public trust, and society may benefit from wider adoption of socially responsible management practices. These benefits are likely to be even greater in countries with more effective enforcement and where sustain-ability reports are more frequently assured.37 Mandated ESG disclosure is gaining ground in South Africa and the European Union.38 Already, 55 of the world’s stock exchanges are encouraging disclosure by issuing sustain-ability indices or via mandates, such as those issued recently by the Securities and Exchange Board of India. Yet widespread mandated dis-closure is expected to be several years off.
ESG materiality determination would certainly be easier if there was solid evidence of the valuation impacts. Research and assess-ment on various ESG topics continues apace, but is often hampered by lack of data from companies, inconsistent reporting and the challenge of identifying the most appropri-ate valuation model. Quite often the impact is
hard to monetize, though the evidence of a stock price impact related to ESG perfor-mance appears to be getting stronger.39
On the other end of the spectrum, it should be possible to develop a materiality determina-tion process based on stakeholder input that is objective, robust, and replicable. In essence, the identification of material ESG informa-tion requires a structured process that explic-itly incorporates the subjective judgments of internal and external stakeholders and yields an internally consistent ranking of ESG topics by their relative importance to the company’s long-term performance.
Using decision sciences to determine materiality
ESG materiality determination is a com-plex decision. There are many unknowns and choices. Yet we make complex decisions every day. For example, when buying a car, a cer-tain attribute, such as safety, may matter more than other attributes, such as design or fuel efficiency. We weigh each in our mind and set up an implicit subjective ranking based only on a handful of attributes that really matter to the decision.
Decision sciences develop systematic analysis methods for making hard choices under uncertainty given a set of alternatives that can be specified and attributes that the decision maker values or prefers. Methods are commonly used in operations research, systems analysis, and management sciences. Multi-attribute decision analysis has been used in the public and private sectors in a variety of scenarios, including capital budgeting, nuclear waste disposal site selection, and the dissolution of apartheid in South Africa.
Disclosure of long-term business value
14
Decisions that involve multiple stakehold-ers, multiple alternatives, multiple attributes, and uncertainty require a more structured approach. Decision science methods, such as analytic hierarchy process (AHP) or multi-attribute decision analysis (MADA), guide a stakeholder panel with structured questions to create a preference ranking of various issues along a single numeric scale. (See the side-bar with the case study “Decision science in action,” on the use of AHP to develop weight-ings across 13 environmental impact categories for life cycle assessment.) Comparisons are set up between different issues or outcomes based upon information that can be carefully mea-sured or roughly estimated, including those aspects that are commonly called tangible or intangible assets. Most importantly, these methods are designed to capture subjective
judgment with all its imperfections and biases. For example, multi-attribute decision analysis methods are being used to assess the impact of tangible and intangible benefits and costs in capital budgeting decisions and valuation analysis.40
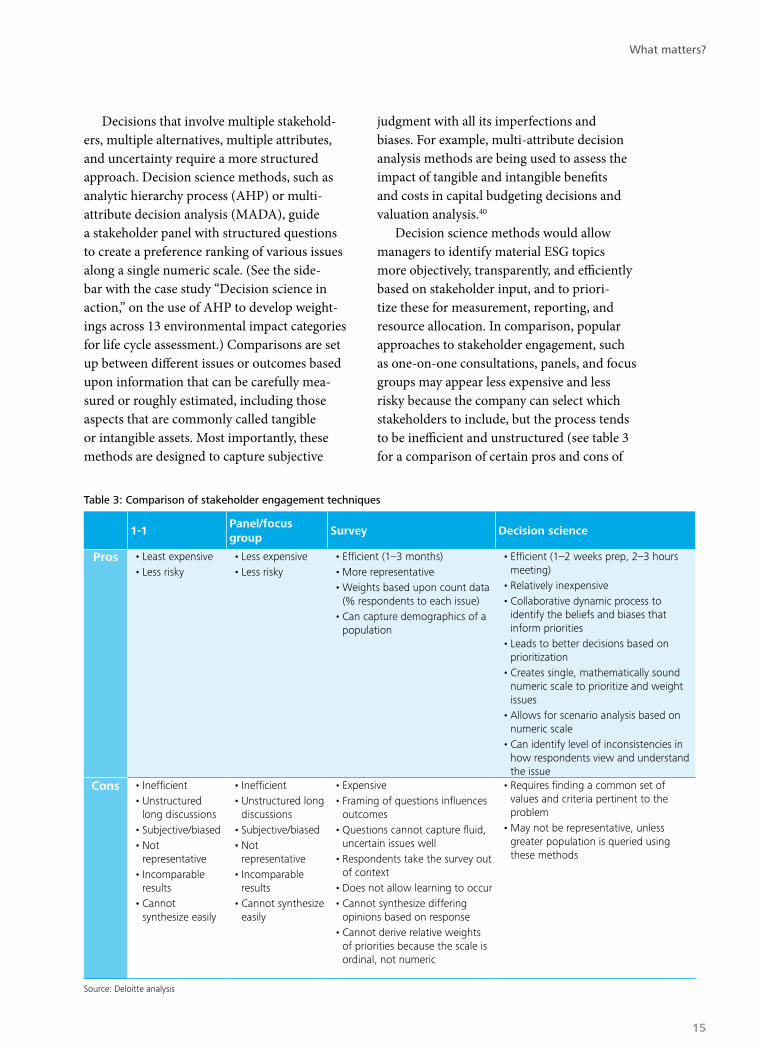
Decision science methods would allow managers to identify material ESG topics more objectively, transparently, and efficiently based on stakeholder input, and to priori-tize these for measurement, reporting, and resource allocation. In comparison, popular approaches to stakeholder engagement, such as one-on-one consultations, panels, and focus groups may appear less expensive and less risky because the company can select which stakeholders to include, but the process tends to be inefficient and unstructured (see table 3 for a comparison of certain pros and cons of
table 3: comparison of stakeholder engagement techniques
1-1 Panel/focus group
Survey Decision science
Pros • Least expensive• Less risky
• Less expensive• Less risky
• Efficient (1–3 months)• More representative• Weights based upon count data
(% respondents to each issue)• Can capture demographics of a
population
• Efficient (1–2 weeks prep, 2–3 hours meeting)
• Relatively inexpensive• Collaborative dynamic process to
identify the beliefs and biases that inform priorities
• Leads to better decisions based on prioritization
• Creates single, mathematically sound numeric scale to prioritize and weight issues
• Allows for scenario analysis based on numeric scale
• Can identify level of inconsistencies in how respondents view and understand the issue
Cons • Inefficient• Unstructured
long discussions• Subjective/biased• Not
representative• Incomparable
results• Cannot
synthesize easily
• Inefficient• Unstructured long
discussions• Subjective/biased• Not
representative• Incomparable
results• Cannot synthesize
easily
• Expensive• Framing of questions influences
outcomes• Questions cannot capture fluid,
uncertain issues well• Respondents take the survey out
of context • Does not allow learning to occur • Cannot synthesize differing
opinions based on response• Cannot derive relative weights
of priorities because the scale is ordinal, not numeric
• Requires finding a common set of values and criteria pertinent to the problem
• May not be representative, unless greater population is queried using these methods
Source: Deloitte analysis
What matters?
15
various techniques). Even stakeholder engage-ment that is highly inclusive and transparent does not automatically yield a robust way to synthesize the results and prioritize a variety of potentially material ESG topics based on their relative importance.
The same can be said of surveys, which are generally not well-suited to capturing fluid, complex, and uncertain issues such as sustain-ability because the method of questioning is more static. Survey results cannot yield a rela-tive ranking of ESG topics, because the scales are ordinal rather than numeric. Decision sci-ence methods, on the other hand, yield a single numeric scale for ranking and weighting ESG topics more rigorously and efficiently.
Using decision sciences to identify mate-rial ESG topics requires a multi-stakeholder panel—ideally composed of companies and their industry peers, employees, inves-tors, auditors, consumers, experts, and other important stakeholders. The panel member-ship should be revisited over time to help ensure comprehensive input on the full range of ESG topics a company can face. The crite-ria for determining ESG materiality should
be broadly applicable across multiple ESG topics and fairly constant (e.g., a time horizon of one to three years), although time frames should be adjusted to reflect an organiza-tion’s planning cycle. Ultimately, the criteria should more efficiently identify a smaller set of ESG topics that are considered material to a company from year to year. With several iterations of this approach, we would expect a stable (time-invariant) set of KPIs across all industry sectors or within an industry sector to emerge—ideally enabling the stan-dardization needed on ESG topic disclosure, even though valuation effects may not yet be fully understood.
By focusing only on those ESG topics most likely to be material, managers can limit the amount of effort expended on measure-ment and disclosure. They can also make more strategic decisions on and investments into real value creation instead of reacting to external pressures in an ad hoc manner, which to many investors could appear more like philanthropy than strengthening long-term business performance.
Disclosure of long-term business value
16

Recalibrating materiality
Running a business is not a popularity contest. Not all issues raised by stakehold-
ers are material to a business, though many may be relevant. However, managers put their assets and long-term growth prospects at risk by ignoring the interests of both internal and external stakeholders. Rather, managers need to demonstrate that they have considered each of their stakeholders in a transparent, unbi-ased, and robust manner with the understand-ing that not all stakeholder interests will be material to the business.
Materiality of ESG topics needs to be tied to potential valuation impacts on the busi-ness, even over the long term and when these impacts are uncertain. Otherwise, much of the ESG information that is disclosed will likely remain marginal to business and investment decisions. The selection of ESG metrics needs to be tied to corporate strategy, value drivers, organizational objectives, and the competitive environment—using a combination of quanti-tative and qualitative information. The chal-lenge faced by companies that disclose ESG information is that in many cases the valuation impact of ESG topics is not well understood and there are far too many ESG topics to choose from. The question we have raised here is: With so much uncertainty and complexity,
can companies successfully prioritize ESG top-ics to disclose only those that are material?
Certainly, the process would be much easier if we had a single scale to effectively balance a company’s needs with those of its stakehold-ers, and to prioritize ESG topics by their rela-tive likelihood to be material. Managers need a quantifiable manner in which to balance these needs and calibrate whether their com-pany is fully achieving its potential to create value. That scale is not yet in dollars and cents, so we have to look elsewhere.
Given today’s immature state of knowledge on ESG valuation impacts, decision science methods are a powerful tool that can help managers develop a single scale and structure some of the complexity involved in ESG top-ics, including the subjective biases of multiple stakeholders. Using these methods can aug-ment the credibility of ESG materiality deter-mination and can allow business leaders to better defend their decisions about ESG man-agement, investment, and disclosure on mat-ters of value to their myriad stakeholders. With these decision tools in hand, business leaders can shed more light on how superior perform-ers create long-term business value and sustain the underlying asset base—financial, human, manufactured, social, and natural.
What matters?
17

DECISION SCIENCE IN ACTION: WEIGHTING ENvIRONMENTAL IMPACTSIn May 2007, the National Institute of Standards and Technology (NIST) used the analytic hierarchy process to create a new weight set in version 4.0 of the BEES (Building for Environmental and Economic Sustainability) software as an alternative to older, more subjective weightings. The resulting set of weights for 13 environmental impact categories was used to generate a total score in life cycle assessments (LCA) of alternative building products (see figure 10). The panel—composed of LCA experts, users, and producers—was asked to evaluate one year’s worth of US flows (e.g., annual emissions, energy use, and water demand from the entire US economy) for each impact over three time horizons: short term (0–10 years), medium term (10–100 years), and long term (100+ years). For example, the panel evaluated the estimated long-term effect of a year’s greenhouse gas emissions on the environment and human health.
The result is a more objective ranking based on the concerns of multiple stakeholders without favoring any single stakeholder. Figure 10 shows how the NIST panel placed greatest weight on the impacts of today’s greenhouse gas emissions on global warming; however, experts and users were more concerned than producers. Facing such a disagreement, the decision maker can decide which stakeholder’s viewpoint to emphasize.
Where time horizons are important, as in long-term decisions, this aspect can be incorporated into the questions posed to the panel. Perceptions vary by time horizon (see figure 11). In the long-run view, this analysis indicates that global warming is more important than other environmental impacts. The panel was also asked to assess the relative importance of different time horizons, resulting in the largest weight placed on the long time horizon (45 percent), compared with the short term (24 percent).
Disclosure of long-term business value
18

Graphic: Deloitte University Press | DUPress.com
Source: Adapted from Thomas P. Gloria, Barbara C. Lippiatt, and Jennifer Cooper, “Life cycle impact assessment weights to support environmentally preferable purchasing in the United States,” Environmental Science Technology, 41, no. 21 (2007): pp. 7551-7557.
Figure 10. Weights by stakeholder group
Weighting factor (percent)
All
Producer
User
Expert
0
10
20
30
40
50
60
Global
warming
Fossi
l fuel
deple
tion
Criteria
air p
ollut
ants
Wate
r intak
e
Cance
rous
effec
ts
Ecolo
gical
toxic
ity
Eutro
phica
tion
Land
use
Nonca
ncero
us ef
fects
Smog
form
ation
Indoo
r air q
uality
Acidific
ation
Ozone
deple
tion
Graphic: Deloitte University Press | DUPress.com
Source: Adapted from Thomas P. Gloria, Barbara C. Lippiatt, and Jennifer Cooper, “Life cycle impact assessment weights to support environmentally preferable purchasing in the United States,” Environmental Science Technology, 41, no. 21 (2007): pp. 7551-7557.
Figure 11. Weights by time horizon
0
10
20
30
40
50
60
Global
warming
Fossi
l fuel
deple
tion
Criteria
air p
olluta
nts
Wate
r intak
e
Cance
rous
effec
ts
Ecolo
gical
toxic
ity
Eutro
phica
tion
Land
use
Nonca
ncero
us ef
fects
Smog
form
ation
Indoo
r air q
uality
Acidific
ation
Ozone
deple
tion
Weighting factor (percent)
All time horizons (100%)
Short (0-10 yrs) time horizon (24%)
Medium (10-100 yrs) time horizon (31%)
Long (100+ yrs) time horizon (45%)
What matters?
19

Endnotes
1. David P. Baron and Daniel Diermeier, “Strategic activism and nonmarket strat-egy,” Journal of Economics and Management Strategy 16, no. 3 (2007): pp. 599-634.
2. Sheila Goins and Thomas S. Gruca, “Un-derstanding competitive and contagion effects of layoff announcements,” Corporate Reputation Review 11 (2008): pp. 12-34.
3. DTTL global survey of 208 CFOs, 2011, http://www.deloitte.com/view/en_GX/global/4ca8b6140c0d2310VgnVCM1000001a56f00aRCRD.htm.
4. Christopher Ittner and David Larcker, “Non-financial performance measures: What works and what doesn’t,” Financial Times’ Mastering Management series, October 16, 2000.
5. Witold J. Heinsz, Sinziana Dorobantu, and Lite Nartey, “Spinning gold: The financial returns to external stakeholder engagement” (working paper, The Wharton School, University of Pennsylvania, June 30, 2011).
6. Brayden King, “A political mediation model of corporate response to social movement activism,” Administrative Science Quarterly 53, no. 3 (2008): pp. 395-421.
7. Deloitte Touche Tohmatsu Limited, “Deloitte survey: CFOs will need to take a more energetic role in embedding sustain-ability into business strategy,” press release, October 5, 2011, http://www.deloitte.com/view/en_GX/global/4ca8b6140c0d2310VgnVCM1000001a56f00aRCRD.htm.
8. KPMG, KPMG international survey of corpo-rate responsibility reporting 2011, 2011, http://www.kpmg.com/PT/pt/IssuesAndInsights/Documents/corporate-responsibility2011.pdf.
9. Steve Leffin (director, Global Sustain-ability, UPS), interview on ESG materiality determination.
10. International Integration Reporting Com-mittee (IIRC), Towards integrated reporting: communicating value in the 21st century, September, 2011, http://www.theiirc.org/the-integrated-reporting-discussion-paper/.
11. “Materiality in the context of the GRI reporting framework,” https://www.globalreporting.org/reporting/guidelines-online/Technical-Protocol/Pages/MaterialityInTheContex-tOfTheGRIReportingFramework.aspx; AA1000 Stakeholder Engagement Standard 2011, http://www.accountability.org/images/con-tent/5/4/542/AA1000SES%202010%20PRINT.pdf; Steve Lydenberg, Jean Rogers, and David Wood, “From transparency to performance:
Industry-based sustainability reporting on key issues,” Initiative for Responsible Investment, Harvard Hauser Center, 2010, http://hauser-center.org/iri/wp-content/uploads/2010/05/IRI_Transparency-to-Performance.pdf.
12. R. Edward Freeman, Strategic Management: A Stakeholder Approach (Boston: Pitman, 1984).
13. Erb Institute, “Coke in the cross-hairs,” July 2010, http://www.erb.umich.edu/case-studies/coke-crosshairs.pdf; “Indian water case pits village against a giant,” New York Times, July 22, 2005, http://www.nytimes.com/2005/07/21/world/asia/21iht-india.html; Environment news service, “Coca-Cola India will face tribunal on eco-damage claims,” February 2011, http://www.ens-newswire.com/ens/feb2011/2011-02-28-02.html; http://www.indiaresource.org/news/2011/1003.html; http://www.thehindu.com/opinion/op-ed/article408788.ece.
14. Canadian Institute of Chartered Accountants, Environmental, social and governance (ESG) issues in institutional investor decision mak-ing, 2010, http://www.cica.ca/publications/list-of-publications/manual/item41881.pdf.
15. KPMG, International Survey, 2011.16. Dan S. Dhaliwal, Oliver Zhen Li, Albert
Tsang, and Yong George Yang, “Voluntary nonfinancial disclosure and the cost of equity capital: The initiation of corporate social responsibility reporting,” The Accounting Review 86, no. 1 (2011): pp. 59-1,003.
17. Application level B applies to reports that disclose a minimum of 20 performance indicators, with at least one from each of the sections: economic, environmental, human rights, labor, society, and product responsibility. Application level C applies to reports that disclose a minimum of 10 performance indicators, with at least one from economic, environmental, and social.
18. The 2010 estimate of 1,862 companies that report using GRI may be on the low end.
19. Framework: CR, http://framework-llc.com/tag/materiality-analysis/.
20. Global Reporting Initiative, Techni-cal protocol—applying the report content principles, 2011, p. 9.
21. Peter Carey, Roger Simnett, and George Tanewski, “Voluntary demand for internal and external auditing by family businesses,” Auditing: A Journal of Practice & Theory 19 (2000): pp. 37-57; Dhaliwal et al., “Voluntary non-financial disclosure”; Roger Simnett,
Disclosure of long-term business value
20

Ann Vanstraelen, and Wai Fong Chua, “Assurance on sustainability reports: An international comparison,” The Account-ing Review 84, no. 3 (2009): 937-967.
22. May not sum to 100% due to rounding error.23. Deloitte continues to explore these concepts in
further research on materiality of ESG topics.24. Global Reporting Initiative, Draft report
content and materiality protocol, pg. 2.25. United States Securities and Exchange
Commission, Regulation S-K; United States Securities and Exchange Commission, 17 CFR Parts 211, 231 and 241 [Release Nos. 33-9106; 34-61469; FR-82]: Commission guidance regarding disclosure related to climate change, February 2, 2010.
26. http://safe.puma.com/us/en/2011/05/puma-announces-results-of-unprece-dented-environmental-profit-loss/.
27. Carla Rhianon et al., “The materiality concept in social and environmental reporting as-surance (SERA): Evolution and confusion?” Conference paper presented at 18th National Auditing Conference, Cardiff, April 2008.
28. Robert G. Eccles, Michael P. Krzus, and George Serafeim, “Market interest in nonfinancial information” (working paper 12-018, Har-vard Business School, September 2011).
29. Legitimacy, urgency, and power were proposed as attributes to identify key stakeholders by Ronald K. Mitchell, Bradley R. Agle, and Don-na J. Wood, “Toward a theory of stakeholder identification and salience: Defining the prin-ciple of who and what really counts,” Academy of Management Review 22, no. 4 (1997): pp. 853-886, and criticized as too subjective and suboptimal by Bjørn-Tore Blindheim and Oluf Langhelle, “A reinterpretation of the principles of sustainability: A pragmatic approach,” Cor-porate Social Responsibility and Environmental Management 17, no. 2 (2010): pp. 107-117.
30. According to GRI, topics include the organization’s economic, environmental, and social impacts considered “relevant” by stakeholders (the Stakeholder Inclusiveness principle) and the sustainability outcomes in absolute and relative terms (the Sustain-ability Context principle). Relevant topics should be prioritized in a systematic and replicable manner based on a materiality threshold for each aspect, and reporters need to be able to describe their decision-making process, including how underlying criteria are incorporated. See GRI Technical Protocol.
31. There are feedback loops and additional influential factors not shown here.
32. While these beliefs may appear inchoate and random, they are grounded in social and psychological constructs that have
been identified by behavioral scientists. We propose that for each ESG topic, stakeholders will defend a particular—possibly quantifi-able—reference point that defines the threshold between responsible and irresponsible corporate behavior and whether a company’s strategy reduces or increases the likelihood of financially material stakeholder action. Deloitte continues to explore these issues.
33. The New York Times (December 14, 2011) reported that Intel announced that its fourth-quarter revenue would be $13.4 billion to $14 billion, down from a previous forecast of $14.2 billion to $15.2 billion, because of supply shortages of hard disk drives, as a result of flood damage to factories in Thailand. Shares of Intel lost 4 percent to close at $24.
34. W. Richard Sherman and Lauren DiGi-ulio, “The second round of G3 reports: Is triple bottom line reporting becoming more comparable?,” Journal of Business & Economics Research, Vol 8(9), pp. 59-77; W.R. Sher-man, “Making triple bottom line reporting comparable: Adoption of the G3 framework,” presented at 2009 Oxford Business & Econom-ics Conference, Oxford, UK; W.R. Sherman, “The Global Reporting Initiative: What value is added?,” International Business and Economics Journal 8, no. 5 (2008), pp. 9-21.
35. Leeds University, Euromed Manage-ment School, November 2011.
36. Bloomberg’s ESG team further distinguishes between the presence of a policy which is (Y) or is not (N) supported by quantita-tive data. Across all the policy variables for this sample we find that 45% are Y, 39% are N, and 16% are missing.
37. Ioannis Ioannou and George Serafeim, “The consequences of mandatory corpo-rate sustainability reporting” (working paper 11-100, Harvard Business School, March 2011, revised May 2012).
38. Countries that have adopted laws and regula-tions that mandate sustainability reporting include Australia, France, Italy, Malaysia, Neth-erlands, Sweden, Denmark, and South Africa. Mandated reporting of environmental perfor-mance for compliance purposes has been es-tablished in most countries for several decades.
39. Caroline Flammer, “Corporate social responsi-bility and shareholder value: The environmen-tal consciousness of investors” (working paper, MIT Sloan School of Management, July 2011).
40. Deloitte, Five practices: Improving capital budgeting, 2009, http://www.deloitte.com/assets/Dcom-UnitedStates/Local%20Assets/Documents/Idea%20Labs%20Charles%20Alsdorf%20-%20Capital%20Budget%20II%20-%20Final%2007072009.pdf.
What matters?
21

About Deloitte University Press Deloitte University Press publishes original articles, reports and periodicals that provide insights for businesses, the public sector and NGOs. Our goal is to draw upon research and experience from throughout our professional services organization, and that of coauthors in academia and business, to advance the conversation on a broad spectrum of topics of interest to executives and government leaders.
Deloitte University Press is an imprint of Deloitte Development LLC.
This publication contains general information only, and none of Deloitte Touche Tohmatsu Limited, its member firms, or its and their affiliates are, by means of this publication, rendering accounting, business, financial, investment, legal, tax, or other professional advice or services. This publication is not a substitute for such professional advice or services, nor should it be used as a basis for any decision or action that may affect your finances or your business. Before making any decision or taking any action that may affect your finances or your business, you should consult a qualified professional adviser.
None of Deloitte Touche Tohmatsu Limited, its member firms, or its and their respective affiliates shall be responsible for any loss whatsoever sustained by any person who relies on this publication.
About Deloitte Deloitte refers to one or more of Deloitte Touche Tohmatsu Limited, a UK private company limited by guarantee, and its network of member firms, each of which is a legally separate and independent entity. Please see www.deloitte.com/about for a detailed description of the legal structure of Deloitte Touche Tohmatsu Limited and its member firms. Please see www.deloitte.com/us/about for a detailed description of the legal structure of Deloitte LLP and its subsidiaries. Certain services may not be available to attest clients under the rules and regulations of public accounting.
Copyright © 2013 Deloitte Development LLC. All rights reserved. Member of Deloitte Touche Tohmatsu Limited
Follow @DU_Press
Sign up for Deloitte University Press updates at DUPress.com.


![[David i. bertocci]_leadership_in_organizations_t(book_fi.org)](https://img.pdfslide.net/doc/110x75/55acb6521a28ab095a8b481c/david-i-bertoccileadershipinorganizationstbookfiorg.jpg)