Embed Size (px)
Citation preview

Disclosure Report
For the Twelve Months Ended June 30, 2018
Contacts: Cecelia B. Moore, MHA, CPA, CHFP
Chief Financial Officer & Treasurer
Vanderbilt University Medical Center
3319 West End Avenue
Nashville, TN 37203
(Phone) (615) 322‐0084
Scott T. Phillips, CPA Vice President & Controller
Vanderbilt University Medical Center
3319 West End Avenue
Nashville, TN 37203
(Phone) (615) 875‐9078
www.mc.vanderbilt.edu

Disclosure Report for June 30, 2018
VANDERBILT UNIVERSITY MEDICAL CENTER
NOTICE relating to:
THE HEALTH AND EDUCATIONAL FACILITIES BOARD OF THE
METROPOLITAN GOVERNMENT OF NASHVILLE AND DAVIDSON COUNTY,
TENNESSEE REVENUE BONDS (VANDERBILT UNIVERSITY MEDICAL
CENTER) SERIES 2016A
THE HEALTH AND EDUCATIONAL FACILITIES BOARD OF THE
METROPOLITAN GOVERNMENT OF NASHVILLE AND DAVIDSON COUNTY,
TENNESSEE TAXABLE REVENUE BONDS (VANDERBILT UNIVERSITY MEDICAL
CENTER) SERIES 2016B
THE HEALTH AND EDUCATIONAL FACILITIES BOARD OF THE
METROPOLITAN GOVERNMENT OF NASHVILLE AND DAVIDSON COUNTY, TENNESSEE TAXABLE REVENUE NOTE (VANDERBILT UNIVERSITY MEDICAL
CENTER) SERIES 2016D
THE HEALTH AND EDUCATIONAL FACILITIES BOARD OF THE
METROPOLITAN GOVERNMENT OF NASHVILLE AND DAVIDSON COUNTY,
TENNESSEE REVENUE BONDS (VANDERBILT UNIVERSITY MEDICAL
CENTER) SERIES 2017A

Disclosure Report for June 30, 2018
CUSIP Nos: 592041WC7, 592041WD5, 592041WE3, 592041WF0, 592041WG8, 592041WH6, 592041WJ2, 592041XC6, 592041YB7, 592041YC5
THE REMAINDER OF THIS PAGE WAS INTENTIONALLY LEFT BLANK

Disclosure Report for June 30, 2018
- 1 -
Table of Contents
Page Organization 3-4 Summary of Operating and Utilization Data 5-8
Summary of Financial Data 9-14 Management Discussion and Analysis 15-16 Consolidated Balance Sheet at June 30, 2018 (Unaudited)
and June 30, 2017 17
Consolidated Statement of Operations - For the Twelve Months ended June 30, 2018 and 2017 (Unaudited) 18
Consolidated Statement of Changes in Net Assets -
For the Twelve Months ended June 30, 2018 and 2017 (Unaudited) 19
Consolidated Statement of Cash Flows - For the Twelve Months ended June 30, 2018 and 2017 (Unaudited) 20

Disclosure Report for June 30, 2018
- 2 -
ATTENTION
This document is marked with a dated date of June 30, 2018, and reflects information only as of that date. Readers are cautioned not to assume that any information has been updated beyond the dated date except as to any portion of the document that expressly states that it constitutes an update concerning specific recent events occurring after the dated date of the document. Any information contained in the portion of the document indicated to concern recent events speaks only as of its date. We expressly disclaim any duty to provide an update of any information contained in this document.
The information contained in this document may include “forward looking statements” by using forward looking words such as “may,” “will,” “should,” “expects,” “believes,” “anticipates,” “estimates,” or others. You are cautioned that forward looking statements are subject to a variety of uncertainties that could cause actual results to differ from the projected results. Those risks and uncertainties include general economic and business conditions, receipt of funding grants, and various other factors which are beyond our control.
Because we cannot predict all factors that may affect future decisions, actions, events, or financial circumstances, what actually happens may be different from what we include in forward looking statements.

- 3 -
ORGANIZATION
Vanderbilt University Medical Center (“VUMC”) is a Tennessee not-for-profit corporation incorporated in March of 2015 to operate an academic medical center including a comprehensive research, teaching, and patient care health system (the “Medical Center”). Until April 29, 2016, the Medical Center operated as a unit within Vanderbilt University (“the University” or “VU”), as a part of the University’s administrative structure, with the same governing board, legal, financial, and other shared services.
VUMC began operations effective April 30, 2016, following the closing of the sale of the Medical Center by the University (the “Acquisition”). VUMC owns and operates three hospitals primarily located on the main campus of the University in Nashville, Tennessee: Vanderbilt University Adult Hospital (“VUAH”), Monroe Carell Junior Children’s Hospital at Vanderbilt (“MCJCHV”), and Vanderbilt Psychiatric Hospital (“VPH”). In addition, VUMC partially owns Vanderbilt Stallworth Rehabilitation Hospital (“VSRH”), also located on the main campus of the University, through a joint venture with HealthSouth Corp. in which VUMC holds a 50% interest, which includes a 1% interest held by Vanderbilt Health Services, LLC, (“VHS”), a VUMC wholly owned subsidiary. VUAH, MCJCHV, and VPH are licensed for 1,051 beds, and VSRH is licensed for 80 beds.
VUMC consists of two major operating divisions and an administrative overhead division. The operating divisions include the Clinical Enterprise and Academic Enterprise divisions. The administrative overhead division is referred to as Medical Center Administration (“MCA”).
The Clinical Enterprise division includes the professional clinical practice revenues and related expenses of the Vanderbilt Medical Group (“VMG”), and technical revenues and associated expenses for the operation of VUMC’s hospitals and clinic facilities, including VUAH, MCJCHV, and VPH. The Clinical Enterprise also includes VHS.
VUAH is a quaternary care teaching hospital licensed for 692 acute care and specialty beds. VUAH, a Level I trauma center, provides advanced patient care and serves as a key site for medical education and clinical research conducted by physician faculty. VUAH includes a comprehensive burn center, the Vanderbilt Transplant Center, the Vanderbilt Heart and Vascular Institute, and the Vanderbilt Ingram Cancer Center.
MCJCHV is a pediatric quaternary care teaching hospital licensed for 129 acute and specialty beds, 42 pediatric intensive care beds, and 96 neonatal intensive care beds. MCJCHV is the region’s only full-service pediatric hospital, with over 30 pediatric specialties. MCJCHV serves as a site for medical education and clinical research conducted by pediatric physician faculty, houses the only Level IV neonatal intensive care center and the only Level 1 pediatric trauma center within the region, and is a regional referral center for extracorporeal membrane oxygenation (heart and lung failure).
VPH is a psychiatric hospital licensed for 92 beds and provides both inpatient and outpatient partial hospitalization psychiatric services to both adult and adolescent patients. Also, VPH provides psychiatric assessment services and neuromodulation procedures through electroconvulsive therapy and transcranial magnetic stimulation.
The VMG is the practice group of physicians and advanced practice clinicians employed by VUMC, most of whom have faculty appointments from the University, who perform billable professional medical services. The VMG is not a separate legal entity. The VMG has a board which consists of the VUMC clinical service chiefs, who also serve as clinical department chairs. Under the oversight of VUMC executive leadership, the VMG sets professional practice standards, bylaws, policies, and procedures. VUMC bills for services rendered by

- 4 -
the VMG clinicians in both inpatient and outpatient locations. Collected fees derive a component of each VMG clinician’s compensation.
The VMG includes nationally recognized physicians whose expertise spans the spectrum from primary care to the most specialized quaternary discipline. The entire clinical faculty is “board certified” or eligible for board certification. All staff members are re-credentialed every two years by the National Committee for Quality Assurance standards. All specialties and subspecialties currently recognized by the various national specialty boards are represented on the clinical faculty.
VHS serves as a holding company for 15 health care related subsidiaries and joint ventures owned with various entities, including, but not limited to, VSRH and the Vanderbilt Health Affiliated Network (“VHAN”). VHS operations primarily consist of community physician practices, walk-in and retail health clinics, imaging services, outpatient surgery centers, radiation oncology centers, a home health care agency, a home infusion and respiratory service, an affiliated health network, accountable care organizations, and a rehabilitation hospital. These subsidiaries include clinics managed in multiple outpatient locations throughout middle Tennessee and southwestern Kentucky.
A holding company that includes four limited liability subsidiaries which support various business to business health care activities in order to improve the quality, affordability and availability of health care services. These subsidiaries include business focused on pharmacy, supply chain, and consulting services.
The Academic Enterprise division includes all clinically-related research, research-support activities, and faculty endeavors supporting post-graduate training programs. A significant funding source for VUMC’s research has historically been the federal government. Federal funding is received from the Department of Health and Human Services, the National Institutes of Health, the Department of Defense, NASA, and other federal agencies. Sponsored research awards, including multiple-year grants and contracts from government sources, foundations, associations, and corporations signify future research commitments. Also, core activities supporting research, including advanced computing and grant administration, are included in this division.
As mentioned above and throughout this document, VUMC acquired the Medical Center and its operations from the University in the Acquisition. For the purpose of funding the Acquisition, VUMC entered into certain debt agreements. Certain of these debt agreements contain required disclosures which outline annual and quarterly reporting requirements. In addition, certain of these debt agreements require notices of the occurrence of significant events which include but are not limited to delinquencies, bond calls, rating changes, bankruptcies, and mergers or acquisitions.
The VUMC fiscal year end is June 30. The information contained in this document represents the unaudited consolidated results of operations of VUMC as of and for the twelve months ended June 30, 2018.

- 5 -
SUMMARY OF OPERATING AND UTILIZATION DATA
Licensed Beds
As of June 30, 2018 VUMC’s facilities have 1,051 beds approved for operation and fully staffed, with 80 operating rooms. As of June 30, 2017 VUMC’s facilities had 1,025 beds approved for operation, of which 1,011 were fully staffed, with 80 operating rooms. These beds are primarily located at VUAH, MCJCHV and VPH. A fourth hospital, VSRH, is operated within a separate joint venture entity, which is currently owned 50% by VUMC. Counting VSRH beds, managed beds at Williamson Medical Center Inpatient Children’s Unit, and operated observation beds and bassinet beds, total beds as of June 30, 2018 and 2017, equates to 1,275 and 1,242, respectively.
VUMC Beds (Licensed, Observation, JV, Managed) Licensed Beds 2018 2017
Licensed-Bed Category Type Adult Medical Surgical 636 614
Adult Obstetric 50 50
Adult Clinical Research Center 6 6
Pediatric Medical/Surgical 129 129
Pediatric Neonatal Intensive Care 96 96
Pediatric Intensive Care 42 42
Psychiatric Care 92 88
Total Licensed Beds as of June 30, 2018 and 2017 1,051 1,025
Observation, JV, and Managed Beds and Bassinets
Current Observation/Extended Recovery Beds 93 86 Current Bassinets 35 35
Stallworth Rehabilitation Hospital Beds (JV)(1) 80 80
MCJCHV at Williamson Medical Center Inpatient and Observation Unit (Managed)(2) 16 16
Total Observation, JV, and Managed Beds and Bassinets
as of June 30, 2018 and 2017 224 217
Total Licensed, Observation, JV, and Managed Beds and Bassinets
as of June 30, 2018 and 2017 1,275 1,242
(1) Represents 80 beds in joint venture with VSRH. (2) Represents 12 licensed beds and four observation beds managed by VUMC with Williamson Medical Center, Franklin, TN.
VUMC Research Revenues
VUMC receives revenues from research grants which are both federally and non-federally sponsored. The Department of Health and Human Services, the National Institutes of Health, the Department of Defense, NASA, and other federal agencies supported over 74% and 72% of the research expenditures conducted by VUMC as of June 30, 2018 and 2017, respectively. The breakdown of direct research revenues is as follows for the twelve months ended June 30, 2018 and 2017 ($ in thousands):
Source 2018 2017
Federal $ 288,535 $ 239,925 Non-Federal 101,932 93,762 Total $ 390,467 $ 333,687

- 6 -
Capital Cash Flows
Capital expenditures for the twelve months ended June 30, 2018 and 2017, of $193 million and $159 million, respectively, primarily included construction in progress and internal use software costs.
Utilization
VUMC’s overall functional occupancy rate was 94.2% and 92.8% during the twelve months ended June 30, 2018 and 2017, respectively, (functional occupancy rate calculated as inpatient days plus observation days in inpatient units divided by total licensed beds, less research, labor & delivery, double rooms used as singles, and 0 and 14 beds that are currently out of service for those periods, respectively). The average number of inpatients in the hospital at midnight census was 911 and 884 at June 31, 2018 and 2017, respectively. Thus, VUMC has continued to operate at or above the theoretical optimal occupancy of 85% when total utilization of capacity is measured. Utilization statistics of the hospitals and clinics for the twelve months ended June 30, 2018 and 2017, are as follows:
2018 2017
Licensed beds(1) 1,051 1,025 Hospital inpatient days(2) 332,665 322,747
Hospital discharges 61,381 61,263 Average length of stay in days(2) 5.4 5.3 Average occupancy level (licensed beds)(2)(3)
86.7% 86.3% Surgical operations(4) 56,860 59,241 Ambulatory visits(5) 2,303,072 2,273,943 Emergency visits 116,652 123,026
(1) Excludes nursery bassinets and 80 joint venture beds at Vanderbilt-Stallworth Rehabilitation Hospital. (2) Includes nursery and psychiatric hospital; does not include the observation patients. (3) Average occupancy level calculated as inpatient days excluding observation patients divided by total licensed beds multiplied by the number
of days in the period. (4) Excludes surgical operations performed by VUMC- employed physicians at separate surgery centers that are partially owned by a VUMC
subsidiary. (5) Includes visits related to VHS joint ventures.

- 7 -
VUMC Inpatient Acuity
Across all inpatients, VUMC’s inpatient acuity is measured by case mix index (“CMI”). VUMC’s total CMI and CMI for Medicare patients for the twelve months ended June 30, 2018 and 2017, are presented below:
2018 2017 Total CMI(1) 2.16 2.16 Medicare CMI(1) 2.37 2.36
(1) Excludes normal newborns.
During the twelve months ended June 30, 2018 and 2017, ambulatory visits at the Medical Center totaled 2,021,617 and 2,038,397, respectively (excluding ambulatory visits from VHS joint ventures). While the majority of the VMG adult and children’s ambulatory practice is located in VUAH on the main campus, VUMC health care services are offered outside the main campus, with approximately 48% of outpatient visits at off-campus locations during both periods.
VUMC Payor Mix
The Medical Center received payment on behalf of most of its patients from a number of third parties, including Blue Cross and other private insurers, the federal government through Medicare, and the federal and state governments through Medicaid. TennCare, the State’s managed care plan operating under a Section 1115 Medicaid demonstration waiver from the federal government, provides the majority of Medicaid revenues. The remaining Medicaid revenues are from Medicaid patients who live outside of the State. Blue Cross, one of VUMC’s largest payors represented 19% and 21% of total gross patient service revenue (based on total gross patient service revenue, including professional fee revenue) for the twelve months ended June 30, 2018 and 2017, respectively.
The revenues attributable to Blue Cross are presented in the commercial/managed care category in the following table, which sets forth the sources of gross amounts of patient service revenue as well as gross amounts of patient service revenue net of contractual allowances for the twelve months ended June 30, 2018 and 2017:
Payor Mix(2) 06/30/18
Gross
06/30/18 Net
Commercial/Managed Care(1) 46.7% 63.3% Medicare/Managed Medicare 32.2% 23.0% Tenncare/Medicaid 16.8% 12.4% Uninsured (self-pay) 4.3% 1.3%
Total 100.0% 100.0%
(1) Commercial includes commercial indemnity and other patient service programs provided under contractual arrangements. (2) Percentages based on total net patient service revenue, including professional fee revenue.

- 8 -
Payor Mix(2) 06/30/17
Gross06/30/17
Net
Commercial/Managed Care(1) 47.0% 63.5% Medicare/Managed Medicare 31.2% 22.8% Tenncare/Medicaid 18.0% 12.2% Uninsured (self-pay) 3.8% 1.5%
Total 100.0% 100.0%
(1) Commercial includes commercial indemnity and other patient service programs provided under contractual arrangements. (2) Percentages based on total net patient service revenue, including professional fee revenue.
VUMC’s major commercial managed care contracts are multi-year agreements, typically three to four years with automatic annual escalators. Commercial contracts reimburse the facility on case rates with stop loss provisions for inpatient medical/surgical services and fee schedules for outpatient services. VPH is reimbursed on per diems. VUMC has no agreements based on full risk or capitation reimbursement. Three major commercial contracts utilize performance on quality metrics as a basis for a portion of the annual escalators. As of June 30, 2018, one existing Medical Center commercial contract has three episode-based payment bundles effective July 1, 2015, with upside risk only. Over 81% of VUMC’s payments for healthcare services are covered under contracted rates. Termination dates for the most material contracts are presented in the below table.
The following table details payments received from VUMC’s largest commercial contracts as a percentage of total net patient revenue for the twelve months ended June 30, 2018 and 2017, as well as the respective contract renewal date.
Commercial Contract Payments as a Percentage of Total Net Patient Revenue
Total Payments as of 06/30/18(1)
Total Payments as of 06/30/17(1)
Termination Dates
Aetna 7.7% 6.4% 12/31/2020 BlueCross(2)
29.8% 27.3% 12/31/2019 CIGNA(2) 8.2% 7.1% 9/30/2018 Humana(2) 0.7% 0.9% 10/31/2018 United 8.8% 6.5% 7/31/2021
Total as a % of total net patient revenue 55.2% 48.2%
(1) Represents cash payments received for discharges that occurred during the twelve months ended June 30, 2018 and 2017, respectively. Excludesprofessional fee billing.
(2) If not renegotiated, contract automatically renews indefinitely. Note: Does not include behavioral or dental service contracts.
Medicare Advantage contracts represented approximately $150 and $141 million in net revenue or 7.0% and 6.6% of Hospital and Clinic net revenue for the twelve months ended June 30, 2018 and 2017, respectively, and have termination dates ranging from October 31, 2018 through July 31, 2021.

- 9 -
SUMMARY OF FINANCIAL DATA
Cash and Investments
The VUMC Board of Directors (the “Board”) approves the investment policy, while VUMC management is responsible for appointing and removing investment managers, monitoring asset allocation within the policy guidelines, and other ongoing oversight of the investment portfolio. VUMC utilizes external investment advisors to provide professional investment analysis and guidance to assist in evaluating the performance of the funds. As the risk profile of VUMC matures, VUMC management anticipates undertaking modest additional risk, through asset allocation adjustments, in order to improve long-term investment returns. The table below summarizes VUMC’s investment allocation as of June 30, 2018, including working capital.
Summary of Cash and Investments Asset Allocation As of June 30, 2018
Working Capital
Unrestricted and Restricted Investments(1)
Self-Insurance
Trust Total
Cash & Cash Equivalents 64% 3% 0% 43% Short-Term Investments 17% 0% 0% 12% Equity Investments 0% 33% 46% 12% Hedged Equity Investments 0% 10% 14% 4% Fixed Income Investments 10% 26% 23% 15% Hedged Debt Investments 0% 18% 9% 5% Other Marketable Alternatives(2) 0% 5% 6% 2% Non-Marketable Investments 0% 0% 0% 0% Project Funds at Bond Trustee 4% 0% 0% 3% Restricted Cash & Cash Equivalents 5% 3% 2% 3% Split Interest Trusts 0% 2% 0% 1%
100% 100% 100% 100%
(1) Includes endowment funds of $26.8 million. (2) Includes REITs and commodities.

- 10 -
The following table sets forth VUMC unrestricted cash and investments and days cash on hand as of June 30, 2018 and 2017. This financial information is provided for informational purposes only and is not necessarily, and should not be assumed to be, an indication of the results that will be achieved in the future ($ in thousands):
Summary of Unrestricted Cash and Cash Equivalents
FY 2018 FY 2017
Cash and cash equivalents(1) $ 495,942 $ 520,857 Less: restricted cash and cash equivalents included above (25,127) (20,444) Total unrestricted cash and cash equivalents 470,815 $ 500,413
Unrestricted investments(2) 488,119 310,929 Total unrestricted cash and investments 958,934 $ 811,342
Average daily operating expenses(3) $ 10,765 $ 9,955
Days cash on hand(4) 89.1 81.5
(1) Cash and cash equivalents, as reported on the unaudited balance sheet, are composed of assets that are or may be readily converted to cash.
(2) Unrestricted investments may be comprised of U.S. small, mid and larger capitalization stocks, international stocks, intermediate term fixed income securities, mutual funds, exchange traded funds, hedge funds, real estate and private equity and generally may be liquidated within four business days or less.
(3) Average daily operating expenses include all VUMC financial flows to the University excluding the principal payments on the Subordinated Promissory Note to VU.
(4) Unrestricted cash and investments divided by average daily operating expenses (excluding depreciation and amortization) for the three months then ended.

- 11 -
Debt Service Coverage
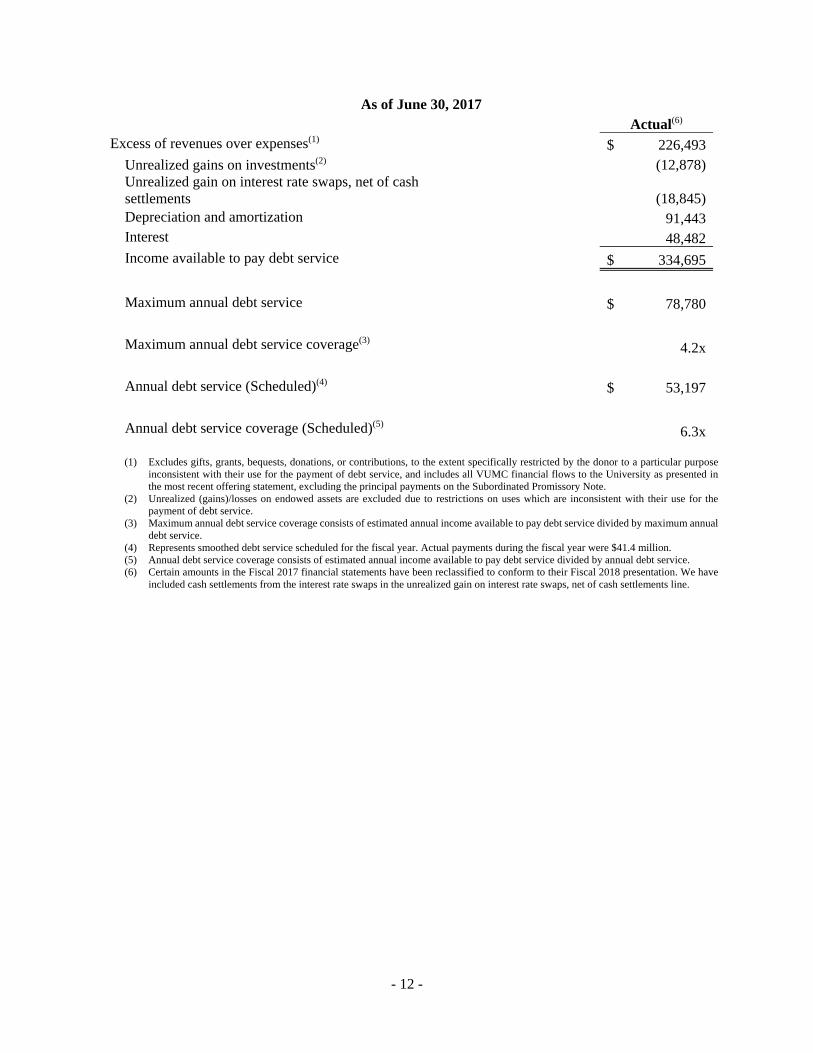
The following tables set forth, for the twelve months ended June 30, 2018 and 2017, VUMC’s income available for debt service, and indicates the extent to which such income available for debt service would provide coverage for maximum annual and annual debt service on all long-term debt ($ in thousands):
As of June 30, 2018
Actual Excess of revenues over expenses(1) $ 98,141
Unrealized losses on investments(2) 3,759
Unrealized gain on interest rate swaps, net of cash settlements
(6,379)
Depreciation and amortization 105,654
Interest 58,078
Income available to pay debt service $ 259,253
Maximum annual debt service $ 97,532
Maximum annual debt service coverage(3) 2.7x
Annual debt service (Scheduled)(4) $ 62,957
Annual debt service coverage (Scheduled)(5) 4.1x
(1) Excludes gifts, grants, bequests, donations, or contributions, to the extent specifically restricted by the donor to a particular purpose inconsistent with their use for the payment of debt service, and includes all VUMC financial flows to the University as presented in the most recent offering statement, excluding the principal payments on the Subordinated Promissory Note.
(2) Unrealized (gains)/losses on endowed assets are excluded due to restrictions on uses which are inconsistent with their use for the payment of debt service.
(3) Maximum annual debt service coverage consists of estimated annual income available to pay debt service divided by maximum annual debt service.
(4) Represents smoothed debt service scheduled for the fiscal year. Actual payments during the fiscal year were $58.2 million. (5) Annual debt service coverage consists of estimated annual income available to pay debt service divided by annual debt service.
- 12 -
As of June 30, 2017
Actual(6) Excess of revenues over expenses(1) $ 226,493
Unrealized gains on investments(2) (12,878)
Unrealized gain on interest rate swaps, net of cash settlements
(18,845)
Depreciation and amortization 91,443
Interest 48,482
Income available to pay debt service $ 334,695
Maximum annual debt service $ 78,780
Maximum annual debt service coverage(3) 4.2x
Annual debt service (Scheduled)(4) $ 53,197
Annual debt service coverage (Scheduled)(5) 6.3x
(1) Excludes gifts, grants, bequests, donations, or contributions, to the extent specifically restricted by the donor to a particular purpose inconsistent with their use for the payment of debt service, and includes all VUMC financial flows to the University as presented in the most recent offering statement, excluding the principal payments on the Subordinated Promissory Note.
(2) Unrealized (gains)/losses on endowed assets are excluded due to restrictions on uses which are inconsistent with their use for the payment of debt service.
(3) Maximum annual debt service coverage consists of estimated annual income available to pay debt service divided by maximum annual debt service.
(4) Represents smoothed debt service scheduled for the fiscal year. Actual payments during the fiscal year were $41.4 million. (5) Annual debt service coverage consists of estimated annual income available to pay debt service divided by annual debt service. (6) Certain amounts in the Fiscal 2017 financial statements have been reclassified to conform to their Fiscal 2018 presentation. We have
included cash settlements from the interest rate swaps in the unrealized gain on interest rate swaps, net of cash settlements line.

- 13 -
Capitalization Ratios
The following table provides VUMC’s capitalization ratios as of and for the twelve months ended June 30, 2018 and 2017, ($ in thousands):
FY 2018 FY 2017 Long-term debt(1) $ 1,428,888 $ 1,199,515
Unrestricted net assets 813,402 713,979 Total capitalization $ 2,242,290 $ 1,913,494 Ratio of long-term debt to capitalization (%) 63.7% 62.7% EBIDA $ 261,872 $ 371,301 Ratio debt to total EBIDA(2) 5.5x 3.2x Total unrestricted cash and investments $ 958,934 $ 811,342 Ratio cash to debt (%)(3) 67.1% 67.6%
(1) Total outstanding long-term debt, including current maturities, excluding the Subordinate Promissory Note to VU. (2) Total outstanding long-term debt divided by total EBIDA, which includes realized gains from sale of assets incurred in the normal course
of operations, investment income (all gains), unrestricted gifts or restricted gifts released from restrictions (spent on the purpose), unrealized gain or loss on interest rate swap, and equity earnings in unconsolidated organizations.
(3) Unrestricted cash and investments divided by long-term debt, which includes unrestricted cash and cash equivalents and unrestricted investments.
Interest Rate Exchange Agreements
VUMC uses interest rate exchange agreements as part of its debt portfolio management strategy. These agreements do not include collateral pledging requirements. Information regarding the current interest rate exchange agreements, including mandatory termination provisions, is as follows ($ in thousands):
Description
Notional Amount
Rate Paid
Rate Received (1)
Maturity
Fair Value
Fixed-payer interest rate agreement
$ 75,000
4.119%
68% LIBOR
4/29/2021
$ 26,881
Fixed-payer interest rate agreement
$ 75,000
4.179%
68% LIBOR
4/29/2023
27,325
$ 54,206
(1) Rate received represents 68% of 1 month LIBOR during each monthly settlement period.

- 14 -
Existing Lease Agreements
VUMC leases certain property and equipment under leases with terms ranging from two to twenty years. In addition, VUMC is the lessor in a 99 year ground lease with Vanderbilt University. VUMC classifies these leases as operating leases. The follow schedule represents our annual commitments of minimum rentals on non-cancelable operating leases by fiscal year ($ in thousands):
Equipment Property Ground Lease Total 2019 $ 28,143 $ 51,534 $ 19,020 $ 98,697 2020 21,230 49,477 19,020 89,727 2021 14,807 41,704 19,020 75,531 2022 11,447 32,857 19,020 63,324 2023 4,601 25,907 19,020 49,528 Thereafter 2,321 167,990 1,749,842 1,920,153 Total $ 82,549 $ 369,469 $ 1,844,942 $ 2,296,960

- 15 -
MANAGEMENT DISCUSSION AND ANALYSIS
During FY18, we planned for operating income reductions due to the implementation of our new electronic medical record (EMR) system. Our FY18 June YTD actual operating income of $56 million compares unfavorably to FY18 June YTD budgeted operating income of $91 million. FY18 June YTD actual operating income is $122 million below FY17 June YTD operating income.
We successfully completed our EMR implementation in November and we anticipate the new system will yield future efficiencies. However, in the year of implementation increased operating expenses related to implementation caused a reduction in operating income. The EMR implementation put pressure on clinical volumes in the post-live period although we have achieved net patient services revenue in excess of our budget, the implementation has muted procedural volumes.
FY18 YTD operating earnings before interest, depreciation and amortization (EBIDA) of $220 million was $98 million less than FY17 YTD operating EBIDA of $318 million. The decline in EBIDA was driven by a $286 million increase in operating expenses, excluding interest, depreciation and amortization, partially offset by a $188 million increase in operating revenue. FY18 YTD operating results of $56 million were $122 million less than FY17 YTD operating results of $178 million. The decrease in operating results is driven by the $98 million decrease in operating EBIDA and a $24 million increase in interest, depreciation and amortization. Interest, depreciation and amortization totaled $164 million for the current fiscal year-to-date period compared to $140 million in the prior year. Excess of revenues over expenses was $98 million which is $128 million less than FY17 YTD excess of revenues over expenses of $226 million. The decrease is due to the decrease in operating income discussed above in addition to a decrease of $7 million in non-operating income.
The primary drivers of the $7 million decrease in non-operating income were decreased favorable mark to market adjustments of the interest rate exchange agreements’ obligations, net of settlements, ($12 million), partially offset by an increase in investment income ($3 million) and an increase in gift income ($2 million). The decrease in the favorable mark to market adjustments of the interest rate exchange agreements obligation is due to the slowing of the increase in LIBOR compared to the prior year. The increase in gift income is due to the recognition of gift income when donor restrictions are met and the relative timing of meeting such restrictions. The positive investment income variance was driven by realized and unrealized gains due to favorable market performance and an increase in the amount of funds invested compared to the prior period.
Revenues
FY18 YTD operating revenue increased approximately $188 million, or 5%, to $4,091 million, from $3,904 million a year earlier. The primary driver of the increase in revenues was a $112 million, or 3%, increase in net patient service revenue to $3,448 million from $3,335 million a year earlier. The remaining increase is primarily driven by $73 million increase in academic and research revenue. The increase in academic and research revenue is driven by an increase in grant and contract revenue of $57 million and indirect cost recovery revenue of $16 million.

- 16 -
Expenses
FY18 YTD expense increased approximately $310 million, or 8%, to $4,035 million from $3,725 million a year earlier. The primary drivers of this increase were increases in salaries, wages and benefits ($147 million), services and other expense ($56 million), drug costs ($53 million), medical supplies ($10 million), non-medical supplies ($8 million), building maintenance and rent ($12 million), and interest, depreciation and amortization ($24 million). The increase in salaries, wages and benefits is primarily due to increased staffing to meet additional demand associated with higher net patient service revenue, research contracts, along with training costs and post-live ramp up related to our EMR system implementation. Services and other expense increase is mainly due to increased consulting, management fees, and contract labor ($37 million) primarily related to the EMR implementation combined with an increase in sub-contracts expense ($21 million), related to increased grant and contract revenue.
Balance Sheet / Cash Flow
FY18 YTD net assets increased by approximately $127 million due to excess of revenues over expenses, restricted contributions net of release, and additional endowments, including appreciation, of approximately $98 million, $11 million and $18 million, respectively. Cash decreased by approximately $25 million which was primarily due to $179 million of investment purchases, net of sales, $41 million of cash received that is restricted for the construction of long lived assets, and $193 million of construction of certain long-lived assets. These decreases in cash are partially offset by a $219 million debt issuance, net of repayments, and $20 million from the sale of property. The remaining changes in the balance sheet were primarily timing items such as increases in receivables due to the revenue-cycle components of the EMR implementation.
Conclusion
Although lower operating results were noted in FY 18 compared to prior year, we expected and planned for a decrease in our budget in conjunction with the EMR system conversion. We continue to monitor volumes and net patient services receivable balances during the post implementation period.

- 17 -
CONSOLIDATED BALANCE SHEET AS OF JUNE 30, 2018 AND 2017
($ in thousands) (Unaudited)
2018 2017AssetsCurrent
Cash and cash equivalents 495,942$ 520,857$ Current investments 134,467 133,977Patient accounts receivable, net of allowance for bad debts of $176.3 million and $130.5 million as of June 30, 2018 and 2017, respectively 479,869 374,686Estimated receivables under third-party programs - 12,642Grants and contracts receivable, net 57,748 67,249Inventories 72,636 67,478Other current assets 85,307 73,076
Total current assets 1,325,969 1,249,965
Noncurrent investments 266,701 94,412Noncurrent investments limited as to use 261,469 202,592Property, plant, and equipment, net 1,300,667 1,219,768Other noncurrent assets 36,215 34,593
Total assets 3,191,021$ 2,801,330$
Liabilities and Net AssetsCurrent
Current installments of long-term debt 5,774$ 5,753$ Accounts payable and other accrued expenses 270,154 272,641Estimated payables under third-party programs 72,947 37,072Accrued compensation and benefits 200,435 194,739Current portion of deferred revenue 37,303 39,353Current portion of medical malpractice self-insurance reserves 16,558 17,161
Total current liabilities 603,171 566,719
Long-term debt, net of current installments 1,512,698 1,288,346Fair value of interest rate exchange agreements 54,206 65,203Noncurrent portion of medical malpractice self-insurance reserves 57,520 54,373Noncurrent portion of deferred revenue 18,719 10,694Other noncurrent liabilities 16,740 15,093
Total liabilities 2,263,054 2,000,428
Net assetsUnrestricted net assets controlled by Vanderbilt University Medical Center 807,340 708,088Unrestricted net assets related to noncontrolling interests 6,062 5,891
Total unrestricted net assets 813,402 713,979
Temporarily restricted net assets 79,636 69,058Permanently restricted net assets 34,929 17,865
Total net assets 927,967 800,902
Total liabilities and net assets 3,191,021$ 2,801,330$
- 18 -
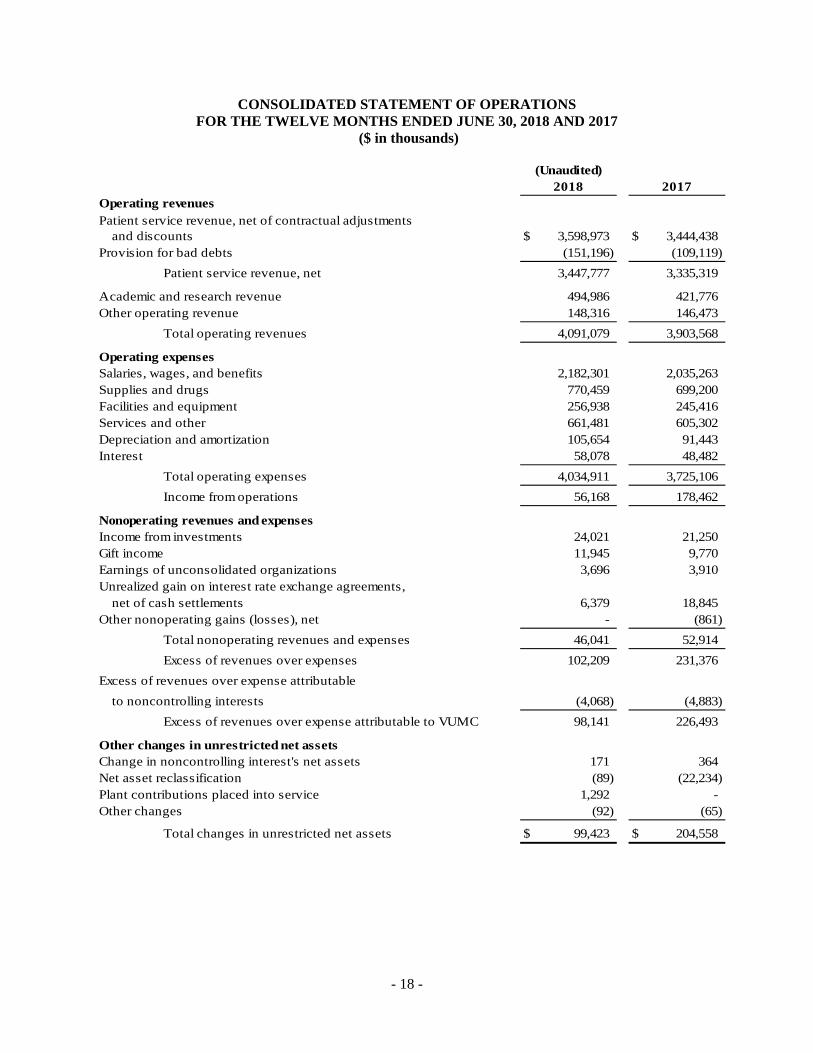
CONSOLIDATED STATEMENT OF OPERATIONS FOR THE TWELVE MONTHS ENDED JUNE 30, 2018 AND 2017
($ in thousands)
(Unaudited)2018 2017
Operating revenuesPatient service revenue, net of contractual adjustments
and discounts 3,598,973$ 3,444,438$ Provision for bad debts (151,196) (109,119)
Patient service revenue, net 3,447,777 3,335,319
Academic and research revenue 494,986 421,776Other operating revenue 148,316 146,473
Total operating revenues 4,091,079 3,903,568
Operating expensesSalaries, wages, and benefits 2,182,301 2,035,263Supplies and drugs 770,459 699,200Facilities and equipment 256,938 245,416Services and other 661,481 605,302Depreciation and amortization 105,654 91,443Interest 58,078 48,482
Total operating expenses 4,034,911 3,725,106
Income from operations 56,168 178,462
Nonoperating revenues and expensesIncome from investments 24,021 21,250Gift income 11,945 9,770Earnings of unconsolidated organizations 3,696 3,910Unrealized gain on interest rate exchange agreements,
net of cash settlements 6,379 18,845Other nonoperating gains (losses), net - (861)
Total nonoperating revenues and expenses 46,041 52,914
Excess of revenues over expenses 102,209 231,376
Excess of revenues over expense attributable
to noncontrolling interests (4,068) (4,883)
Excess of revenues over expense attributable to VUMC 98,141 226,493
Other changes in unrestricted net assetsChange in noncontrolling interest's net assets 171 364Net asset reclassification (89) (22,234)Plant contributions placed into service 1,292 -Other changes (92) (65)
Total changes in unrestricted net assets 99,423$ 204,558$

- 19 -
CONSOLIDATED STATEMENT OF CHANGES IN NET ASSETS FOR THE TWELVE MONTHS ENDED JUNE 30, 2018 AND 2017
($ in thousands)
(Unaudited)2018 2017
Unrestricted net assetsUnrestricted net assets at the beginning of the period 713,979$ 509,421$
Excess of revenue over expense 98,141 226,493Change in noncontrolling interest's net assets 171 364Net asset reclassification (89) (22,234)Plant contributions placed into service 1,292 -Other changes (92) (65)
Change in unrestricted net assets 99,423 204,558
Unrestricted net assets at the end of the period 813,402$ 713,979$
Temporarily restricted net assetsTemporarily restricted net assets at the beginning of the period 69,058$ 26,985$
Contributions 17,817 27,681Endowment appreciation 899 749Net assets released from restrictions (7,042) (6,114)Net asset reclassification 195 19,757Plant contributions released (1,292) -Other changes 1 -
Change in temporarily restricted net assets 10,578 42,073
Temporarily restricted net assets at the end
of the period 79,636$ 69,058$
Permanently restricted net assetsPermanently restricted net assets at the beginning of the period 17,865$ 6,769$
Contributions 17,170 8,619Net asset reclassification (106) 2,477
Change in permanently restricted net assets 17,064 11,096
Permanently restricted net assets at the end
of the period 34,929$ 17,865$
Total net assetsBeginning of the period 800,902$ 543,175$
Change in total net assets 127,065 257,727
End of the period 927,967$ 800,902$

- 20 -
CONSOLIDATED STATEMENT OF CASH FLOWS FOR THE TWELVE MONTHS ENDED JUNE 30, 2018 AND 2017
($ in thousands)
(Unaudited)2018 2017
Cash flows from operating activitiesChange in total net assets 127,065$ 257,727$ Adjustments to reconcile change in total net assets to net cash provided by operating activities
Depreciation and amortization 105,654 91,443Amortization of debt issuance costs, and original issue premium
and discount 518 (902)Provision for bad debts 151,196 109,119(Gain) loss on disposal of assets (7,686) 3,409Undistributed equity in earnings of equity method affiliates (2,144) (1,156)Net realized and unrealized gain on investments (10,954) (16,371)Purchases of trading securities (348,124) (312,072)Sales of trading securities 332,330 112,056Change in split-interest trusts (230) (963)Unrealized gain on interest rate exchange agreements (10,997) (24,333)Restricted contributions for endowments and property, plant,
and equipment (24,326) (17,991)(Decrease) increase in cash due to changes in
Patient accounts receivable (256,379) (144,582)Accounts payable and other accrued expenses (3,443) 49,612Other assets and other liabilities, net 61,149 279
Net cash provided by operating activities 113,629 105,275
Cash flows from investing activitiesPurchase of property, plant, and equipment (192,590) (158,729)Purchases of long-term securities (318,619) (59,552)Sales and maturities of long-term securities 155,141 52,237Proceeds on sale of property, plant, and equipment 20,394 -Change in restricted cash for property, plant, and equipment contributions (40,692) (9,371)
Net cash used in investing activities (376,366) (175,415)
Cash flows from financing activitiesProceeds from issuance of long-term debt 329,719 -Debt issuance costs (3,035) -Repayment of long-term debt (108,100) (4,583)Principal payments under capital lease obligations (1,191) (552)Change in bank overdrafts - (13,846)Restricted contributions for endowments and property, plant, and equipment 24,326 17,991Distributions to noncontrolling interests (3,897) (4,519)
Net cash provided by (used in) financing activities 237,822 (5,509)
Net change in cash and cash equivalents (24,915) (75,649)
Cash and cash equivalentsBeginning of the period 520,857 596,506
End of the period 495,942$ 520,857$


![Investor Presentation...[1] Market capitalization data as of February 18, 2020 [2] Twelve months ended November 30, 2019 (CAGR is for twelve months ended November 30, 2014 and November](https://img.pdfslide.net/doc/110x75/5ed0832f2a4fed5f4d34de65/investor-presentation-1-market-capitalization-data-as-of-february-18-2020.jpg)