Embed Size (px)
Citation preview

1

Disclosures
2
FORWARD-LOOKING STATEMENTS
This investor presentation contains forward-looking statements, as defined by federal securities laws, including statements about CapStar Financial Holdings, Inc. (“CapStar”) and its financial outlook and business environment. These statements are based on current expectations and are provided to assist in the understanding of our operations and future financial performance. Our operations and such performance involves risks and uncertainties, including but in no way limited to the effect of the COVID-19 pandemic, that may cause actual results to differ materially from those expressed or implied in any such statements. For a discussion of some of the risks and other factors that may cause such forward-looking statements to differ materially from actual results, please refer to CapStar’s filings with the Securities and Exchange Commission, including its 2019 Annual Report on Form 10-K under the sections entitled “Forward-Looking Statements” and “Item 1A Risk Factors.” Forward-looking statements speak only as of the date they are made, and except as otherwise required by applicable law, we undertake no obligation to update or revise forward-looking statements.
NON-GAAP MEASURES
This investor presentation includes financial information determined by methods other than in accordance with generally acceptedaccounting principles (“GAAP”). This financial information includes certain operating performance measures, which exclude merger-related and other charges that are not considered part of recurring operations. Such measures include: “Efficiency ratio – operating,” “Expenses – operating,” “Earnings per share – operating,” “Diluted earnings per share – operating,” “Tangible book value per share,” “Return on common equity – operating,” “Return on tangible common equity – operating,” “Return on assets – operating,” and “Tangible common equity to tangible assets.”
Management has included these non-GAAP measures because it believes these measures may provide useful supplemental information for evaluating CapStar’s underlying performance trends. Further, management uses these measures in managing and evaluating CapStar’s business and intends to refer to them in discussions about our operations and performance. Operating performance measures should be viewed in addition to, and not as an alternative to or substitute for, measures determined in accordance with GAAP, and are not necessarily comparable to non-GAAP measures that may be presented by other companies. To the extent applicable, reconciliations of these non-GAAP measures to the most directly comparable GAAP measures can be found in the ‘Non-GAAP Reconciliation Tables’ included in the exhibits to this presentation.
MARKET DATA
Market data used in this presentation has been obtained from government and independent industry sources and publications available to the public, sometimes with a subscription fee, as well as from research reports prepared for other purposes. Industry publications and surveys and forecasts generally state that the information contained therein has been obtained from sources believed to be reliable. The Company did not commission the preparation of any of the sources or publications referred to in this presentation. The Company has not independently verified the data obtained from these sources, and, although the Company believes such data to be reliable as of the dates presented, it could prove to be inaccurate. Forward-looking information obtained from these sources is subject to the same qualifications and the additional uncertainties regarding the other forward-looking statements in this presentation.

Year in Review
3

Accomplishments2019 Results
April 2020
4
JanuaryCapStar opens a newly remodeled financial center to serve our clients in the Brentwood market.
AprilCapStar successfully completes the systems conversion and rebranding of Athens Federal Community Bank locations in McMinn, Monroe, Bradley and Loudon counties.
MayTim Schools joins CapStar as the bank’s second President and CEO.
JuneThe Small Business Administration’s Office of Credit Risk Management grants CapStar Preferred Lender status, the highest status that a funding bank can hold in the SBA program.
CapStar receives a Top 5-Star rating from Bauer Financial for the second consecutive year.
JulyCapStar is recognized by The Tennessean as a 2019 Top Workplace.
SeptemberCapStar announces exit of Corsair Investments with sale of remaining stock (1,543,361 shares or 8.3% of the total number of fully diluted shares of common stock at the time), demonstrating demand for CapStar stock and increasing shareholder liquidity.
OctoberGreenwich Associates selects CapStar as a 2019 Greenwich CX Leader in US Business Banking for the second consecutive year.
December/January 2020CapStar announces expansion into the Knoxville market with the addition of five seasoned bankers and plans to open a financial center in Knox County in 2020.
CapStar announces agreement with FCB Corporation to merge with First National Bank of Manchester and The Bank of Waynesboro by adding financial centers in Cannon, Coffee, Rutherford, Wayne and Lawrence counties in 2020, increasing CapStar’s Middle Tennessee presence and expanding the bank’s footprint into West Tennessee.
$71
$207
$313
$430
$624 $626
$728
$844
$977 $1,022
$1,487
$1,588
$52
$200
$434
$621
$920 $879
$981 $1,038
$1,129 $1,120
$1,570
$1,729
$132
$279
$514
$711
$1,032 $1,009
$1,128 $1,207
$1,334 $1,344
$1,964 $2,037
2008 2009 2010 2011 2012 2013 2014 2015 2016 2017 2018 2019
2008 - 2019 Growth
Loans: CAGR: 33%
Deposits: CAGR: 38%
Assets: CAGR: 28%
History2019 Results
April 2020
5Dollars in millionsData as of 12/31 for each respective yearNote: loans inclusive of loans held for sale
February 2014Acquires assets
from Farmington Financial Group and
enters mortgage lending business
September 2016Holding
companyholds IPO
September 2016Tri-Net Team
Formed
July 2008CapStar Bank
opened for business
July 2012Acquires American
Security Bank & Trust
October 2018Closed Athens
Merger
May 2019Tim
Schools hired as
new CEO
January 2020Announced Knoxville
Team Liftout & FCB
Acquisition
January 2018SBA Team
Liftout
February 2016Holding
companyformed

Market Presence
6
2019 Results
April 2020

Financial Highlights2019 Results
April 2020
7
• Credit quality metrics and capital ratios remain a core strength
• Continued expansion in profitability metrics:
– PTPP/A +10 bps
– ROAA + 8bps
• Opportunity to improve NIM and efficiency ratio
• Double-digit EPS and BVPS growth
Operating Metrics (1) 2019 2018Fav /
(Unfav)
Soundness
Net Charge-Offs to Avg Loans 0.02% 0.39%
Non-Performing Assets/Assets 0.12% 0.16%
Allowance for Loan Losses to Total Loans 0.89% 0.85%
Tangible Common Equity/Tangible Assets 11.47% 10.39%
Total Risk Based Capital Ratio 13.45% 12.84%
Profitability
Net Interest Margin (tax equivalent basis) 3.55% 3.64%
Efficiency Ratio 64.49% 65.05%
Pretax Preprovision Income / Assets(2) 1.63% 1.53%
Return on Average Assets (ROAA) 1.21% 1.13%
Return on Average Equity (ROAE) 9.23% 9.82%
Return on Average Tangible Equity (ROATE) 11.14% 10.81%
Growth
Total Deposits (Avg) $1,671 $1,245 34.2%
Gross Loans and Leases (Avg) 1,452 1,135 27.9%
Total Assets (Avg) 2,007 1,529 31.3%
Pretax PreProvision Income 32.68 23.47 39.3%
Net Income 24.38 17.24 41.4%
Diluted EPS $1.31 $1.19 10.0%
Tangible Book Value per Share $12.45 $11.25 10.7%
(1) Operating results are non-GAAP financial measures that adjust GAAP reported net income and other metrics for certain income and expense items. See the non-GAAP reconciliation calculations included in the Appendix at the end of this presentation, which use a blended statutory income tax rate of 26.14% and exclude non-deductible one-time merger related items
(2) Pretax Preprovision Operating ROA calculated as ROA excluding the effect of income tax expense, provision expense and merger charges(3) Dollars in millions, except per share data

Historical Common Stock Performance2019 Results
8Source: S&P Global Market Intelligence
2019 Three-Year Stock Performance
2019 One-Year Stock Performance
CSTR (+13.0%)
KBW Regional Bank Index
(+20.4%)
S&P 500 (+28.9%)
(10.0%)
0.0%
10.0%
20.0%
30.0%
12/31/18 2/28/19 4/30/19 6/30/19 8/31/19 10/31/19 12/31/19
CSTR (+13.0%) KBW Regional Bank Index (+20.4%) S&P 500 (+28.9%)
CSTR (-24.2%)
KBW
Regional
Bank Index (-3.2%)
S&P 500 (+44.3%)
(50.0%)
(25.0%)
0.0%
25.0%
50.0%
12/30/16 6/30/17 12/31/17 6/30/18 12/31/18 6/30/19 12/31/19
CSTR (-24.2%) KBW Regional Bank Index (-3.2%) S&P 500 (+44.3%)

Looking Forward
9

Looking Forward
April 2020
10
As we move forward, CapStar has tremendous opportunities to continue to improve our performance.
Our priorities are:
1. Enhancing the level and consistency of our profitability
– Improving our net interest margin and its stability
– Implementing expense disciplines – proficient and frugal execution
– Eliminating prior credit “spikes”
2. Expanding and accelerating our growth opportunities
– Aggressively seeking to expand customer relationships in our existing markets
– Strategically hiring additional talented bankers in or around our service areas
– Actively pursuing acquisitions of well-managed, appropriately-priced banks
3. Improving the relative performance of our common stock
– Creating an accountable, owner-operator culture
– Reviewing company-wide incentive plans to align to shareholder performance

Knoxville Expansion StrategyLooking Forward
April 2020
11
• Announced our expansion into Knoxville in January 2020 with the hiring of five veteran, local bankers, capitalizing on our operations and growth in East Tennessee.
• Expansion will leverage CapStar’s 2018 investment of Athens Bancshares Corporation, a 90-year old institution with $500MM in assets and eight financial centers across East Tennessee.
• Experienced market executives and advisory board positioned to establish CapStar as a leading provider of financial services across the Knoxville metropolitan area.
• Our team aspires to have ~ $300MM in loan balances in 4 years and funding of at least 50% with local deposits.
– $91 million loan pipeline; closed $3.3 million
East Tennessee GrowthKnoxville is Tennessee’s third largest Combined Statistical Area (CSA) in terms of population size (1.1 million). It has recently been cited by U.S. New & World Report as one of the nation’s top 50 places to live and recognized by Forbes and Livability as one of the nation’s most recession resistant cities.
According to FDIC data as of June 30, 2019, 48 banks in the Knoxville CSA hold $22.7 billion in local deposits.

FCB Merger StrategyLooking Forward
April 2020
12
MergerKey Dates
Announced1Q20
FNBM & BOWShareholder Votes
April 30
Regulatory Approval
2Q20
Close2Q/3Q20
System Conversions
4Q20
Strategic Expansion
• Addition of two high-performing banking institutions, each with 115+ year histories
• Expands local banking efforts into fast-growing Rutherford County
• Provides added scale and operating efficiency
• Improves diversification, deposit/loan granularity and deposit/loan costs and yields
COVID-19 Response
13
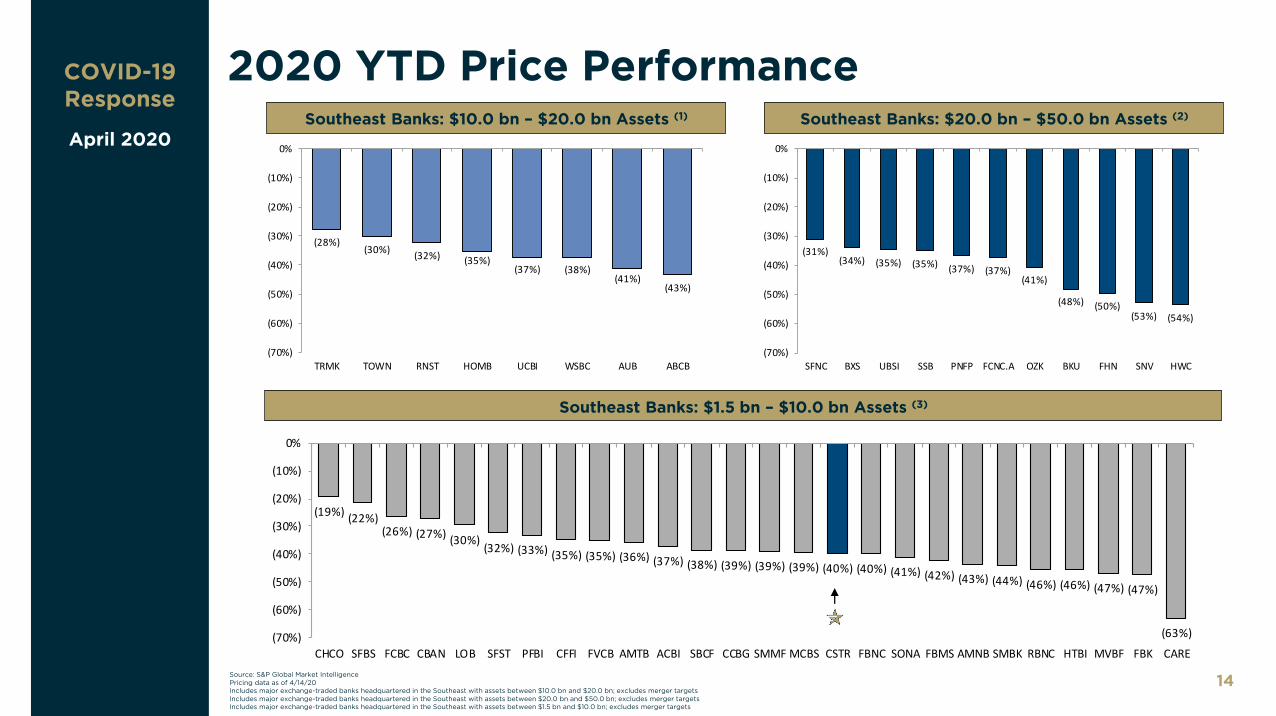
2020 YTD Price PerformanceCOVID-19 Response
April 2020
14
(19%)(22%)
(26%) (27%)(30%)
(32%) (33%) (35%) (35%) (36%) (37%) (38%) (39%) (39%) (39%) (40%) (40%) (41%) (42%) (43%) (44%) (46%) (46%) (47%) (47%)
(63%)(70%)
(60%)
(50%)
(40%)
(30%)
(20%)
(10%)
0%
CHCO SFBS FCBC CBAN LOB SFST PFBI CFFI FVCB AMTB ACBI SBCF CCBG SMMF MCBS CSTR FBNC SONA FBMS AMNB SMBK RBNC HTBI MVBF FBK CARE
Source: S&P Global Market IntelligencePricing data as of 4/14/20Includes major exchange-traded banks headquartered in the Southeast with assets between $10.0 bn and $20.0 bn; excludes merger targetsIncludes major exchange-traded banks headquartered in the Southeast with assets between $20.0 bn and $50.0 bn; excludes merger targetsIncludes major exchange-traded banks headquartered in the Southeast with assets between $1.5 bn and $10.0 bn; excludes merger targets
Southeast Banks: $1.5 bn – $10.0 bn Assets (3)
Southeast Banks: $10.0 bn – $20.0 bn Assets (1) Southeast Banks: $20.0 bn – $50.0 bn Assets (2)
(28%)(30%)
(32%) (35%)(37%) (38%)
(41%)(43%)
(70%)
(60%)
(50%)
(40%)
(30%)
(20%)
(10%)
0%
TRMK TOWN RNST HOMB UCBI WSBC AUB ABCB
(31%)(34%) (35%) (35%) (37%) (37%)
(41%)
(48%) (50%)(53%) (54%)
(70%)
(60%)
(50%)
(40%)
(30%)
(20%)
(10%)
0%
SFNC BXS UBSI SSB PNFP FCNC.A OZK BKU FHN SNV HWC

6.6x 6.9x 7.2x 7.4x 7.6x 7.9x 8.2x 8.3x9.3x 9.7x 9.8x 9.8x 10.2x 10.8x 11.1x 11.3x 12.0x 12.6x
14.1x 14.5x
20.3x 20.3x
0.0x
5.0x
10.0x
15.0x
20.0x
25.0x
SONA RBNC SMMF MCBS SFST FBMS CARE FBK CSTR FBNC SMBK SBCF AMNB ACBI SFBS FVCB MVBF HTBI CCBG CHCO LOB AMTB
Price / 2021 EPSCOVID-19 Response
April 2020
15
Southeast Banks: $1.5 bn – $10.0 bn Assets (3)
Source: S&P Global Market IntelligencePricing data as of 4/14/20Includes major exchange-traded banks headquartered in the Southeast with assets between $10.0 bn and $20.0 bn; excludes merger targetsIncludes major exchange-traded banks headquartered in the Southeast with assets between $20.0 bn and $50.0 bn; excludes merger targetsIncludes major exchange-traded banks headquartered in the Southeast with assets between $1.5 bn and $10.0 bn; excludes merger targets
Southeast Banks: $10.0 bn – $20.0 bn Assets (1) Southeast Banks: $20.0 bn – $50.0 bn Assets (2)
6.2x6.7x
7.2x 7.4x
8.4x 8.4x9.3x 9.7x
10.6x11.5x
0.0x
2.0x
4.0x
6.0x
8.0x
10.0x
12.0x
14.0x
16.0x
18.0x
FHN HWC SNV OZK PNFP BKU SFNC BXS SSB UBSI
7.2x
8.6x9.5x 9.8x 9.9x
10.7x
14.0x14.5x
0.0x
2.0x
4.0x
6.0x
8.0x
10.0x
12.0x
14.0x
16.0x
18.0x
ABCB HOMB UCBI AUB WSBC RNST TOWN TRMK

1Q20 Financial Results
April 2020
Internal Involvement
External Involvement
Board Involvement
Risk Committee
Pandemic Credit Committee
Crowe
Elliott Davis
Federal Reserve
FIS
Chair
Risk Committee
COVID-19Response
April 2020
Three-Step Mission
We’re in this Together
1. Provide care for our employees and clients
2. Protect the bank
3. Make CapStar shine in our communities
Engaged: March 16Meets: Daily at least five days per weekPurpose: Provide direction to daily activities
• Chief Operations and Technology Officer (Chair)
• President and CEO
• East Tennessee Market Leadership
• Middle Tennessee Market Leadership
• Mortgage Director
• Chief Credit Officer
• Chief Culture Officer
• Chief Financial Officer
• Chief Risk Officer
• Bank of Waynesboro CEO (Guest)
• First National Bank of Manchester CEO (Guest)
16Board
Pandemic Oversight Committee

Response InitiativesCOVID-19 Response
April 2020
17
Team Member Protection and Support
• Since March 16, have operated 100% remotely, other than financial centers, due to forward-thinking workforce investment in laptops, VPNs, and doubling of bandwidth
• Weekly all-employee calls for health/wellness check, teammate acknowledgments, remote work productivity assessment, response program and announcements/updates, etc.
• Redirected financial center service to drive-thru, digital access and by appointment only on March 23
71%
Remote In Financial Center (Essential)
71%
29%
Client Support and Assistance
• Market frontrunner in offering hassle-free 90-day full payment deferral to all CapStar borrowers• Suspended all credit agency reporting through June 30• Leader in providing SBA assistance, including facilitating the CARES Act Paycheck Protection
Program (PPP), for client and non-client small businesses across Tennessee
Community Investment
• To directly support the families and children in our communities most impacted by COVID-19, CapStar donated $30,000 to local food banks in our markets
• At an average cost of approximately $3.00 per meal, CapStar’s contribution will provide our neighbors over 10,000 meals during this challenging period

1Q20 Financial Results
April 2020
COVID-19 Response
April 2020
18
“Your SBA and PPP information is simple, informative and very well organized. We are even referring our clients to your website for information … this will definitely open the door for future business.”
Community Feedback“I am bragging all over town about you. I work with dozens of clients who use a variety of banks and CapStar has been first over the finish line for PPP loans. We love you and appreciate you so much.”
“While other small businesses are still working with their bank on what needs to be submitted, my business is already SBA approved and will be funded this week. Thank you, CapStar!”
“Once again, CapStar has proven their commitment of going above and beyond for their customers. My bankers worked 24/7 to accept, process and approve my PPP loan application in less than a week. During these times of uncertainty, you can certainly count on CapStar.”
“It is evident the CapStar team was working 110% to ensure that clients are well informed and receiving the assistance they need as my calls are picked up at all hours – including weekends. When the going got tough, it was great to know our local banking team was there for us.”
“One of Nashville’s homegrown lenders is extending a financial lifeline to clients as the coronavirus continues to put a crunch on companies.”
Nashville Business JournalMarch 25, 2020

Questions
19

Appendix: Non-GAAP Reconciliations
20

Non-GAAP Financial MeasuresAppendix
21
(Dollars in thousands, except per share information)
December 31, 2019
September 30, 2019
June 30, 2019
March 31, 2019
December 31, 2018
TANGIBLE EQUITY
Total Shareholders’ Equity $ 273,046 $ 268,082 $ 262,664 $ 259,751 $ 254,379
Less: Intangible Assets 44,393 44,790 45,199 45,618 46,048
Tangible Equity 228,653 223,292 217,465 214,133 208,331
TANGIBLE COMMON EQUITY
Tangible Equity $ 228,653 $ 223,292 $ 217,465 $ 214,133 $ 208,331
Less: Preferred Equity - - 9,000 9,000 9,000
Tangible Common Equity 228,653 223,292 208,465 205,133 199,331
TANGIBLE COMMON EQUITY TO TANGIBLE ASSETS
Tangible Common Equity $ 228,653 $ 223,292 $ 208,465 $ 205,133 $ 199,331
Total Assets 2,037,201 2,033,911 2,018,421 2,035,811 1,963,883
Less: Intangible Assets 44,393 44,790 45,199 45,618 46,048
Tangible Assets 1,992,808 1,989,121 1,973,223 1,990,193 1,917,835
Tangible Common Equity to Tangible Assets 11.47% 11.23% 10.56% 10.31% 10.39%

Non-GAAP Financial MeasuresAppendix
22
Twelve Months Ended Three Months Ended
(Dollars in thousands, except per share information)
December 31, 2019
December 31, 2018
December 31, 2019
September 30, 2019
June 30, 2019
March 31, 2019
December 31, 2018
RETURN ON AVERAGE TANGIBLE EQUITY (ROATE)
Total Average Shareholders’ Equity $ 264,124 $ 175,686 $ 271,568 $ 266,441 $ 261,197 $ 257,105 $ 245,811
Less: Average Intangible Assets 45,256 16,174 44,646 45,050 45,456 45,890 45,687
Average Tangible Equity 218,868 159,512 226,922 221,391 215,741 211,215 200,124
Net Income 22,422 9,655 5,421 6,466 5,756 4,780 (708)
Return on Average Tangible Equity (ROATE)
10.24% 6.05% 9.48% 11.59% 10.70% 9.18% -1.40%
RETURN ON AVERAGE TANGIBLE COMMON EQUITY (ROATCE)
Average Tangible Equity $ 218,868 $ 159,512 $ 226,922 $ 221,391 $ 215,741 $ 211,215 $ 200,124
Less: Preferred Equity 6,238 9,000 - 7,043 9,000 9,000 9,000
Average Tangible Common Equity 212,630 150,512 226,922 214,347 206,741 202,215 191,124
Net Income 22,422 9,655 5,421 6,466 5,756 4,780 (708)
Return on Average Tangible CommonEquity (ROATCE)
10.55% 6.41% 9.48% 11.97% 11.17% 9.59% -1.47%

Non-GAAP Financial MeasuresAppendix
23
(Dollars in thousands, except per share information)
December 31, 2019
September 30, 2019
June 30, 2019
March 31, 2019
December 31, 2018
TANGIBLE BOOK VALUE PER SHARE, REPORTED
Tangible Common Equity $ 228,653 $ 223,292 $ 208,465 $ 205,133 $ 199,331
Shares of Common Stock Outstanding 18,361,922 18,343,403 17,561,476 17,765,124 17,724,721
Tangible Book Value Per Share, Reported $12.45 $12.17 $11.87 $11.55 $11.25
SHARES OUTSTANDING AT END OF PERIOD
Shares of Common Stock Outstanding 18,361,922 18,343,403 17,561,476 17,765,124 17,724,721
Shares of Preferred Stock Outstanding - - 878,048 878,048 878,048
Total Shares Outstanding at End of Period 18,361,922 18,343,403 18,439,524 18,643,172 18,602,769
TANGIBLE BOOK VALUE PER SHARE, ADJUSTED
Tangible Equity $ 228,653 $ 223,292 $ 217,465 $ 214,133 $ 208,331
Total Shares Outstanding at End of Period 18,361,922 18,343,403 18,439,524 18,643,172 18,602,769
Tangible Book Value Per Share, Adjusted $12.45 $12.17 $11.79 $11.49 $11.20

Non-GAAP Financial MeasuresAppendix
24Operating results are non-GAAP financial measures that adjust GAAP reported net income and other metrics for certain income and expense items as outlined in the non-GAAP reconciliation calculations above using a blended statutory income tax rate of 26.14% excluding non-deductible one-time merger related items.
Twelve Months Ended Three Months Ended
(Dollars in thousands, except per share information)
December 31, 2019
December 31, 2018
December 31, 2019
September 30, 2019
June 30, 2019
March 31, 2019
December 31, 2018
OPERATING NET INCOME
Net Income (Loss) $ 22,422 $ 9,655 $ 5,421 $ 6,466 $ 5,756 $ 4,780 $ (708)
Add: Merger Related Expense 2,654 9,803 163 187 1,711 594 8,929
Less: Income Tax Impact (694) (2,213) (43) (49) (447) (155) (1,985)
Operating Net Income 24,382 17,245 5,541 6,604 7,020 5,219 6,236
OPERATING DILUTED NET INCOME PER SHARE
Operating Net Income $ 24,382 $ 17,245 $ 5,541 $ 6,604 $ 7,020 $ 5,219 $ 6,236
Average Diluted Shares Outstanding 18,613,224 14,480,347 18,443,916 18,532,479 18,650,706 18,830,933 18,716,562
Operating Diluted Net Income per Share $1.31 $1.19 $0.30 $0.36 $0.38 $0.28 $0.33
OPERATING RETURN ON AVERAGE ASSETS (ROAA)
Operating Net Income $ 24,382 $ 17,245 $ 5,541 $ 6,604 $ 7,020 $ 5,219 $ 6,236
Total Average Assets 2,007,327 1,528,915 2,030,231 2,005,950 2,004,207 1,988,478 1,940,991
Operating Return on Average Assets (ROAA)
1.21% 1.13% 1.08% 1.31% 1.40% 1.06% 1.27%
OPERATING RETURN ON AVERAGE TANGIBLE EQUITY (ROATE)
Average Tangible Equity $ 218,868 $ 159,512 $ 226,922 $ 221,391 $ 215,741 $ 211,215 $ 200,124
Operating Net Income 24,382 17,245 5,541 6,604 7,020 5,219 6,236
Operating Return on Average Tangible Equity (ROATE)
11.14% 10.81% 9.69% 11.83% 13.05% 10.02% 12.36%

Non-GAAP Financial MeasuresAppendix
25Operating results are non-GAAP financial measures that adjust GAAP reported net income and other metrics for certain income and expense items as outlined in the non-GAAP reconciliation calculations above using a blended statutory income tax rate of 26.14% excluding non-deductible one-time merger related items.
Twelve Months Ended Three Months Ended
(Dollars in thousands, except per share information)
December 31, 2019
December 31, 2018
December 31, 2019
September 30, 2019
June 30, 2019
March 31, 2019
December 31, 2018
OPERATING NONINTEREST EXPENSE
Noninterest Expense $ 61,995 $ 53,487 $ 15,266 $ 15,531 $ 16,470 $ 14,725 $ 23,832
Less: Merger Related Expense (2,654) (9,803) (163) (187) (1,711) (594) (8,929)
Operating Noninterest Expense 59,341 43,684 15,103 15,344 14,759 14,131 14,903
OPERATING NONINTEREST EXPENSE / AVERAGE ASSETS
Operating Noninterest Expense $ 59,341 $ 43,684 $ 15,103 $ 15,344 $ 14,759 $ 14,131 $ 14,903
Total Average Assets 2,007,327 1,528,915 2,030,231 2,005,950 2,004,207 1,988,478 1,940,991
Operating Noninterest Income / Average Assets
2.96% 2.86% 2.95% 3.04% 2.95% 2.88% 3.05%
OPERATING EFFICIENCY RATIO
Operating Noninterest Expense $ 59,341 $ 43,684 $ 15,103 $ 15,344 $ 14,759 $ 14,131 $ 14,903
Net Interest Income 67,748 51,692 16,581 17,156 17,008 17,002 17,716
Noninterest Income 24,274 15,459 5,719 6,788 7,032 4,735 6,387
Total Revenues 92,022 67,151 22,300 23,944 24,040 21,737 24,103
Operating Efficiency Ratio 64.49% 65.05% 67.73% 64.08% 61.39% 65.01% 61.83%

Contact Information
26
Rob Anderson
Chief Financial and Chief Administrative Officer
CapStar Financial Holdings, Inc.
(615) 732-6470
Email: [email protected]
CapStar Financial Holdings, Inc.
1201 Demonbreun Street, Suite 700
Nashville, TN 37203
Mail: P.O. Box 305065
Nashville, TN 37230-5065
(615) 732-6400 Telephone
www.capstarbank.com
(615) 732-6455
Email: [email protected]
Corporate Headquarters Executive Leadership
Investor Relations