Embed Size (px)
Citation preview
Discounting Intro/Refresher
H. Scott Matthews12-706/73-359Lecture 11a - Oct. 8, 2004
Project Financing
Recall - will only be skimming this chapter (6) in lecture - it is straightforward and mechanical Especially with excel, calculators, etc. Should know theory regardless Should look at problems in Chapter 6
and ensure you can do them all on your own

Common Monetary Units
Often face problems where benefits and costs occur at different times
Need to adjust values to common units to compare them
Photo sensor - look at values over several years...
Ex: Compounding (Future Value)
Buy painting for $10,000 Will be worth $11,000 in one year (sure) Need to consider ‘opportunity cost’ Make table or diagram of streams of benefits
and costs over time
Have several analysis options Put $10,000 in savings, would earn simple
interest (8%): so $10,000(1.08)=$10,800 So should you buy the painting?
Decision Rules
As always, should choose option that maximizes net benefits Now we are using that same rule with
values adjusted for time value of money Still choose option that gives us the
highest value In this case it is ‘buying the painting’ Called ‘future value’ when you
compound current value to future
Alternative - Present Value
Do the problem in reverse Time - line representation How much money you would need to
invest in savings to get $11,000 in 1 year FV=$10,000(1+i) : $10,000 was ‘present’ PV=FV/(1+i); PV=$11,000/(1.08)=$10,185 Since greater, should buy painting
Has lower investment cost of $10k Last option - convert all to present value
Net Present Value Method
Current investment of $10,000 for painting represented as -$10,000
Receipt of $11,000 in a year as +$11,000/(1.08)
So NPV= -$10,000 + $10,185 = $185Since NPV positive, should buy
painting (it has positive net benefits) Relevance to Kaldor-Hicks, BCA rule?

General Terms
Three methods: PV, FV, NPVFV = $X (1+i)n
X : present value, i:interest rate and n is number of periods (eg years) of interest
Rule of 72PV = $X / (1+i)n
NPV=NPV(B) - NPV(C) (over time)Real vs. Nominal values
Real and Nominal
Nominal: ‘current’ or historical dataReal: ‘constant’ or adjusted data
Use deflator or price index for realFor investment problems:
If B&C in real dollars, use real disc rate If in nominal dollars, use nominal rate Both methods will give the same answer

Real Discount Rates
Market interest rates are nominal They reflect inflation to ensure value
Real rate r, nominal i, inflation m Simple method: r ~ i-m <-> r+m~i More precise: r=(i-m)/(1+m)
Example: If i=10%, m=4% Simple: r=6%, Precise: r=5.77%
Rates to Use for Analysis
In example, investments vs. savings We assumed an actual option for rate
But can use any rate to discount FV! Called a discount rate- may be set for us
MARR: opportunity cost of fundsAssume all values ‘real’ unless
stated otherwise

Minimum Attractive Rate of Return
MARR usually resolved by top management in view of numerous considerations. Among these are: Amount of money available for investment, and
the source and cost of these funds (i.e., equity or borrowed funds).
Number of projects available for investment and purpose (i.e., whether they sustain present operations and are essential, or expand present operations)
MARR part 2
The amount of perceived risk associated with investment opportunities available to the firm and the estimated cost of administering projects over short planning horizons versus long planning horizons.
The type of organization involved (i.e., government, public utility, or competitive industry)
In the end, we are usually given MARR
Garbage Truck Example
City: bigger trucks to reduce disposal $$ They cost $500k now Save $100k 1st year, equivalent for 4 yrs Can get $200k for them after 4 yrs MARR 10%, E[inflation] = 4%
All these are real valuesSee spreadsheet for nominal values
Sensitivity Analysis
How do NPV results change with i?Back to our garbage trucks example
Vary the real discount rate from 4-10% NPV declines as rate i increases Future benefits ‘discounted more’
See updated RealNominal.xls

Other Issues
Inflation hard to predict Tend to use historical trends/estimates
Terminal or residual values Value of equipment at end of
investmentTiming - typically assume beginning
of period values, not end of period
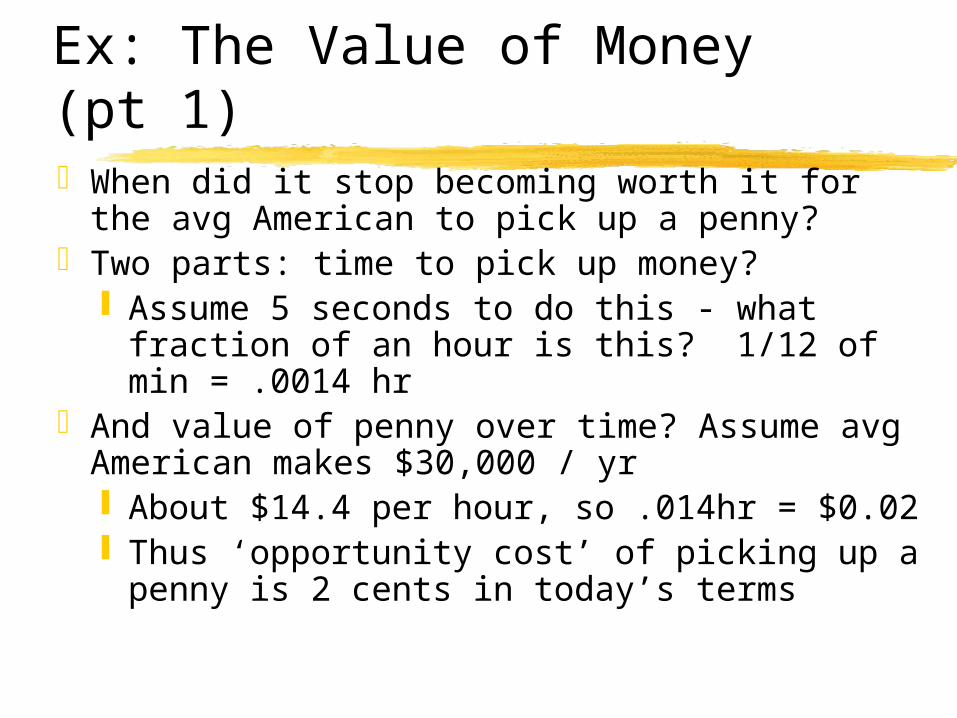
Ex: The Value of Money (pt 1)When did it stop becoming worth it for the
avg American to pick up a penny?Two parts: time to pick up money?
Assume 5 seconds to do this - what fraction of an hour is this? 1/12 of min = .0014 hr
And value of penny over time? Assume avg American makes $30,000 / yr About $14.4 per hour, so .014hr = $0.02 Thus ‘opportunity cost’ of picking up a
penny is 2 cents in today’s terms

Ex: The Value of Money (pt 2)
If ‘time value’ of 5 seconds is $0.02 now Assuming 5% long-term inflation, we can
work problem in reverse to determine when 5 seconds of work ‘cost’ less than a penny
Using Excel (penny.xls file): Adjusting per year back by factor 1.05 Value of 5 seconds in 1993 was 1 cent
Better method would use ‘actual’ CPI for each year..
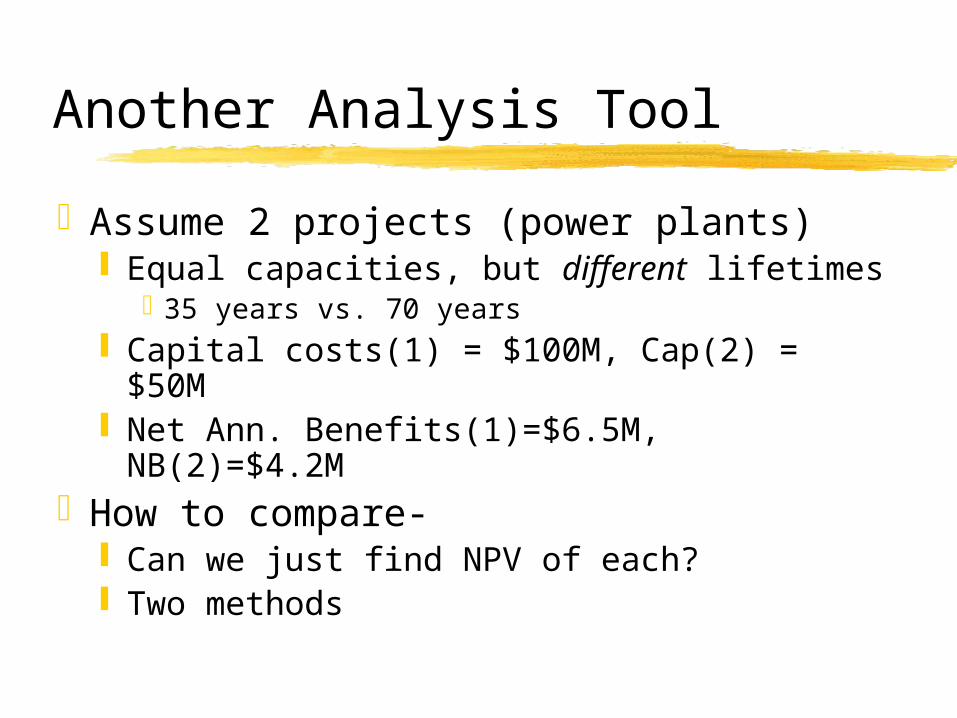
Another Analysis Tool
Assume 2 projects (power plants) Equal capacities, but different lifetimes
35 years vs. 70 years Capital costs(1) = $100M, Cap(2) = $50M Net Ann. Benefits(1)=$6.5M, NB(2)=$4.2M
How to compare- Can we just find NPV of each? Two methods

Rolling Over (back to back)
Assume after first 35 yrs could rebuild NPV(1)=-100+(6.5/1.05)+..
+6.5/1.0570=25.73 NPV(2)=-50+(4.2/1.05)+..
+4.2/1.0535=18.77 NPV(2R)=18.77+(18.77/1.0535)=22.17 Makes them comparable - Option 1 is best There is another way - consider annualized
net benefits
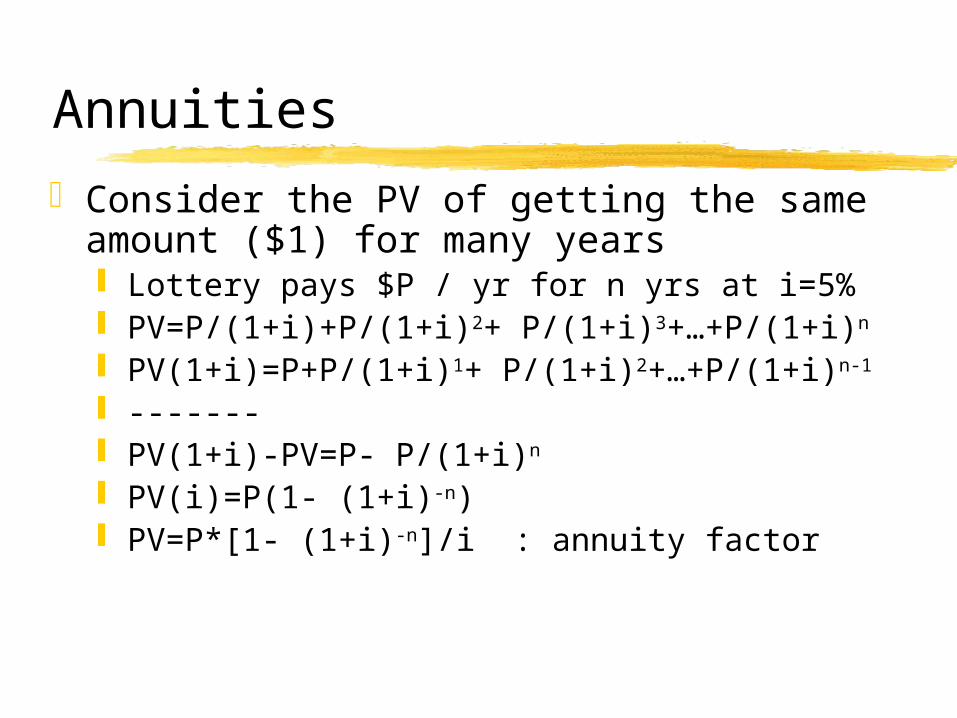
Annuities
Consider the PV of getting the same amount ($1) for many years Lottery pays $P / yr for n yrs at i=5% PV=P/(1+i)+P/(1+i)2+ P/(1+i)3+…+P/(1+i)n
PV(1+i)=P+P/(1+i)1+ P/(1+i)2+…+P/(1+i)n-1
------- PV(1+i)-PV=P- P/(1+i)n
PV(i)=P(1- (1+i)-n) PV=P*[1- (1+i)-n]/i : annuity factor

Equivalent Annual Benefit
EANB=NPV/Annuity Factor Annuity factor (i=5%,n=70) = 19.343 Ann. Factor (i=5%,n=35) = 16.374
EANB(1)=$25.73/19.343=$1.330EANB(2)=$18.77/16.374=$1.146
Still higher for option 1Note we assumed end of period pays
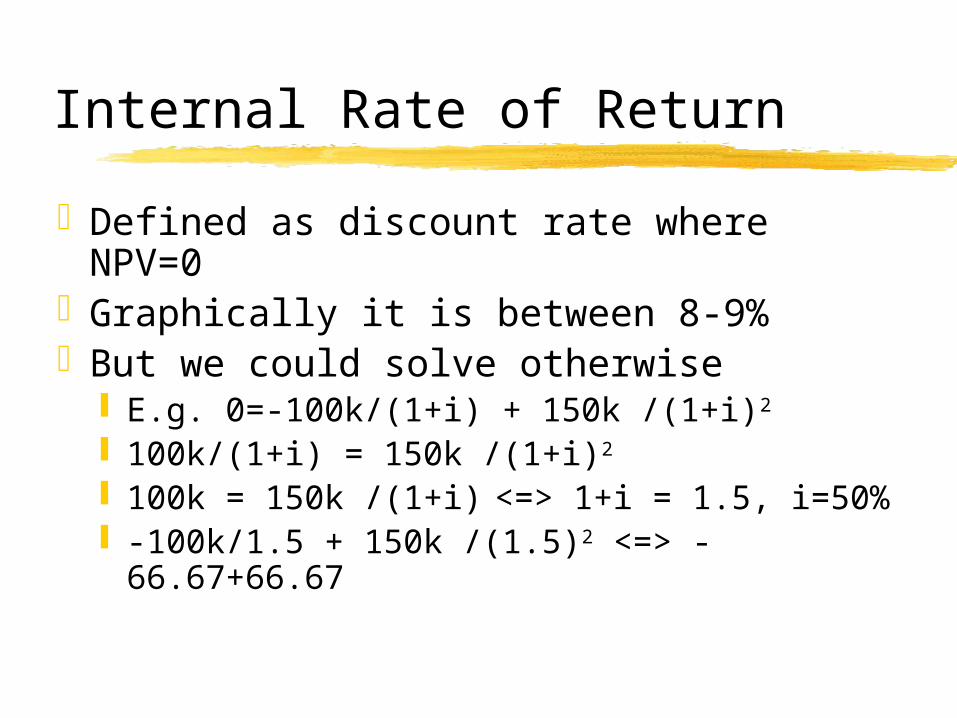
Internal Rate of Return
Defined as discount rate where NPV=0Graphically it is between 8-9%But we could solve otherwise
E.g. 0=-100k/(1+i) + 150k /(1+i)2 100k/(1+i) = 150k /(1+i)2
100k = 150k /(1+i) <=> 1+i = 1.5, i=50% -100k/1.5 + 150k /(1.5)2 <=> -
66.67+66.67
Decision Making
Choose project if discount rate < IRRReject if discount rate > IRROnly works if unique IRRCan get quadratic, other NPV eqns
Perpetuity (money forever)
Can we calculate PV of $A received per year forever at i=5%?
PV=A/(1+i)+A/(1+i)2+…PV(1+i)=A+A/(1+i) + …PV(1+i)-PV=APV(i)=A , PV=A/i E.g. PV of $2000/yr at 8% = $25,000When can/should we use this?