Embed Size (px)
Citation preview
Vietnam J Comput Sci (2017) 4:97–110DOI 10.1007/s40595-016-0078-9
REGULAR PAPER
Discovering crisis models to help assess coordination plansA case study of tsunami response plan given by Ho Chi Minh City, Vietnam
Nguyen-Tuan-Thanh Le1,2 · Chihab Hanachi3 · Serge Stinckwich4,5,6 ·Tuong-Vinh Ho4,5,7
Received: 30 April 2016 / Accepted: 10 August 2016 / Published online: 26 August 2016© The Author(s) 2016. This article is published with open access at Springerlink.com
Abstract Recently, we have witnessed an increasing num-ber of crises, not only natural disasters but also man-madeones. Coordination among several stakeholders is the keyfactor to reduce the damage caused by a crisis. However, theplan for coordination can be expressed under various rep-resentations, including textual format—the most used onein reality but hard to analyze its efficiency. We consider inthis paper a combination of process and organization aspectsof a coordination plan. Process models (e.g Petri Net, Busi-ness Process Model and Notation) could be used to capture
The work presented in this paper has been funded by the ANR Genepiproject.
B Nguyen-Tuan-Thanh [email protected]
Chihab [email protected]
Serge [email protected]
Tuong-Vinh [email protected]
1 IRIT Laboratory, University Paul Sabatier Toulouse III,Toulouse, France
2 University of Science and Technology of Hanoi, Hanoi,Vietnam
3 IRIT Laboratory, University Toulouse Capitole I, Toulouse,France
4 IRD, UMI 209, UMMISCO, IRD France Nord, 93143 Bondy,France
5 Sorbonne Universités, Univ. Paris 06, UMI 209, UMMISCO,75005 Paris, France
6 Université de Caen Basse-Normandie, Caen, France
7 Institute Francophone International, Vietnam NationalUniversity, Hanoi, Vietnam
the processes of activities and messages exchanged betweenthe actors involved in a crisis, while organization models(e.g. Role graph, agent-centred multi-agent system, organi-zation centred multi-agent system) are used to highlight theroles, their interactions and the organizational structures. Wethen describe a proposal that allows performing an automatictransformation from process models to organization mod-els. Our proposal is illustrated with a coordination plan fortsunami response, given by People Committee of Ho ChiMinh City (HCMC), Vietnam.
Keywords Coordination representation · Business processmodelling · Multi-agent system · Organization-centredmulti-agent system · Role graph · Mapping process tomulti-agent system · Crisis management
1 Introduction
Crisis situations such as natural disasters with environmentalconsequences impose the coordination of numerous stake-holders: firemen, medical organizations, police, etc. In thecontext of crisis resolution, coordination plans could beexamined under different representations. The mostly usedrepresentation in reality is the textual format that has sev-eral drawbacks [1]. Its ambiguity makes the coordinationamong stakeholders difficult.Moreover, it cannot support thedirect and autonomous analysis or simulation. Another pos-sible representation of coordination is a process model, e.g.a Business Process Model and Notation diagram (BPMN) asshown in [1]. This diagram, built by analyzing an official tex-tual plan, can support process simulation and analysis [2] dueto process complexity, end-to-end process time, resourcescosts, etc.
123

98 Vietnam J Comput Sci (2017) 4:97–110
Recently, we have witnessed an increasing interest inresearch aiming at modelling and simulating complex sys-tems (such as Crisis Management) using multi-agent par-adigm, i.e the micro aspect. Multi-agent system (MAS)could be separated by agent-centred multi-agent system(ACMAS), i.e. focusing on the individual aspect, and orga-nization centred multi-agent system (OCMAS), i.e. focusingon the social aspect [11]. In our opinion, MAS currentlylacks the means to design and visualize the whole sys-tem behaviour, i.e the macro aspect. Regarding softwareengineering, before the implementation, we must performthe design phase to have an overview of studied system.Thus, we argue that multi-agent paradigm should follow thisway.
For that reason, the idea of combination between businessprocess and multi-agent system has been raised to improveagent-based design [6] as well as to allow performing diversanalysis based on the strong sides of both paradigms (e.g.control-flow complexity metric for process model [14], orga-nizational structure for OCMAS [13], etc.). Process modelscould be considered as additional components of agent ones,since they can provide means to represent an aggregate viewof an MAS behaviour. In addition, process models shareseveral concepts with MAS. Therefore, we believe that themarriage of Process- and Agent models is suitable to designan efficient coordination in complex system [7], such as crisismanagement, by improving the quality of coordination plan.While stakeholders and their behaviours may be describedby agents, the crisis resolution plan is amenable to a processrepresentation.
Theworkpresented in this paper follows a life cycle showninFig. 1 to transform fromprocessmodels (PetriNet,BPMN)to organization models (Role graph, ACMAS and OCMAS).More precisely, we use the Agent-Group-Role (AGR) modelproposed by [11] as an OCMAS representation and BDI-Agent as an ACMAS representation.
Fig. 1 Life cycle of mapping from process models (Petri Net, BPMN)to organization models (Role graph, ACMAS and OCMAS)
Fig. 2 A scenario-based life cycle for process design and validationfrom text
Our contribution in this paper consists in the definitionof a mapping framework for coordination models in crisisresponse.Weprovide the guidelines of transformation amongfive complementary views (Petri Net, BPMN, Role graph,BDI-agent and AGR). Even if our work examines a concretecase (i.e. the tsunami response plan of Ho Chi Minh City,Vietnam), our approach can be applied to any coordinationplan.
This paper is organized as follows. We first give twoprocess representations (Petri Net and BPMN) detected fromour tsunami response plan in Sect. 2. Section 3 will presentthe mappings from process models to organization mod-els (Role graph, ACMAS and OCMAS). Then we providerelated works about the process-agent transformation andorganizational structure assessment in Sect. 4. Finally, weconclude our work with some perspectives.
2 Design of processes for crisis resolution
We propose a method to design process models of crisis res-olution that have the following characteristics (cf. Fig. 2):
1. It is composed of four steps with possible iterations fol-lowing the validation of stakeholders.
2. The identification of high-level objects take action in sup-port of a meta-model of simple crises (cf. Fig. 2).
3. It is organized around scenarios that correspond to pos-sible plan of crisis resolution.
4. It exploits a processmining technique calledα -algorithm[5] to derive the process of crisis resolution (i.e. a PetriNet with special properties) from scenarios.
123

Vietnam J Comput Sci (2017) 4:97–110 99
Fig. 3 Meta-model to representcoordination of activities duringcrisis management
2.1 Identification of high-level objects from text
2.1.1 Principles
The designer must extract from text the top-level objects andthe links existing between them. It should be based on themeta-model we propose in Fig. 3. This meta-model is simpleenough allowing to extract essential concepts to describe thecoordination of activities. There are in the literature moredetailed models [3] but the usage may prove to be difficultbecause it is impossible in reality to dispose of all theoreticalinformation they contain (risk probabilities, gravity factor,etc.).
We prefer here to limit ourselves on high-level concepts,easily identified in the text and that allow derive models ofsimple processes giving an aggregated view of the plan. Thedesigners, associated with the stakeholders, can then refinethe process by proposing scenarios. Although, the analysis oftext is supposed here manually but the techniques for auto-matic text analysis has actually emerged [4] and could beused with profits to extract the elements of our meta-model.
Our meta-model records the tasks and the roles and/ororganizations who are in charge of these roles. An organi-zation can contain others and a hierarchy relationship thenexists between them. The tasks realize the objectives toreduce or resolve the risks (potential or proven). The tasksmay have constraints between them (precedence or choice,etc.) and the causal links: the effect of a task (post-condition)may be exploited by another (pre-condition). The constraintsand causal links are given in the Table 1. The tasks can taketwo forms (communication or action). In the second case, werecord the receivers of the communication.
2.1.2 Illustration of identifying organizations, tasks andtheir relationships from HCMC’s Plan
In fact, we have identified in this HCMC’s plan over thirtyorganizations and numerous duties for each one. For legi-bility reason, we gathered some organizations with similarresponsibilities or missions in a more abstract organization.Sometimes organizations share a common role: for examplepolice and military have the first-responder role and as suchthey have both the mission of evacuating people and inform-ing and transferring injuries people to safe places. We willnot detail here the different roles but only the tasks and theorganizations.
The organization Local Administration represents actu-ally four organizations: (1) Committee for Flood–StormPrevention and Search–Rescue of HCMC, (2) People’s Com-mittee of Districts, Communes and Towns, (3) Chairman ofPeople’s Committee of Districts, Communes and Towns, and(4)CommandCenter of Programagainst FloodingofHCMC.
The organization CommunicationUnit gathers three orga-nizations: (1) Department of Information and Communica-tion, (2) Television station of HCMC, and (3) Radio Voiceof HCMC.
The organization Military represents three organizations:(1) High command of HCMC, (2) Border Guard High Com-mand of HCMC, and (3) Border Guard Forces.
The organization Police substitutes for two organizations:(1) Police of HCMC, and (2) Department of Police about FirePrevention and Fire fighting of HCMC.
The organizationHealth andRedCross gathers three orga-nizations: (1)Department ofHealth, (2)Center for PreventiveMedical, and (3) Red Cross of City.
123

100 Vietnam J Comput Sci (2017) 4:97–110
Table 1 Basic relations andconstraints between tasks (C1) Before (A, B) Means A should occur before B
(C2) Choice (A, B) Means we have the exclusive choice between performing A or B
A decision procedure is supposed to exist to perform the choice
(C3) Fill (T1, p, T2) T1 produces p that is used by T2, and T1 should occur before T2
P is a post-condition of T1 and pre-condition of T2
(C4) Parallel (T1, T2) T1 could be performed in parallel with T2
And finally the organization Local Civil Defence Forcesrepresents two organizations: (1) Local Civil Defence Forcesand (2) Young Volunteers Force of HCMC.
As a result, during period of response and search–rescue,seven organizations are considered:
– O1: Institute of Geophysics (Vietnam Academy of Sci-ence and Technology)
– O2: Local administration– O3: Military– O4: Police– O5: Local civil defence forces– O6: Communication unit– O7: Health and Red cross
We have translated the response plan from Vietnameseinto English and produce a summary where we mention theorganizations, their tasks and the relations among tasks: anassumed case study of tsunami response plan in HCMC.
When detecting the risk of a tsunami (T1) that may affect theareas of Can Gio (Ho Chi Minh City, Vietnam), the Institute ofGeophysics (O1) would inform (T2) the city's LocalAdministration (O2) about the time, place and predictive level ofthe tsunami so that it can be well prepared to respond to thedisaster depending on the level of tsunami and to minimize thenumber of victims, the lack of food, etc.
After receiving the message about tsunami warning (T3), theLocal Administration (O2) would lead and mobilize possible/available forces, materials, facilities (e.g. car, trucks, canoes,salvage boats, etc.) (T4) to support search and rescuewhenever the tsunami happens to minimize the damage andvictims. It also directs the evacuation task (T5) with theparticipation of several functional units such as Military (O3),Police (O4), Local Civil Defence Forces (O5), CommunicationUnit (O6), Health & Red Cross (O7), etc. The Local CivilDefence Forces (O5) walk along all streets and residentialareas to inform citizens using portable loudspeakers (T6), sothat people could go to the safe places under the guidance ofthe Military (O3) and the Police (O4). Meanwhile, if the mediainfrastructure can work, the Communication Unit (O6) wouldbroadcast the tsunami warning message (T7) on radio andtelevision to inform people on the shore as well as on thevessels about the oncoming risk. The Military (O3) is the coreforce of evacuating coastal people (T8) to the safe shelters withthe cooperation of the Police (O4) (T8'). At the same time, theMilitary (O3) would whistle alarm, fire the signal (T9) to warnthe ships and guide the fishermen (T10) so that they wouldcome back offshore deep waters and keep their boats in safe
locations. The Police (O4) has main tasks of protecting citizens'property (T11) and ensuring the public order and safety (T12)to avoid the disorder situation (e.g. transportation, someonetaking advantage from this situation, etc.). The Health & RedCross (O7) would mobilize the doctors, nurses, rescue teams,facilities, equipment to support the hospitals (T13). During theevacuation, it has a task of performing the first aids (T14) forinjured people. For the victims who are in a serious situation, ithas to call the ambulance (T15) to transport them to thehospital.
When the Institute of Geophysics (O1) observes the signalabout the end of tsunami, it would inform (T16) the Ho Chi MinhCity's local administration (O2). After receiving this message(T17), the city's Local Administration (O2) would directfunctional units (T18) to overcome the consequences. TheCommunication Unit (O6) would propose the methods torecover the communication system (T19) after the tsunami.Meanwhile, the Military (O3) and Police (O4) would coordinateto identify the damages (T20) (T20'): collapsed building, deadand/or injured people. The Military (O3) has another task ofsearching the distress fishermen (T21) on the sea. The Police(O4) also has to ensure the social order and safety (T22) byproviding temporary accommodations for the people. TheHealth & Red Cross (O7) would perform the program ofsupporting health services, disease prevention (T23) in affectedareas. It also verifies the ADN sample of anonymous victims(T24) who were killed or not identified during the tsunami.Finally, after all functional units finish their works, the LocalAdministration (O2) would close the tsunami response (T25).
Table 2 provides a synthesized view of the tasks and theircorresponding performers, extracted from the above casestudy.
The constraints and causal relations between tasks can beidentified in the text by temporal terms such as meanwhile,so that, after, finally, at the same time.We obtained the resultsreported in Table 3.
2.2 Process discovering and representation by means ofPetri nets
The constraints and causal relationships between tasks allowus to generate and then select scenarios’ response to the cri-sis. They are linear and then the objective is able to synthesizeall of these scenarios in a single process capable of playingeach scenario and explaining clearly the choices and the par-allelism between tasks. We will use for this the α-algorithm[5] which allows to deduce a Petri net from a log file.
123

Vietnam J Comput Sci (2017) 4:97–110 101
Table 2 Tasks and their corresponding performers (actors) in tsunamiresponse plan
Tasks Org.
T1: Detect the risk of tsunami O1
T2: Inform tsunami warning O1
T3: Receive tsunami warning O2
T4: Mobilize forces, materials, facilities O2
T5: Direct evacuation task O2
T6: Inform people using portable speakers O5
T7: Broadcast tsunami info O6
T8: Evacuate people O3
T8’: Help to evacuate people O4
T9: Fire signal to warn the ships O3
T10: Inform the fishermen to safe places O3
T11: Protect people’s property O4
T12: Ensure the order and safety O4
T13: Mobilize doctors, nurses, rescue teams,facilities, equipments
O7
T14: Perform the first aid O7
T15: Call ambulance for serious cases O7
T16: Inform end of tsunami O1
T17: Receive end of tsunami O2
T18: Direct to overcome the consequences O2
T19: Recover communication system O6
T20: Identify damages O3
T21: Search distress fishermen O3
T20’: Help to identify damages O4
T22: Ensure the public order and safety O4
T23: Support health services, disease prevention O7
T24: Verify ADN sample of anonymous victims O7
T25: Close tsunami response O2
2.2.1 Principle of process discovery via α-algorithm
The log file includes different scenarios also called cases.In our context, we propose a log file in tabular form andwith the following structure: (ScenarioId, Task, Performer,Receiver(s), Timestamps). Performer is the organization thatperformed the tasks while Receiver is the possible receiverof the task if the task is a communication. Table 4 illustratesthe structure of a scenario contained in a log file.
The algorithm is based on the relation of successionbetween tasks that it infers three other relationships (seeTable 5). The relationship ofDirect Succession between tasksis more restrictive than the task before seen previously inSect. 2.1.1 because it indicates a relation of succession with-out intermediate.
We now detail the different steps of α-algorithm. Let Wbe a workflow log on T (a set of tasks). α(W ) is constructedaccording to the Algorithm 1. The first instruction builds
Table 3 Relations and constraints between tasks
T1 before T2
T2 before T3
T3 before T4, T5
T4 ‖ T5
T6, T7, T8, T9, T10, T8’, T11,
T12, T13, T14, T15 after T5
T6 ‖ T7 ‖ T8 ‖ T9 ‖ T10 ‖T8’ ‖ T11 ‖ T12 ‖ T13
T14, T15 after T13
T14 or T5
T2 before T16
T16 before T17
T6, T7, T8, T9, T10, T8’, T11,
T12, T13, T14, T15 before T17
T17 before T18
T19, T20, T21, T20’, T22,
T23, T24 after T18
T19 ‖ T20 ‖ T21 ‖ T20’ ‖T22 ‖ T23 ‖ T24
T19, T20, T21, T20, T22,
T23, T24 before T25
set of transitions from the tasks appearing in the log fileW . The instructions 2 and 3 calculate TI and TO , respec-tively. TI designates set of tasks starting a case (scenario).TO designates a set of tasks ending a case. The instruction 4calculates the set XW of pairs of tasks (A, B)whose elementsare in causal relationships. The tasks within A have a rela-tionship of choice between them and it is the same withinB. The instruction 5 calculates a minimum subset YW ofXW . The instruction 6 calculates the places PW that connectpairs of set of transitions of YW . The instruction 7 calculatesthe arcs and finally instruction 8 returns the expected result(PW , TW , FW ).
Algorithm 1 α-Algorithm to create Petri Nets according to[5]Input: W (LogFile)Output: Petri Net (PW , TW , FW )
1: TW = {t ∈ T | ∃σ∈W t ∈ σ },2: TI = {t ∈ T | ∃σ∈W t = f irst (σ )},3: TO = {t ∈ T | ∃σ∈W t = last (σ )},4: XW = {(A, B) | A ⊆ TW ∧ B ⊆ TW ∧ ∀a∈A∀b∈B a →W b ∧
∀a1,a2∈A a1 #W a2 ∧ ∀b1,b2∈B b1 #W b2},5: YW = {(A, B) ∈ X | ∀(A′,B′)∈X A ⊆ A′ ∧ B ⊆ B ′ ⇒ (A, B) =
(A′, B ′)},6: PW = {p(A,B) | (A, B) ∈ YW } ∪ {iW , oW },7: FW = {(a, p(A,B)) | (A, B) ∈ YW ∧a ∈ A}∪{(p(A,B), b) | (A, B) ∈
YW ∧ b ∈ B} ∪ {(iW , t) | t ∈ TI } ∪ {(t, oW ) | t ∈ TO }, and8: α(W ) = (PW , TW , FW ).
123

102 Vietnam J Comput Sci (2017) 4:97–110
Table 4 The structure of Scenario 1 (26 events) contained in an eventlog
Sid Task Performer Timestamps
1 T1 Inst. of Geo. 2016-02-25 16:04:20
1 T2 Inst. of Geo. 2016-02-25 17:04:20
1 T3 Local Admin. 2016-02-25 18:04:20
1 T5 Local Admin. 2016-02-25 19:04:20
1 T4 Local Admin. 2016-02-25 20:04:20
1 T11 Police 2016-02-25 21:04:20
1 T8 Military 2016-02-25 22:04:20
1 T10 Military 2016-02-25 23:04:20
1 T9 Military 2016-02-26 00:04:20
1 T13 Health and Red Cross 2016-02-26 01:04:20
1 T7 Communication Unit 2016-02-26 02:04:20
1 T14 Health and Red Cross 2016-02-26 03:04:20
1 T12 Police 2016-02-26 04:04:20
1 T8’ Police 2016-02-26 05:04:20
1 T6 Local Civil D. F. 2016-02-26 06:04:20
1 T16 Inst. of Geo. 2016-02-26 07:04:20
1 T17 Local Admin. 2016-02-26 08:04:20
1 T18 Local Admin. 2016-02-26 09:04:20
1 T22 Police 2016-02-26 10:04:20
1 T20 Military 2016-02-26 11:04:20
1 T19 Communication Unit 2016-02-26 12:04:20
1 T24 Health and Red Cross 2016-02-26 13:04:20
1 T20’ Police 2016-02-26 14:04:20
1 T23 Health and Red Cross 2016-02-26 15:04:20
1 T21 Military 2016-02-26 16:04:20
1 T25 Local Admin. 2016-02-26 17:04:20
Table 5 Relations between tasks in the α-algorithm
Direct succession x > y iff for some case x isdirectly followed by y
Direct causality x → y iff x > y and not y > x
Parallel x ‖ y iff x > y and y > x
Choice x �= y iff not x > y and not y > x
2.2.2 Application to Ho Chi Minh plan scenarios
We retain the following six scenarios to consider the crisisresponse plan of Ho Chi Minh City:
1. Scenario 1 (26 events): T1. T2. T3. T5. T4. T11. T8. T10.T9. T13. T7. T14. T12. T8. T6. T16. T17. T18. T22. T20.T19. T24. T20. T23. T21. T25.
2. Scenario 2 (26 events): T1. T2. T3. T4. T5. T9. T6. T7.T11. T8. T8. T12. T13. T14. T10. T16. T17. T18. T20.T23. T22. T21. T19. T20. T24. T25.
Fig. 4 Petri Net representation of Ho Chi Minh City tsunami responseplan
3. Scenario 3 (26 events): T1. T2. T3. T4. T5. T8. T8. T13.T14. T10. T6. T12. T11. T9. T7. T16. T17. T18. T20.T22. T21. T19. T24. T20. T23. T25.
4. Scenario 4 (26 events): T1. T2. T3. T5. T4. T8. T7. T9.T6. T11. T12. T13. T10. T14. T8’. T16. T17. T18. T21.T20. T23. T24. T20. T19. T22. T25.
5. Scenario 5 (26 events): T1. T2. T3. T4. T5. T7. T6. T12.T10. T8. T8’. T9. T13. T14. T11. T16. T17. T18. T20.T23. T19. T21. T24. T20. T22. T25.
6. Scenario 6 (26 events): T1. T2. T3. T5. T4. T7. T8. T13.T11. T12. T8. T6. T15. T10. T9. T16. T17. T18. T20.T21. T24. T19. T20. T22. T23. T25.
When applying α-algorithmwith above scenarios, we dis-cover a Petri Net of Fig. 4 that we have redrawn to underlinethe different organizations involved in our tsunami responseplan.
In a reverse manner, from this Petri Net, we can generateall possible scenarios and then use as input cases (of an eventlog file) to verify the conformance of process. The techniqueto build a process corresponding to an event log is calledProcess Mining [5].
2.3 BPMN representation of a plan for stakeholdervalidation
BPMN is a standard notation, proposed by the Object Man-agement Group (OMG), for modelling business processes.We consider here a core subset of BPMN elements as shownin Fig. 5.
BPMN representation of plan is useful for validation bystakeholders since it integrates an organizational perspectivenot present in conventional Petri Nets. It is not only easy toread but also available to simulate and analyze the results. Inour context, there are two ways to obtain a BPMN represen-tation:
123

Vietnam J Comput Sci (2017) 4:97–110 103
Fig. 5 Core subset of BPMN elements
Fig. 6 Mapping Petri Net concepts onto BPMN concepts
1. By mapping the Petri Net discovered from the scenariosonto a BPMN diagram and complete it by organizationalelements.
2. The other possible way is to analyze the text and/or thescenarios and draw it directly.
We present in Fig. 6 the relations between the concepts ofPetri Nets and BPMN (sequential, parallelism, synchroniza-tion, exclusive choice, or merge).
Using this table, the concepts of Petri Net can be trans-formed easily into BPMN ones. We need the Petri Netformalism to verify formal theoretical properties (reacha-bility of particular states, termination, liveness, etc.) andperformsimulations.Wealso implemented themapping fromPetri Net to BPMN using ATL1 technology on top of twometa-models. In fact, the source model of the mapping (cf.our Petri Net in Fig. 4) is expressed under a PNML2 filecontaining two separate pages (i.e processes).
1 ATL Transformation Language.2 Petri Net Markup Language.
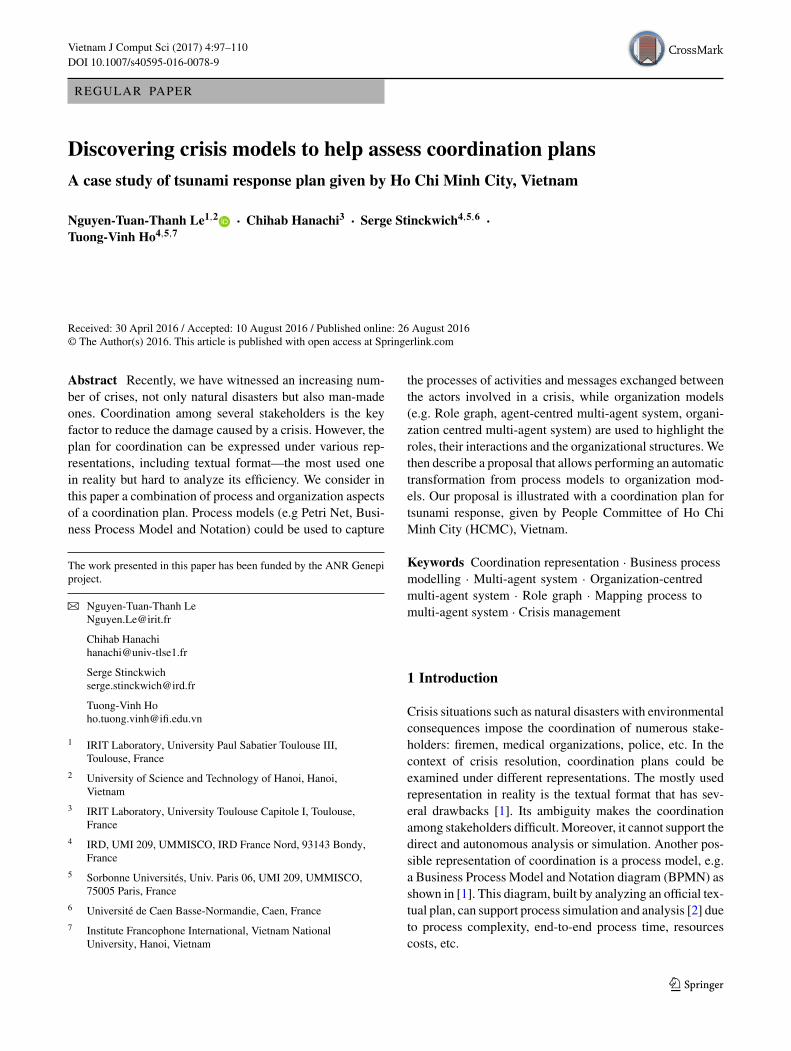
As the result of mapping, Fig. 7 shows the BPMN modelrepresenting HCMC’s tsunami response plan. This modelobviously eases accountability and awareness. The BPMNmodel describes some adaptations to put also temporal con-straints.
Eight stakeholders can be identified from our Petri Netwith reference to the identification of high-level objects fromtext (cf. 2.1), depicted by two pools (corresponding to twopages of the PNML file) and six lanes with their flow of tasksand mutual interactions.
Some parallel structures between tasks are detected fromour Petri Net according to mapping table in Fig. 6, e.g. [T3,T4, T5] corresponding to [X, Y, Z] respectively, [T4, T6,T7], [T5, T6, T7], [T4, T7, T8], [T5, T7, T8], etc. We noticethat the Military, Police and Health and Red Cross organiza-tions are supposed to perform their tasks in parallel. In thiscase, each organization should be distributed over the paralleltasks according to a given policy (proportional distribution,distribution according to the importance given to each task,…).
In addition, an exclusive choice structure is detected fromour Petri Net (cf. Fig. 4) regarding to the relationships of T13,T14 and T15. The Health and Red Cross organization has tochoose to carry out only one task among two possible ones.
We can identify, in the process model, eight participantsrepresented by rectangular boxes, called Swimlane Objects(aka: Swimlanes). Besides, to visualize coordination process,we use the activity notation (like T1: Detect tsunami risk),represented by a rounded-corner rectangle. These activitiesare connected by the Connectors such as Sequence Flow andMessage Flow, and the Flow Objects like Start Event, Inter-mediate Event, End Event. Moreover, the control structureshelp to coordinate the different activities, such as parallelism(diamond including “+′′) or alternatives (diamondwith “×′′).
When the same task is done by two different actors, itis duplicated instead of creating an abstract actor includingboth actors. In our BPMN diagram (cf. Fig. 7), for example,we express the task Evacuate people realized by two actors(Military and Police) by two tasks T8 and T8’, respectively.Indeed each actor has its own view of tasks, links with part-ners or situation of extra-works.Moreover, three tasks T8, T9andT10 are performed in parallel byMilitary and they requireprobably more resources and high responsibility. Our BPMNmodel is, therefore, considered as a shared artefact that couldbe used for negotiation of resources or improve coordinationfor similar tasks done by different organizations.
3 Mapping from process models to organizationmodels
The coordination among stakeholders, in general, can be rep-resented by several formats such as text, process diagram,
123
104 Vietnam J Comput Sci (2017) 4:97–110
Fig. 7 BPMN representation for tsunami response plan
conventional graph, etc. Each of themexpresses some aspectsof the coordination plan but they differ from one another interms of abstraction level, precision and expressive power.Combining various representations helps us to have an over-all view of the crisis management. The advantages of eachrepresentation is given in Table 6.
3.1 Deriving Role graph
The Role graph aims at analyzing the properties of theorganization involved in crisis plan, notably its robustness,flexibility and efficiency as done in [2]. The process modelthus can be used to build a Role graph corresponding to ourtsunami respond plan. This type of representation describesthe roles and the relationships between them. Following thetypology introduced by Grossi et al. [13], we can distinguishthree types of relations: power which corresponds to task
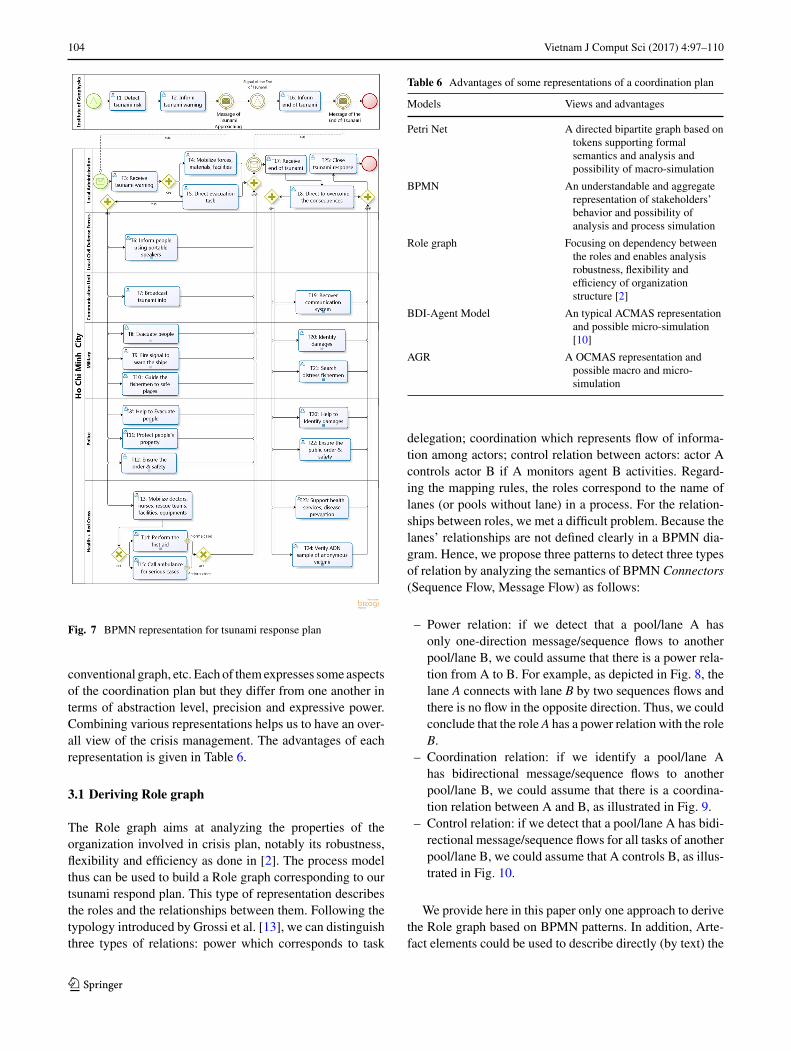
Table 6 Advantages of some representations of a coordination plan
Models Views and advantages
Petri Net A directed bipartite graph based ontokens supporting formalsemantics and analysis andpossibility of macro-simulation
BPMN An understandable and aggregaterepresentation of stakeholders’behavior and possibility ofanalysis and process simulation
Role graph Focusing on dependency betweenthe roles and enables analysisrobustness, flexibility andefficiency of organizationstructure [2]
BDI-Agent Model An typical ACMAS representationand possible micro-simulation[10]
AGR A OCMAS representation andpossible macro and micro-simulation
delegation; coordination which represents flow of informa-tion among actors; control relation between actors: actor Acontrols actor B if A monitors agent B activities. Regard-ing the mapping rules, the roles correspond to the name oflanes (or pools without lane) in a process. For the relation-ships between roles, we met a difficult problem. Because thelanes’ relationships are not defined clearly in a BPMN dia-gram. Hence, we propose three patterns to detect three typesof relation by analyzing the semantics of BPMN Connectors(Sequence Flow, Message Flow) as follows:
– Power relation: if we detect that a pool/lane A hasonly one-direction message/sequence flows to anotherpool/lane B, we could assume that there is a power rela-tion from A to B. For example, as depicted in Fig. 8, thelane A connects with lane B by two sequences flows andthere is no flow in the opposite direction. Thus, we couldconclude that the role A has a power relation with the roleB.
– Coordination relation: if we identify a pool/lane Ahas bidirectional message/sequence flows to anotherpool/lane B, we could assume that there is a coordina-tion relation between A and B, as illustrated in Fig. 9.
– Control relation: if we detect that a pool/lane A has bidi-rectional message/sequence flows for all tasks of anotherpool/lane B, we could assume that A controls B, as illus-trated in Fig. 10.
We provide here in this paper only one approach to derivethe Role graph based on BPMN patterns. In addition, Arte-fact elements could be used to describe directly (by text) the
123

Vietnam J Comput Sci (2017) 4:97–110 105
Fig. 8 Pattern of Power relation between two actors
Fig. 9 Pattern of Coordination relation between two actors
Fig. 10 Pattern of Control relation between two actors
Power, Coordination or Control relations. However, it cannotassure that when designing a process model, the users willsupply this relation information.
Based on three proposed patterns, we analyze our BPMNdiagram to build its corresponding Role graph. Seven rolesare detected: IG for the pool Institute of Geophysics, LAfor the lane Local Administration, LCDF for the lane LocalCivil Defence Forces, CU for the lane Communication Unit,M for the lane Military, P for the lane Police and HR forthe lane Health and Red Cross. Moreover, the pool Instituteof Geophysics sends two message flows to the lane LocalAdministration and there is no flow in opposite direction(Fig. 11). Therefore, we create a Power Relation from Insti-tute of Geophysics to Local Administration.
The lane Local Administration has bidirectional sequenceflows for all tasks of lane Local Civil Defence Forces(Fig. 12), Communication Unit, Military, Police and Healthand Red Cross. Therefore, we create Control Relations fromLocal Administration to Local Civil Defence Forces, Com-munication Unit, Military, Police and Health and Red Cross.
As the result, the derived Role graph based on three abovepatterns is depicted in Fig. 13, each circle corresponds to a
role. The role IG has Power relation with the role LA. Whilethe role LA has five Control relations with the roles P, M,HR, CU, LCDF. We detect no Coordination relation fromour BPMN diagram.
3.2 Deriving BDI-agent
This transformation is based on the work in [10] with someextensions. ABDI-Agent is defined as a tuple�= (id, P,G,
I, B). Deriving BDI-Agent from a process model containsnine steps, corresponding to nine rules presented in [10], withthe aid of additional information.
1. Step 1: Each pool is considered as an agent (�)2. Step 2: The plan (P) for agent is initiated3. Step 3: The input list of process (P.I n) is completed with
start events4. Step 4: The output list of process (P.Out) is completed
with end events5. Step 5: The embedded sub-process activities are trans-
ferred to another plans of agent (P ′)6. Step6:The independent sub-process activities aremapped
to goals of agents (G)7. Step 7: The elements with Send and Receive messages
are appended to plan’s script (P.Script)8. Step 8: The data flows (additional information of pools)
are mapped to the belief of agents (B)9. Step 9: The control flows (gateways) are considered to
orchestrate the structure of agents’ plan with AND, OR,XOR structure
Table 7 shows the result of mapping from BusinessProcess to BDI-Agent model containing nine steps and addi-tional data. Finally, two BDI-type agents are detected withtheir attributes (Plan, Belief).
3.3 Deriving AGR model
An organization centredmulti-agent system (OCMAS) view,as proposed by Ferber et al. [11], eases macro-simulationregarding the organization and alsomicro-simulation if agentbehaviors are specified. In [11], the authors have intro-duced a meta-model Agent/Group/Role, called AGR where:“(1) an Agent is an active communicating entity whichplays several roles within several groups; (2) a Group isdefined as atomic sets of agent aggregation, each agentis part of one or more groups; (3) a Role is an abstractrepresentation of agent function, service or identificationwithin a group and role has some attributes such as con-straints (obligations, requirements, skills), benefits (abilities,authorization, profits) or responsibilities′′. Based on theproposition of Ferber et al., we define AGR = (A,G, R), asfollows:
123

106 Vietnam J Comput Sci (2017) 4:97–110
Fig. 11 Relation between thepool Institute of Geophysics andthe lane Local Administration
Fig. 12 Relation between thelane Local administration andlane Local civil defence forces
Fig. 13 Role graph corresponding to our BPMN diagram
– A is a collection of agent. Each agent is tuple (NameA,T , Rs, Gs) where NameA is its identifier; T is its type(reactive or intentional agents); Rs is the list of roles thisagent can play;Gs is the list of groups to which this agentmay belong.
– G is a collection of groups. Each group is couple(NameG, Rs) where NameG is its identifier; Rs is thelist of roles involved in this group.
– R is set of roles where a role is tuple (NameR, C , B, D,Pc, I )where NameR is its identifier;C is the list of con-straints (obligations, requirements, skills); B is the list ofbenefits (abilities, authorization, profits); D is the list ofduties or responsibilities; Pc is the pattern of communi-cation or interaction; I is the list of useful information.
To complete the process-agent mapping, we also definesome notations, as follows: x .send(y,m) means agent xsends messagem to agent y; x .Start means agent x initiateshis state and/or work; x .Do(act)means agent x performs theactivity act ; x .Wait (t ime) means agent x has to wait for atime; x .End means agent x terminates his work.
We consider a lane or a pool without lane as a role. Agroup constitutes a context of interaction for agents. Hence,we consider two cases: (1) each pool with more than one lanebecomes a group; (2) for each message flow between twopools A and B, we create also a new group where the role Aand B can be played. Regarding agents, they are not givenby the BPMN diagram but by some additional information(comments) giving the number of occurrences of each roles.Thus,we just have to create asmuch agent by role as indicatedin the additional document.
Our mapping from process model to AGR model consistsfive steps, as follows.
123

Vietnam J Comput Sci (2017) 4:97–110 107
Table 7 Mapping frombusiness process to BDI-agentfor tsunami response plan
BPMN BDI-Agent
Step 1 OP (1) �(1) = (OP (1).name,P{},G{}, I {}, B{})
OP (2) �(2) = (OP (2).name,P{},G{}, I {}, B{})
Step 2 Pr(1) = OP (1).process �(1).P =(Pr(1).id, I n{}, Out{}, Script{})
Pr(2) = OP (2).process �(2).P =(Pr(2).id, I n{}, Out{}, Script{}
Step 3 Start event ⇓ P.I n �(1).P.I n+ =(OE
S (1).name, OES (1).t ype)
�(2).P.I n+ =(OE
S (2).name, OES (2).t ype)
Step 4 End event ⇓ P.Out �(1).P.Out+ =(OE
E (1).name, OEE (1).t ype)
�(2).P.Out+ =(OE
E (2).name, OEE (2).t ype)
Step 5 Embedded activity OASub →
P.Script invokeX
Step 6 Independent activity OASub →
P.Script addGoalX
Step 7 OAAt send message → P.Scriptsend
OEI,M (1) M(1) = (“msg′′
1 , OP (1),
OL (1), [msg_reg1])�(1).P.Script ← {send(M(1)}
OEI,M (2) M(2) = (“msg′′
2 , OP (1),
OL (1), [msg_reg2])�(1).P.Script ← {send(M(2)}
OES,M (1) �(2).P.Script ← {receive(M(1)}
OEI,M (3) �(2).P.Script ← {receive(M(2)}
Step 8 O properties → B
Data flow OP (1) properties �(1).B ← {OP (1).reg, OP (1).ans}OP (2) properties �(2).B ← {OP (2).reg, OP (2).ans}
Step 9
Control flow
Element Properties Assignment
OP (1) reg: String,
ans: String
OES,M (1) msg_reg: String
OES,M (2) msg_reg: String
OP (2) reg: String,
ans: String
OES,M (1) msg_ans: String
OES,M (3) msg_ans: String
1. In step 1, we identify the roles and groups extractedfrom BPMN diagram. Let us illustrate this step throughour tsunami response case study. We have the firstpool OP (1) where OP (1).name = “Institute of Geo-
physics′′ and it has no lane; therefore, we consider itas a role R(1). On the contrary, for the second poolOP (2) where OP (2).name = “Ho Chi Minh City′′, ithas six lanes: OL(1) (OL(1).name = “Local Adminis-
123

108 Vietnam J Comput Sci (2017) 4:97–110
tration′′), OL(2) (OL(2).name = “ Local Civil DefenceForces ′′), OL(3) (OL(3).name = “ CommunicationUnit ′′), OL(4) (OL(4).name = “ Military ′′), OL(5)(OL(5).name = “ Police ′′) and OL(6) (OL(6).name =“Health & Red Cross ′′). Thus, we transfer them, respec-tively, to six roles R(2), R(3), R(4), R(5), R(6) and R(7).All these six roles belong to group G(1).
2. In step 2, we obtain the information extracted from theArtefact elements to identify roles’ properties.
3. In step 3, by analyzing additional data, we identify theagents’ attributes such as their type, the number of agentsplaying a role, the number of agents belonging to a group,etc.
4. In step 4, we identify the communication or interactionprotocols between groups and create new possible groupsby analyzing message flows. In our case study, we createa new group G(2) based on the message flows betweentwo roles R(1) and R(2).
5. Finally, in step 5, we identify the roles’ activities by fol-lowing sequence flows.
As the result, we have two groups and seven roles withtheir attributes and interactions, as shown in Table 8 (seeAppendix). R(2) is the only role which belongs to twogroups.
4 Related works
In [11], authors highlight the software engineering ben-efits of differentiating agent aspect (the Agent-CentredMulti-Agent System or ACMAS) from social aspect (theOrganization-Centred Multi-Agent System or OCMAS).They presented the essential drawbacks which cannot besolved with ACMAS. Instead of using ACMAS, Ferber etal. attempt to view complex system under the eye of orga-nizational structure. They propose the Agent/Group/Rolemeta-model (AGR) as a means to combine efficiently thesetwo aspects in a uniform framework. In our work, we use thismeta-model as the destination of the process-agent mapping.
In [10], Endern et al. described the mapping from BPMNto agents using an agent-centred approach (ACMAS). Theagents are represented according to the Believe-Desire-Intention (BDI) type, which is in our opinion not fullycompliant with BPMN model where the notion of goal andintention are not given. Authors consider that sub-processesdetermine goals which in our point of view is a strongassumption. They also do not count on the lane conceptduring the mapping. In our approach, we do not use anACMAS approach since we believe that an organizationalview (OCMAS) [11] is more compliant with BPMN.
In [6,7], the authors presented a model to text transforma-tion (M2T), from BPMN model to a specific agent-oriented
language (JADE). This work is too much specific so thatwe cannot extend it to other languages. On the contrary, wefollow amodel tomodel approach (M2M). Thus, the destina-tion model (AGR) can be implemented by any agent-basedlanguage.
In [8,9], Onggo introduced a BPMN pattern used to rep-resent agent-based models. He developed specific BPMNdiagrams to describe activities of agents according to anACMAS approach. In our work, we can use an arbitraryBPMNdiagram andmap it to the corresponding agentmodel,based on an OCMAS approach.
In [12], the authors described the mapping from BPMNmodels to Alvis language to formally verify these models.However, the transformation which focuses on the activitiesforgets the organizational structure.
Concerning the organization assessment, Grossi et al. in[13] proposed a set of equations to evaluate organizationalstructure based on the Role graph with three dimensions:power, coordination and control. Comparing the results withstandard values, we can determine the robustness, flexibilityand efficiency of our organization. All these metrics can beperformed in our Graph Role as we have demonstrated it in[2].
In [14], the author presented a metric to measure control-flow complexity of a workflow or a process. He alsosuggested other metrics such as Activity Complexity, Data-Flow Complexity, and Resource Complexity. These metrics,combined with the equations of Role graph [2,13], can helpus determine the quality of a coordination plan according totwo points of view: process and organization.
5 Conclusion
In this paper, we have introduced an approach to map fromprocess models (Petri Net, BPMN) to organization models(Role graph, ACMAS, OCMAS). Combining several viewsof the same plan enables the authorities to benefit from theadvantages of each representation. This work is the first steptowards a visualization and assessment platform for CrisisManagement. In a future research, wewill continue on devel-oping the assessment part of the different models, illustratedin this paper, using a set of static and dynamic metrics.
Open Access This article is distributed under the terms of the CreativeCommons Attribution 4.0 International License (http://creativecommons.org/licenses/by/4.0/), which permits unrestricted use, distribution,and reproduction in any medium, provided you give appropriate creditto the original author(s) and the source, provide a link to the CreativeCommons license, and indicate if changes were made.
Appendix: Mapping table
See Table 8.
123

Vietnam J Comput Sci (2017) 4:97–110 109
Table 8 Mapping process model to AGR model for tsunami response plan
BPMN AGR Applied to HCMC plan
Step 1: Identify roles and groups OP (1) has nolane
R(1) = (OP (1).name,C{}, B{}, D{}, Pc{}, I {}) Institute of geophysics
OP (2) has 6lanes
R(2) = (OL (1).name,C{}, B{}, D{}, Pc{}, I {}) Local administration
R(3) = (OL (2).name,C{}, B{}, D{}, Pc{}, I {}) Local civil defence forces
R(4) = (OL (3).name,C{}, B{}, D{}, Pc{}, I {}) Communication unit
R(5) = (OL (4).name,C{}, B{}, D{}, Pc{}, I {}) Military
R(6) = (OL (5).name,C{}, B{}, D{}, Pc{}, I {}) Police
R(7) = (OL (6).name,C{}, B{}, D{}, Pc{}, I {}) Health and Red Cross
G(1) = (OP (2).name, {R(2), R(3), R(4), R(5), R(6), R(7)}) Ho Chi Minh City
Step 2: Identify Roles’ Propertiesby examining artefacts
Step 3: Identify agents by readingadditional data
A(i) = (Name, T ype, Rs(i),Gs(i))
Rs(i) = {Rk : Nbk , Rk+1 : Nbk+1, ...}Gs(i) = {G j ,G j+1, ...}
Step 4: Identify communicationbetween groups and create newgroup based on message flow
FM (1) R(1).Pc ← {send(R(2), FM (1).msg)} Message: Tsunami Start
R(2).Pc ← {receive(R(1), FM (1).msg)}FM (2) R(1).Pc ← {send(R(2), FM (2).msg)} Message: Tsunami End
R(2).Pc ← {receive(R(1), FM (2).msg)}G(2) = (FM (1, 2).msg, {R(1), R(2)})
Step 5: Identify Roles’ activitiesbased on sequence flow
FS(1), FS(2) R(1).D ← {Start, Do(OAAt (1))}, {Do(OA
At (2))}, T1: Detect Tsunami risk
FS(4), FS(5) R(1).D ← {Wait (OEI,T (1))}, {Do(OA
At (3))} T2: Inform Tsunami start
Timer event
FS(6), FS(8) R(1).D ← {Do(OAAt (4))}, {End} T14: Detect Tsunami end
... ... T15: Inform Tsunami end
End event
References
1. Le, N.N.T., Hanachi, C., Stinckwich, S., Vinh, H.T.: Representing,simulating and analysing HoChiMinh City tsunami plan bymeansof processmodels. In: ISCRAMVietnam (Information Systems forCrisis Response and Management) (2013)
2. Le, N.N.T., Hanachi, C., Stinckwich, S., Vinh, H.T.: Combiningprocess simulation and agent organizational structure evaluation inorder to analyze disaster response plans. In: 9th International KESConference on Agents and Multi-Agent Systems—Technologiesand Applications (2015)
3. Bénaben, F., Hanachi, C., Lauras, M., Couget, P., Chapurlat, V.: Ametamodel and its ontology to guide crisis characterization and itscollaborative management. In: Proceedings of the 5th InternationalConference ISCRAM (2008)
4. Viorica Epure, E., Martin-Rodilla, P., Hug, C., Deneckere, R.,Salinesi, C.: Automatic process model discovery from textualmethodologies. In: Research Challenges in Information Science(RCIS), IEEE 9th International Conference (2015)
5. Van der Aalst, W.M.P.: Process mining: discovery, conformanceand enhancement of business processes. In: Springer PublishingCompany Incorporated, ISBN 978-3-642-19345-3 (2011)
6. Küster, T., Lützenberger, M., Heßler, A., Hirsch, B.: Integratingprocess modelling into multi-agent system engineering. In: Mul-tiagent and Grid Systems, vol. 8, no. 1, pp. 105–124. IOS Press,Amsterdam (2012)
7. Küster, T., Heßler, A., Albayrak, S.: Towards process-orientedmodelling and creation of multi-agent systems. In: EngineeringMulti-Agent Systems, pp. 163–180. Springer, New York (2014)
8. Onggo, B.S.S.: BPMN pattern for agent-based simulation modelrepresentation. In: Winter Simulation Conference (WSC), pp. 1–10. IEEE (2012)
9. Onggo,B.S.S.:Agent-based simulationmodel representation usingBPMN. In: Formal Languages for Computer Simulation: Transdis-ciplinary Models and Applications, pp. 378–399 (2013)
10. Endert, H., Küster, T., Hirsch, B., Albayrak, S.: Mapping BPMNto agents: an analysis. In: Agents, Web-Services, and OntologiesIntegrated Methodologies, pp. 43–58 (2007)
123

110 Vietnam J Comput Sci (2017) 4:97–110
11. Ferber, J., Gutknecht, O., Michel, F.: From agents to organizations:an organizational view of multi-agent systems. In: Agent-OrientedSoftwareEngineering IV: 4th InternationalWorkshop,AOSE2003,Melbourne, Australia, pp. 214–230. Springer, Berlin, Heidelberg(2004)
12. Szpyrka, M., Nalepa, G. J., Ligeza, A., Kluza, K.: Proposal of for-mal verification of selected BPMN models with Alvis modelinglanguage. In: Intelligent Distributed Computing V: Proceedings ofthe 5th International Symposium on Intelligent Distributed Com-puting - IDC 2011, Delft, the Netherlands, pp. 249–255. Springer,Berlin, Heidelberg (2012)
13. Grossi, D., Dignum, F., Dignum, V., Dastani, M., Royakkers, L.:Structural aspects of the evaluation of agent organizations. In:Coordination,Organizations, Institutions, andNorms inAgent Sys-tems II, pp. 3–18. Springer-Verlag, New york (2007)
14. Cardoso, J.: Business process control-flow complexity: metric,evaluation, and validation. In: International Journal of Web Ser-vices Research (IJWSR), vol. 5, no. 2, pp. 49–76. IGI Global, USA(2008)
123