Embed Size (px)
Citation preview

Discovering Geomagnetic Disturbance Patterns forSynchrophasor-based Event Prediction in Québec:A Knowledge-based approach to Understanding PMU DataNASPI/ISGAN International Synchrophasor Symposium – March 2016
IREQ, Hydro-Québec: Luc Cauchon, Sebastien Guillon (HQ), Martin De Montigny, Innocent KamwaIBM Research: Chumki Basu, Manikandan Padmanaban

2
Agenda
Introduction: Situational awareness for the power grid
Brief history of wide-area measurements at Hydro-Québec (SMDA)
Overview of Wide-Area Situational Awareness System (WASA)
Advanced capabilities of WASA
References

3
Situational awareness for the power grid
Since 2012, Hydro-Québec and IBM Research have been collaborating on in situ network of synchrophasors (WASA)
But first, let’s review how it all began with SMDA– HQ was the pioneer in angle shift measurement system (wide-area measurements)

4
Hydro-Québec leadership in PMU space (1976-2004)
Year (version)Synchronizing
Signal (Accuracy)
# of PMUs Rate (Hz) Data concentrator features
1976 (0.0) LC (46 s) – 1 degreeelectrical angle
2 1 Custom database
1981 (3.0) GEOS 3 30 4000 records possible
1988 (4.0) IRIG-B (20 s)
4 60 1) Central unit on a HP-1000computer. Visualization on a suncomputer using a X-Windowsbased multi-users operating system2) Voltage asymmetry computation3) New “Raima” database with10,000 records of angle and 600records of voltage asymmetry
1991 (4.0) IRIG-B (20 s)
8 60 4 more PMUs
1995 (4.0) IRIG-B (20 s) 8 60 Computation of bus voltage harmonic content up to the 10th
1998 (4.1) IRIG-B (20 s) 8 60 Continuous record up to 6 months
2004 (5.0) GPS (1 s) 8 (10 in 2008) 60 Change from IREQ-made PMU to Macrodyne commercial PMU. Change from Raima to ORACLE database.
Table from: I. Kamwa, J. Beland, G. Trudel, R. Grondin, C. Lafond, and D. McNabb. “Wide-area Monitoring and Control: Past, Present, and Future,” in Proceedings of the IEEE Power & Energy Society General Meeting, Montreal, Quebec, July, 2006.

5
SMDA (version 5.0)
Acquisition Unit Administration and Monitoring
6
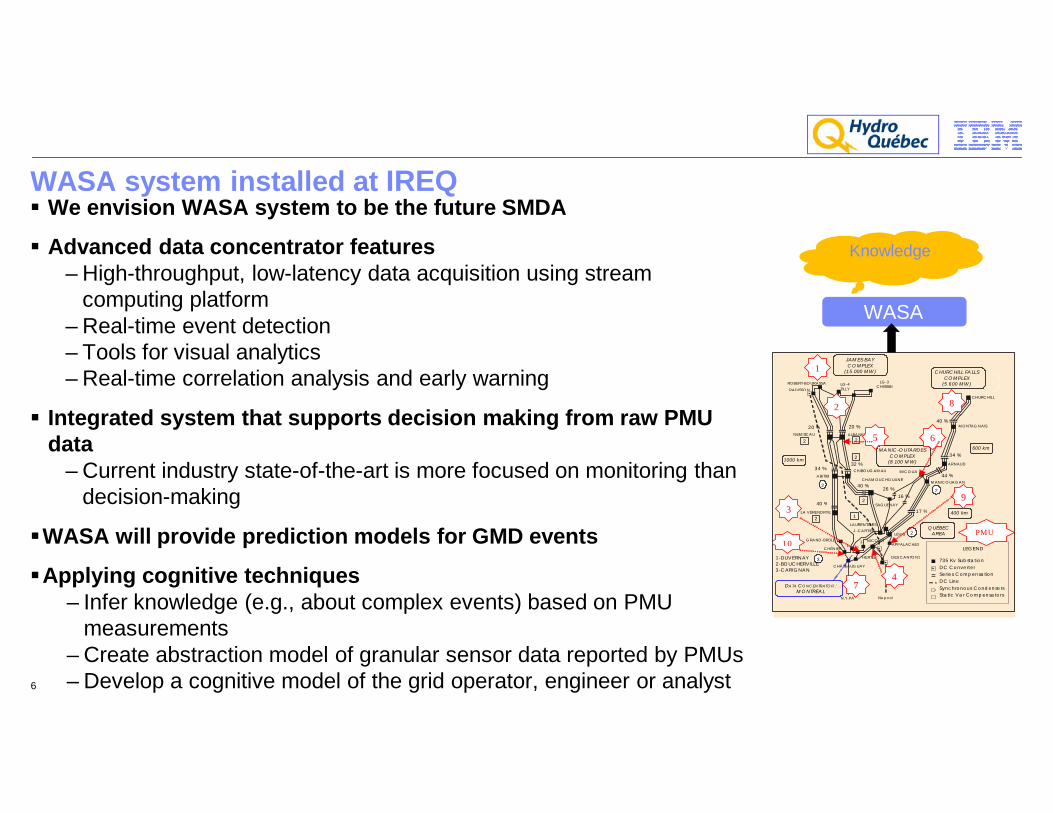
WASA system installed at IREQ We envision WASA system to be the future SMDA
Advanced data concentrator features– High-throughput, low-latency data acquisition using stream
computing platform– Real-time event detection– Tools for visual analytics– Real-time correlation analysis and early warning
Integrated system that supports decision making from raw PMU data
– Current industry state-of-the-art is more focused on monitoring thandecision-making
WASA will provide prediction models for GMD events
Applying cognitive techniques– Infer knowledge (e.g., about complex events) based on PMU
measurements– Create abstraction model of granular sensor data reported by PMUs– Develop a cognitive model of the grid operator, engineer or analyst
J.-CARTIER
M ANICOUAGAN
600 km
CHURCHILL FALLS COMPLEX
(5 600 MW )
JAMES BAY COMPLEX
(15 000 MW )
MANIC-OUTARDES COMPLEX
(8 100 MW) 34 %
MONTAG NAIS
CH URCHILL
AR NAUD
MICOUACH IBOUG AM AU
R ADISSON
NEMISCAU
LG-4 TILLY
LG-3 CHISSIBI
ROBERT-BOUR ASSA
Nepool
DES CANTONS
APP ALACHES
LÉVIS
CHÂTEAUGUAY
CHÉNIER
ALBANEL
ABITIBI
GRAND-BRÛLÉ
CH AM OUCHOUANE
SAGUENAY
LAURENTIDES
LA VÉRENDRYE
2 2
2
2
1
2
20 % 20 %
32 % 34 %
40 % 26 %
17 %
16 %
44 %
40 %
2
2
3
2
LEGEND 735 Kv Substation DC Converter Series Compensation DC Line Synchronous Condensers Static Var Compensators
1- DUVERNAY 2- BOUCHERVILLE 3- CARIGNAN
N.Y.PA
DATA CONCENTR ATOR : MONTRÉAL
QUÉBEC AREA
NICOLET
1000 km
400 km
1 2
3
40 %
HERTEL
1
8 2
4
3
5 6
7
PMU
9
10
WASA
Knowledge

7
Advanced capabilities of WASA
1. Localize fault for a complex event by drilling down on PMU data
2. High-level summarization of grid data
3. Generate early warnings for geomagnetic disturbances (GMDs)

8
Capability 1 – Post-event fault localization in the control room
Replay SelectedEvent
ConductPost-Event
FaultLocalization
Retrieve Events Drill down onTime Window Filter by PMU
Search Basic Event
by Date
Select Event (toPlayback Charts)
Expand Slider on Frequency Chart
Toggle RadioButtons on Phase
Angle Chart
Leaf-level boxes in cognitive task analysis chart above are associated with user “actions” in WASA system.

9
Capability 1 – Search events
GIS Map View and Search Panel in WASA system
10
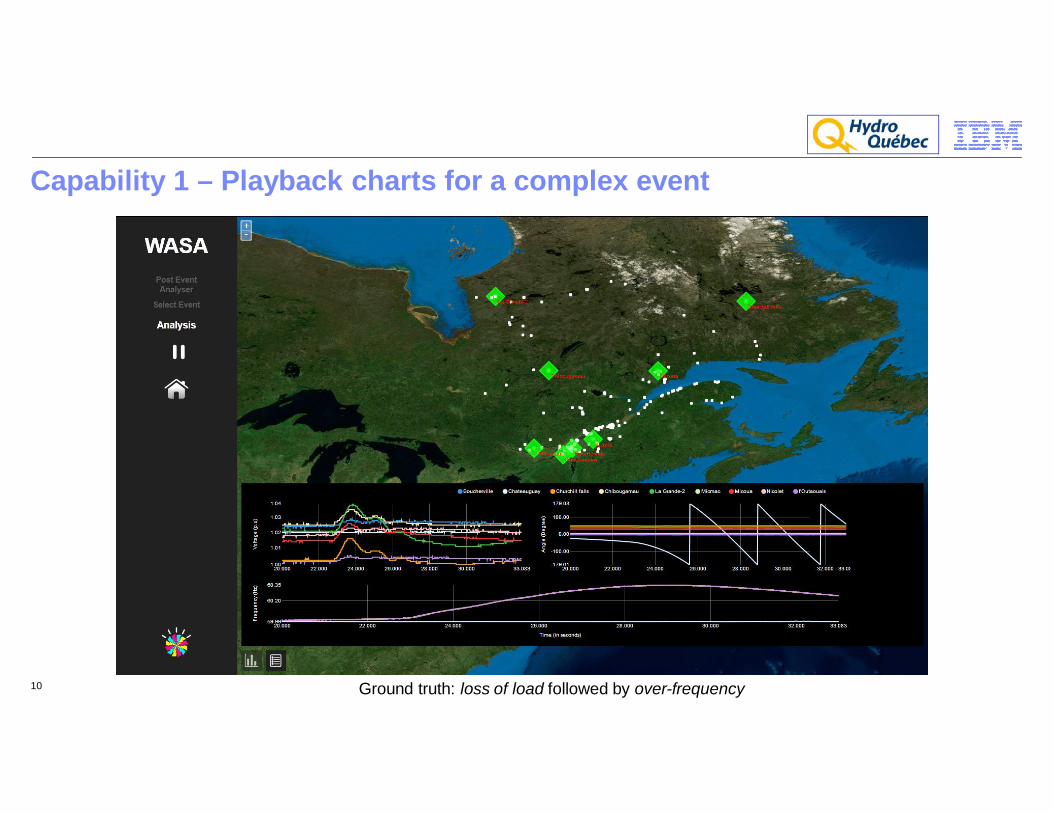
Capability 1 – Playback charts for a complex event
Ground truth: loss of load followed by over-frequency

11
Capability 1 – Adjust focus of attention
Slider window can be adjusted to shift focus of attend on increase in frequency (top) and sharp fluctuation in phase angle (bottom).

12
Capability 1 – Toggle PMU measurements to isolate behaviors

Capability 2 – High-level summarization of grid events
13
Filter events
What are low probability events during the year?

Predictive Analytics
Analysis
Real-timeCorrelation
Analysis
Early WarningAlerts
Real-time Visualization
Other Sources …
Geo-magnetic andElectric Field
PMU
Continuous Data Feeds
Descriptive Analytics
Data Ingestion& Alignment
Event Detection &
Categorization
Capability 3 – Real-time prediction for geomagnetic disturbances (GMDs)
• Utilities primarily rely on forecasted / actual values of magnetic activity (indices) but do not couple with grid activity automatically
• We bring in new data sources and correlate with PMU data, relaxing the constraints of strict time alignment
14

Capability 3 – Example model: correlating geomagnetic/electric and grid behaviors
15
Hypothesis: Geomagnetic/geoelectric field data are good predictors of GMD-related harmonics activity on the gridand can be used to alert operators in advance of large-scale events
B-field vs. Time (5 Hours)E-field vs. Time (5 Hours)
Even Harmonics vs. Time (30 mins) Fourth Harmonics vs. Time (30 mins)

Capability 3 – Example model: using predictions to enable mitigating actions (cont.)
Low Severity Alert
Grid EventsHigh Severity
Alert
Minutes
Ey during Low & High Severity Alerts
16
We find that Ey is a good predictor of grid activity during a GMD.

17
Take-aways …
PMUs provide operators data, but they do not provide operators knowledge
Knowledge of the past (post-event analysis), present and future (real-time early warnings) enables better decision making
In addition, we are using machine learning techniques to find richer relationships/patterns across multiple data sources (space weather) for robust GMD prediction

18
References C. Basu, M. Padmanaban, S. Guillon, L. Cauchon, M. De Montigny, I. Kamwa. Situational Awareness for the Electric Power Grid, IBM
Journal of Research and Development, Special Issue on “Smarter Energy”, January/February, 2016.
C. Basu, M. Padmanaban, S. Guillon, M. De Montigny, and I. Kamwa. Combining Multiple Sources of Information for Situational Awareness of Geomagnetic Disturbances. Proceedings of the IEEE Power & Energy Society General Meeting, Denver, CO, July 2015.
C. Basu. PMU-based Wide-Area Situational Awareness. Presented at panel on “Smart Grid Innovation in an Integrated Utility Framework”, at IEEE Power & Energy Society Innovative Smart Grid Technologies (ISGT) Conference – North America, Washington, D.C., February 2015.
C. Basu, A. Agrawal, J. Hazra, A. Kumar, D. P. Seetharam, J. Beland, S. Guillon, I. Kamwa, and C. Lafond. Understanding Events for Wide-Area Situational Awareness, Proceedings of IEEE Power & Energy Society Innovative Smart Grid Technologies (ISGT) Conference - North America, Washington, D.C., February 2014.
PMU References
I. Kamwa, J. Beland, G. Trudel, R. Grondin, C. Lafond, and D. McNabb. Wide-area Monitoring and Control: Past, Present, and Future, in Proceedings of the IEEE Power & Energy Society General Meeting, Montreal, Quebec, July, 2006.
G. Missout, J. Beland, G. Bedard, Y. Lafleur. Dynamic Measurement of the Absolute Voltage Angle on Long Transmission Lines, IEEE Transactions on Power Apparatus and Systems, Vol. PAS-100, No. 11 November 1981.
I. Kamwa, R. Grodin, Y. Hebert. Wide-Area Measurement Based Stabilizing Control of Large Power Systems – A Decentralized / Hierarchical Approach, IEEE Transactions on Power Systems, Vol. 16, No. 1, February 2001.
I. Kamwa, PMU-Based Vulnerability Assessment Using Wide-Area Severity Indices and Tracking Modal Analysis, PSCE 2006.
I. Kamwa, S. R. Samantaray, and G. Joos. Compliance Analysis of PMU Algorithms and Devices for Wide-Area Stabilizing Control of Large Power Systems. IEEE Transactions on Power Systems. Vol. 28, No. 2, May 2013.