Embed Size (px)
Citation preview
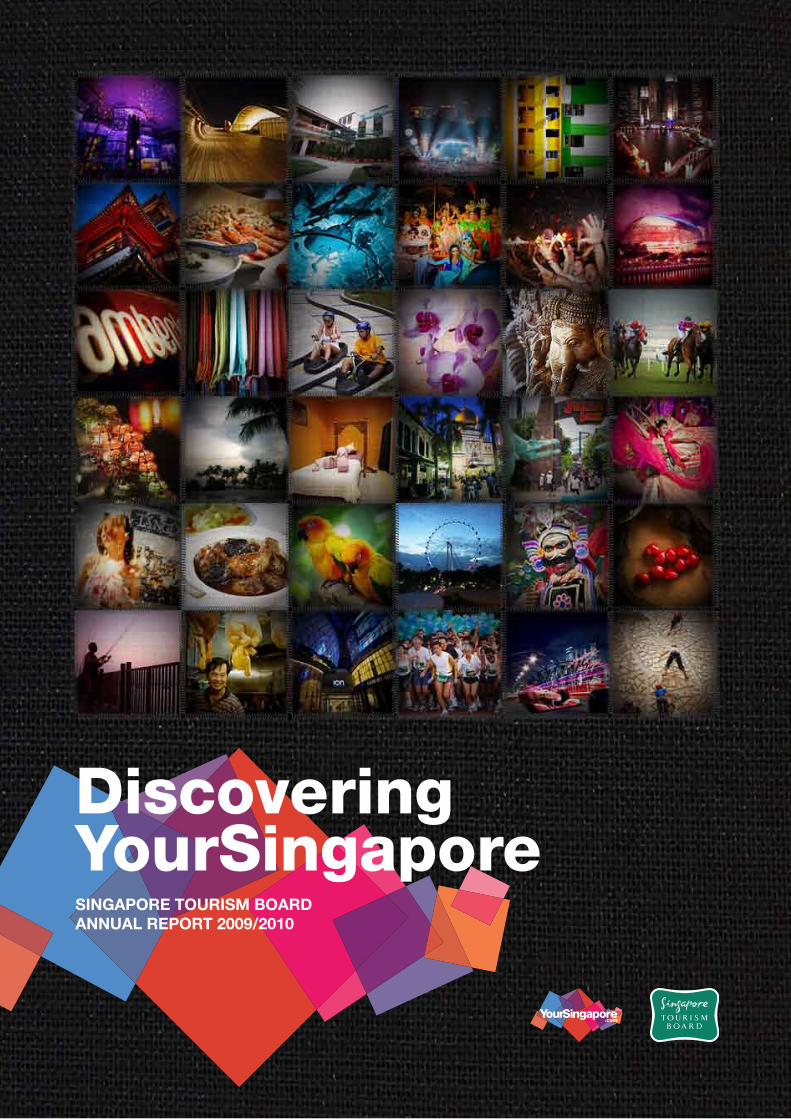
DiscoveringYourSingaporeSINGAPORE TOURISM BOARD ANNUAL REPORT 2009/2010

Contents
01
Vision & Mission
05
Chief Executive’s Message
31
Awards & Accolades
07
Board of Directors
10
Tourism Sector Performance
03
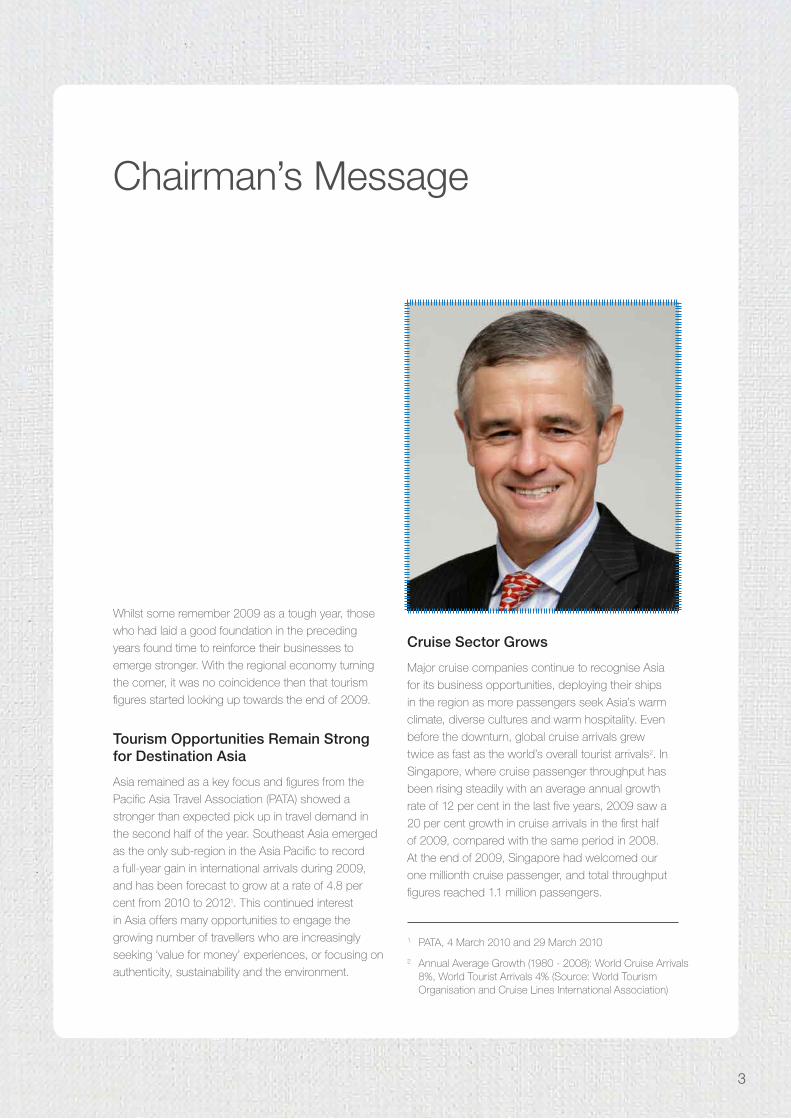
Chairman’s Message
19
Event Highlights
39
Financial Statements
33
Corporate Governance

VISION To be a leading economic development agency in tourism, known for partnership, innovation and excellence
MISSIONWe champion tourism and build it into a key economic driver for Singapore
VALUES
Integrity: Do the Right Thing!
We are fair, honest and trustworthy, inspiring trust and confidence.
Team: Succeed together
United in purpose, we accomplish more together.
Courage: 3D – Dare, Dream, Do!
We dare to dream, experiment and boldly execute our ideas.
Care: Appreciate One Another
We respect, nurture and have compassion for one another. We care for ourselves and our community.
Passion: Love it!
We are energetic and driven, believing in our purpose and loving what we do.
Fun: It’s Our Attitude
We seize each day with enthusiasm. We are optimistic about our future.
Vision & Mission
1
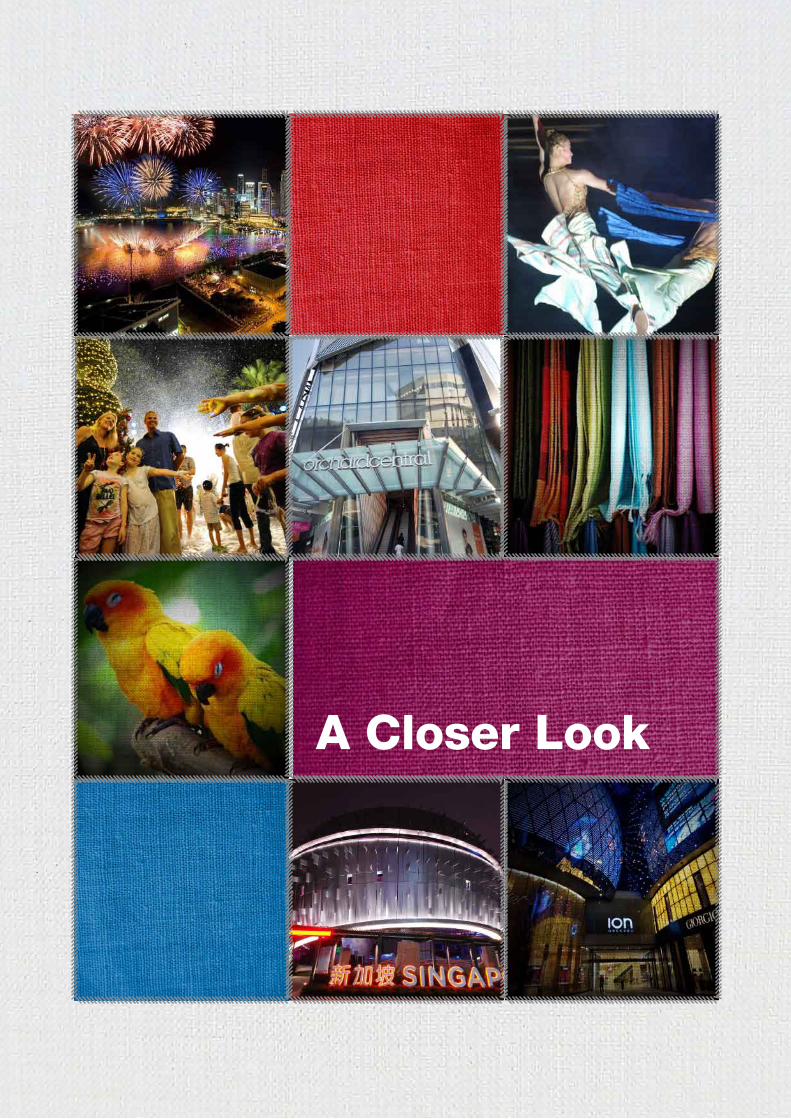
A Closer Look
Whilst some remember 2009 as a tough year, those
who had laid a good foundation in the preceding
years found time to reinforce their businesses to
emerge stronger. With the regional economy turning
the corner, it was no coincidence then that tourism
figures started looking up towards the end of 2009.
Tourism Opportunities Remain Strong for Destination Asia
Asia remained as a key focus and figures from the
Pacific Asia Travel Association (PATA) showed a
stronger than expected pick up in travel demand in
the second half of the year. Southeast Asia emerged
as the only sub-region in the Asia Pacific to record
a full-year gain in international arrivals during 2009,
and has been forecast to grow at a rate of 4.8 per
cent from 2010 to 20121. This continued interest
in Asia offers many opportunities to engage the
growing number of travellers who are increasingly
seeking ‘value for money’ experiences, or focusing on
authenticity, sustainability and the environment.
Cruise Sector Grows
Major cruise companies continue to recognise Asia
for its business opportunities, deploying their ships
in the region as more passengers seek Asia’s warm
climate, diverse cultures and warm hospitality. Even
before the downturn, global cruise arrivals grew
twice as fast as the world’s overall tourist arrivals2. In
Singapore, where cruise passenger throughput has
been rising steadily with an average annual growth
rate of 12 per cent in the last five years, 2009 saw a
20 per cent growth in cruise arrivals in the first half
of 2009, compared with the same period in 2008.
At the end of 2009, Singapore had welcomed our
one millionth cruise passenger, and total throughput
figures reached 1.1 million passengers.
Chairman’s Message
1 PATA, 4 March 2010 and 29 March 2010
2 Annual Average Growth (1980 - 2008): World Cruise Arrivals 8%, World Tourist Arrivals 4% (Source: World Tourism Organisation and Cruise Lines International Association)
3

Asia Pacific Hotels Hold Their Ground
Interesting trends also emerged in the region’s
hospitality sector, as hotels saw a return in consumer
confidence. At the close of 2009, the Asia Pacific
region was the first to report a rise in RevPAR3.
In Singapore, the hotel sector was certainly buoyant.
Park Hotel Clarke Quay, Wangz, klapsons The
Boutique Hotel, Nostalgia and four hotels in Resorts
World Sentosa started operations. M&C Hotels also
announced their plans to open Studio M in 2010
while work continued on Grand Park Orchard and
Shangri-La Rasa Sentosa started on their upgrade.
Confidence in Singapore
There is now a palpable sense of optimism and
confidence in Singapore among the industry.
Most visibly, one of the most dramatic changes to
the tourism landscape is the opening of the two
Integrated Resorts. Even before they opened, the two
developments generated much buzz in and beyond
Singapore. The world-class offerings of the two IRs
have, without doubt, bolstered Singapore’s appeal
as a must-visit destination. For instance, FutureBrand
ranked Singapore as the fourth Top Country Brand
for tourism travel in the Asia Pacific region (November
2009), and among the top country brands for
business, shopping, fine dining and ease of travel.
In November 2009, Singapore officially emerged
from the recession. Visitor arrivals registered positive
growth in the last quarter of 2009 and this continued
into 2010 with three consecutive months of record
visitor arrivals from January to March 2010. The
STB expects this positive trend to continue. This is
supported by UNWTO’s projections which indicate
that international tourism arrivals will grow by 3 to 4
Mr Simon IsraelChairman, Singapore Tourism Board
per cent in 2010, with Asia leading this trend with a
growth of at least 5 per cent.
I take this opportunity to thank the STB’s Board of
Directors for their leadership as well as our industry
partners for their continuous support. For their
tireless contributions, I would especially like to thank
Lim Neo Chian, Chong Siak Ching, Scott Blume
and Philip Jeyaretnam who stepped down from the
Board in 2009, and bid a warm welcome to Diana
Ee-Tan and Vinodh Coormaraswamy who joined the
Board in January 2010. Lastly, I know I join many
in remembering Ken Low, STB’s Assistant Chief
Executive for the Marketing Group, who passed
away in July 2010, and who inspired us to explore
new horizons and set new benchmarks in the global
tourism industry.
I wish you an exciting journey of self-discovery as we
embark on a YourSingapore adventure.
3 STR Global report for year-end 2009 and December 2009 (Asia-Pacific), 26 Jan 2010
Chairman’s Message
4

For all its challenges, 2009 gave the world a preview of the upcoming changes to Singapore’s tourism landscape. Travellers who took the opportunity to visit Singapore last year also found new experiences and special memories to take back home.
We finished the year with 9.7 million visitors, exceeding the year’s forecast of 9-9.5 million visitors, while the S$12.4 billion tourism receipts from January to December 2009 reached the upper-bound of our S$12-S$12.5 billion forecast.
Improving and Redesigning the Experience
Orchard Road, the heart of Singapore shopping, was relaunched after a year of infrastructural enhancements, together with an exciting new brand proposition Orchard Road – A Great Street. With new players like ION Orchard, 313@Somerset, and Orchard Central upping the game, existing mall owners such as Centrepoint, Mandarin Gallery and Paragon were quick to revamp store facades and improve the retail mix of familiar favourites to stay ahead.
The events calendar was amped up to new levels. The Singapore GP Season broke new ground to rock the Singapore music scene with the inaugural F1 ROCKS SingaporeTM which attracted a live audience
of 27,000 fans, with broadcast shows seen by another 26 million viewers.
STB also launched the inaugural Singapore Experience Awards to honour the stars and role models across the whole spectrum of the tourism sector, from hospitality, retail, dining, entertainment, attractions, business travel and MICE, education and healthcare sectors.
Collaboration and Action
None of this would have been possible without the travel industry’s enthusiasm and commitment, particularly as everyone pulled together during a difficult 2009.
While industry members worked tirelessly to introduce new experiences, they also partnered STB to market Singapore overseas and locally. One of the most impactful collaborations was the S$90 million initiative, Building on Opportunities to Strengthen Tourism, or more well-known as BOOST. The initiative saw STB joining hands with Singapore Airlines and the Changi
Chief Executive’s Message
5

Airport Group to push free-and-easy holidays and stopovers in Singapore.
There was also a domestic facet to BOOST. As part of 2009 Reasons to enjoy Singapore, industry partners attracted 12,000 Singapore residents to visit hidden gems such as the Kranji countryside, as well as popular attractions such as the Singapore Flyer, Sentosa, National Museum and Jurong Bird Park. Together with industry-led programmes by the Association of Singapore Attractions and the National Heritage Board, these initiatives helped to maintain a 15.7 million visitor volume at our attractions.
The tourism industry also forged strong partnerships to sustain a dynamic MICE eco-system. Working closely together, our MICE team secured over 20 new business events to ensure a pipeline of business in the coming years. Foreign attendance at events remained healthy and new MICE players such as Europa Organization Asia and the Journal of Commerce, sensing the business opportunities in Asia, entered the market.
The same collaborative spirit was in action when the world’s leaders converged onto the island for APEC 2009 in November. Without sounding immodest, the success of this high-profile event underscored why Singapore continued to be rated as a top city for meetings.
Embracing the future
Tough and exciting as last year was, we also knew we needed to lay the ground for Singapore’s tourism future to ensure that tourism continues to be a key economic driver. STB commenced on Tourism Compass 2020, a new roadmap for future tourism development, to identify and capitalise on emerging opportunities. Members of the public were also invited to send in their comments and ideas.
Moving ahead
By the end of 2009, the industry was all geared up in anticipation of two significant tourism projects. Resorts World Sentosa, with Universal Studios Singapore, was ready to start operations in early 2010, to be followed closely by Marina Bay Sands later in the new year. Both were poised to generate worldwide publicity and boosting Singapore’s position as an entertainment capital.
With the changing media landscape having an impact on consumer travel behaviour, it was also timely for us to review the destination brand and our destination marketing strategies. YourSingapore underpins Singapore’s concentrations of sights, sounds, tastes, culture and attractions while resonating with the digital generation. YourSingapore is about today’s travelers and their quest for a personal experience on one’s own terms and at one’s own pace. YourSingapore represents a bold step in destination marketing and it invites visitors to immerse themselves in the adventure of discovering Singapore and to experience the city their way. In doing so, we too discover a little more of ourselves as a destination.
There is still much work to be done to create a strong tourism engine for Singapore. But it is with confidence and hope that I look forward to the days ahead, buoyed by the knowledge that we have built a strong foundation to support our common vision.
Ms Aw Kah PengChief Executive, Singapore Tourism Board
Chief Executive’s Message
6

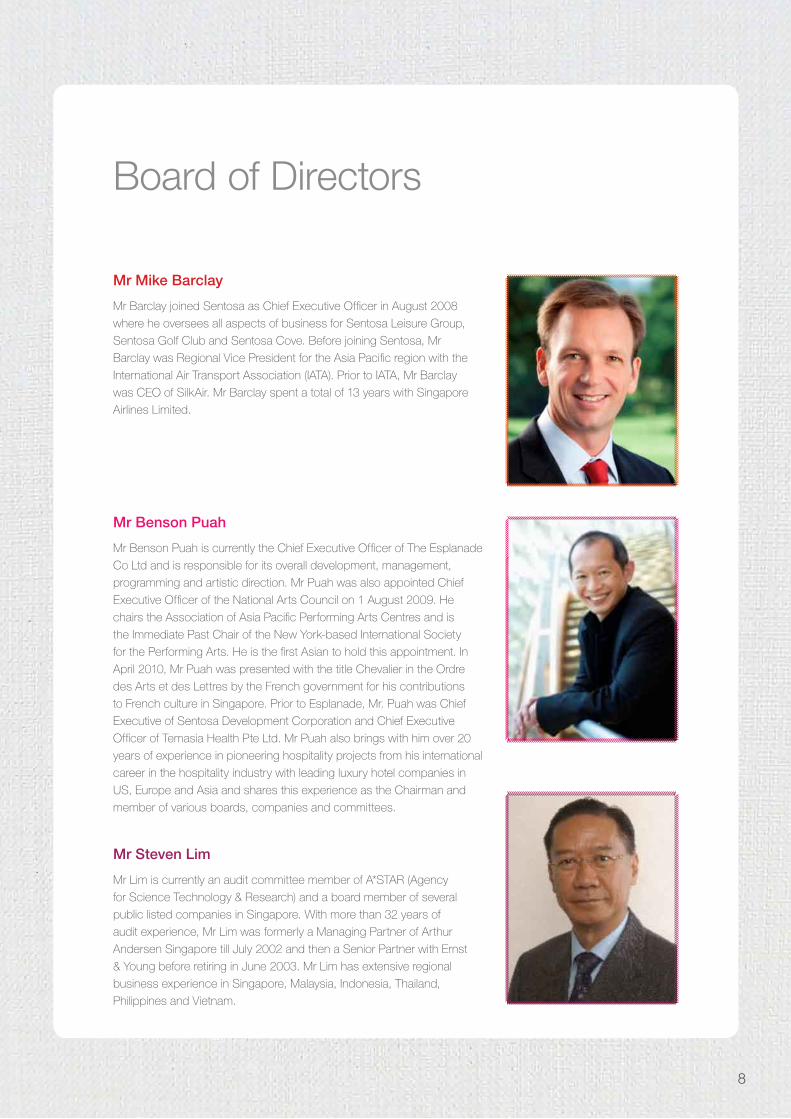
Board of Directors
Mr Aubeck Kam
Mr Kam holds the position of Deputy Secretary in the Ministry of
Manpower (MOM)*. He has previously held senior government positions
in trade and security. As Director of Trade in the Ministry of Trade &
Industry (MTI), he was involved in FTA negotiations. He served as the
Director of Operations for the Singapore Police Force, holding the rank of
Senior Assistant Commissioner. Mr Kam is also Deputy Chairman of the
Central Provident Fund Board.
*With effect from 1 November 2010, Mr Kam has stepped down as Deputy Secretary in the
Ministry of Manpower (MOM) and was appointed Chief Executive of the Media Development
Authority (MDA).
Ms Aw Kah Peng
Ms Aw Kah Peng was appointed Chief Executive of the STB
effective 1 January 2009. Ms Aw has a strong record of local
and international experience gained during her 17 years at the
Singapore Economic Development Board and before that with the
Singapore Institute of Standards and Industrial Research. She is
also a board member of the Sentosa Development Corporation,
Singapore GP Pte Ltd and Wildlife Reserves Singapore Pte Ltd. In
addition, she is a council member of the National Arts Council.
Mr Simon Israel
Mr Israel assumed the appointment of Chairman Singapore Tourism
Board (STB) in January 2005. Mr Israel is presently an Executive Director
of Temasek Holdings (Private) Limited, the Singapore-headquartered
investment firm, since July 2006. He is Chairman of Asia Pacific
Breweries Ltd and Asia Pacific Breweries Foundation and a Director
of Neptune Orient Lines Limited and Singapore Telecommunications
Limited. Mr Israel was Chairman of Asia Pacific of the Danone Group.
Prior to this, he worked across the Asia Pacific region in a 22-year career
with Sara Lee Corporation.
7
Board of Directors
Mr Benson Puah
Mr Benson Puah is currently the Chief Executive Officer of The Esplanade
Co Ltd and is responsible for its overall development, management,
programming and artistic direction. Mr Puah was also appointed Chief
Executive Officer of the National Arts Council on 1 August 2009. He
chairs the Association of Asia Pacific Performing Arts Centres and is
the Immediate Past Chair of the New York-based International Society
for the Performing Arts. He is the first Asian to hold this appointment. In
April 2010, Mr Puah was presented with the title Chevalier in the Ordre
des Arts et des Lettres by the French government for his contributions
to French culture in Singapore. Prior to Esplanade, Mr. Puah was Chief
Executive of Sentosa Development Corporation and Chief Executive
Officer of Temasia Health Pte Ltd. Mr Puah also brings with him over 20
years of experience in pioneering hospitality projects from his international
career in the hospitality industry with leading luxury hotel companies in
US, Europe and Asia and shares this experience as the Chairman and
member of various boards, companies and committees.
Mr Mike Barclay
Mr Barclay joined Sentosa as Chief Executive Officer in August 2008
where he oversees all aspects of business for Sentosa Leisure Group,
Sentosa Golf Club and Sentosa Cove. Before joining Sentosa, Mr
Barclay was Regional Vice President for the Asia Pacific region with the
International Air Transport Association (IATA). Prior to IATA, Mr Barclay
was CEO of SilkAir. Mr Barclay spent a total of 13 years with Singapore
Airlines Limited.
Mr Steven Lim
Mr Lim is currently an audit committee member of A*STAR (Agency
for Science Technology & Research) and a board member of several
public listed companies in Singapore. With more than 32 years of
audit experience, Mr Lim was formerly a Managing Partner of Arthur
Andersen Singapore till July 2002 and then a Senior Partner with Ernst
& Young before retiring in June 2003. Mr Lim has extensive regional
business experience in Singapore, Malaysia, Indonesia, Thailand,
Philippines and Vietnam.
8

Board of Directors
Mr Patrick Pitcher
Director of companies, including CEO Patrick Pitcher Consultancy,
Chairman of Group Edge a marketing communications company with
offices in Vietnam and Thailand and Chairman of MBMG Group a
financial services company headquartered in Thailand. Previously Mr
Pitcher was CEO Asia Pacific and worldwide board director for Saatchi &
Saatchi. He was also CEO JWT Asia Pacific South. During his 15 years in
the Asia Pacific region he has gained in-depth knowledge of the various
markets including China, India, Japan, S E Asia and Australia. Prior to this
he was CEO Canada and North American Board for Saatchi & Saatchi,
MD Saatchi South Africa, Unilever and Johnson & Johnson.
Mrs Diana Ee-Tan
Mrs Tan has over 25 years of experience in hospitality and tourism. In
her former capacity as President of Raffles Hotels and Resorts, she had
responsibility for the operating and financial performance of its hotels
and resorts worldwide, brand development, integration of new hotels,
product and services strategy and human resource development.
The Raffles portfolio of luxury hotels is led by its flagship Raffles Hotel
Singapore. Her tenure saw the expansion of Raffles to new destinations
in China, Indonesia, Europe and the Middle East. She was also a pioneer
in Singapore’s MICE industry, having been significantly involved in
Singapore’s bids for large international congresses and exhibitions earlier
on in her career. Mrs Tan is a Director of Raffles Hotel (1886) Ltd.
Mr Vinodh Coomaraswamy
Vinodh Coomaraswamy is Senior Counsel at Shook Lin and Bok LLP.
He is a graduate of Nottingham University and Oxford University. He was
admitted as a Barrister, England & Wales in 1991 and as an Advocate &
Solicitor of the Supreme Court of Singapore in 1992. He is concurrently
admitted to practise in New South Wales and New York. Vinodh’s field
has considerable expertise in complex domestic and cross-border
banking and finance-related litigation and international commercial
litigation and arbitration as well as contentious insolvency matters. He
is a Fellow of the Chartered Institute of Arbitrators and a Fellow of the
Singapore Institute of Arbitrators. He is a Member of the Singapore
International Arbitration Centre’s Regional Panel of Arbitrators and a
Member, List of Arbitrators of the Vietnam International Arbitration Centre.
9

Front row (from left to right):
• MsLynettePang,ExecutiveDirector,Arts&Entertainment and Enrichment Industry Development (I & II) Group
• MrTonyLai,AssistantChiefExecutive,IndustryDevelopment (I) Group and Sector Planning & Development Group
• MsMelissaOw,AssistantChiefExecutive,Industry Development (II) Group
• MsAwKahPeng,ChiefExecutive
• MrLeongYueKheong,AssistantChiefExecutive, International Group and Corporate Development
• MsChiangHaiYin,ChiefFinancialOfficerandExecutive Director, Finance & Corporate Services, Corporate Development Group
Management Team
Second row (from left to right):
• MrChewTiongHeng,ExecutiveDirector,Destination Experience Group*
• MsNeetaLachmandas,ExecutiveDirector,Capability & Innovation and Visitor Information & Feedback, Sector Planning & Development Group
• MrMuhammadRostamUmar,ExecutiveDirector, Human Resources & Organisation Development, Corporate Development Group
Not present:
• MrJustinChew,ExecutiveDirector,F1&Sportsand Hospitality, Industry Development (I) Group
• MrChangCheePey,ExecutiveDirector,BrandManagement and Destination Marketing,
Marketing Group*
*with effect from 15 October 2010
10

Tourism Sector Performance

Tourism receiptsCumulative tourism receipts were estimated at S$12.8
billion in 2009.
Indonesia (S$2,129 million), P R China (S$1,346
million), Australia (S$952 million), India (S$801 million)
and Malaysia (S$678 million) were Singapore’s top five
markets in terms of tourism receipts for 2009. These
markets accounted for 46 per cent of total tourism
receipts during this period.
Visitor arrivalsVisitor arrivals to Singapore reached 9.7 million last
year, underscoring the strong performance in the final
quarter of 2009 and exceeding the year’s forecast of
9 – 9.5 million visitor arrivals.
Monthly statistics showed that visitor arrivals
rebounded in the second half of 2009, peaking in
December.
Tourism Sector Performance
-18
% Chg vs 08
-1-7
-35+12-24-19-13-27-16-18
-6-19-14-18
IndonesiaP R China
AustraliaIndia
MalaysiaPhilippines
UKUSA
JapanThailandVietnam
Hong Kong SARSouth Korea
GermanyTaiwan
2,1291,346
952801
678570553551538
465417
362333
195167
S$ mil0 500 1000 1500 2000 2500
*Tourism receipts for the top 15 countries are arranged in descending order Jan-Dec 2009 and represent 83% of total tourism receipts
S$10.9 bil
S$12.4 bil S$12.8 bil
S$14.1 bil
S$15.2 bil
2005 2006 2007 2008 2009 5
10
15
Tourism Receipts: $12.8 billion % Change vs Year Ago: -15.7%
Tourism Receipts (2009)
Tourism receipts from top 15 markets in 2009
8.9 mil
9.8 mil
10.3 mil10.1 mil
9.7 mil
2005 2006 2007 2008 2009
Visitor Arrivals: 9.7 million% Change vs Year Ago: -4.3%
Visitor Arrivals 2009
Source: Disembarkation/Embarkation Cards
Highest Ever
Thou
sand
s
772690
791 779726 750
882 845 799 845 830
971
Jan
Feb
Mar
Apr
May Jun
Jul
Aug
Sep
Oct
Nov
Dec
Visitor Arrivals by Month, Jan-Dec 09
H1N1
Jan
Feb
Mar
Apr
May Jun
Jul
Aug
Sep
Oct
Nov
Dec
Visitor Arrivals, % Change vs. Year Ago, Jan-Dec 09
Total Visitor Arrivals: 9.7 million % Change vs Year Ago: -4.3%
Visitor Arrivals by Month (2009)
12
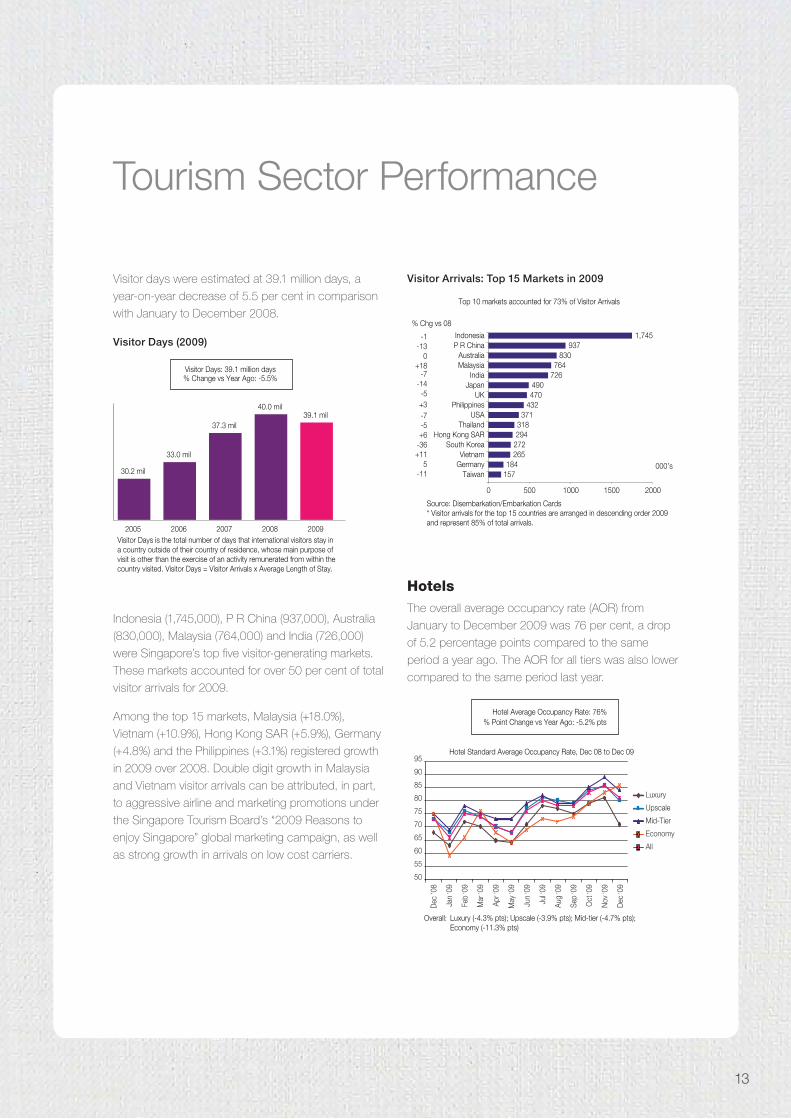
Visitor days were estimated at 39.1 million days, a
year-on-year decrease of 5.5 per cent in comparison
with January to December 2008.
Indonesia (1,745,000), P R China (937,000), Australia
(830,000), Malaysia (764,000) and India (726,000)
were Singapore’s top five visitor-generating markets.
These markets accounted for over 50 per cent of total
visitor arrivals for 2009.
Among the top 15 markets, Malaysia (+18.0%),
Vietnam (+10.9%), Hong Kong SAR (+5.9%), Germany
(+4.8%) and the Philippines (+3.1%) registered growth
in 2009 over 2008. Double digit growth in Malaysia
and Vietnam visitor arrivals can be attributed, in part,
to aggressive airline and marketing promotions under
the Singapore Tourism Board’s “2009 Reasons to
enjoy Singapore” global marketing campaign, as well
as strong growth in arrivals on low cost carriers.
Hotels The overall average occupancy rate (AOR) from
January to December 2009 was 76 per cent, a drop
of 5.2 percentage points compared to the same
period a year ago. The AOR for all tiers was also lower
compared to the same period last year.
Visitor Days: 39.1 million days % Change vs Year Ago: -5.5%
Visitor Days is the total number of days that international visitors stay in a country outside of their country of residence, whose main purpose of visit is other than the exercise of an activity remunerated from within the country visited. Visitor Days = Visitor Arrivals x Average Length of Stay.
2005 2006 2007 2008 2009
30.2 mil
33.0 mil
37.3 mil
40.0 mil 39.1 mil
Overall: Luxury (-4.3% pts); Upscale (-3.9% pts); Mid-tier (-4.7% pts); Economy (-11.3% pts)
Hotel Average Occupancy Rate: 76% % Point Change vs Year Ago: -5.2% pts
Hotel Standard Average Occupancy Rate, Dec 08 to Dec 09
Dec
’08
Jan
’09
Feb
’09
Mar
’09
Apr ’
09
May
’09
Jun
’09
Jul ’0
9
Aug
’09
Sep
’09
Oct
’09
Nov
’09
Dec
’09
95
90
85
80
75
70
65
60
55
50
Luxury
Upscale
Mid-Tier
Economy
All
Tourism Sector Performance
Visitor Days (2009)
Source: Disembarkation/Embarkation Cards * Visitor arrivals for the top 15 countries are arranged in descending order 2009 and represent 85% of total arrivals.
-1
% Chg vs 08
-130
+18-7
-14-5+3-7-5+6
-36+11
5-11
IndonesiaP R China
AustraliaMalaysia
IndiaJapan
UKPhilippines
USAThailand
Hong Kong SARSouth Korea
VietnamGermany
Taiwan
1,745937
830764
726490470
432371
318294
272265
184157
Top 10 markets accounted for 73% of Visitor Arrivals
000’s
0 500 1000 1500 2000
Visitor Arrivals: Top 15 Markets in 2009
13

Overall average room rate (ARR) reached S$189, a
decline of 23%. The Mid-Tier hotels registered the
lowest decline of 26.2 per cent.
As a result of both falling AOR and ARR, overall
revenue per available room (RevPAR) declined by 27.9
per cent to register S$143 in January to December
2009. All hotel tiers registered declines of over 25 per
cent in RevPAR versus a year ago.
At the same time, an additional 2,740 rooms in 2009
increased total hotel room inventory to more than
41,000. In addition to new hotels such as Capella
Singapore, Park Hotel Clarke Quay, Studio M and Ibis
at Bencoolen, a handful of boutique hotels opened
last year. The Quincy, klapsons, Nostalgia and Wangz
helped to increase the range of hotel offerings in
Singapore, addressing the consumer trend towards
greater personalization and unique experiences.
Meetings, Incentives, Conventions and Exhibitions (MICE) While the MICE industry
experienced a 10-15 per
cent average decline
in events attendance,
key events did well
and increased foreign
attendance.
For example,
54,354 attendees
congregated at Asia’s
largest media and
infocomm trade event,
BroadcastAsia 2009
and CommunicAsia 2009. 49 per cent of them came
from outside of Singapore, hailing from about 100
countries and regions across Asia-Pacific, Europe, US
and the Middle-East.
More than 20 new events were launched in 2009,
such as Clean Energy Expo Asia, Spikes Asia,
Budget & Economy
Hotels Asia, and
International Singapore
Compact CSR Summit.
Singapore also secured
a strong pipeline of
events for 2010 and
beyond, such as the
Singapore Airshow
2010, Asia Pacific
Maritime 2010, World
Cities Summit and LIVE!
Singapore.
Tourism Sector Performance
200
120
S$
160
40
80
’95 ’96 ’97 ’98 ’99 ’00 ’01 ’02 ’03 ’04 ’05 ’07 ’06 ’08 ’09
Hotel Average Room Rate: S$189 % Change vs Year Ago: -23%
Hotel Average Room Rate (2009)
Source : Monthly Hotel Returns as at 13 Jan 2010p : preliminary
Dec
’08
Jan
’09
Feb
’09
Mar
’09
Apr ’
09
May
’09
Jun
’09
Jul ’0
9
Aug
’09
Sep
’09
Oct
’09
Nov
’09
Dec
’09
Revenue Per Available Room: S$143 % Change vs Year Ago: -27.9%
Hotel Revenue Per Available Room, Dec 08 to Dec 09
0
50
100
150
200
250
past13 mths
yearbefore
Hotel Revenue Per Available Room (2009)
14
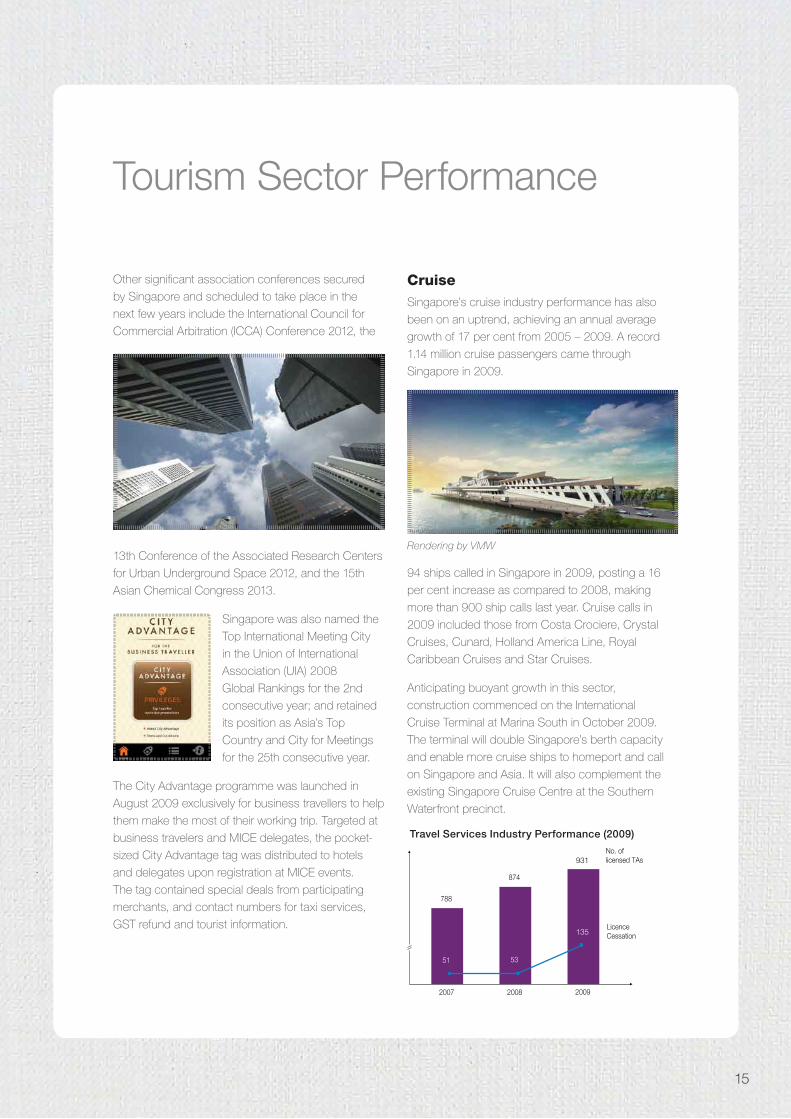
Other significant association conferences secured
by Singapore and scheduled to take place in the
next few years include the International Council for
Commercial Arbitration (ICCA) Conference 2012, the
13th Conference of the Associated Research Centers
for Urban Underground Space 2012, and the 15th
Asian Chemical Congress 2013.
Singapore was also named the
Top International Meeting City
in the Union of International
Association (UIA) 2008
Global Rankings for the 2nd
consecutive year; and retained
its position as Asia’s Top
Country and City for Meetings
for the 25th consecutive year.
The City Advantage programme was launched in
August 2009 exclusively for business travellers to help
them make the most of their working trip. Targeted at
business travelers and MICE delegates, the pocket-
sized City Advantage tag was distributed to hotels
and delegates upon registration at MICE events.
The tag contained special deals from participating
merchants, and contact numbers for taxi services,
GST refund and tourist information.
Cruise Singapore’s cruise industry performance has also
been on an uptrend, achieving an annual average
growth of 17 per cent from 2005 – 2009. A record
1.14 million cruise passengers came through
Singapore in 2009.
94 ships called in Singapore in 2009, posting a 16
per cent increase as compared to 2008, making
more than 900 ship calls last year. Cruise calls in
2009 included those from Costa Crociere, Crystal
Cruises, Cunard, Holland America Line, Royal
Caribbean Cruises and Star Cruises.
Anticipating buoyant growth in this sector,
construction commenced on the International
Cruise Terminal at Marina South in October 2009.
The terminal will double Singapore’s berth capacity
and enable more cruise ships to homeport and call
on Singapore and Asia. It will also complement the
existing Singapore Cruise Centre at the Southern
Waterfront precinct.
Tourism Sector Performance
Rendering by VMW
788
874
931
51 53
135
2007 2008 2009
Licence Cessation
No. of licensed TAs
Travel Services Industry Performance (2009)
15

Travel Services There was a net increase in the number of licensed
travel agents, in anticipation of growth in the tourism
sector.
Attractions The visitor volume at Singapore’s attractions was
maintained at an estimated 15.7million. The numbers
to local attractions were partly stimulated by the
2009 Reasons to enjoy Singapore campaign, as
well as new industry-led initiatives such as the Great
Singapore Pass by the Association of Singapore
Attractions and the Museum Pass by the National
Heritage Board.
New attractions and experiences included Wave
House Sentosa, MegaZip Adventure Park, the
Singapore Coins & Notes Museum, the Hungry
Ghost Festival walking tour in Chinatown, and tours
of Kranji. A number of
attractions also revamped
their offerings. Sentosa
Luge opened a second
track, Singapore Cable
Car upgraded their cabins,
Underwater World started
work on its new Dolphin
Lagoon, and Jurong Bird Park opened its Bird
Discovery Centre.
Dining Singapore’s dining scene made new inroads in 2009.
For the first time, two Singapore restaurants made
it to the S. Pellegrino World’s 50 Best Restaurants
list. Iggy’s jumped 17 places from the previous year
to number 28, and Jaan made its debut in the 39th
position. Other establishments that got connoisseurs
excited included Les Amis (placed 78th) and
Gunther’s (84th).
International visitors certainly enjoyed the food
offerings in Singapore. 11 per cent, or about S$1.4
billion, of Total Visitor Expenditure generated in
2009 was spent on F&B, making it the third highest
contributor after shopping (25%) and accommodation
(22%).
Retail & FashionSingapore’s reputation as a shopping haven was
strengthened in 2009 as shopping overtook
accommodation as the highest expenditure item
among visitors in 2009. Visitors spent 25 percent of
Sentosa Luge
Shopping Accommodation Food & Beverage
Major Expenditure Items 2009
$3.1mil
$2.7mil
$1.4mil
Tourism Sector Performance
16

their total expenditure, or S$3.1 billion, in Singapore’s
diverse malls. The most popular shopping items were
fashion and accessories, consumer electronics, and
cosmetic and wellness products.
Orchard Road, the prime shopping precinct, saw
dramatic developments. The iconic ION Orchard
opened to much fanfare. Besides six duplex stores
from international luxury brands, New York’s Steve
Madden, Italian label DSquared2, Spanish high
street label Bershka and China’s Li Ning were just a
sampling of the new brands available at this mall.
Other new malls that added to Orchard Road
included Orchard Central with Singapore’s first
Mediterranean retail concept and a five-storey rock-
climbing wall. Next door is 313@Somerset, home
to South-east Asia’s biggest Uniqlo flagship and an
exciting tenant mix.
Existing malls like Mandarin Gallery also refreshed
their retail concepts and brands. Positioned as an
intimate-sized mall for the younger affluent, Mandarin
Gallery reopened its doors in end-2009, featuring
brands like a.i. by Ashley Isham.
EntertainmentAsia’s first Supperclub opened in July 2009, bringing
to Singapore its unconventional concept and
philosophy. Those in search of a cosy and niche
experience can choose from the many boutique
clubs and bars, such as Butter Factory, Timbre and
Eski Bar, dotted all around Singapore.
Home-grown club Zouk, which has put Singapore
on the international clubbing scene, continues to
reign as one of the most influential dance clubs in the
world, attracting the most acclaimed spin maestros
to its turntables each week. Its signature dance
music festival, ZoukOut, marked its ninth year in
2009, welcoming a record 27,000 party-goers. Over
12,000 of these revellers were tourists, an increase of
about 20 per cent from 2008 figures.
ZoukOut 2009
Tourism Sector Performance
17

EducationIn 2009, Singapore was host to 94,000 international
students from over 120 nationalities. From
government primary schools to private education
centres and tertiary institutions, these foreign students
received a quality education in Singapore. They
were drawn by the strong recognition of Singapore’s
education sector. For example, in the 2009 World
University Rankings conducted by the Times Higher
Education Supplement, the National University of
Singapore and Nanyang Technological University
were ranked 30 and 73 respectively.
Responding to the
increasing demand
for skills in the
creative industries,
LaSalle School of
the Arts opened its
new $138.5 million
campus at McNally
Street in May, with
the international
student population
hailing from over 40
countries.
In the medical arena, the Duke-NUS Graduate
Medical School Singapore was officially opened
in September. The inaugural class, which began
medical training in 2007 in an interim facility, will
graduate in 2011 with a joint Doctor of Medicine
(M.D.) degree from Duke University and the National
University of
Singapore - the
first of its kind for
both institutions.
Finally, for
younger students,
SJI (International)
officially opened
in May. From its
pioneer batch of
112 students in
2007, its student
population
has grown to
725, all of whom are enrolled in the school’s 12-
year programme leading up to the International
Baccalaureate.
HealthcareSingapore continued to maintain its reputation as
Asia’s leading medical hub in 2009, and was ranked
by the IMD World Competitiveness Yearbook (2009)
for having the best healthcare infrastructure in Asia
and fourth best in the world. 570,000 visitors came to
Singapore as medical travellers in 2009, generating
S$1.3 billion in tourism receipts.
2009 also saw some clinical milestones by
Singapore’s healthcare professionals. Singapore
performed Asia’s first percutaneous aortic valve
replacement (an alternative for patients unable to
undergo traditional surgery); Asia’s first combined
heart and liver transplant surgery; and the world’s first
Official opening of LaSalle School of the ArtsImage courtesy of LaSalle School of the Arts
Duke NUS Medical School
18

operation for a rare ectopic pregnancy with a single
incision exclusively through the belly button.
SportsThe 2009 FORMULA 1 SingTel Singapore Grand
Prix attracted a crowd of more than 90,000, with 30
percent of guests hailing from overseas. Close to
240,000 tickets were sold for the three-day event.
Singapore also welcomed 1,400 athletes from 44
countries for the inaugural Asian Youth Games in
July. Some 7,000 spectators, athletes and officials
attended the opening ceremony at the Singapore
Indoor Stadium and took part in the nine-day games.
STB / Bi ChongLei
Tourism Sector Performance
19
EVENT HIGHLIGHTS
January – March 2009
Celebrating the Lunar New Year
Singapore enjoyed a double dose of new year
celebrations with the Chinese New Year festivities
starting in January. Chinatown’s streets were decked in
decorative lights, while The Float @Marina Bay became a
cultural stage for large-scale displays of Chinese mythical
characters and street food for River Hongbao celebrations.
The colourful Chingay Parade was held at Marina Bay,
giving parade-goers a full view of the new city skyline as
magnificent floats and energetic performances made their
way across Marina Bay.
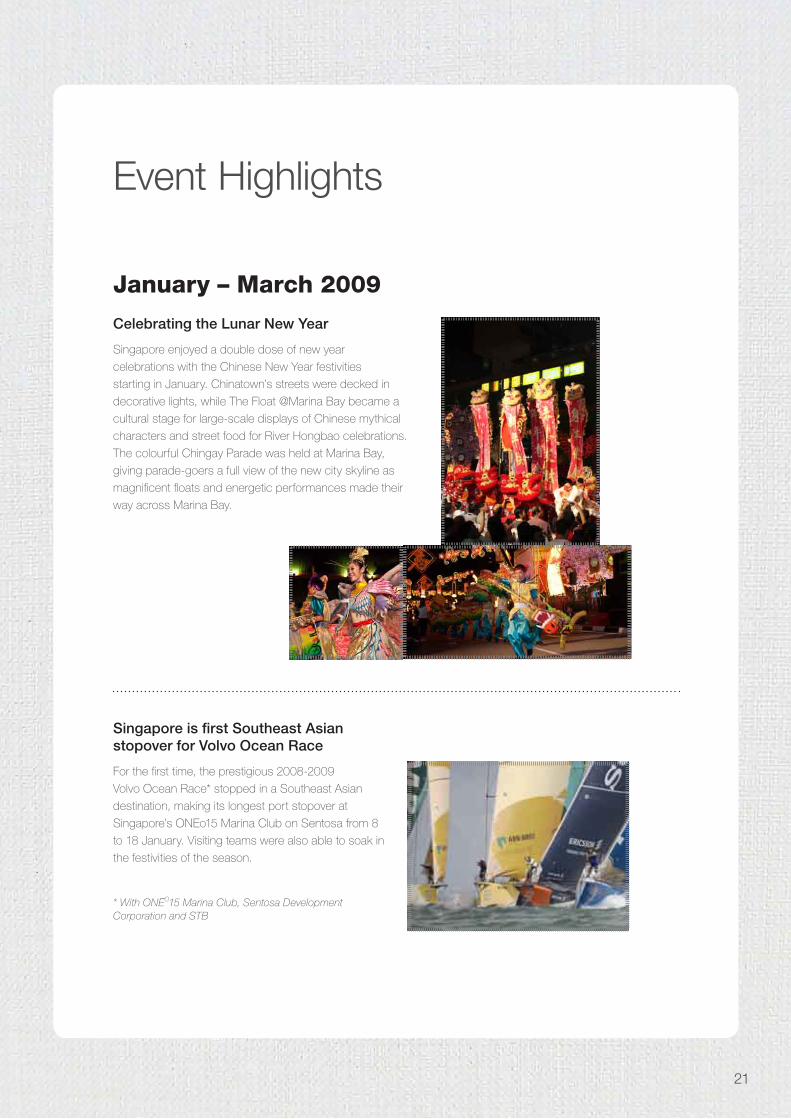
Singapore is first Southeast Asian stopover for Volvo Ocean Race
For the first time, the prestigious 2008-2009
Volvo Ocean Race* stopped in a Southeast Asian
destination, making its longest port stopover at
Singapore’s ONEo15 Marina Club on Sentosa from 8
to 18 January. Visiting teams were also able to soak in
the festivities of the season.
* With ONEO15 Marina Club, Sentosa Development Corporation and STB
Event Highlights
21
Singapore Education Awards
The third Singapore Education Awards bestowed
honours to recognise the contributions of individuals
and organizations to the education experience here,
including those who had helped international students
to settle in. The 18 winners, picked from 2,000
nominations, further elevated Singapore’s position as
a quality education hub.
Orchard Reloaded
Orchard Road emerged refreshed after infrastructural
enhancements with widened pedestrian malls, urban
green rooms, and state-of-the-art street and ambient
lighting. Celebrating the rebirth of Singapore’s
prime shopping belt, the Orchard Road Business
Association launched the new brand position,
Orchard Road – A Great Street, at Orchard Reloaded,
an exciting three-week line-up of events including the
first multi-label outdoor catwalk show on a stage of
more than 100 metres in length. A place management
committee was also convened to spearhead and
drive initiatives to develop Orchard Road into a
distinctive precinct and a great street.
Event Highlights
22
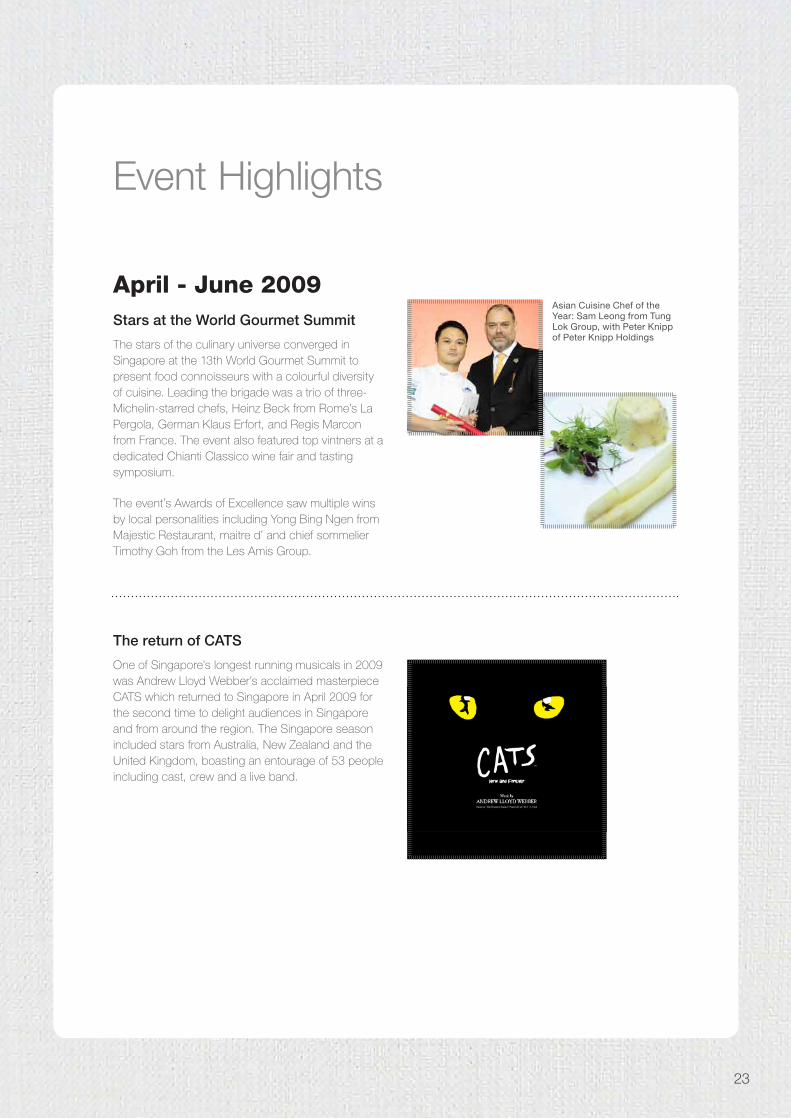
April - June 2009 Stars at the World Gourmet Summit
The stars of the culinary universe converged in Singapore at the 13th World Gourmet Summit to present food connoisseurs with a colourful diversity of cuisine. Leading the brigade was a trio of three-Michelin-starred chefs, Heinz Beck from Rome’s La Pergola, German Klaus Erfort, and Regis Marcon from France. The event also featured top vintners at a dedicated Chianti Classico wine fair and tasting symposium.
The event’s Awards of Excellence saw multiple wins by local personalities including Yong Bing Ngen from Majestic Restaurant, maitre d’ and chief sommelier Timothy Goh from the Les Amis Group.
Asian Cuisine Chef of the Year: Sam Leong from Tung Lok Group, with Peter Knipp of Peter Knipp Holdings
The return of CATS
One of Singapore’s longest running musicals in 2009 was Andrew Lloyd Webber’s acclaimed masterpiece CATS which returned to Singapore in April 2009 for the second time to delight audiences in Singapore and from around the region. The Singapore season included stars from Australia, New Zealand and the United Kingdom, boasting an entourage of 53 people including cast, crew and a live band.
Event Highlights
23
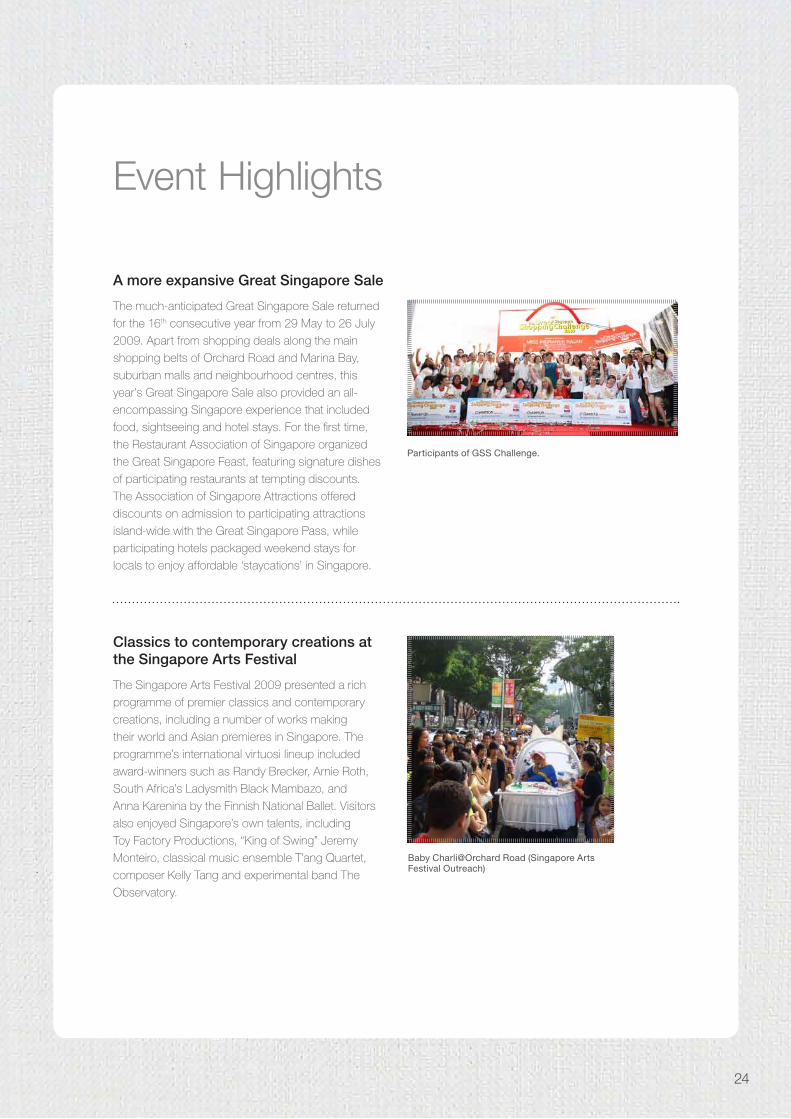
A more expansive Great Singapore Sale
The much-anticipated Great Singapore Sale returned
for the 16th consecutive year from 29 May to 26 July
2009. Apart from shopping deals along the main
shopping belts of Orchard Road and Marina Bay,
suburban malls and neighbourhood centres, this
year’s Great Singapore Sale also provided an all-
encompassing Singapore experience that included
food, sightseeing and hotel stays. For the first time,
the Restaurant Association of Singapore organized
the Great Singapore Feast, featuring signature dishes
of participating restaurants at tempting discounts.
The Association of Singapore Attractions offered
discounts on admission to participating attractions
island-wide with the Great Singapore Pass, while
participating hotels packaged weekend stays for
locals to enjoy affordable ‘staycations’ in Singapore.
Classics to contemporary creations at the Singapore Arts Festival
The Singapore Arts Festival 2009 presented a rich
programme of premier classics and contemporary
creations, including a number of works making
their world and Asian premieres in Singapore. The
programme’s international virtuosi lineup included
award-winners such as Randy Brecker, Arnie Roth,
South Africa’s Ladysmith Black Mambazo, and
Anna Karenina by the Finnish National Ballet. Visitors
also enjoyed Singapore’s own talents, including
Toy Factory Productions, “King of Swing” Jeremy
Monteiro, classical music ensemble T’ang Quartet,
composer Kelly Tang and experimental band The
Observatory.
Participants of GSS Challenge.
Baby Charli@Orchard Road (Singapore Arts Festival Outreach)
Event Highlights
24
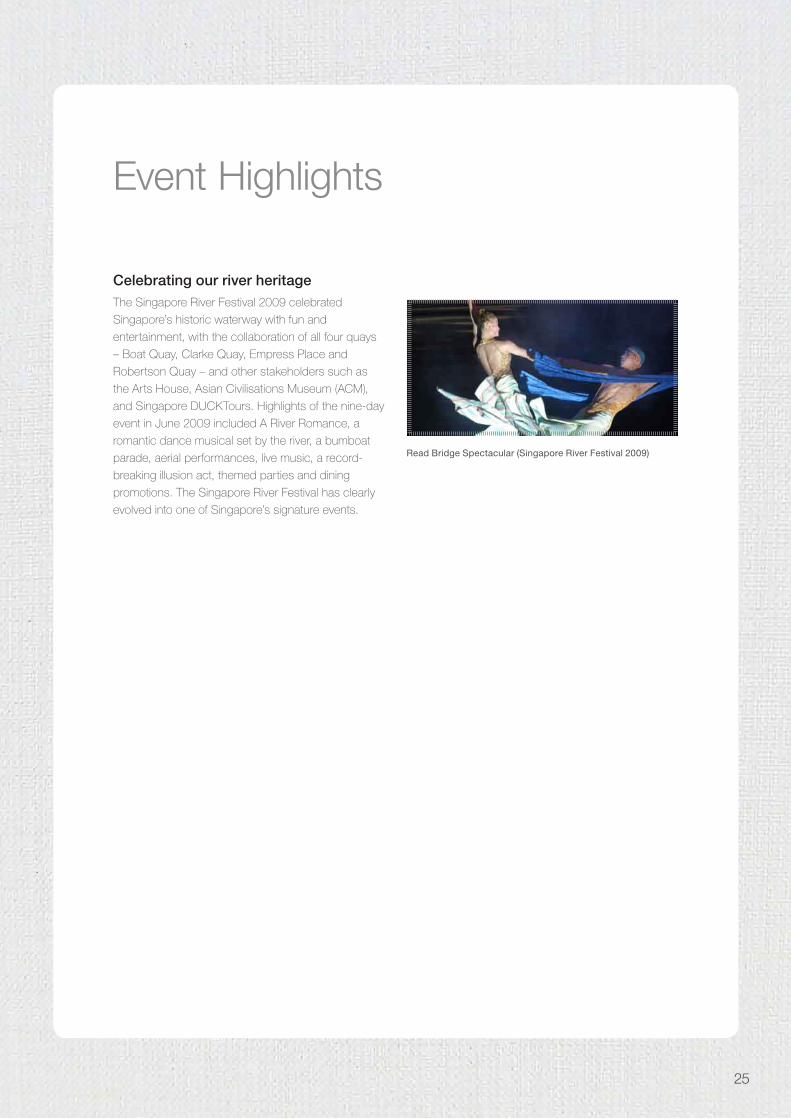
Read Bridge Spectacular (Singapore River Festival 2009)
Celebrating our river heritage The Singapore River Festival 2009 celebrated
Singapore’s historic waterway with fun and
entertainment, with the collaboration of all four quays
– Boat Quay, Clarke Quay, Empress Place and
Robertson Quay – and other stakeholders such as
the Arts House, Asian Civilisations Museum (ACM),
and Singapore DUCKTours. Highlights of the nine-day
event in June 2009 included A River Romance, a
romantic dance musical set by the river, a bumboat
parade, aerial performances, live music, a record-
breaking illusion act, themed parties and dining
promotions. The Singapore River Festival has clearly
evolved into one of Singapore’s signature events.
Event Highlights
25
July - September 2009 Spotlight on Peranakan food
The 16th edition of the Singapore Food Festival shone
the spotlight on Peranakan cuisine, in addition to
showcasing Singapore’s many ethnic food delights.
The annual food event kicked off with a colourful
Peranakan parade at Clarke Quay, and ended with
the Longest Peranakan Buffet Dinner offering 100
dishes. Other highlights included culinary workshops;
a Nonya Mobile, an interactive kitchen that traveled the
island to share and demonstrate skills and techniques;
and the Beauty and the Feast Dinner, which gave
traditional Nonya dishes a modern twist using premium
ingredients. This year’s theme provided an opportunity
to highlight Singapore’s melting pot of cultures, with
cuisine that has evolved through the years into distinct
Singaporean dishes. The 10-day event attracted over
354,000 visitors, of which 26 per cent were tourists.
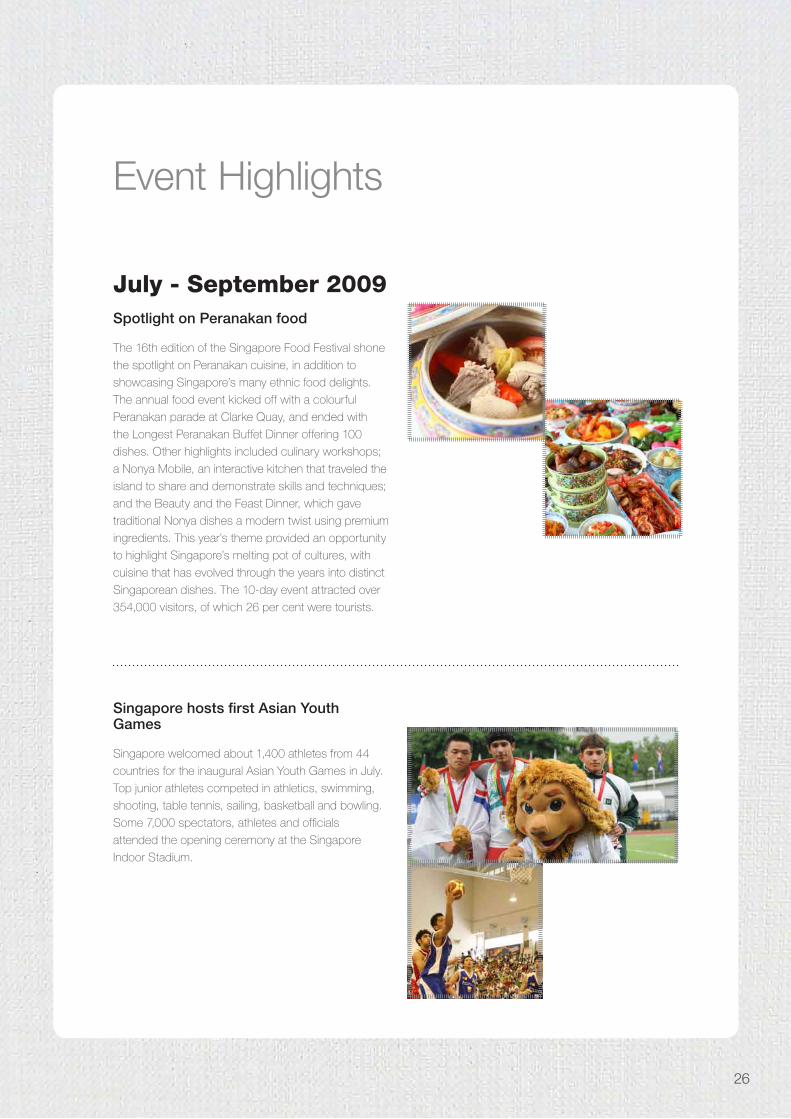
Singapore hosts first Asian Youth Games
Singapore welcomed about 1,400 athletes from 44
countries for the inaugural Asian Youth Games in July.
Top junior athletes competed in athletics, swimming,
shooting, table tennis, sailing, basketball and bowling.
Some 7,000 spectators, athletes and officials
attended the opening ceremony at the Singapore
Indoor Stadium.
Event Highlights
26

World’s only night race continues to impress
The 2009 FORMULA 1 SingTel Singapore
Grand Prix left spectators and visitors
breathless with a multi-sensory experience
that included an improved race circuit, street
entertainment, live performances by Travis,
Backstreet Boys and Chaka Khan, and
a post-race party by Zouk. Winner Lewis
Hamilton claimed his second win of 2009 in
front of a Singapore crowd of almost 80,000.
Close to 240,000 tickets were sold for the
three-day event.
Credit: LAT Photographic / Singapore GP
Great experiences for all at the Singapore GP Season
The Singapore GP Season blazed into Singapore
with top-quality lifestyle experiences in the heart of
the city, a stone’s throw from the race circuit. Making
international headlines was the first ever F1 ROCKSTM,
with renowned artistes like Beyoncé, The Black Eyed
Peas, No Doubt, ZZ Top, Simple Minds, N*E*R*D,
A-Mei and ‘Cantopop Heavenly King’ Jacky Cheung.
The Season reached out to a diverse audience,
from race fans and corporate guests, to leisure
visitors and local residents, with an exciting lineup
of events including Asia on the Edge, sculpture
exhibitions by Romero Britto and Pintor Sirait, a
photography exhibition by renowned FORMULA ONE
photographer Paul Henri Cahier, the exclusive Amber
Lounge, and a concert by Il Divo, among others. Over
at the Singapore River, a host of after-race parties and
special F&B deals and promotions greeted visitors,
while One City Three Festivals wowed the crowds
with festive light-ups, bazaars and culinary delights
during the Mid-Autumn Festival, Hari Raya Aidilfitri and
Deepavali celebrations. Gwen Stefani
Event Highlights
27

October - December 2009Singapore Sun Festival shines brightly
The third instalment of the Singapore Sun Festival (October 2009) continued to stay true to its philosophy of celebrating the art of living well. The event started with a world premiere ballet performance by the Bolshoi Theatre and Mariinsky Theatre, and followed with more than 90 events featuring over 190 international artistes and celebrities. Highlights included the Netherlands Radio Philharmonic Orchestra, indoor film screenings with Joan Chen, and appearances by Deepak Chopra, Nobel Laureate Wole Soyinka, Elvis Costello, experimental chef Floyd Cardoz, two Michelin star chef Thierry Marx, and painter Diana Francis. The Festival also celebrated Singapore’s rich Peranakan heritage with the NUS Baba House and Peranakan Museum.
Netherlands Radio Philharmonic Orchestra with Nina KotovaCourtesy of IMG Artists
Honouring the best in the industry
The Singapore Experience Awards presentation ceremony held in
November 2009 honoured the
best individuals and organisations
in the hospitality, retail, dining,
entertainment, attractions, and
business travel and MICE sectors,
who had delivered the highest
level of excellence in product and
service delivery. In its inaugural
year, the Singapore Experience
Awards received more than 24,000
nominations.
Singapore Experience Awards winners
Event Highlights
28

Christmas in the Tropics
Celebrating Christmas in the Tropics
The year-end festive season lasted longer this year,
with the crowd-pleasing Christmas light-up extended
to allow visiting APEC delegates a chance to enjoy
the festivities. It was “A Christmas All Decked Out”
at Orchard Road, with snowmen, reindeers and
even Santa Claus sporting makeovers and the latest
fashions of the season. Over at Marina Bay, it was a
waterside experience with “A Glitzy Christmas by the
Bay”, a glittering extravaganza with oceanic design
elements to complement its waterfront location. For
the first time, Singapore River joined in the Christmas
festivities with performances, carolling, ice-skating
and special promotions for party-goers.
APEC Singapore
Over 10,000 delegates and international media
converged in Singapore during APEC Leaders’
Week from 8 to 15 November 2009. As host
economy of the APEC 2009 meetings, Singapore
welcomed leaders, Ministers, and officials from
the 21 APEC member economies as well as
international media. Spouses of leaders were treated
to a specially customized programme that allowed
them to experience Singapore’s culture, arts and
entertainment, leisure and culinary delights.
Event Highlights
29

Dendrobium Singapore Shanghai Symphony
Floral finale
Topping Out of Singapore Pavilion
The Singapore Pavilion at World Expo 2010 Shanghai
China, Singapore’s largest participation to date for the
World Expo, celebrated the completion of structural
works in November with a topping out ceremony and the
official introduction of its logo and mascot, Liu Lian Xiao
Xing (榴莲小星).
Construction had begun on the Singapore Pavilion in
June 2009. STB marked the commencement ceremony
by presenting an orchid hybrid named Dendrobium
Singapore Shanghai Symphony (新沪交响曲) to
Mr Yang Xiong, the Executive Vice Mayor of
Shanghai. The hybrid was exclusively created to
commemorate Singapore’s participation in the
World Expo 2010 Shanghai China, and reflects
the strong bilateral relations between China and
Singapore.
The Singapore Pavilion design also went on
display at the Shanghai Urban Planning Exhibition
Centre as well as the National Museum, National
Library and other places in Singapore.
Event Highlights
30

Music and thrills at ZoukOut 2009
Homegrown club Zouk delivered its ninth signature
dance music festival in December with a cast of
local and international talents at Sentosa’s Siloso
Beach. This year’s ZoukOut also incorporated
Wave House Sentosa, Siloso Beach’s latest lifestyle
attraction. The popular dusk-to-dawn outdoor dance
party attracted a record 27,000 party-goers. Over
12,000 were tourists.
Countdown to 2010
Singapore became party central as thousands of
partygoers bid farewell to 2009 and welcomed 2010.
The Marina Bay Singapore Countdown boasted free
performances and activities, including the setting
afloat of 20,000 wishing spheres at Marina Bay
against a dazzling backdrop of the city skyline and
a fireworks display. Over at Sentosa, Siloso Beach
transformed into a dance party arena for Singapore’s
biggest countdown party by the beach.
Event Highlights
31

AWARDS & ACCOLADES
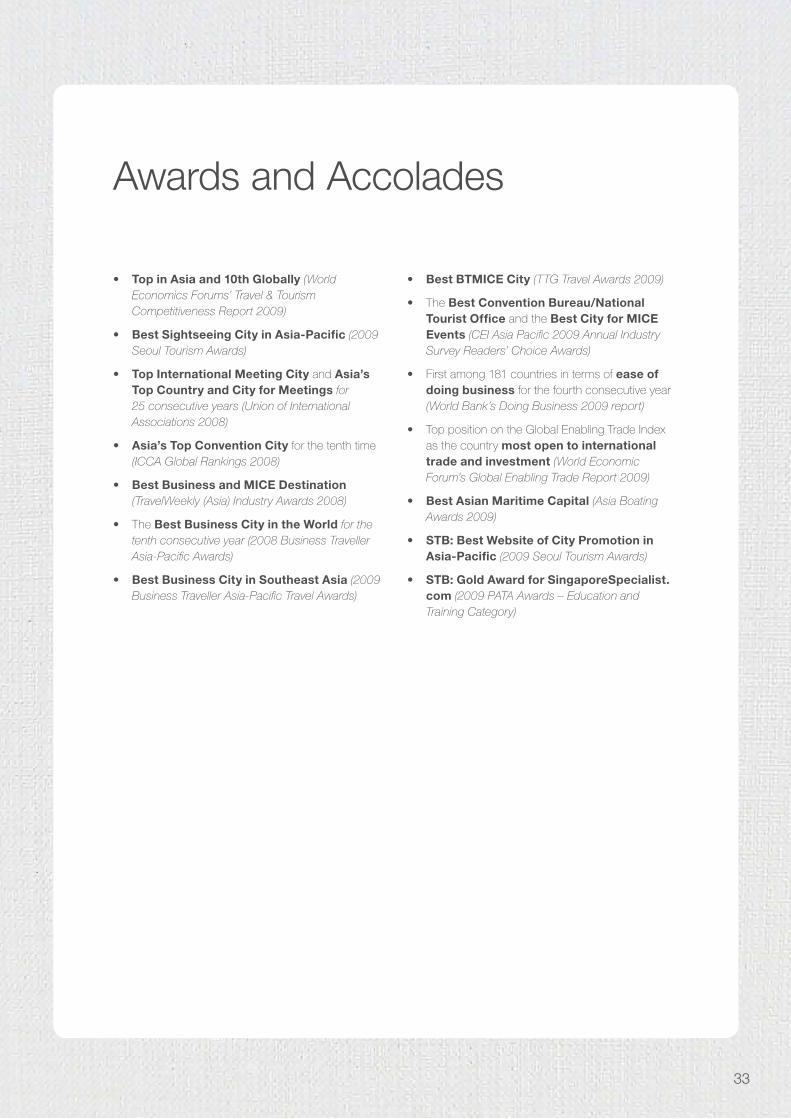
• Top in Asia and 10th Globally (World Economics Forums’ Travel & Tourism Competitiveness Report 2009)
• Best Sightseeing City in Asia-Pacific (2009 Seoul Tourism Awards)
• Top International Meeting City and Asia’s Top Country and City for Meetings for 25 consecutive years (Union of International Associations 2008)
• Asia’s Top Convention City for the tenth time (ICCA Global Rankings 2008)
• BestBusinessandMICEDestination(TravelWeekly (Asia) Industry Awards 2008)
• The Best Business City in the World for the tenth consecutive year (2008 Business Traveller Asia-Pacific Awards)
• Best Business City in Southeast Asia (2009 Business Traveller Asia-Pacific Travel Awards)
Awards and Accolades
• Best BTMICE City (TTG Travel Awards 2009)
• The Best Convention Bureau/National Tourist Office and the Best City for MICE Events (CEI Asia Pacific 2009 Annual Industry Survey Readers’ Choice Awards)
• First among 181 countries in terms of ease of doing business for the fourth consecutive year (World Bank’s Doing Business 2009 report)
• Top position on the Global Enabling Trade Index as the country most open to international trade and investment (World Economic Forum’s Global Enabling Trade Report 2009)
• Best Asian Maritime Capital (Asia Boating Awards 2009)
• STB: Best Website of City Promotion in Asia-Pacific (2009 Seoul Tourism Awards)
• STB:GoldAwardforSingaporeSpecialist.com (2009 PATA Awards – Education and Training Category)
33

CORPORATE GOVERNANCE

Board Matters
Responsibilities of the Board
The Board oversees and monitors organisational performance and the achievement of the STB’s strategic goals and objectives. It assumes the responsibility of reviewing and approving corporate strategies, budgets and financial plans.
Board Composition and Membership
The Board currently comprises nine Directors. The size and composition of the Board are guided by the clauses stated in the STB Act, with the eventual composition subject to approval by the Cabinet. These seek to provide a conducive environment for effective discussions and decision-making to happen.
The process for the appointment of Directors to the Board is kept formal and transparent, as this is critical to the role that corporate governance plays. Review of Directors’ membership on the Board is done as and when their official term of appointment is up.
There is a strong independent element on the Board, which exercises objective judgment on the STB’s corporate affairs. This is to ensure that there are checks and balances instituted. Eight out of the nine Directors on the Board are Independent Directors. Ms Aw Kah Peng, the STB’s Chief Executive, is the only non-independent Director. A Director’s independence is re-assessed at the point of each re-appointment.
Conduct of Board Affairs
The Board approves financial transactions above a certain financial limit. A regular review of the financial authorisation and approval limits is performed to ensure it is kept up-to-date and relevant.
During the financial year, the Directors were requested to complete a Board Evaluation Questionnaire as part of the process adopted to assess the overall administration of and engagements with the Board.
Under the year in review, there were a total of six scheduled Board meetings and a one-day Board Strategy Workshop, held at an off-site venue to discuss key strategic issues that will impact the achievement of the Board’s targets. A record of the Directors’ attendance at Board meetings during the financial year which ended on 31 March 2010 is set out in Table 1.
Directors are given access to the STB’s records and information, senior management, or any other staff of the agency, as is necessary for them to effectively discharge their responsibilities and to deliberate meaningfully on issues raised at Board meetings.
The following Board Committees assist the Board in executing its duties:
Corporate Governance
35

• AuditCommittee
• FinanceandInvestmentCommittee
• GovernanceCommittee
• HumanResourceManagementCommittee
A record of each Director’s Board Committee memberships and attendance at Board Committee meetings during the financial year which ended on 31 March 2010 is set out in Table 2.
Table 1: Directors’ Attendance at Board Meetings in FY 1 April 2009 to 31 March 2010
Name of DirectorScheduled Board Meetings Board Strategy Workshop
Number Held Number Attended Number Held Number Attended
Mr Simon Israel 5 5 1 1
Ms Aw Kah Peng 5 5 1 1
Mr Lim Neo Chian^ 5 0 1 0
Mr Aubeck Kam 5 5 1 1
Mr Mike Barclay 5 5 1 1
Mr Benson Puah 5 4 1 1
Mr Steven Lim 5 4 1 1
Mr Patrick Pitcher 5 5 1 1
Mrs Diana Ee-Tan# 5 2 1 0
Mr Vinodh Coomaraswamy# 5 2 1 0
Ms Chong Siak Ching* 5 2 1 1
Mr Scott Blume* 5 3 1 1
Mr Philip Jeyaretnam* 5 3 1 0
^ Directors who retired from the Board with effect from 30 September 2009 were scheduled to attend two Board meetings.
* Directors who retired from the Board with effect from 31 December 2009 were scheduled to attend three Board meetings and the Board Strategy Workshop held on 7 December 2009.
# Newly-appointed Directors to the Board with effect from 1 January 2010 were scheduled to attend two Board meetings.
Corporate Governance
36
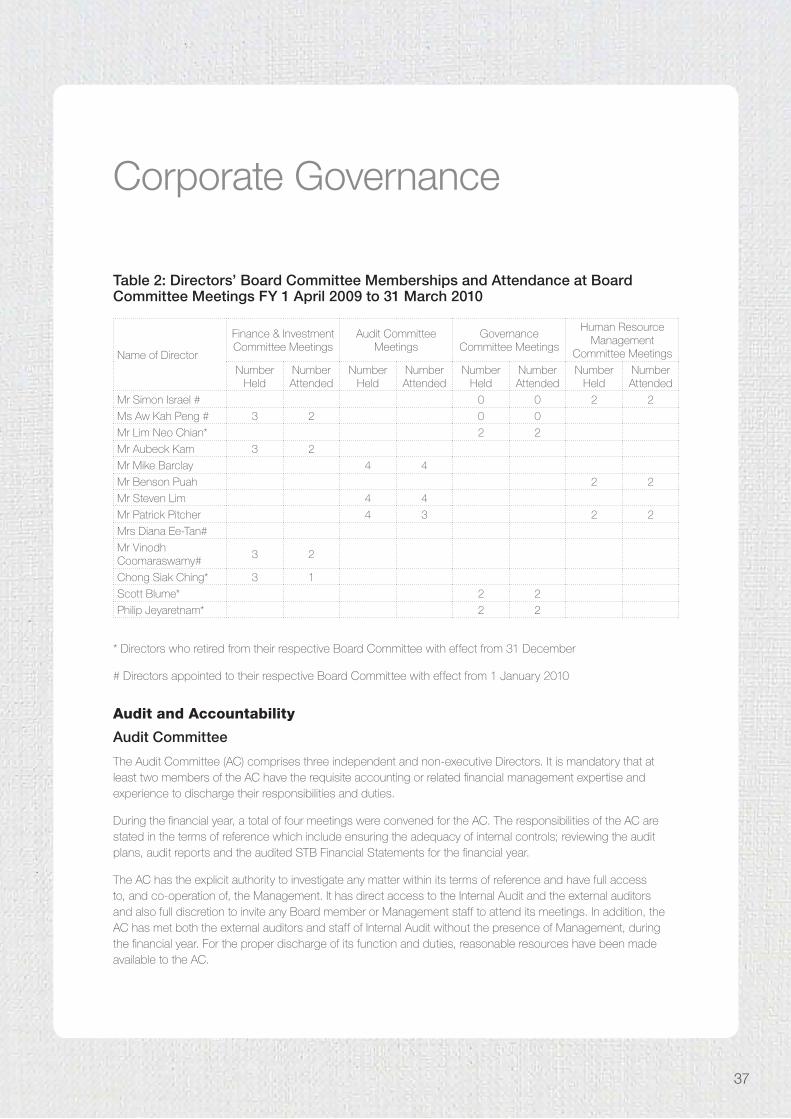
Table 2: Directors’ Board Committee Memberships and Attendance at Board Committee Meetings FY 1 April 2009 to 31 March 2010
Name of Director
Finance & Investment Committee Meetings
Audit Committee Meetings
Governance Committee Meetings
Human Resource Management
Committee Meetings
Number Held
Number Attended
Number Held
Number Attended
Number Held
Number Attended
Number Held
Number Attended
Mr Simon Israel # 0 0 2 2
Ms Aw Kah Peng # 3 2 0 0
Mr Lim Neo Chian* 2 2
Mr Aubeck Kam 3 2
Mr Mike Barclay 4 4
Mr Benson Puah 2 2
Mr Steven Lim 4 4
Mr Patrick Pitcher 4 3 2 2
Mrs Diana Ee-Tan#
Mr Vinodh Coomaraswamy#
3 2
Chong Siak Ching* 3 1
Scott Blume* 2 2
Philip Jeyaretnam* 2 2
* Directors who retired from their respective Board Committee with effect from 31 December
# Directors appointed to their respective Board Committee with effect from 1 January 2010
Audit and Accountability
Audit Committee
The Audit Committee (AC) comprises three independent and non-executive Directors. It is mandatory that at least two members of the AC have the requisite accounting or related financial management expertise and experience to discharge their responsibilities and duties.
During the financial year, a total of four meetings were convened for the AC. The responsibilities of the AC are stated in the terms of reference which include ensuring the adequacy of internal controls; reviewing the audit plans, audit reports and the audited STB Financial Statements for the financial year.
The AC has the explicit authority to investigate any matter within its terms of reference and have full access to, and co-operation of, the Management. It has direct access to the Internal Audit and the external auditors and also full discretion to invite any Board member or Management staff to attend its meetings. In addition, the AC has met both the external auditors and staff of Internal Audit without the presence of Management, during the financial year. For the proper discharge of its function and duties, reasonable resources have been made available to the AC.
Corporate Governance
37

Internal Controls
The Board has ensured that the Management maintains a sound system of internal controls to safeguard the interests of stakeholders and the assets of the STB. The AC has ensured that a review of the effectiveness of the STB’s internal controls, including financial, operational and compliance controls, and risk management, takes place annually through the various audits performed and related reports issued to the AC. In certain projects or areas where independent expertise is specially required in connection with the review of controls, external professionals and service providers have been appointed accordingly.
External Audit
As part of the annual financial statements audit, the external auditors carried out a review of the significant internal controls that were determined materially by the purpose of the audit and the scope of works under the audit plan. Any material non-compliance and/or internal control weaknesses, together with the external auditors’ recommendations, were addressed and made known to the AC.
To maintain the independence of the external auditors, the AC reviewed the scope and results of the external audit including the volume of non-audit services, if any, duly performed by them.
Internal Audit
The Internal Audit reports to the AC functionally and to the Chief Executive administratively. As part of its auditing, the Internal Audit is guided by the current International Professional Practices Framework issued by the Institute of Internal Auditors. The adequacy of funding and staffing of the Internal Audit and its appropriate standing within the STB have been ensured by the AC.
The Internal Audit adopts risk-based auditing as its key audit assurance practice. It enables various regional offices, major process owners and policy-makers of the STB in providing reasonable assurance on the effectiveness of control and governance processes in managing risks and accomplishing objectives.
Finance and Investment Committee
The Finance and Investment Committee comprises three Directors. Its responsibilities are broadly categorised into three areas: Finance, Fund Management and Risk Advisory.
It endorses the STB Workplans and Budget before submission to the STB Board for approval. The Committee also approves tenders, expenditures and proposed changes to the STB Financial Regulations.
It approves the STB’s investment policy and strategies, ensures that financial investments are conducted in compliance with statutory legislation and government directives and furnishes an investment report to the Board on a semi-annual basis.
It performs the risk advisory role for projects above S$1 million through provision of input and opinion on the risk assessment and risk response measures put forth by the STB, and elevates any critical project risks to the attention of the Board.
Corporate Governance
38

Governance Committee
Over the period 1 April 2009 to 31 December 2009, the Governance Committee comprised three independent
and non-executive Directors.
During that period, the Committee met twice to review the instituting of a formal conflict of interest guideline for
STB Board of Directors, which was implemented after approval from the STB Board on 1 November 2009.
With effect from 1 January 2010, the composition of the Governance Committee was revised to comprise
Chairman STB, Chief Executive STB and a senior management representative at the Assistant Chief Executive
level.
This change ensured that discussions and recommendations on the size and composition of the STB Board
would be free of conflict of interest issues.
Human Resource Management Committee
The Human Resource Management Committee comprises three Directors. The Human Resource Management
Committee’s responsibilities include reviewing the management development and succession plan for key senior
managers; ensuring the compensation policies and structures for all staff are competitive with the appropriate
benchmarks; evaluating the performance of key senior managers; approving the promotion of officers into and
within Management Grades; reviewing and approving recommendations on disciplinary matters affecting officers
of Management Grades and considering and approving any staff matters related to officers on Management
Grades which would be referred to the Committee from time to time.
Corporate Governance
39

FINANCIAL STATEMENTS

Statement by the Board 41
Independent Auditors’ Report 42 - 43
Statement of Financial Position 44
Statement of Comprehensive Income 45
Statement of Changes in Equity 46
Statement of Cash Flows 47 - 48
Notes to the Financial Statements 49 - 73
Contents
41
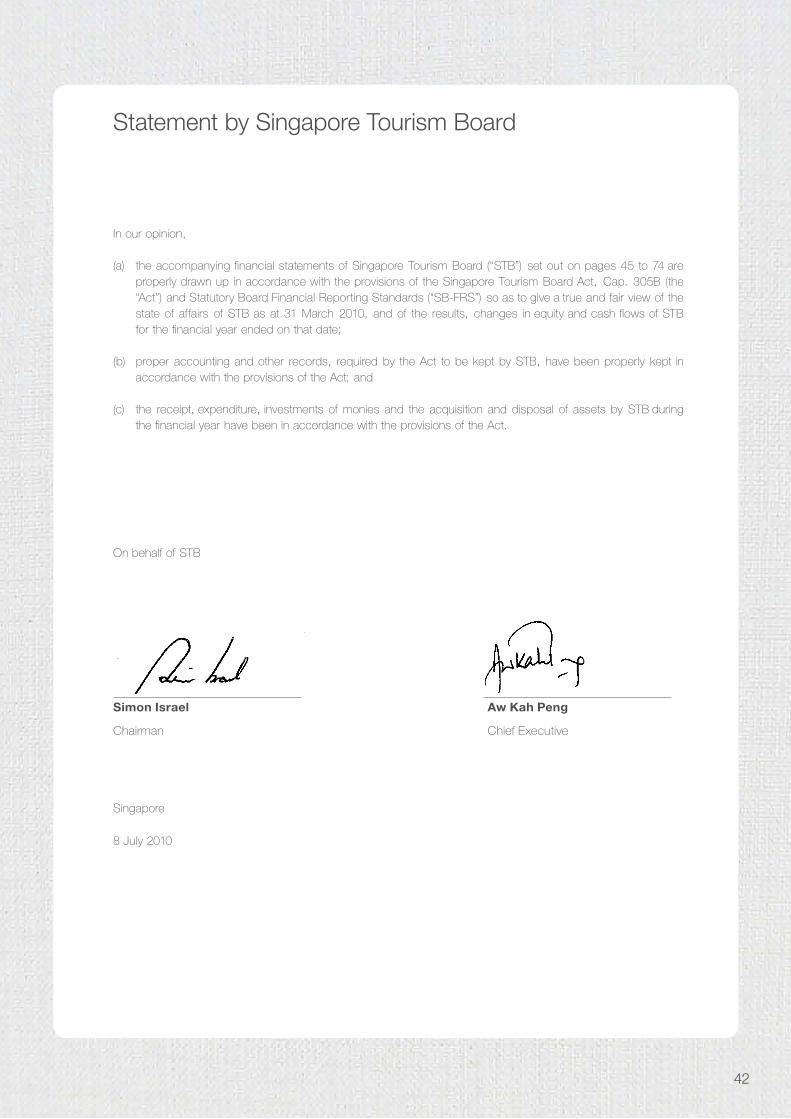
In our opinion,
(a) the accompanying financial statements of Singapore Tourism Board (“STB”) set out on pages 45 to 74 are properly drawn up in accordance with the provisions of the Singapore Tourism Board Act, Cap. 305B (the “Act”) and Statutory Board Financial Reporting Standards (“SB-FRS”) so as to give a true and fair view of the state of affairs of STB as at 31 March 2010, and of the results, changes in equity and cash flows of STB for the financial year ended on that date;
(b) proper accounting and other records, required by the Act to be kept by STB, have been properly kept in accordance with the provisions of the Act; and
(c) the receipt, expenditure, investments of monies and the acquisition and disposal of assets by STB during the financial year have been in accordance with the provisions of the Act.
On behalf of STB
Singapore
8 July 2010
Statement by Singapore Tourism Board
Simon Israel
Chairman
AwKahPeng
Chief Executive
42

Report on the Financial Statements
We have audited the accompanying financial statements of Singapore Tourism Board (“STB”) which comprise the statement of financial position as at 31 March 2010; and the statement of comprehensive income, statement of changes in equity and statement of cash flows for the year then ended, and a summary of significant accounting policies and other explanatory notes, as set out on pages 44 to 73.
Management’s Responsibility for the Financial Statements
Management is responsible for the preparation and fair presentation of these financial statements in accordance with the provisions of the Singapore Tourism Board Act, Cap. 305B (the “Act”) and Statutory Board Financial Reporting Standards (“SB-FRS”). This responsibility includes:
(a) designing, implementing and maintaining internal control relevant to the preparation and fair presentation of financial statements that are free from material misstatement, whether due to fraud or error;
(b) selecting and applying appropriate accounting policies; and
(c) making accounting estimates that are reasonable in the circumstances.
Auditors’ Responsibility
Our responsibility is to express an opinion on these financial statements based on our audit. We conducted our audit in accordance with Singapore Standards on Auditing. Those standards require that we comply with ethical requirements and plan and perform the audit to obtain reasonable assurance whether the financial statements are free from material misstatement.
Independent Auditors’ Report to
Singapore Tourism Board
43
An audit involves performing procedures to obtain audit evidence about the amounts and disclosures in the financial statements. The procedures selected depend on the auditor’s judgment, including the assessment of the risks of material misstatement of the financial statements, whether due to fraud or error. In making those risk assessments, the auditor considers the internal control relevant to the entity’s preparation and fair presentation of the financial statements in order to design audit procedures that are appropriate in the circumstances but not for the purpose of expressing an opinion on the effectiveness of the entity’s internal control. An audit also includes evaluating the appropriateness of accounting policies used and the reasonableness of accounting estimates made by the management, as well as evaluating the overall presentation of the financial statements. We believe that the audit evidence we have obtained is sufficient and appropriate to provide a basis for our audit opinion.
Opinion
In our opinion,
(a) the financial statements are properly drawn up in accordance with the provisions of the Act and SB-FRS so as to give a true and fair view of the state of affairs of STB as at 31 March 2010 and of the results, changes in equity and cash flows of STB for the financial year ended on that date; and
(b) the accounting and other records, required by the Act to be kept by STB have been properly kept in accordance with the provisions of the Act.
Report on Other Legal and Regulatory Requirements
During the course of our audit, nothing came to our notice that caused us to believe that the receipt, expenditure and investments of monies and the acquisition and disposal of assets by STB during the year have not been in accordance with the provisions of the Act.
Public Accountants andCertified Public Accountants
Singapore8 July 2010
Independent Auditors’ Report to
Singapore Tourism Board
44

The accompanying notes form part of the financial statements.
Statement of Financial Position
As at 31 March 2010
Note 2009/2010 2008/2009$’000 $’000
Capital and ReservesShare capital 5 95,318 53,935Accumulated surplus 181,395 175,767
276,713 229,702
Represented by:
Non-Current AssetsProperty, plant and equipment 7 127,030 67,278Investment properties 8 19,662 15,992Finance lease receivable 9 22,705 23,095Available-for-sale-investments 10 2,000 2,000Other assets 150 159Total non-current assets 171,547 108,524
Current AssetsCash and cash equivalents 11 117,208 90,803Receivables and prepayments 12 42,270 68,966Current portion of finance lease receivable 9 390 367Financial assets under fund management 13 33,003 31,415Total current assets 192,871 191,551
Less:Current LiabilitiesAdvances and deposits received 14 13,655 11,669Trade and other payables 15 71,299 57,479Current portion of deferred long-term lease income 117 117Total current liabilities 85,071 69,265
Net Current Assets 107,800 122,286
Non-Current LiabilitiesDeferred long-term lease income 991 1,108Deferred capital grant 20 1,643 - Total non-current liabilities 2,634 1,108
Net Assets 276,713 229,702
Net Assets of Trust and Agency Funds 6 2,180 5,238
45

Statement of Comprehensive Income
Year ended 31 March 2010
Note 2009/2010 2008/2009
$’000 $’000
Income or expense:
Funding from Government 185,153 183,113
Other operating income 16 18,920 30,116
204,073 213,229
Operating expenses: (200,124) (236,166)
Employee benefit expense 17 (50,528) (52,882)
Depreciation of property, plant and equipment 7 (9,811) (9,826)
Depreciation of investment properties 8 (273) (206)
Others 18 (139,512) (173,252)
Operating surplus (deficit) 3,949 (22,937)
Non-operating income, net 19 1,660 5,118
Surplus (Deficit) before government grants 5,609 (17,819)
Deferred capital grants amortised representing government grants 20 19 -
Surplus (Deficit) before contribution to consolidated fund 5,628 (17,819)
Contribution to consolidated fund 21 - -
Surplus (Deficit) for the year, representing total comprehensive income (loss) for the year 5,628 (17,819)
The accompanying notes form part of the financial statements.
46

Note Sharecapital
Accumulated surplus
Total
$’000 $’000 $’000
At 1 April 2008 - 193,586 193,586
Total comprehensive loss for the year - (17,819) (17,819)
Equity injection 5 53,935 - 53,935
At 31 March 2009 53,935 175,767 229,702
Total comprehensive income for the year - 5,628 5,628
Equity injection 5 41,383 - 41,383
At 31 March 2010 95,318 181,395 276,713
Statement of Changes in Equity
Year ended 31 March 2010
The accompanying notes form part of the financial statements.
47

2009/2010 2008/2009
$’000 $’000
Operating activities
Surplus (Deficit) before contribution to consolidated fund 5,628 (17,819)
Adjustments for:
Depreciation of property, plant and equipment 9,811 9,826
Depreciation of investment properties 273 206
Loss on disposal/write off of property, plant and equipment 104 12
Gain on disposal of investment properties - (4,333)
Loss on disposal of club membership 9 -
Dividend income - (37)
Interest income (1,353) (1,894)
Deferred long-term lease income (117) (117)
Amortisation of deferred capital grant (19) -
Allowance/Write off for doubtful receivables 167 376
Change in fair value of financial assets under
fund management (818) 720
Finance lease income (1,458) (1,109)
Surplus (Deficit) before movement in working capital 12,227 (14,169)
Receivables and prepayments 26,529 (12,793)
Advances and deposit received 1,986 (10,719)
Trade and other payables 13,820 (1,310)
Cash generated from (used in) operating activities 54,562 (38,991)
Interest received 2,811 3,003
Net cash from (used in) operating activities 57,373 (35,988)
Statement of Cash Flows
Year ended 31 March 2010
48
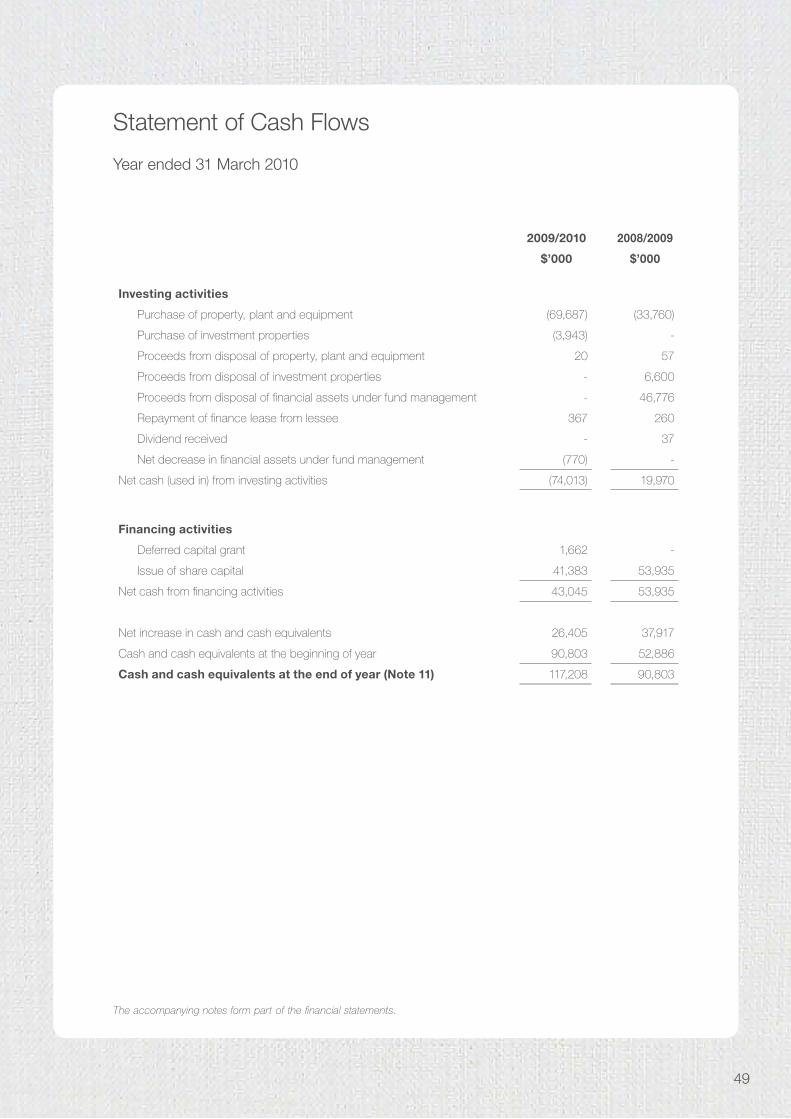
2009/2010 2008/2009
$’000 $’000
Investing activities
Purchase of property, plant and equipment (69,687) (33,760)
Purchase of investment properties (3,943) -
Proceeds from disposal of property, plant and equipment 20 57
Proceeds from disposal of investment properties - 6,600
Proceeds from disposal of financial assets under fund management - 46,776
Repayment of finance lease from lessee 367 260
Dividend received - 37
Net decrease in financial assets under fund management (770) -
Net cash (used in) from investing activities (74,013) 19,970
Financing activities
Deferred capital grant 1,662 -
Issue of share capital 41,383 53,935
Net cash from financing activities 43,045 53,935
Net increase in cash and cash equivalents 26,405 37,917
Cash and cash equivalents at the beginning of year 90,803 52,886
Cash and cash equivalents at the end of year (Note 11) 117,208 90,803
The accompanying notes form part of the financial statements.
Statement of Cash Flows
Year ended 31 March 2010
49
1 GENERAL
Singapore Tourism Board (“STB”), is a Singapore statutory board under the Ministry of Trade and Industry established under the Singapore Tourism Board Act, Cap. 305B.
STB’s registered office and principal place of operations is located at Tourism Court, 1 Orchard Spring Lane, Singapore 247729.
STB’s primary functions are to:
(a) develop and promote Singapore as a travel and tourist destination;
(b) advise the Government on matters relating to travel and tourism;
(c) enhance the travel and tourism sector’s contribution to the Singapore economy; and
(d) exercise licensing and regulatory functions in respect of such tourism enterprises as STB may determine.
There have been no significant changes in the nature of these activities during the financial year.
The financial statements of STB for the financial year ended 31 March 2010 were authorised for issue by members of the Board of Directors on 8 July 2010.
2 SUMMARY OF SIGNIFICANT ACCOUNTING POLICIES
(a) BASIS OF ACCOUNTING AND ADOPTION OF NEW AND REVISED STANDARDS
The financial statements are prepared in accordance with the historical cost convention, except as disclosed in the accounting polices below, and are drawn up in accordance with the provisions of the Singapore Tourism Board Act, Chapter 305B and the Statutory Board Financial Reporting Standards (“SB-FRS”), including INT SB-FRS and Guidance Notes.
In the current financial year, STB has adopted all the new and revised SB-FRSs, INT SB-FRS and SB-FRS Guidance Notes that are relevant to its operations and effective for annual periods beginning on or after 1 April 2009. The adoption of these new/revised SB-FRSs, INT SB-FRSs and SB-FRS Guidance Notes do not result in changes to STB’s accounting policies and has no material effect on the amounts reported for the current or prior years except as disclosed below and in the notes to the financial statements.
SB-FRS 1 - Presentation of Financial Statements (Revised)
SB-FRS 1 (2008) has introduced terminology changes (including revised titles for the financial statements) and changes in the format and content of the financial statements. In addition, the revised Standard requires the presentation of a third statement of financial position at the beginning of the earliest comparative period presented if the entity applies new accounting policies retrospectively or makes retrospective restatements or reclassifies items in the financial statements.
Notes to the Financial Statements
31 March 2010
50

Amendments to SB-FRS 107 Financial Instruments : Disclosures - Improving Disclosures about Financial Instruments
The amendments to SB-FRS 107 expand the disclosures required in respect of fair value measurements and liquidity risk. STB has elected not to provide comparative information for these expanded disclosures in the current year in accordance with the transitional reliefs offered in these amendments.
Management has considered and is of the view that the adoption of the SB-FRSs, INT SB-FRSs and Amendments to SB-FRS that were issued at the date of authorisation of these financial statements but not effective until future periods will have no material impact on the financial statements in the period of their initial adoption.
(b) FINANCIAL INSTRUMENTS
Financial assets and financial liabilities are recognised in the statement of financial position when STB becomes a party to the contractual provisions of the instrument.
Effective interest method
The effective interest method is a method of calculating the amortised cost of a financial instrument and of allocating interest income or expense over the relevant period. The effective interest rate is the rate that exactly discounts estimated future cash receipts or payments (including all fees paid or received that form an integral part of the effective interest rate, transaction costs and other premium or discounts) through the expected life of the financial instrument, or where appropriate, a shorter period. Income and expenses are recognised on an effective interest basis for debt instruments.
Financial assets
Investments are recognised and de-recognised on a trade date where the purchase or sale of an investment is under a contract whose terms require delivery of the investment within the timeframe established by the market concerned, and are initially measured at fair value plus transaction costs, except for those financial assets classified as at fair value through profit or loss which are initially measured at fair value.
Other financial assets are classified into the following specified categories: financial assets “at fair value through profit or loss, “available-for-sale” financial assets and “loans and receivables”. The classification depends on the nature and purpose of financial assets and is determined at the time of initial recognition.
Cash and cash equivalents
Cash and cash equivalents comprise cash at bank and demand deposits that are readily convertible to a known amount of cash and are subject to an insignificant risk of changes in value.
Notes to the Financial Statements
31 March 2010
51

Loans and receivables
Trade and other receivables, loans and finance lease receivable that have fixed or determinable payments and are not quoted in an active market are classified as “loans and receivables”. Loans and receivables are measured at amortised cost using the effective interest method less impairment. Interest is recognised by applying the effective interest method, except for short-term receivables when the recognition of interest would be immaterial.
Financial assets at fair value through profit or loss (FVPL)
Financial assets are classified as FVPL where the financial asset is either held for trading or it is designated as FVPL.
A financial asset is classified as held for trading if:
(i) it has been acquired principally for the purpose of selling in the near future; or
(ii) it is a part of an identified portfolio of financial instruments that STB manages and has a recent actual pattern of short-term profit-taking; or
(iii) it is a derivative that is not designated as effective hedging instrument.
A financial asset other than a financial asset held for trading may be designated as FVPL upon initial recognition if:
a. such designation eliminates or significantly reduces a measurement or recognition inconsistency that would otherwise arise; or
b. the financial asset forms part of a group of financial assets or financial liabilities or both, which is managed and its performance is evaluated on a fair value basis, in accordance with STB’s documented risk management or investment strategy, and information about the grouping is provided internally on that basis; or
c. it forms part of a contract containing one or more embedded derivatives, and SB-FRS 39 permits the entire combined contract (asset or liability) to be designated as FVPL.
Financial assets at fair value through profit or loss are stated at fair value, with any resultant gain or loss recognised in income or expenses. The net gain or loss recognised in income or expense incorporates any dividend or interest earned on the financial asset. Fair value is determined in the manner described in Note 4(b).
Available-for-sale financial assets
Certain investments held by STB are classified as being available for sale and are stated at fair value. Fair value is determined in the manner described in Note 4(b). Gains and losses arising from changes in fair value are recognized in other comprehensive income with the exception of impairment losses, interest calculated using the effective interest method and foreign exchange gains and losses on monetary assets which are recognised directly in income or expense. Where the investment is disposed of or is determined to be impaired, the cumulative gain or loss previously recognised in other comprehensive income and accumulate in revaluation reserve is reclassified to income or expense. Dividends on available-for-sale equity instruments are recognised in income or expense when STB’s right to receive payments is established. The fair value of available-for-sale monetary assets denominated in a foreign currency is determined in that foreign currency and translated at the spot rate at end of the reporting period. The change
Notes to the Financial Statements
31 March 2010
52
in fair value attributable to translation differences that result from a change in amortised cost of the asset is recognised in income or expense, and other changes are recognised in other comprehensive income.
Impairment of financial assets
Financial assets, other than those at fair value through profit or loss, are assessed for indicators of impairment at the end of each reporting period. Financial assets are impaired where there is objective evidence that, as a result of one or more events that occurred after the initial recognition of the financial asset, the estimated future cash flows of the financial assets have been impacted.
For financial assets carried at amortised cost, the amount of the impairment is the difference between the asset’s carrying amount and the present value of estimated future cash flows, discounted at the original effective interest rate.
The carrying amount of the financial asset is reduced by the impairment loss directly for all financial assets with the exception of trade receivables where the carrying amount is reduced through the use of an allowance account. When a trade receivable is uncollectible, it is written off against the allowance account. Subsequent recoveries of amounts previously written off are credited against the allowance account. Changes in the carrying amount of the allowance account are recognised in income or expense.
When an available-for-sale financial asset is considered to be impaired, cumulative gains or losses previously recognised in other comprehensive income are reclassified to income or expense.
With the exception of available-for-sale equity instruments, if, in a subsequent period, the amount of the impairment loss decreases and the decrease can be related objectively to an event occurring after the impairment loss was recognised, the previously recognised impairment loss is reversed through income or expense to the extent that the carrying amount of the investment at the date the impairment is reversed does not exceed what the amortised cost would have been had the impairment loss not been recognised.
Derecognition of financial assets
STB derecognises a financial asset only when the contractual rights to the cash flows from the asset expire, or it transfers the financial asset and substantially all the risks and rewards of ownership of the asset to another entity. If STB neither transfers nor retains substantially all the risks and rewards of ownership and continues to control the transferred asset, STB recognises its retained interest in the asset and an associated liability for amounts it may have to pay. If STB retains substantially all the risks and rewards of ownership of a transferred financial asset, STB continues to recognise the financial asset and also recognises a collateralised borrowing for the proceeds received.
Financial liabilities and equity instruments
Classification as debt or equity
Financial liabilities and equity instruments issued by STB are classified according to the substance of the contractual arrangements entered into and the definitions of a financial liability and an equity instrument.
Notes to the Financial Statements
31 March 2010
53

Equity instruments
An equity instrument is any contract that evidences a residual interest in the assets of STB after deducting all of its liabilities. Equity instruments are recorded at the proceeds received, net of direct issue costs.
Financial liabilities
Trade and other payables are initially measured at fair value, net of transaction costs, and are subsequently measured at amortised cost, using the effective interest method, with interest expense recognised on an effective yield basis.
Derecognition of financial liabilities
STB derecognises financial liabilities when, and only when obligations are discharged, cancelled or they expire.
(c) LEASES
Leases are classified as finance leases whenever the terms of the lease transfer substantially all the risks and rewards of ownership to the lessee. All other leases are classified as operating leases.
STB as lessor
Amounts due from lessees under finance leases are recorded as receivables at the amount of STB’s net investment in the leases. Finance lease income is allocated to accounting periods so as to reflect a constant periodic rate of return on STB’s net investment outstanding in respect of the leases.
Rental income from operating leases is recognised on a straight-line basis over the term of the relevant lease unless another systematic basis is more representative of the time pattern in which use benefit derived from the leased asset is diminished. Initial direct costs incurred in negotiating and arranging an operating lease are added to the carrying amount of the leased asset and recognised on a straight-line basis over the lease term.
STB as lessee
Rentals payable under operating leases are charged to income or expense on a straight-line basis over the term of the relevant lease unless another systematic basis is more representative of the time pattern in which economic benefits from the leased asset are consumed. Contingent rentals arising under operating leases are recognised as an expense in the period in which they are incurred.
In the event that lease incentives are received to enter into operating leases, such incentives are recognised as a liability. The aggregate benefit of incentives is recognised as a reduction of rental expense on a straight-line basis, except where another systematic basis is more representative of the time pattern in which economic benefits from the leased asset are consumed.
Notes to the Financial Statements
31 March 2010
54
(d) PROPERTY, PLANT AND EQUIPMENT
Property, plant and equipment are stated at cost less accumulated depreciation and accumulated impairment losses.
Depreciation of property, plant and equipment begins when the asset is available for use and is calculated using the straight-line method to allocate their depreciable amounts over their expected useful lives as follows:
Leasehold land
Buildings
–
–
Over the lease periods of 99 years
25 years
Building improvements – 5 years
Furniture, fittings and equipment
Motor vehicles
–
–
3 to 5 years
5 years
Electrical installation and air-conditioners
Tourism assets
–
–
7 years
3 to 10 years
Capital work-in-progress included in property, plant and equipment is not depreciated as these assets are not available for use. Fully depreciated assets still in use are retained in the financial statements.
The carrying values of property, plant and equipment are reviewed for impairment when events or changes in circumstances indicate that the carrying amount may not be recoverable.
The residual values and useful lives of property, plant and equipment are reviewed and adjusted as appropriate, at each reporting period to ensure that the amount, method and period of depreciation are consistent with previous estimates and the expected pattern of consumption of the future economic benefits embodied in the items of property, plant and equipment.
An item of property, plant and equipment is derecognised upon disposal or when no future economic benefits are expected from its use or disposal. Any gain or loss arising on derecognition of the asset is included in the income or expense in the year the asset is derecognised.
(e) INVESTMENT PROPERTIES
Investment properties are initially recognised at cost and subsequently carried at cost less accumulated depreciation and accumulated impairment losses.
Investment properties are depreciated over the lease period as follows:
Leasehold land and building - Over the lease periods of 99 years
The residual values and estimated useful lives of investment properties are reviewed, and adjusted as appropriate at each reporting period, with the effect of any changes in estimates accounted for on a prospective basis.
Investment properties are subject to renovations or improvements at regular intervals. The cost of major renovations and improvements is capitalised as addition and the carrying amounts of the
Notes to the Financial Statements
31 March 2010
55
replaced components are written off to the income or expense. The cost of maintenance, repairs and minor improvement is charged to the income or expense when incurred.
On disposal of an investment property, the difference between the net disposal proceeds and its carrying amount is taken to the income or expense.
(f) OTHER ASSETS
Other assets pertain to the club memberships which are stated at cost, less any impairment in net recoverable value.
(g) IMPAIRMENT OF NON FINANCIAL ASSETS
At the end of each reporting period, STB reviews the carrying amounts of its assets to determine whether there is any indication that those assets have suffered an impairment loss. If any such indication exists, the recoverable amount of the asset is estimated in order to determine the extent of the impairment loss (if any). Where it is not possible to estimate the recoverable amount of an individual asset, STB estimates the recoverable amount of the cash-generating unit to which the asset belongs.
Recoverable amount is the higher of fair value less costs to sell and value in use. In assessing value in use, the estimated future cash flows are discounted to their present value using a pre- tax discount rate that reflects current market assessments of the time value of money and the risks specific to the asset.
If the recoverable amount of an asset (or cash-generating unit) is estimated to be less than its carrying amount, the carrying amount of the asset (or cash-generating unit) is reduced to its recoverable amount. An impairment loss is recognised immediately in income or expense.
Where an impairment loss is subsequently reversed, the carrying amount of the asset (or cash - generating unit) is increased to the revised estimate of its recoverable amount, but only to the extent that the increased carrying amount does not exceed the carrying amount that would have been determined had no impairment loss been recognised for the asset (or cash-generating unit) in prior years. A reversal of an impairment loss is recognised immediately in income or expense.
(h) PROVISIONS
Provisions are recognised when STB has a present obligation (legal or constructive) as a result of a past event, it is probable that STB will be required to settle the obligation, and a reliable estimate can be made of the amount of the obligation.
The amount recognised as a provision is the best estimate of the consideration required to settle the present obligation at the end of the reporting period, taking into account the risks and uncertainties surrounding the obligation. Where a provision is measured using the cash flows estimated to settle the present obligation, its carrying amount is the present value of those cash flows.
When some or all of the economic benefits required to settle a provision are expected to be recovered from a third party, the receivable is recognised as an asset if it is virtually certain that reimbursement will be received and the amount of the receivable can be measured reliably.
Notes to the Financial Statements
31 March 2010
56
(i) SHARE CAPITAL
Pursuant to the Financial Circular Minute (“FCM”) No. 26/2008 on Capital Management Framework (“CMF”), equity injection from the Government is recorded as share capital.
(j) GOVERNMENT GRANTS
Government grants are not recognised until there is reasonable assurance that STB will comply with the conditions attaching to them and the grants will be received. Government grants whose primary condition is that STB should purchase, construct or otherwise acquire non-current assets are recognised as deferred income in the statement of financial position and transferred to income or expenses on a systematic and rational basis over the useful lives of the related assets.
Other government grants are recognised as income over the periods necessary to match them with the costs for which they are intended to compensate, on a systematic basis. Government grants that are receivable as compensation for expenses or losses already incurred or for the purpose of giving immediate financial support to STB with no future related costs are recognised in income or expenses in the period in which they become receivable.
(k) TRUST AND AGENCY FUNDS
Trust and agency funds are set up to account for funds held in trust where STB is not the owner and beneficiary of the funds received from the Government and other organisation. Income or expenses of these funds are taken directly to the funds. The net assets relating to the funds are shown as a separate line item in the statement of financial position.
STB administers the funds on behalf of the holders of these funds. Upon dissolution of these funds, the remaining monies in these funds shall be returned to the owners of the funds.
(l) DEFERRED LONG-TERM LEASE INCOME
Premiums received in advance from long-term leases are credited to a deferred long-term lease income account and are credited to the income or expense on a straight-line basis over the period of the leases.
(m) INCOME RECOGNITION
Revenue is recognised to the extent that it is probable that the economic benefits will flow to STB and the revenue can be reliably measured. The following specific recognition criteria must also be met before revenue is recognised:
Funding from Government
Funding from supervisory ministry is recognised on an accrual basis.
Events-related revenue
Events-related revenue is recognised when the events are completed.
Notes to the Financial Statements
31 March 2010
57

Lease income
Lease income is accounted for in accordance with the accounting policy for leases as detailed in Note 2(c) above.
Dividend income
Dividend income is recognised when STB’s right to receive payment is established.
Interest income
Interest income is accrued on a time-proportion basis, by reference to the principal outstanding and at the effective interest rate applicable.
(n) EMPLOYEE BENEFITS
Defined contribution plans
Payments to defined contribution retirement benefit plans are charged as an expense as they fall due. Payments made to state-managed retirement benefit schemes, such as the Singapore Central Provident Fund, are dealt with as payments to defined contribution plans where STB’s obligations under the plans are equivalent to those arising in a defined contribution retirement benefit plan.
Employee leave entitlement
Employee entitlements to annual leave are recognised as a liability when they accrue to employees. The estimated liability for leave is recognised for services rendered by employees up to the end of the reporting period.
(o) CONTRIBUTION TO CONSOLIDATED FUND
Under Section 13(1)(e) and the First Schedule of the Singapore Income Tax Act, Chapter 134, the income of STB is exempt from income tax.
In lieu of income tax, STB is required to make contribution to the Government Consolidated Fund in accordance with the Statutory Corporations (Contributions to Consolidated Fund) Act, Chapter 319A. The provision is based on the guidelines specified by the Ministry of Finance. It is computed based on the net surplus of STB for each of the financial year (adjusted for any accumulated deficits brought forward from prior years) at the prevailing corporate tax rate for the Year of Assessment. Contribution to consolidated fund is provided for on an accrual basis.
(p) FOREIGN CURRENCY TRANSACTIONS
The financial statements of STB are measured and presented in Singapore dollars, which is the currency of the primary economic environment in which STB operates (its functional currency).
In preparing the financial statements of STB, transactions in currencies other than STB’s functional currency are recorded at the rate of exchange prevailing on the date of the transaction. At the end of each reporting period, monetary items denominated in foreign currencies are retranslated at the rates prevailing at the end of the reporting period. Non-monetary items carried at fair value that are denominated in foreign currencies are retranslated at the rates prevailing on the date when the fair
Notes to the Financial Statements
31 March 2010
58
value was determined. Non-monetary items that are measured in terms of historical cost in a foreign currency are not retranslated.
Exchange differences arising on the settlement of monetary items, and on retranslation of monetary items are included in income or expense for the period. Exchange differences arising on the retranslation of non-monetary items carried at fair value are included in income or expense for the period except for differences arising on the retranslation of non-monetary items in respect of which gains and losses are recognised other comprehensive income. For such non-monetary items, any exchange component of that gain or loss is also recognised in other comprehensive income.
3 CRITICAL ACCOUNTING JUDGEMENTS AND KEY SOURCES OFESTIMATION UNCERTAINTYIn the application of STB’s accounting policies, which are described in Note 2, management is required to make judgements, estimates and assumptions about the carrying amounts of assets and liabilities that are not readily apparent from other sources. The estimates and associated assumptions are based on historical experience and other factors that are considered to be relevant. Actual results may differ from these estimates.
The estimates and underlying assumptions are reviewed on an ongoing basis. Revisions to accounting estimates are recognised in the period in which the estimate is revised if the revision affects only that period, or in the period of the revision and future periods if the revision affects both current and future periods.
Critical judgments in applying STB’s accounting policies
Management is of the opinion that there are no critical judgments involved that have a significant effect on the amounts recognised in the financial statements except as described below:
Operating lease arrangements - As Lessor
STB has entered into tourism-related property leases on its property portfolio. STB has determined that it retains all the significant risks and rewards of ownership of these properties which are leased out under operating leases.
Impairment of financial assets
STB follows the guidance of SB-FRS 39 on determining when a financial asset is impaired. This determination requires significant judgement. STB evaluates, among other factors, the duration and extent to which the fair value of a financial asset is less than its cost; and the financial health of and near-term business outlook for the financial asset, including factors such as industry and sector performance, changes in technology and operational and financing cash flow.
Notes to the Financial Statements
31 March 2010
59

Keysourcesofestimationuncertainty
The key assumptions concerning the future, and other key sources of estimation uncertainty at the end of the respective reporting period, that have a significant risk of causing a material adjustment to the carrying amounts of assets and liabilities within the next financial year, are discussed below:
Depreciation of property, plant and equipment
The cost of property, plant and equipment is depreciated on a straight-line basis over their useful lives. STB estimates the useful lives of these property, plant and equipment to be within 3 to 99 years, based on the lease period for leasehold properties and estimated useful lives of the assets. The carrying amount of property, plant and equipment at 31 March 2010 was $127,029,886 (2008/2009 : $67,278,355). Changes in the expected level of usage, technological developments and economic condition could impact the economic useful lives and the residual values of these assets, therefore future depreciation charges could be revised.
4 FINANCIALINSTRUMENTS,FINANCIALRISKSANDCAPITALRISKSMANAGEMENT(a) Categories of financial instruments
The following table sets out the financial instruments:
2009/2010 2008/2009
$’000 $’000
Financial assets
At fair value through profit or loss 33,003 31,415
Loans and receivables (including cash and cash equivalent) 178,192 157,076
Available-for-sale investments 2,000 2,000
Total 213,195 190,491
Financial liability
Amortised cost 82,833 67,081
(b) Financial risk management policies and objectives
STB, in its normal course of operations, is exposed to market risk (including foreign exchange risk and interest rate risk), credit risk and liquidity risk. While STB does not hold or issue derivative financial instruments for trading purposes, STB may use such instruments for risk management purposes. STB has written policies and guidelines, which set out its general risk management philosophy.
Notes to the Financial Statements
31 March 2010
60

(i) Foreign exchange risk management
STB has exposure to foreign currency risk from transactions denominated in foreign currencies arising from its normal course of operations and from its investment portfolio arising from securities denominated in foreign currencies. Where appropriate, STB may hedge these risks as they arise.
At the reporting date, the carrying amounts of monetary assets and monetary liabilities denominated in significant foreign currencies other than STB’s functional currency are disclosed in the respective notes to the financial statements.
Foreign currency sensitivity analysis has not been presented as management do not expect any reasonable possible changes in foreign currency exchange rates to have a significant impact on STB’s operations and cashflows.
(ii) Interest rate risk management
STB’s exposure to changes in interest rates relates primarily to investments in fixed income instruments and fixed deposits. Fixed income instruments are managed by external fund managers appointed by STB. It is STB’s policy to obtain the most favourable interest rate for its fixed deposits depending on the immediate cash requirements. Interest rate sensitivity analysis has not been presented as management do not expect any reasonable possible changes in interest rates to have a significant impact on STB’s operations and cash flows.
(iii) Credit risk management
Credit risk refers to the risk that a counterparty will default on its contractual obligations resulting in financial loss to STB.
Cash and fixed deposits are placed with reputable financial institutions. Investments in financial instruments are managed by approved and reputable fund managers.
Credit risks, or the risk of counterparties defaulting, are controlled by the application of regular monitoring procedures. The extent of STB’s credit exposure is represented by the aggregate balance of financial assets at the end of each reporting period.
(iv) Liquidity risk
STB monitors and maintains a level of cash and cash equivalents deemed adequate to finance its’ operations. The investment portfolio comprises securities with resale markets to ensure portfolio liquidity.
STB does not have a significant exposure to liquidity risk as at the end of each reporting periods.
(v) Fair values of financial assets and financial liabilities
The carrying amounts of financial assets and financial liabilities as reported in the financial statements approximate their respective fair values due to the relatively short- term maturity of these financial instruments.
The fair values of financial assets and financial liabilities are determined as follows:
Notes to the Financial Statements
31 March 2010
61

the fair value of financial assets and financial liabilities with standard terms and •conditions and traded on active liquid markets are determined with reference to quoted market prices; and
Unquoted investment whose fair value cannot be reliably measured by alternative •valuation methods are carried at cost less any impairment losses.
STB classifies fair value measurements using a fair value hierarchy that reflects the significance of the inputs used in making the measurements. The fair value hierarchy has the following levels:
(a) quoted prices (unadjusted) in active markets for identical assets or liabilities (Level 1);
(b) inputs other than quoted prices included within Level 1 that are observable for the asset or liability, either directly (i.e. as prices) or indirectly (i.e. derived from prices) (Level 2); and
(c) inputs for the asset or liability that are not based on observable market data (unobservable inputs) (Level 3).
Financial instruments:
Total Level 1 Level 2 Level 3$’000 $’000 $’000 $’000
2009/2010
Financial assets at FVPL:Quoted debt securities 24,449 20,595 3,854 -
Financial liabilities at FVPL:Derivative financial instruments 112 112 - -
There were no significant transfers between levels of the fair value hierarchy during the financial year.
(c) Capital risk management policies and objectives
STB manages its capital to ensure that STB will be able to continue as a going concern while fulfilling its objective as a statutory board.
The capital structure of STB consists of share capital and accumulated surplus. STB’s overall strategy remains unchanged from the previous financial year.
Notes to the Financial Statements
31 March 2010
62
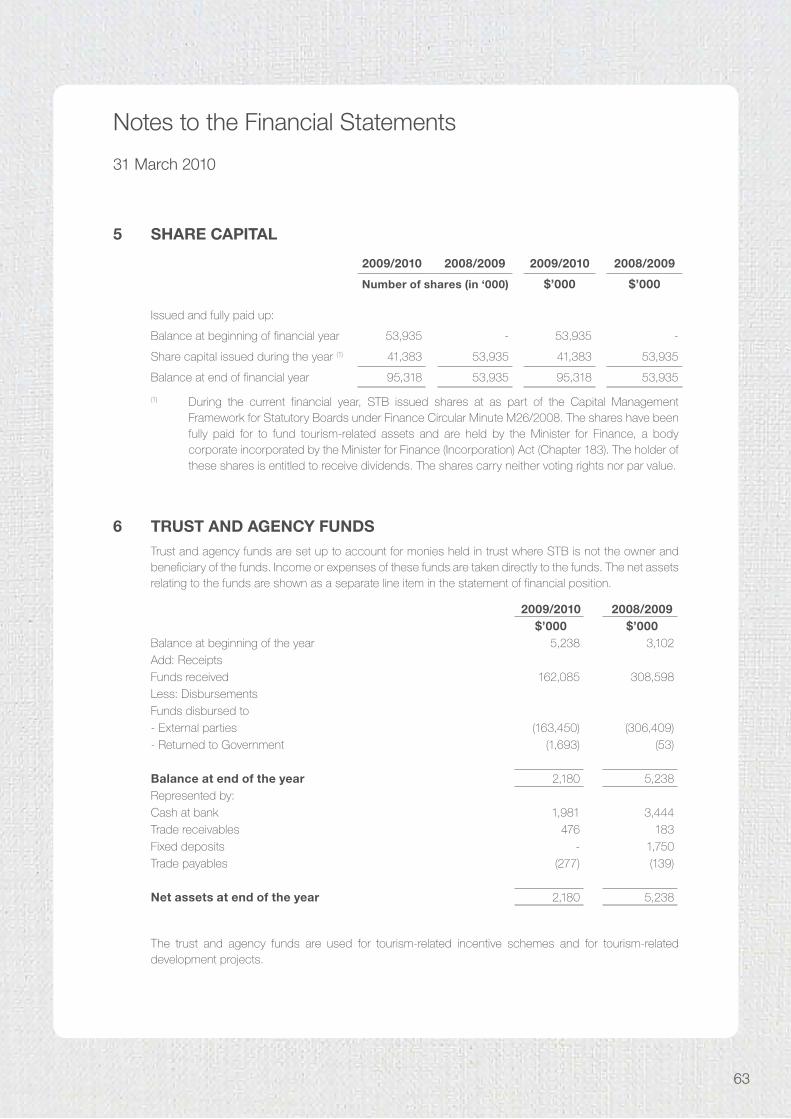
5 SHARE CAPITAL
2009/2010 2008/2009 2009/2010 2008/2009
Number of shares (in ‘000) $’000 $’000
Issued and fully paid up:
Balance at beginning of financial year 53,935 - 53,935 -
Share capital issued during the year (1) 41,383 53,935 41,383 53,935
Balance at end of financial year 95,318 53,935 95,318 53,935
(1) During the current financial year, STB issued shares at as part of the Capital Management Framework for Statutory Boards under Finance Circular Minute M26/2008. The shares have been fully paid for to fund tourism-related assets and are held by the Minister for Finance, a body corporate incorporated by the Minister for Finance (Incorporation) Act (Chapter 183). The holder of these shares is entitled to receive dividends. The shares carry neither voting rights nor par value.
6 TRUST AND AGENCY FUNDSTrust and agency funds are set up to account for monies held in trust where STB is not the owner and beneficiary of the funds. Income or expenses of these funds are taken directly to the funds. The net assets relating to the funds are shown as a separate line item in the statement of financial position.
2009/2010 2008/2009$’000 $’000
Balance at beginning of the year 5,238 3,102Add: ReceiptsFunds received 162,085 308,598Less: DisbursementsFunds disbursed to- External parties (163,450) (306,409)- Returned to Government (1,693) (53)
Balance at end of the year 2,180 5,238Represented by:Cash at bank 1,981 3,444Trade receivables 476 183Fixed deposits - 1,750Trade payables (277) (139)
Net assets at end of the year 2,180 5,238
The trust and agency funds are used for tourism-related incentive schemes and for tourism-related development projects.
Notes to the Financial Statements
31 March 2010
63

7
PR
OP
ER
TY,
PL
AN
T A
ND
EQ
UIP
ME
NT
Le
aseh
old
la
nd
Bui
ldin
gs
Bui
ldin
g
imp
rove
men
ts
Fu
rnit
ure
fi
ttin
gs
and
e
qu
ipm
en
tM
oto
r ve
hic
les
Ele
ctri
cal
Inst
alla
tio
n a
nd
air
- co
nd
itio
ner
s
Cap
ital
w
ork
-in
-p
rog
ress
To
uri
sm
ass
ets*
Tota
l$’
000
$’00
0$’
000
$’00
0$’
000
$’00
0$’
000
$’00
0$’
000
Cos
t: At
1 A
pril
200
83,
430
66,1
259,
931
25,5
621,
562
1,32
893
1-
108,
869
Add
ition
s-
-25
244
677
45,
017
27,9
6433
,760
Rec
lass
ifica
tion
--
676
120
--
(79
6)-
-D
ispo
sal/
writ
e-of
f-
- (3
68)
(1,2
04)
(125
)
(3)
-
- (1
,70
0)A
t 31
Mar
ch 2
00
93,
430
66,1
2510
,491
24,9
241,
514
1,32
95,
152
27,9
6414
0,92
9A
dditi
ons
--
-35
8-
-65
,132
4,19
769
,687
Rec
lass
ifica
tion
--
225
638
--
(863
)-
-D
ispo
sal/
writ
e-of
f -
-
(5
89)
(329
) (1
27)
(21)
-
-
(1,0
66)
At
31 M
arch
201
03,
430
66,1
2510
,127
25,5
911,
387
1,30
869
,421
32,1
6120
9,55
0
Acc
umul
ated
dep
reci
atio
n:
At
1 A
pril
200
850
834
,328
7,31
521
,380
1,08
584
0-
-65
,456
Dep
reci
atio
n39
2,64
51,
761
2,26
817
414
0-
2,79
99,
826
Dis
posa
l/w
rite-
off
-
-
(331
) (1
,199
) (9
9)
(2)
-
-
(1,6
31)
At
31 M
arch
20
09
547
36,9
738,
745
22,4
491,
160
978
-2,
799
73,6
51D
epre
ciat
ion
392,
645
722
2,56
016
313
33,
549
9,81
1D
ispo
sal/
writ
e-of
f -
-
(4
87)
(315
) (1
27)
(13)
-
-
(9
42)
At
31 M
arch
201
0 5
8639
,618
8,9
80
24,6
941,
196
1,09
8 -
6
,348
82,
520
Car
ryin
g am
ount
:
At
31 M
arch
201
02,
844
26,5
07 1
,147
897
191
210
69,4
2125
,813
127,
030
At
31 M
arch
20
09
2,88
329
,152
1,7
46 2
,475
354
351
5,1
5225
,165
67,
278
* To
uris
m a
sset
s in
clud
es a
sset
s su
ch a
s lig
htin
gs, b
arrie
rs, b
ridge
s, s
tora
ge b
uild
ing,
food
sta
ll ki
osks
, stre
et-la
mps
and
oth
ers.
Not
es to
the
Fina
ncia
l Sta
tem
ents
31 M
arch
201
0
64

8 INVESTMENT PROPERTIES
2009/2010 2008/2009$’000 $’000
Cost:
Balance at beginning of the year 20,146 22,951
Additions 3,943 -
Disposal - (2,805)
Balance at end of the year 24,089 20,146
Accumulated depreciation
Balance at beginning of the year 4,154 4,486
Depreciation for the year 273 206
Disposal - (538)
Balance at end of the year 4,427 4,154
Carrying amount 19,662 15,992
Fair value 56,376 45,666
Investment properties are held by STB for the purpose of tourism promotion and development and generate rental income for STB.
The fair values of investment properties at end of the respective reporting periods are determined by independent professional valuers with appropriate recognised professional qualifications and recent experience in the location and category of the properties being valued. The valuation were arrived at by reference to market evidence of transaction prices for similar properties.
Investment properties are leased to non-related parties under operating leases.
The following amounts are recognised in the income or expense:
2009/2010 2008/2009$’000 $’000
Rental income
Direct operating expenses (including repairs and maintenance)
arising from investment properties that generated rental income
246
227
220
388
Notes to the Financial Statements
31 March 2010
65

9 FINANCE LEASE RECEIVABLESTB entered into an agreement with a company incorporated in Singapore to lease a parcel of land granted to STB by the Singapore Land Authority for the purpose of a tourism-related project. The average discount rate implicit in the lease is 6.4% (2009 : 6.4%) per annum.
Future minimum lease receivables under the financial lease together with the present value of the minimum lease receivable are as follows:
Minimum lease receivable
Present value of minimum lease
receivable
2009/2010 2008/2009 2009/2010 2008/2009
$’000 $’000 $’000 $’000
Amount receivable under finance lease:
Within one year 1,825 1,825 390 367
In the second to fifth year inclusive 7,301 7,301 1,826 1,716
After fifth year 36,964 38,789 20,879 21,379
46,090 47,915 23,095 23,462
Less: Unearned finance income (22,995) (24,453) N/A N/A
Present value of minimum
lease receivable 23,095 23,462 23,095 23,462
Less: Amount due from settlement
within 12 months (shown under
current assets) 390 367
Amount due for settlement after 12 months 22,705 23,095
23,095 23,462
10 AVAILABLE-FOR-SALE INVESTMENTS
2009/2010 2008/2009
$’000 $’000
Unquoted equity shares 2,076 2,076
Less: Impairment loss (76) (76)
2,000 2,000
STB has classified all equity investments as available-for-sale. This is because these financial assets are not acquired for the purpose of trading in the near future. These investments are carried at cost less accumulated impairment losses as their fair values cannot be reliably measured.
Notes to the Financial Statements
31 March 2010
66

11 CASH AND CASH EQUIVALENTS
2009/2010 2008/2009
$’000 $’000
Cash and bank balances 10,513 21,622
Deposits with Accountant-General’s Department (AGD) (i) 65,668 -
Fixed deposits (ii) 41,027 69,181
Cash and cash equivalents 117,208 90,803
Cash at banks earn interest at floating rates based on daily bank deposit rates which ranged from Nil% (2008/2009 : Nil% to 0.3125%) per annum.
(i) With effect from this financial year, Statutory Boards are to participate in the Centralised Liquidity Management by the AGD under AGD Circular 4/2009. Deposits, which are interest-bearing, are centrally managed by AGD and are available to the statutory board upon request.
(ii) Short-term fixed deposits are made for varying periods of between 4 days to 365 days (2008/2009 : 1 day to 368 days) depending on the immediate cash requirements of STB, and earn interest at the respective short-term deposit rates which ranged from 0.03% to 1.975% (2008/2009 : 0.0300% to 2.2000%) per annum. The fixed deposits mature within 6 months (2008/2009 : within 3 months) from the end of the respective reporting periods and are easily convertible to cash upon request by STB.
The cash and cash equivalents are sustainably denominated in the functional currency of STB.
12 RECEIVABLES AND PREPAYMENTS
2009/2010 2008/2009
$’000 $’000
Deposits 2,091 22,093
Short-term loan 26,399 26,399
Prepayments 2,018 1,964
Other receivables 12,141 18,886
42,649 69,342
Less: Allowance for doubtful receivables (379) (376)
42,270 68,966
Notes to the Financial Statements
31 March 2010
67
The short-term loan is granted to a Statutory Board in Singapore. It is secured by a deed of charge over a cargo of artefacts owned by a wholly-owned subsidiary of the borrower and non-interest bearing. Under the terms of the loan agreement, subject to the mutual agreement between STB and the borrower, the repayment of the loan would be by way of cash or the transfer of all rights, title and benefits to the cargo of artefacts and the related intellectual property rights in lieu of cash. The loan is non-interest bearing, repayable upon a demand made by STB by giving notice to the borrower of not less than 90 business days.
In the previous financial year, $2,062,413 was advanced to the wholly-owned subsidiary of a Statutory Board. The advance is unsecured, non-interest bearing and repayable within the next 12 months from the reporting date and is included in other receivables.
Management believes that there has not been a significant change in credit quality and the amounts are still considered recoverable.
Movement in the allowance for doubtful debts:2009/2010 2008/2009
$’000 $’000
Balance at beginning of year 376 -Charge to profit or loss 3 376Balance at the end of year 379 376
The receivables and prepayments are sustainably denominated in the functional currency of STB.
Notes to the Financial Statements
31 March 2010
68
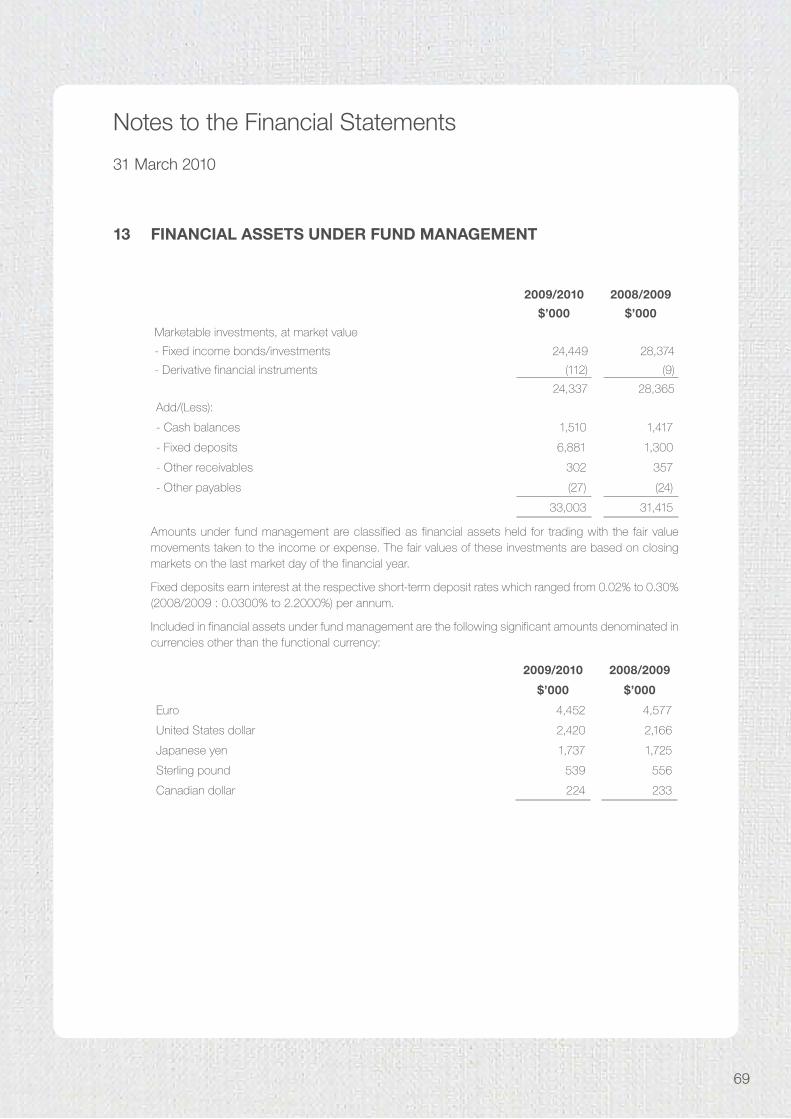
13 FINANCIAL ASSETS UNDER FUND MANAGEMENT
2009/2010 2008/2009
$’000 $’000
Marketable investments, at market value
- Fixed income bonds/investments 24,449 28,374
- Derivative financial instruments (112) (9)
24,337 28,365
Add/(Less):
- Cash balances 1,510 1,417
- Fixed deposits 6,881 1,300
- Other receivables 302 357
- Other payables (27) (24)
33,003 31,415
Amounts under fund management are classified as financial assets held for trading with the fair value movements taken to the income or expense. The fair values of these investments are based on closing markets on the last market day of the financial year.
Fixed deposits earn interest at the respective short-term deposit rates which ranged from 0.02% to 0.30% (2008/2009 : 0.0300% to 2.2000%) per annum.
Included in financial assets under fund management are the following significant amounts denominated in currencies other than the functional currency:
2009/2010 2008/2009
$’000 $’000
Euro 4,452 4,577
United States dollar 2,420 2,166
Japanese yen 1,737 1,725
Sterling pound 539 556
Canadian dollar 224 233
Notes to the Financial Statements
31 March 2010
69

14 ADVANCES AND DEPOSITS RECEIVEDIncluded in advances and deposits received are $8,434,327 (2008/2009 : $8,305,953) received from the Government and/or third parties, which are to be disbursed for designated projects/approved capital and promotional expenditure in connection with the leasehold land.
15 TRADE AND OTHER PAYABLES
2009/2010 2008/2009
$’000 $’000
Trade payables 15,577 19,035
Accruals 51,216 34,879
Other payables 4,506 3,565
71,299 57,479
The average credit period for trade payables is 30 to 90 days (2008/2009 : 30 to 90 days).
The trade and other payables are sustainably denominated in the functional currency of STB.
16 OTHER OPERATING INCOME
2009/2010 2008/2009
$’000 $’000
Events-related revenue 12,845 25,898
Lease income 3,671 3,005
Others 2,404 1,213
18,920 30,116
17 EMPLOYEE BENEFIT EXPENSE
2009/2010 2008/2009
$’000 $’000
Salaries and allowances 41,542 43,227
Contributions to defined contribution plans 4,163 3,663
Increase in provision for employee leave entitlement 244 506
Others 4,579 5,486
50,528 52,882
Notes to the Financial Statements
31 March 2010
70

18 OTHER OPERATING EXPENSES
2009/2010 2008/2009
$’000 $’000
Marketing 70,139 92,315
Business development 12,353 17,479
General and administrative 57,020 63,458
139,512 173,252
19 NON-OPERATING INCOME (EXPENSES), NET
2009/2010 2008/2009$’000 $’000
Interest income 1,353 1,894
Change in fair value of financial assets under fund management 818 (720)Gain on disposal of investment properties - 4,333Gain on sale of financial assets under fund management - 62Loss on disposal of club membership (9) -Gross dividend income - 37Disposal/Write-off of property, plant and equipment (104) (12)
Expenses on financial assets under management (111) (102)
Exchange (loss) gain on financial assets under fund management (120) 2
Allowance for doubtful debts (Note 12) (167) (376)
1,660 5,118
20 DEFERRED CAPITAL GRANTS 2009/2010 2008/2009
$’000 $’000Balance at the beginning of the financial year - -Add: Government Grants received and utilised 1,662 -Less: Amortisation of Deferred Capital Grants (19) -Balance at the end of the financial year 1,643 -
Notes to the Financial Statements
31 March 2010
71

21 CONTRIBUTION TO CONSOLIDATED FUND STB is required to make contributions to the Consolidated Fund in accordance with the Statutory Corporations (Contributions to Consolidated Fund) Act (Cap 319A, 2004 Revised Edition) and in accordance with the Finance Circular Minute No. M5/2005 with effect from 2004/2005. The contribution is based on a percentage, as decided by Ministry of Finance*, of the net surplus for the year, adjusted for any accumulated deficits carried forward of STB.
At the end of the financial year, STB has accumulated deficits carried forward as follows:
2009/2010 2008/2009$’000 $’000
Balance at beginning of the year 126,096 108,277Amount (utilised) arising in current year (5,628) 17,819Balance at end of the year 120,468 126,096
Benefits on above not recognised at 17% (2008/2009 : 18%) 20,480 22,697
Benefits in relation to the accumulated deficits were not recognised in prior years due to the unpredictability of future surplus streams.
* As decided by Ministry of Finance, the applicable rate for contributions to be paid in FY2009/2010 is 17% (FY2008/2009 : 18%).
22 RELATED PARTY TRANSACTIONS Parties are considered to be related if one party has the ability to control the other party or exercise significant influence over the other party in making financial and operating decisions.
Some of STB’s transactions and arrangements are with related parties and the effect of these on the basis determined between the parties is reflected in these financial statements. The balances are unsecured, interest-free and repayable on demand unless otherwise stated.
During the financial year, STB did not have any significant dealings with related parties (i.e. entities in which the Board members have control or significant influence) which are not stated-controlled entities.
BOARDMEMBERANDKEYMANAGEMENTPERSONNELREMUNERATION
2009/2010 2008/2009
$’000 $’000
Remuneration and other short-term benefits 6,948 7,613
Post-employment benefits 437 408
Total 7,385 8,021
The above includes total Board members’ allowance of $149,478 (2008/2009 : $105,308).
STB adopts the guidelines set by Public Service Division (PSD) and takes into consideration the reporting officers’ assessment of individual officers in determining the remuneration of key management.
Notes to the Financial Statements
31 March 2010
72
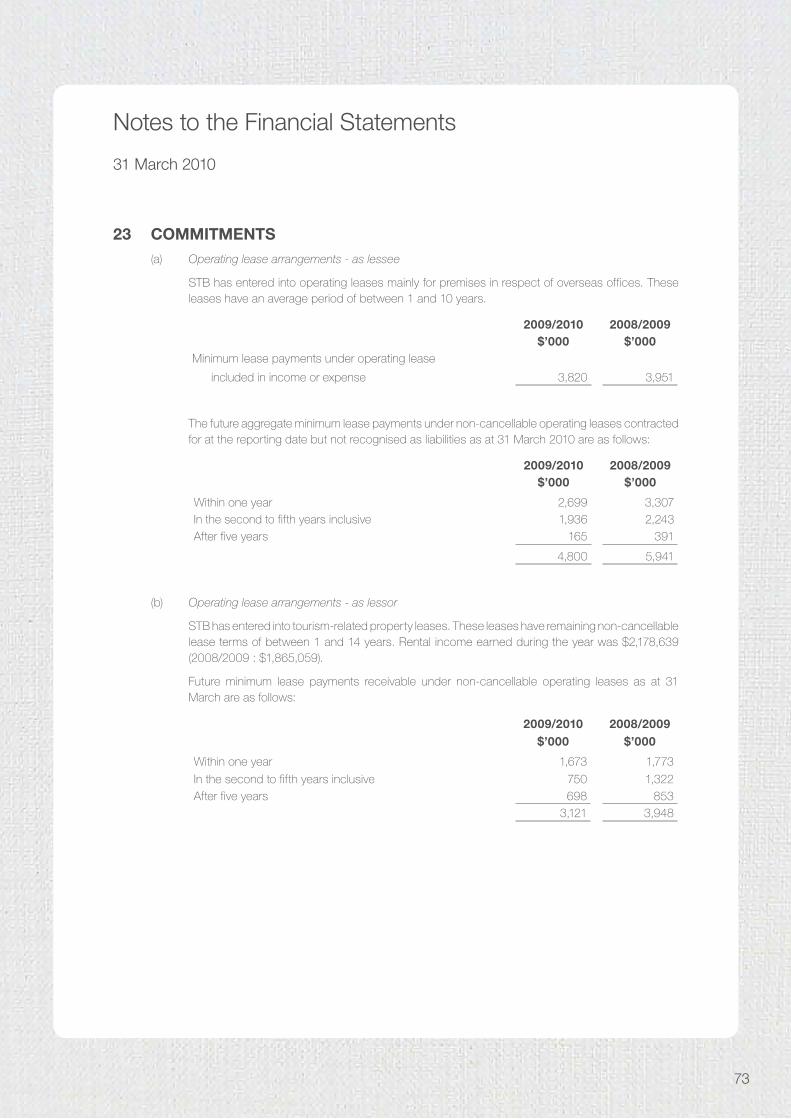
23 COMMITMENTS(a) Operating lease arrangements - as lessee
STB has entered into operating leases mainly for premises in respect of overseas offices. These leases have an average period of between 1 and 10 years.
2009/2010 2008/2009$’000 $’000
Minimum lease payments under operating lease
included in income or expense 3,820 3,951
The future aggregate minimum lease payments under non-cancellable operating leases contracted for at the reporting date but not recognised as liabilities as at 31 March 2010 are as follows:
2009/2010 2008/2009$’000 $’000
Within one year 2,699 3,307In the second to fifth years inclusive 1,936 2,243After five years 165 391
4,800 5,941
(b) Operating lease arrangements - as lessor
STB has entered into tourism-related property leases. These leases have remaining non-cancellable lease terms of between 1 and 14 years. Rental income earned during the year was $2,178,639 (2008/2009 : $1,865,059).
Future minimum lease payments receivable under non-cancellable operating leases as at 31 March are as follows:
2009/2010 2008/2009$’000 $’000
Within one year 1,673 1,773
In the second to fifth years inclusive 750 1,322After five years 698 853
3,121 3,948
Notes to the Financial Statements
31 March 2010
73

Notes to the Financial Statements
31 March 2010
(c) Capital commitments
2009/2010 2008/2009
$’000 $’000
Commitments for capital expenditure contracted but not provided for in the financial statements 198,149 1,654
(d) During this financial year, STB guaranteed Singapore GP Pte Ltd for a standby letter of credit issued by a bank for the purpose of the payment of the 2010 F1 race franchise fees.
24 LITIGATIONSDuring the previous financial year, Children’s Media Limited (“CML”) and Anthony David Hollingsworth (“Hollingsworth”) filed an appeal against a judgment that the Singapore Court has delivered in favour of STB. On 14 November 2008, the Singapore Court of Appeal dismissed the appeal and ordered that Hollingsworth and CML pay the costs of the appeal to STB.
On February 2010, the Court assessed the amount of damages STB could recover. Anthony David Hollingsworth filed an appeal against the assessment of damages. A hearing date has yet to be fixed.
The financial statements for the year ended 31 March 2010 have not been adjusted for the potential recovery of damages as these cannot be reasonably estimated.
74