Embed Size (px)
Citation preview

1
Discovery and Qualification of Serum Protein
Biomarker Candidates for Cholangiocarcinoma
Diagnosis
Kassaporn Duangkumpha, †,‡ Thomas Stoll, ¥ Jutarop Phetcharaburanin, †,‡Puangrat
Yongvanit, ‡ Raynoo Thanan, † Anchalee Techasen, ‡,ǁ Nisana Namwat, †,‡ Narong Khuntikeo,
‡,€ Nittaya Chamadol, ‡,Ꜫ Sittiruk Roytrakul, Ω Jason Mulvenna, ¥ Ahmed Mohamed, ¥ Alok K.
Shah, ¥ Michelle M. Hill, ¥,* and Watcharin Loilome †,‡,*
†Department of Biochemistry, Faculty of Medicine, Khon Kaen University, Khon Kaen,
Thailand
‡Cholangiocarcinoma Research Institute, Khon Kaen University, Khon Kaen, Thailand;
¥QIMR Berghofer Medical Research Institute, Queensland, Australia
ǁFaculty of Associated Medical Sciences, Khon Kaen University, Khon Kaen, Thailand
€Department of Surgery, Faculty of Medicine, Khon Kaen University, Khon Kaen, Thailand
ꜪDepartment of Radiology, Faculty of Medicine, Khon Kaen University, Khon Kaen,
Thailand
ΩProteomics Research Laboratory, Genome Institute, National Center for Genetic
Engineering and Biotechnology, National Science and Technology Development Agency,
Pathum Thani, Thailand
Corresponding authors:
Associate Professor Watcharin Loilome, Email: [email protected]
Associate Professor Michelle Hill, Email: [email protected]
2
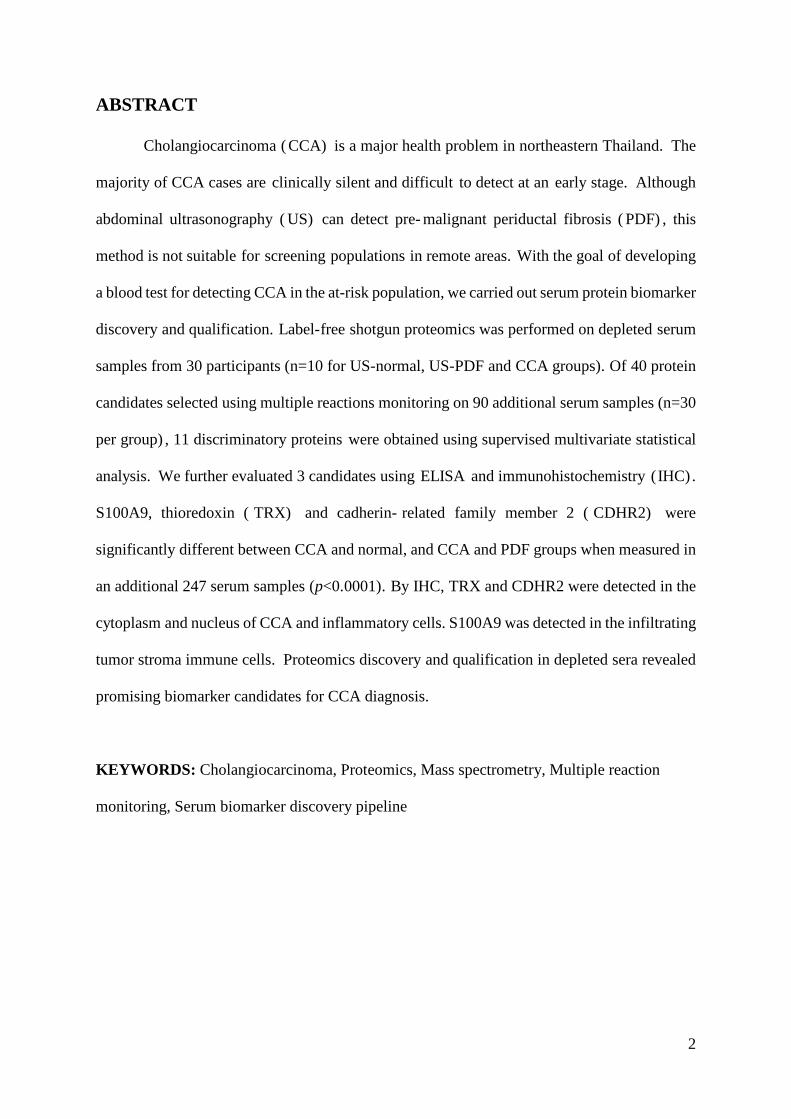
ABSTRACT
Cholangiocarcinoma ( CCA) is a major health problem in northeastern Thailand. The
majority of CCA cases are clinically silent and difficult to detect at an early stage. Although
abdominal ultrasonography ( US) can detect pre- malignant periductal fibrosis ( PDF) , this
method is not suitable for screening populations in remote areas. With the goal of developing
a blood test for detecting CCA in the at-risk population, we carried out serum protein biomarker
discovery and qualification. Label-free shotgun proteomics was performed on depleted serum
samples from 30 participants (n=10 for US-normal, US-PDF and CCA groups). Of 40 protein
candidates selected using multiple reactions monitoring on 90 additional serum samples (n=30
per group) , 11 discriminatory proteins were obtained using supervised multivariate statistical
analysis. We further evaluated 3 candidates using ELISA and immunohistochemistry (IHC).
S100A9, thioredoxin ( TRX) and cadherin- related family member 2 ( CDHR2) were
significantly different between CCA and normal, and CCA and PDF groups when measured in
an additional 247 serum samples (p<0.0001). By IHC, TRX and CDHR2 were detected in the
cytoplasm and nucleus of CCA and inflammatory cells. S100A9 was detected in the infiltrating
tumor stroma immune cells. Proteomics discovery and qualification in depleted sera revealed
promising biomarker candidates for CCA diagnosis.
KEYWORDS: Cholangiocarcinoma, Proteomics, Mass spectrometry, Multiple reaction
monitoring, Serum biomarker discovery pipeline
3
INTRODUCTION
Cholangiocarcinoma (CCA) is an aggressive cancer of the bile duct epithelium with a
poor survival rate due to lack of specific clinical symptoms leading to late diagnosis.1 CCA is
a major public health problem in the northeast of Thailand where it shows the highest incidence
in the world.2 Chronic inflammation of the biliary tract caused by the liver fluke (Opisthorchis
viverrini, Ov) is the principal mechanism that drives cholangiocarcinogenesis in the Mekong
area of Southeast Asia. 2-3 Oxidative stress induced by Ov infection leads to DNA damage,
abnormal tissue remodeling and the alteration of gene expression, all of which have been
implicated in carcinogenesis.4-5 Interestingly, a number of molecules have been reported to be
differentially abundant during Ov-associated cholangiocarcinogenesis that could, therefore, be
used as biomarkers for the assessment and chemoprevention of liver fluke- associated
cholangiocarcinoma. 6 Moreover, the chronic injury affecting the bile duct epithelial cells
during Ov infection leads to periductal fibrosis (PDF), which is believed to be an intermediate
pathological condition leading to CCA. We recently reported histological confirmation using
ultrasound- based diagnosis of PDF and CCA in a cohort of CCA patients. 7 Although
ultrasonography is a potentially useful strategy to screen and follow up at-risk populations, this
technique is not easily accessible for remote populations. Therefore, as a first step towards
developing a specific and economic diagnostic test for CCA, we utilized our cohort to discover
blood-based protein biomarkers.
In the post- genomic era, the field of proteomics promises the discovery of new
molecular targets for therapy, biomarkers for early detection, and new endpoints for therapeutic
efficacy and toxicity.8 Protein expression fingerprints in body fluids such as serum or plasma
or in tissue biopsies from patients have been investigated for the potential to diagnose cancers
such as breast9, colorectal10, prostate11, lung12, as well as CCA. 13-14 A previous discovery
proteomics study for plasma CCA biomarkers analysed sera from 10 CCA patients and 10
4
control subjects using two-dimensional gel electrophoresis (2-DE) and mass spectrometry. The
result found that elevated of α1- antitrypsin ( AP1) together with three previously established
tumor markers (CA19-9, AP1 and α-fetoprotein: AFP) in plasma from CCA patients could be
used to obtain prediction accuracy of greater than 80% for CCA diagnosis. 13 In another
approach, tissues from CCA and control samples were analysed for differentially expressed
proteins including protein S100A9, chaperonin- containing TCR1, subunit 3 ( CCTγ) , 14- 3-3
proteins, periostin and α- smooth muscle actin ( α – SMA) . 1 4 -1 5 A major limitation of these
previous studies is the small sample size and lack of replication/validation.
One reason for the lack of replication may be the feasibility of performing discovery
proteomics on a large number of samples. Multiple reaction monitoring ( MRM) , also known
as selected reaction monitoring ( SRM) , is a targeted mass spectrometry approach to protein
quantitation that is emerging to bridge the gap between biomarker discovery and clinical
validation.16-17 Due to the higher sensitivity and throughput of MRM over shotgun proteomics,
this technique has been successfully applied for biomarker qualification by several research
groups including us. 18- 20 For instance, Brock and colleagues recently targeted seven high
abundance serum proteins for predicting colorectal cancer. 21 Shah and co- workers have
developed a pipeline for glycoprotein biomarker discovery in serum for esophageal
adenocarcinoma using MRM in the biomarker qualification phase.22
In this study, we report the biomarker discovery workflow focusing on the discovery
of potential biomarkers for CCA diagnosis in serum of the at-risk population. We established
MRM-based quantitative assays for selected biomarker candidates and performed the
qualification phase on an independent cohort. The top three biomarker candidates were then
further evaluated using orthogonal methods in independent cohorts, including enzyme-linked
immunosorbent assay (ELISA) for serum protein measurement, and immunohistochemistry
(IHC) to evaluate CCA tissue expression.

5
EXPERIMENTAL SECTION
Study subjects and collection procedure
All subjects in these studies submitted their written, informed consent and the studies
were approved by the Human Ethics Committee of Khon Kaen University, Thailand based on
the ethics of human specimen experimentation of the National Research Council of Thailand
(HE531320 and HE571283). All serum samples were obtained from the Cholangiocarcinoma
Research Institute ( CARI) . The diagnoses of CCA patients employed clinical data, imaging
analysis and pathological diagnosis. Normal and periductal fibrosis groups were obtained from
the cholangiocarcinoma screening and care program (CASCAP) at CARI. CASCAP is a cross-
sectional study with ultrasonography diagnosis, in an endemic area for liver fluke infection in
Khon Kaen province. For discovery phase, shotgun proteomics was performed with three group
of individuals 30 age- sex matched serum samples ( 10 Normal group, 10 PDF group and 10
CCA group) and qualification phase with MRM-MS analysis was carried out with individuals
90 age-sex matched serum samples (30 Normal group, 30 PDF group and 30 CCA group). All
serum specimens were prepared using the same protocol within 3 h of blood collection into 2
tubes. After centrifugation at 1,000 x g for 10 min, 1 mL of serum was aliquoted into an
Eppendorf tube and stored at -80 °C prior to proteomic analysis. Cadaveric donor liver tissues
and CCA tumor tissue microarrays (TMA) obtained from 5 and 208 individuals, respectively,
who had undergone surgery at Srinagarind Hospital, Khon Kaen University, Thailand were
used for immunohistochemical staining (IHC).
Serum sample processing for mass spectrometry
The 12 most abundant serum proteins were depleted using immunodepletion kits
( Thermo Fisher Scientific, MA, United States) according to the manufacturer’ s instructions.
Briefly, detailed of protein depletion and concentration are provided in Supplementary method
6
section. Protein concentration of a depleted serum sample was measured using a BCA assay
kit (Pierce Biotechnology, Rockford, United States). Post-depletion serum (30 µg) was spiked
with internal standards ( 10 pmole chicken ovalbumin for discovery samples, 10 pmole
ovalbumin plus indexed retention time ( iRT) peptides for qualification of the samples) ,
denatured using 2% SDS in 100 mM triethylammonium bicarbonate (TEAB, pH 8.5) at 95°C
for 5 min and cooled on ice for 5 min; reduced in 10 mM of Tris (2-carboxyethyl) phosphine
( TCEP) at 60°C for 30 min; alkylated in the dark at 37°C for 30 min with 40 mM 2-
chloroacetamide (CAA). Trypsin digestion was performed using the methanol co-precipitation
method as previously described.23 Samples were acidified to 1% formic acid and desalted using
C18 cartridges (Phenomenex, NSW, Australia). Digested peptide mixtures were dried and re-
suspended in 1% formic acid.
LC-MS/MS for discovery phase
Tryptic peptides (500 ng) were analyzed on a nano ACQUITY UPLC system (Waters,
Milford, US) coupled to a Triple TOF 5600 mass spectrometer (AB SCIEX) equipped with a
nano electrospray ion source. The peptides were loaded on to a trap column M-Class 5 µm
Symmetry C18 180 µm x 20 mm ( Waters) , before separating on a M- Class 1. 7 µm BEH130
C18 75 µm x 200 mm LC column ( Waters) at a flow rate of 300 nL/ min and a column
temperature of 35 °C. MaxQuant software (version 1.6.0.16) was used for quantitative label-
free analysis of LC- MS/ MS data. 24-25 LC- MS/ MS and data analysis details are available in
Supplementary method section.
MRM analysis for qualification phase
All samples were processed and analysed in a randomised order with an injection
volume of 30 µL ( 15 µg) . LCMS- 8050 ( Shimadzu) triple quadrupole mass spectrometer,

7
coupled with a standard- flow Shimadzu Nexera X2 ultra- high- performance liquid
chromatograph (UHPLC). The UHPLC system consisted of a reverse phase chromatographic
column, AdvanceBio Peptide Mapping (150 × 2.1 mm i.d., 2.7 µm, part number 653750–902,
Agilent Technologies) with a 5 mm long guard column. D e t a i l s o f t h e M R M m e thod
development and LC-MS parameters are decribed in the Supplementary Methods. The final
m e t h o d m e a s u r e d 4 2 proteins ( 40 biomarker candidates plus internal standards, chicken
ovalbumin and iRT) , 165 peptides and 567 transitions with a retention time window of 2 min
(Table S3).
MRM data analysis were performed using Skyline2 6 ( version 3. 7. 1. 11208; August
2017). All peaks were manually checked for correct integration, and peak area of each peptide
(sum of all transitions) was exported for further analysis. Normalization was performed at the
p e p t i d e l e v e l using Microsoft Excel software. The iRT peptide peak intensity was first
normalized with median iRT peptides for each sample. Next, using the normalized intensity of
iRT peptide, the intensity of all other peptides was normalized (Table S5). To calculate protein
intensity from peptides that matched to the same protein, we filtered for normalized peptides
with >0.9 Pearson’s correlation. Then, normalized peptide intensities were averaged to protein
intensity, and a log2 transformation was performed to obtain a near-normal distribution needed
for statistical tests using in the computing environment R (Table S6). For statistical analysis,
missing values were replaced by the minimum detected intensity for each peptide.
Bioinformatics and statistical analysis
Protein interaction network analysis was generated using STRING software based on
the STRING database and Gene Oncology ( GO) term. All of analyses were constructed and
visualized in SPSS 19. 0 ( IBM, USA) , GraphPad Prism 5 and R statistical software. The
ANOVA test was conducted with Shiny MixOmics online software ( http: / / mixomics-
8
projects. di. uq. edu. au/ Shiny) . Principal component analysis ( PCA) and orthogonal signal
correction projection to latent structures discriminant analysis (O-PLS-DA) was conducted in
SIMCA 15.0 (Umetrics, Sweden). Described and detailed of statistical analysis are available
in the Supplementary Methods.
Antibody-based methods
The following primary antibodies were used for indirect enzyme- linked
immunosorbent assay ( ELISA) and immunohistochemical staining ( IHC) : S100A9 ( Cat.
#ab24111) , TRX ( Cat. #ab185329) purchased from Abcam ( Cambridge, MA) and
CDHR2/PCLKC (Cat. #orb158119) purchased from Biorbyt (San Fransisco, CA). Detailed
methods for ELISA and IHC are available in the Supplementary Methods.
RESULTS
Overview of biomarker workflow and baseline characteristics of samples
We performed a multi- phased biomarker discovery and development study as
illustrated in Figure 1. Participant recruitment, ultrasound, blood sample collection and
biobanking were completed before biomarker discovery. According to the proposed
‘triangular’ biomarker study design for development of early cancer biomarkers 27, we used a
small cohort for discovery using shotgun proteomics to measure a broad range of proteins, then
increased the sample size while reducing the number of biomarker candidates. For the
discovery and qualification phases, we selected age-sex matched participants with ultrasound-
confirmed normal liver and PDF pathology. CCA cases were confirmed by pathology
diagnosis. In the qualification cohort, smoking status and alcohol consumption were
significantly different (Table 1 and Table S9). Orthogonal investigation using antibody-based
9
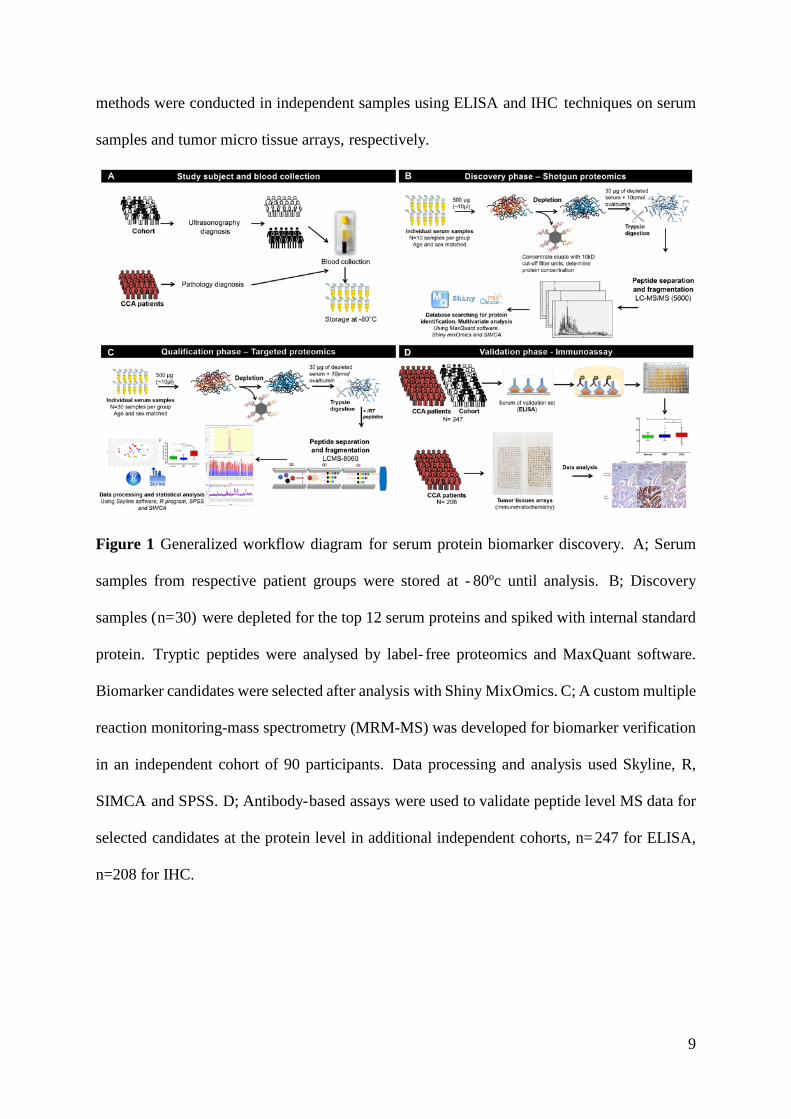
methods were conducted in independent samples using ELISA and IHC techniques on serum
samples and tumor micro tissue arrays, respectively.
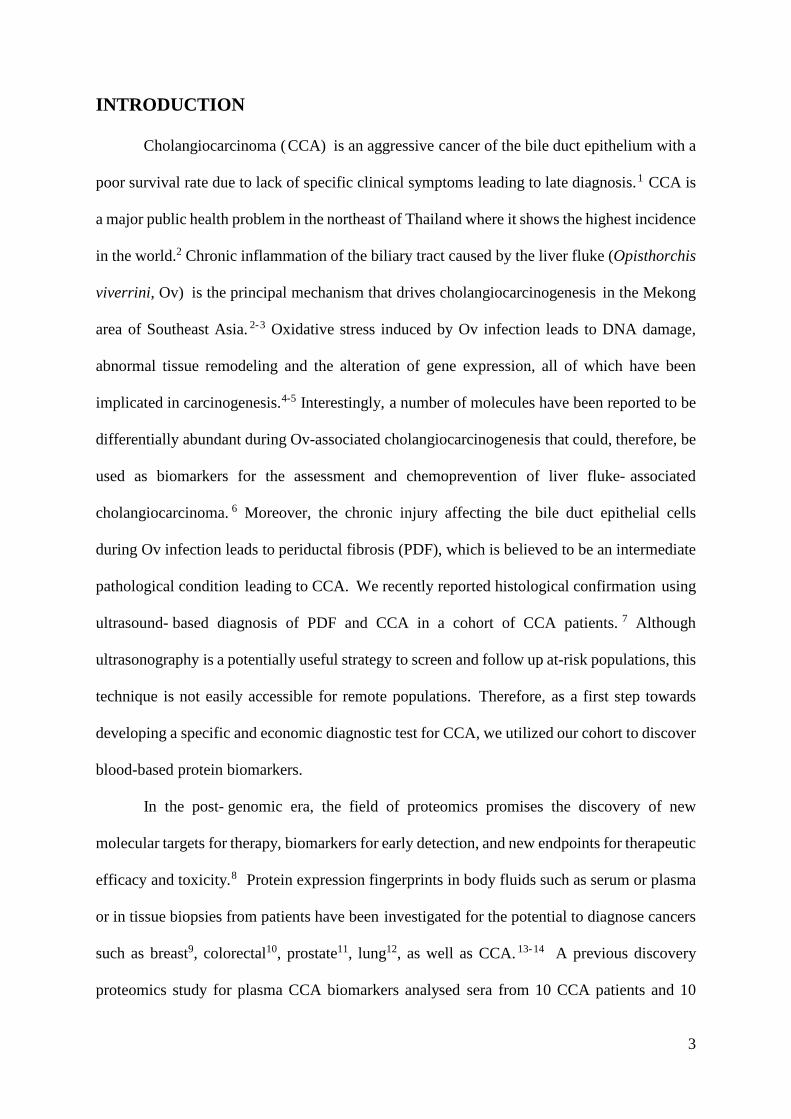
Figure 1 Generalized workflow diagram for serum protein biomarker discovery. A; Serum
samples from respective patient groups were stored at - 80ºc until analysis. B; Discovery
samples (n=30) were depleted for the top 12 serum proteins and spiked with internal standard
protein. Tryptic peptides were analysed by label- free proteomics and MaxQuant software.
Biomarker candidates were selected after analysis with Shiny MixOmics. C; A custom multiple
reaction monitoring-mass spectrometry (MRM-MS) was developed for biomarker verification
in an independent cohort of 90 participants. Data processing and analysis used Skyline, R,
SIMCA and SPSS. D; Antibody-based assays were used to validate peptide level MS data for
selected candidates at the protein level in additional independent cohorts, n= 247 for ELISA,
n=208 for IHC.
10
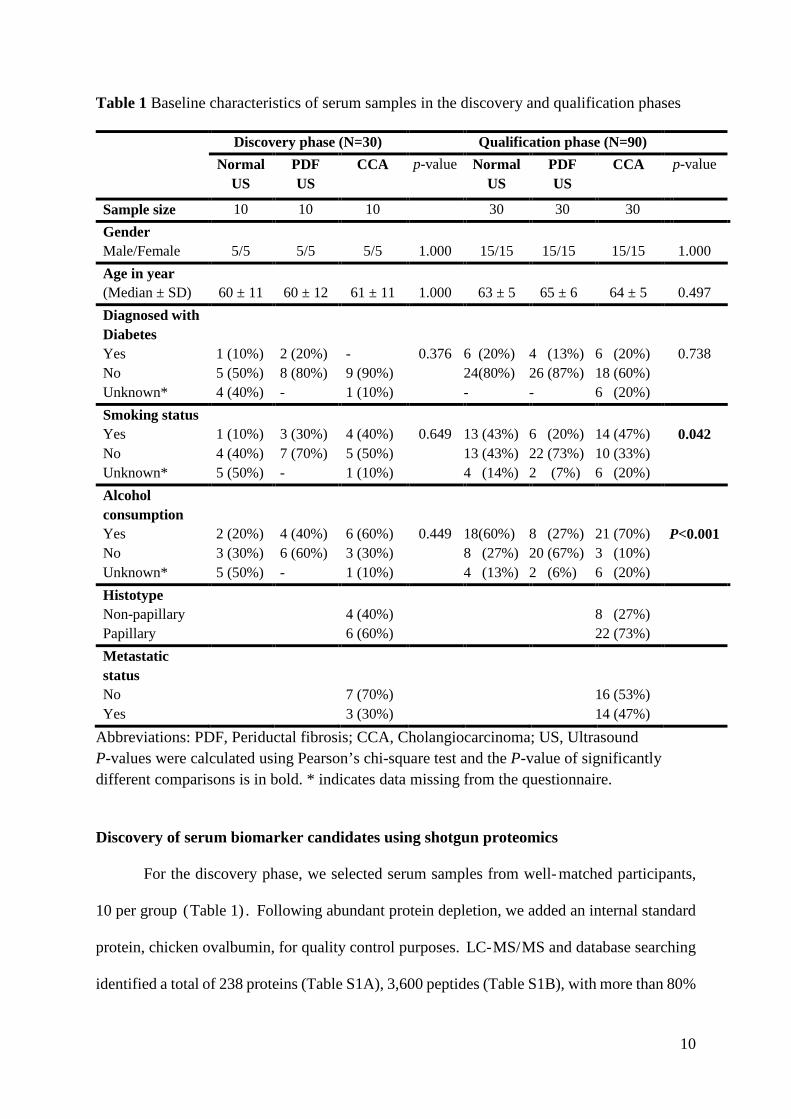
Table 1 Baseline characteristics of serum samples in the discovery and qualification phases
Discovery phase (N=30) Qualification phase (N=90) Normal
US PDF US
CCA p-value Normal US
PDF US
CCA p-value
Sample size 10 10 10 30 30 30 Gender Male/Female
5/5
5/5
5/5
1.000
15/15
15/15
15/15
1.000
Age in year (Median ± SD)
60 ± 11
60 ± 12
61 ± 11
1.000
63 ± 5
65 ± 6
64 ± 5
0.497
Diagnosed with Diabetes Yes No Unknown*
1 (10%) 5 (50%) 4 (40%)
2 (20%) 8 (80%) -
- 9 (90%) 1 (10%)
0.376
6 (20%) 24(80%) -
4 (13%) 26 (87%) -
6 (20%) 18 (60%) 6 (20%)
0.738
Smoking status Yes No Unknown*
1 (10%) 4 (40%) 5 (50%)
3 (30%) 7 (70%) -
4 (40%) 5 (50%) 1 (10%)
0.649
13 (43%) 13 (43%) 4 (14%)
6 (20%) 22 (73%) 2 (7%)
14 (47%) 10 (33%) 6 (20%)
0.042
Alcohol consumption Yes No Unknown*
2 (20%) 3 (30%) 5 (50%)
4 (40%) 6 (60%) -
6 (60%) 3 (30%) 1 (10%)
0.449
18(60%) 8 (27%) 4 (13%)
8 (27%) 20 (67%) 2 (6%)
21 (70%) 3 (10%) 6 (20%)
P<0.001
Histotype Non-papillary Papillary
4 (40%) 6 (60%)
8 (27%) 22 (73%)
Metastatic status No Yes
7 (70%) 3 (30%)
16 (53%) 14 (47%)
Abbreviations: PDF, Periductal fibrosis; CCA, Cholangiocarcinoma; US, Ultrasound P-values were calculated using Pearson’s chi-square test and the P-value of significantly different comparisons is in bold. * indicates data missing from the questionnaire.
Discovery of serum biomarker candidates using shotgun proteomics
For the discovery phase, we selected serum samples from well- matched participants,
10 per group (Table 1) . Following abundant protein depletion, we added an internal standard
protein, chicken ovalbumin, for quality control purposes. LC-MS/MS and database searching
identified a total of 238 proteins (Table S1A), 3,600 peptides (Table S1B), with more than 80%
11
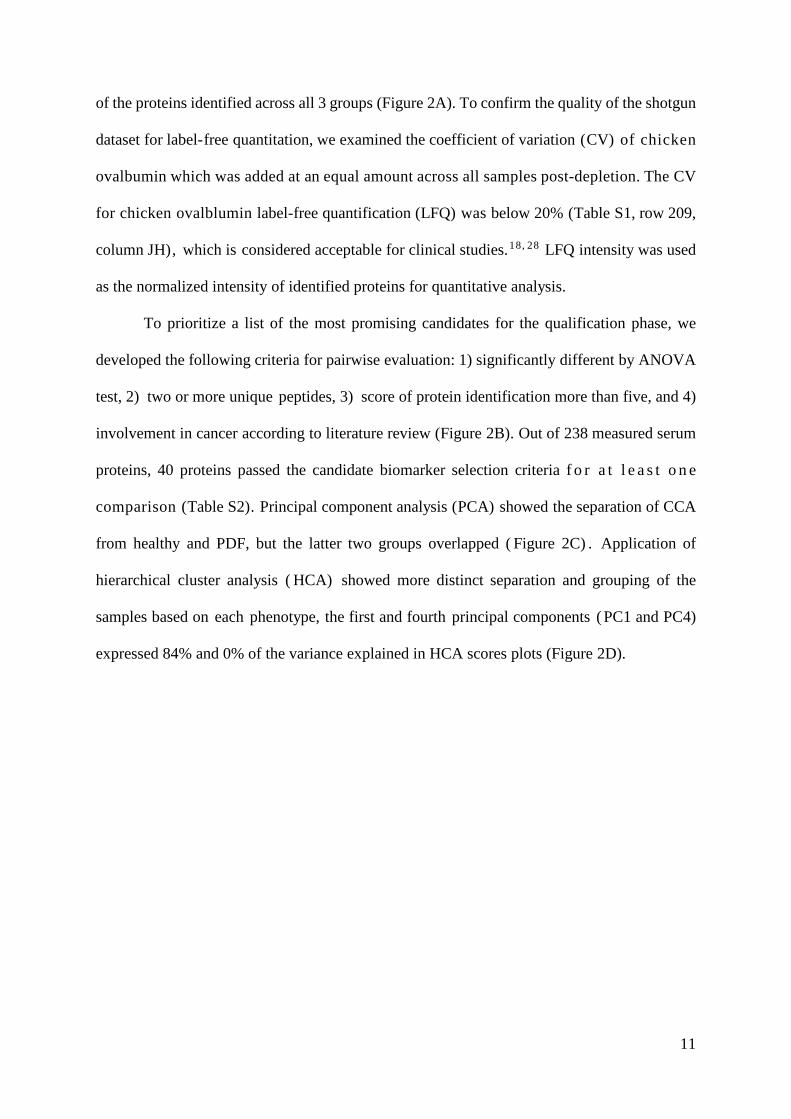
of the proteins identified across all 3 groups (Figure 2A). To confirm the quality of the shotgun
dataset for label-free quantitation, we examined the coefficient of variation (CV) of chicken
ovalbumin which was added at an equal amount across all samples post-depletion. The CV
for chicken ovalblumin label-free quantification (LFQ) was below 20% (Table S1, row 209,
column JH), which is considered acceptable for clinical studies.18, 28 LFQ intensity was used
as the normalized intensity of identified proteins for quantitative analysis.
To prioritize a list of the most promising candidates for the qualification phase, we
developed the following criteria for pairwise evaluation: 1) significantly different by ANOVA
test, 2) two or more unique peptides, 3) score of protein identification more than five, and 4)
involvement in cancer according to literature review (Figure 2B). Out of 238 measured serum
proteins, 40 proteins passed the candidate biomarker selection criteria f o r a t l e a s t o n e
comparison (Table S2). Principal component analysis (PCA) showed the separation of CCA
from healthy and PDF, but the latter two groups overlapped ( Figure 2C) . Application of
hierarchical cluster analysis ( HCA) showed more distinct separation and grouping of the
samples based on each phenotype, the first and fourth principal components ( PC1 and PC4)
expressed 84% and 0% of the variance explained in HCA scores plots (Figure 2D).
12
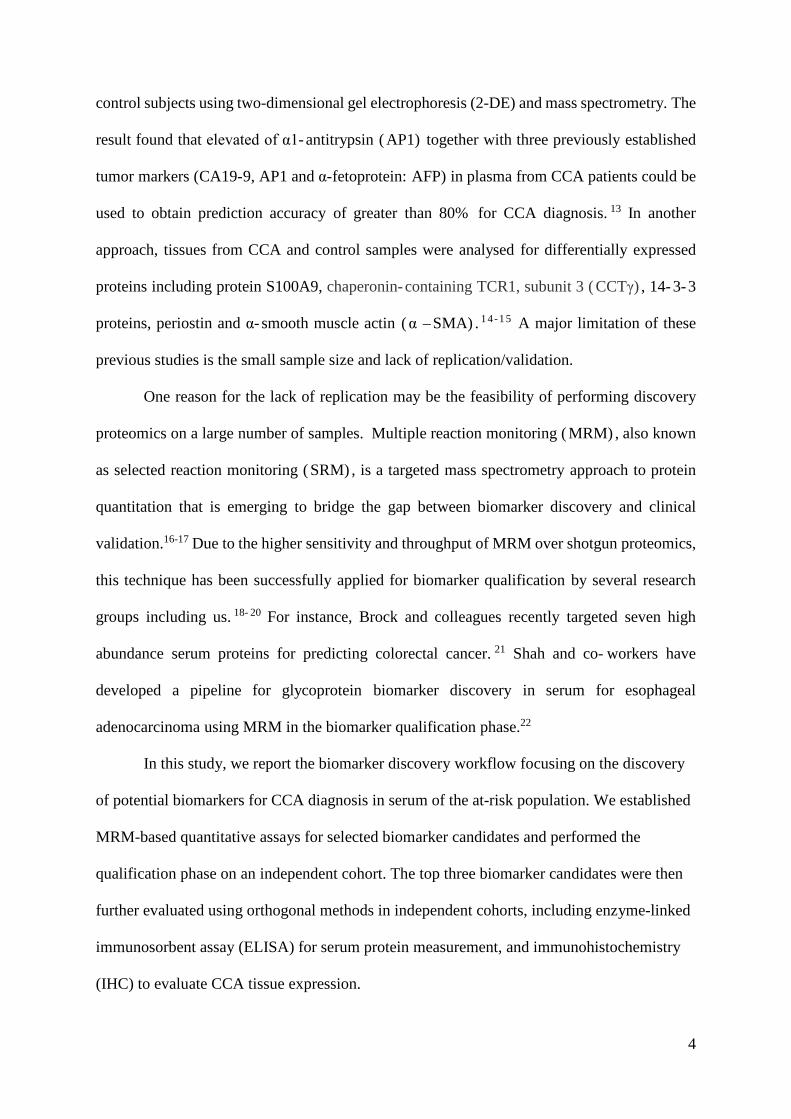
Figure 2 The biomarker discovery phase including the overlap of the 238 identified proteins,
candidate selection criteria and sample clustering with multivariate analysis. A; Venn diagram
showing the overlap of the 238 identified proteins. B; Candidate selection criteria. C; PCA
analysis and D, hierarchical PCA analysis of samples: normal pathology (green), PDF (blue)
and CCA group (red).
Biomarker qualification by targeted proteomic analysis or MRM analysis.
For biomarker qualification, a multiple reaction monitoring (MRM) mass spectrometry
method was developed for 40 biomarker candidates. An independent cohort of 90 participants
was then selected for qualification using the optimised MRM assay (Table 1 and Figure 1).
Normalized peptides with correlations of >0.9 (Pearson’s correlation test) were selected and
13
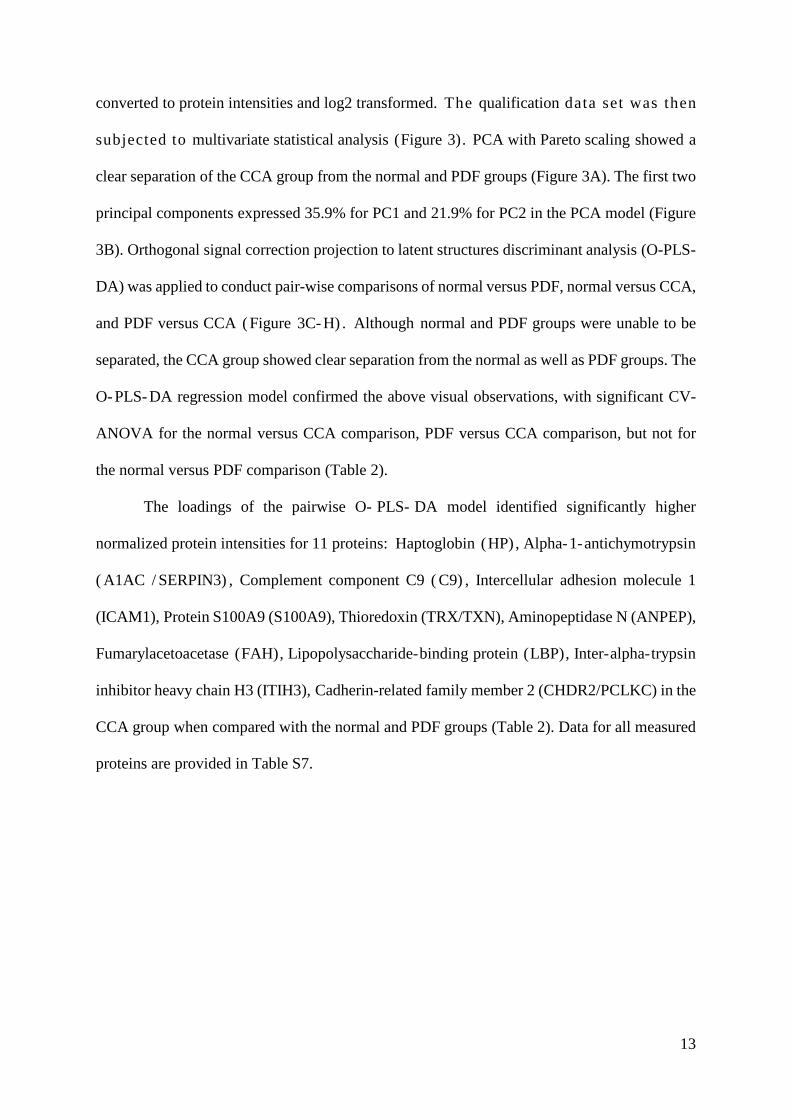
converted to protein intensities and log2 transformed. The qualification data set was then
subjected to multivariate statistical analysis (Figure 3). PCA with Pareto scaling showed a
clear separation of the CCA group from the normal and PDF groups (Figure 3A). The first two
principal components expressed 35.9% for PC1 and 21.9% for PC2 in the PCA model (Figure
3B). Orthogonal signal correction projection to latent structures discriminant analysis (O-PLS-
DA) was applied to conduct pair-wise comparisons of normal versus PDF, normal versus CCA,
and PDF versus CCA ( Figure 3C- H) . Although normal and PDF groups were unable to be
separated, the CCA group showed clear separation from the normal as well as PDF groups. The
O- PLS- DA regression model confirmed the above visual observations, with significant CV-
ANOVA for the normal versus CCA comparison, PDF versus CCA comparison, but not for
the normal versus PDF comparison (Table 2).
The loadings of the pairwise O- PLS- DA model identified significantly higher
normalized protein intensities for 11 proteins: Haptoglobin (HP) , Alpha-1-antichymotrypsin
( A1AC / SERPIN3) , Complement component C9 ( C9) , Intercellular adhesion molecule 1
(ICAM1), Protein S100A9 (S100A9), Thioredoxin (TRX/TXN), Aminopeptidase N (ANPEP),
Fumarylacetoacetase (FAH), Lipopolysaccharide-binding protein (LBP), Inter-alpha-trypsin
inhibitor heavy chain H3 (ITIH3), Cadherin-related family member 2 (CHDR2/PCLKC) in the
CCA group when compared with the normal and PDF groups (Table 2). Data for all measured
proteins are provided in Table S7.
14
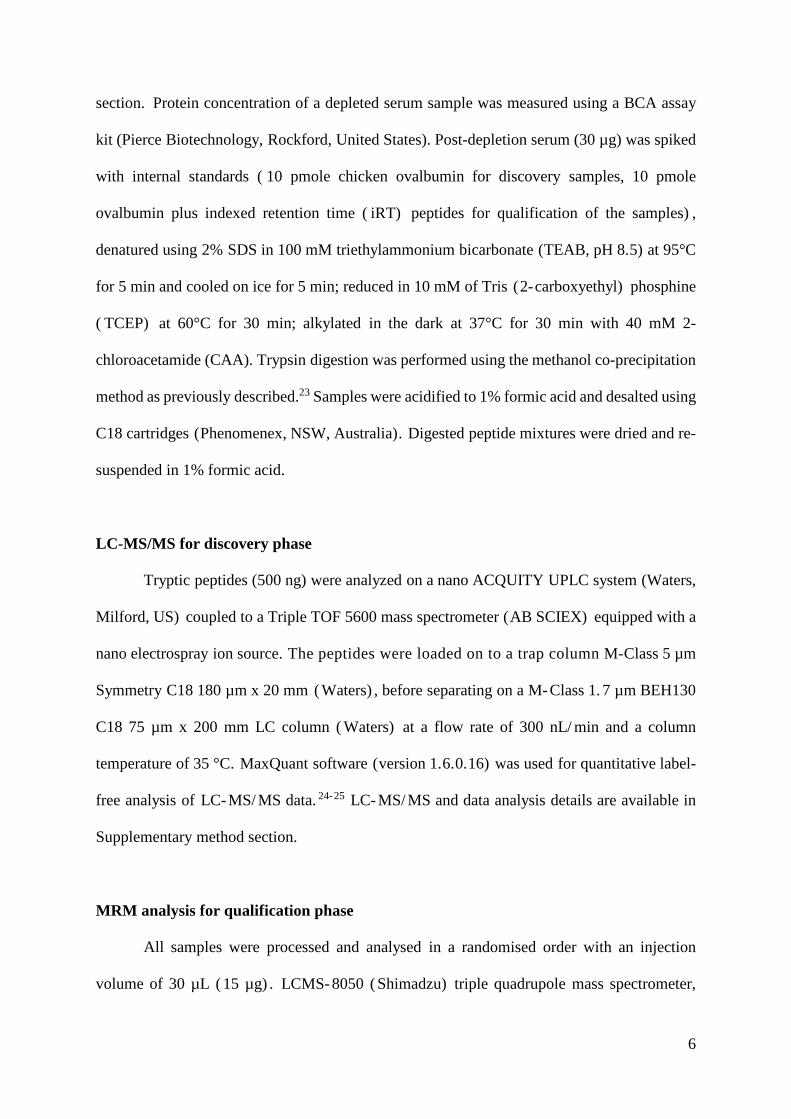
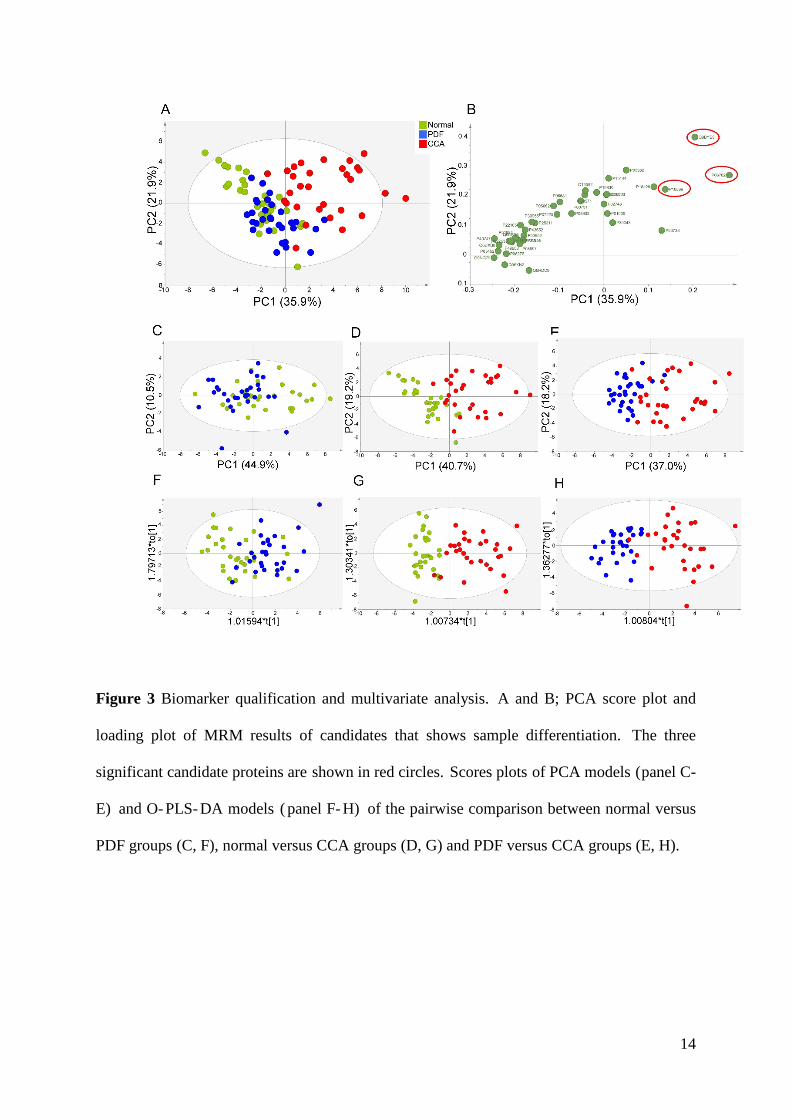
Figure 3 Biomarker qualification and multivariate analysis. A and B; PCA score plot and
loading plot of MRM results of candidates that shows sample differentiation. The three
significant candidate proteins are shown in red circles. Scores plots of PCA models (panel C-
E) and O- PLS- DA models ( panel F- H) of the pairwise comparison between normal versus
PDF groups (C, F), normal versus CCA groups (D, G) and PDF versus CCA groups (E, H).
15
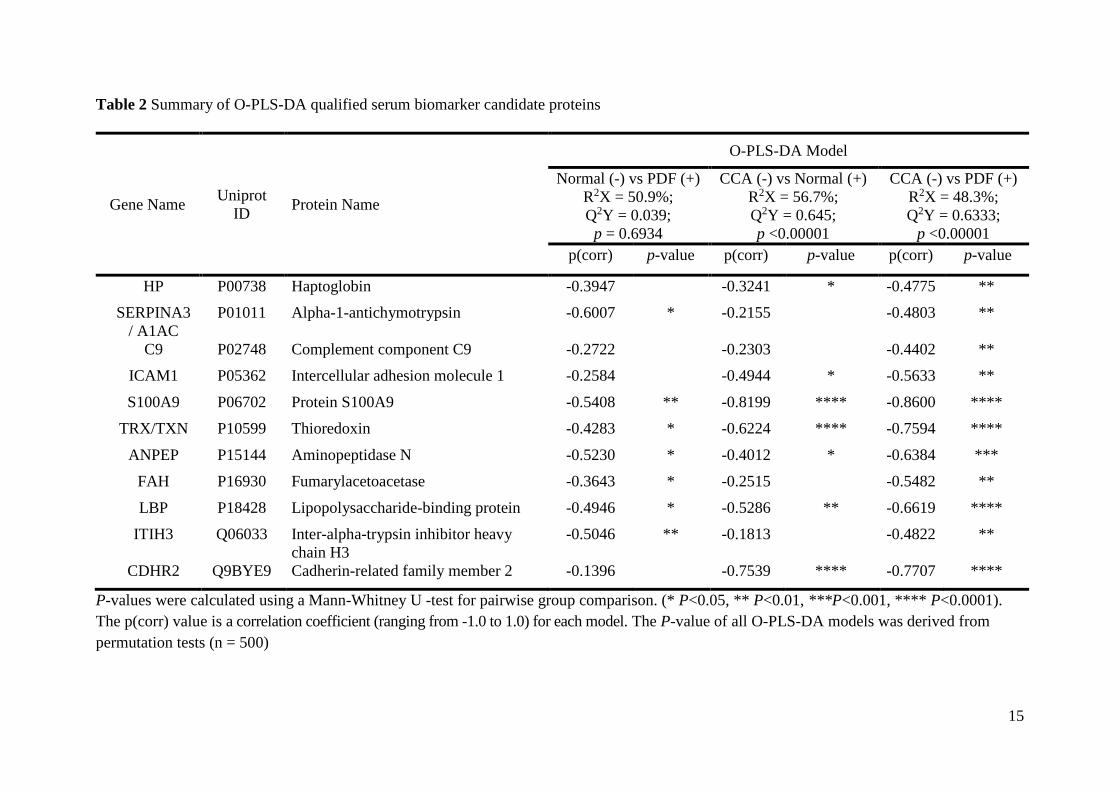
Table 2 Summary of O-PLS-DA qualified serum biomarker candidate proteins
Gene Name Uniprot ID Protein Name
O-PLS-DA Model
Normal (-) vs PDF (+) R2X = 50.9%; Q2Y = 0.039;
p = 0.6934
CCA (-) vs Normal (+) R2X = 56.7%; Q2Y = 0.645; p <0.00001
CCA (-) vs PDF (+) R2X = 48.3%; Q2Y = 0.6333;
p <0.00001 p(corr) p-value p(corr) p-value p(corr) p-value
HP P00738 Haptoglobin -0.3947
-0.3241 * -0.4775 ** SERPINA3
/ A1AC P01011 Alpha-1-antichymotrypsin -0.6007 * -0.2155
-0.4803 **
C9 P02748 Complement component C9 -0.2722
-0.2303
-0.4402 ** ICAM1 P05362 Intercellular adhesion molecule 1 -0.2584
-0.4944 * -0.5633 **
S100A9 P06702 Protein S100A9 -0.5408 ** -0.8199 **** -0.8600 **** TRX/TXN P10599 Thioredoxin -0.4283 * -0.6224 **** -0.7594 ****
ANPEP P15144 Aminopeptidase N -0.5230 * -0.4012 * -0.6384 *** FAH P16930 Fumarylacetoacetase -0.3643 * -0.2515
-0.5482 **
LBP P18428 Lipopolysaccharide-binding protein -0.4946 * -0.5286 ** -0.6619 **** ITIH3 Q06033 Inter-alpha-trypsin inhibitor heavy
chain H3 -0.5046 ** -0.1813
-0.4822 **
CDHR2 Q9BYE9 Cadherin-related family member 2 -0.1396
-0.7539 **** -0.7707 ****
P-values were calculated using a Mann-Whitney U -test for pairwise group comparison. (* P<0.05, ** P<0.01, ***P<0.001, **** P<0.0001). The p(corr) value is a correlation coefficient (ranging from -1.0 to 1.0) for each model. The P-value of all O-PLS-DA models was derived from permutation tests (n = 500)

16
Protein interaction network and inter-correlation of serum candidate proteins
Next, we determined whether the 11 candidate CCA serum protein biomarker
candidates were correlated in function or abundance. Using the STRING software 29 a n d
functional gene ontology (GO) enrichment analysis (Table S8), two main protein-protein
interaction networks were identified (Figure 4A): immune system and inflammatory processes
(red circle) and redox regulatory processes (blue circle). To investigate the inter-correlation of
abundance among qualified biomarker candidates from the serum samples between the normal
and CCA groups, we constructed a correlogram using Spearman correlation coefficient values
between significant serum candidates with correlation values > 0. 62 and p- values < 0. 001
(Figure 4B). Significant positive correlations were detected among the immune response
system-, inflammatory processes- and the redox regulatory system-related proteins, including
ITIH3, SERPINA3, TRX, S100A9, ANPEP, ICAM1 and FAH in both groups. The inter-
correlation of these candidate proteins, including ANPEP and SERPINA3, ANPEP and
ICAM1, ANPEP and FAH, and between ITIH3 and SERPINA3 showed a similar strength of
positive correlation coefficients in both groups. However, we also found that the inter-
correlation of candidate proteins, including TRX and ICAM1, TRX and ANPEP, TRX and
FAH, and ITIH3 and ICAM1, showed greater levels of positive correlation in the normal group
when compared with the CCA group. Moreover, CDHR2 also showed altered inter-correlations
with other candidate proteins in CCA when compared with the normal group (Figure 4B).
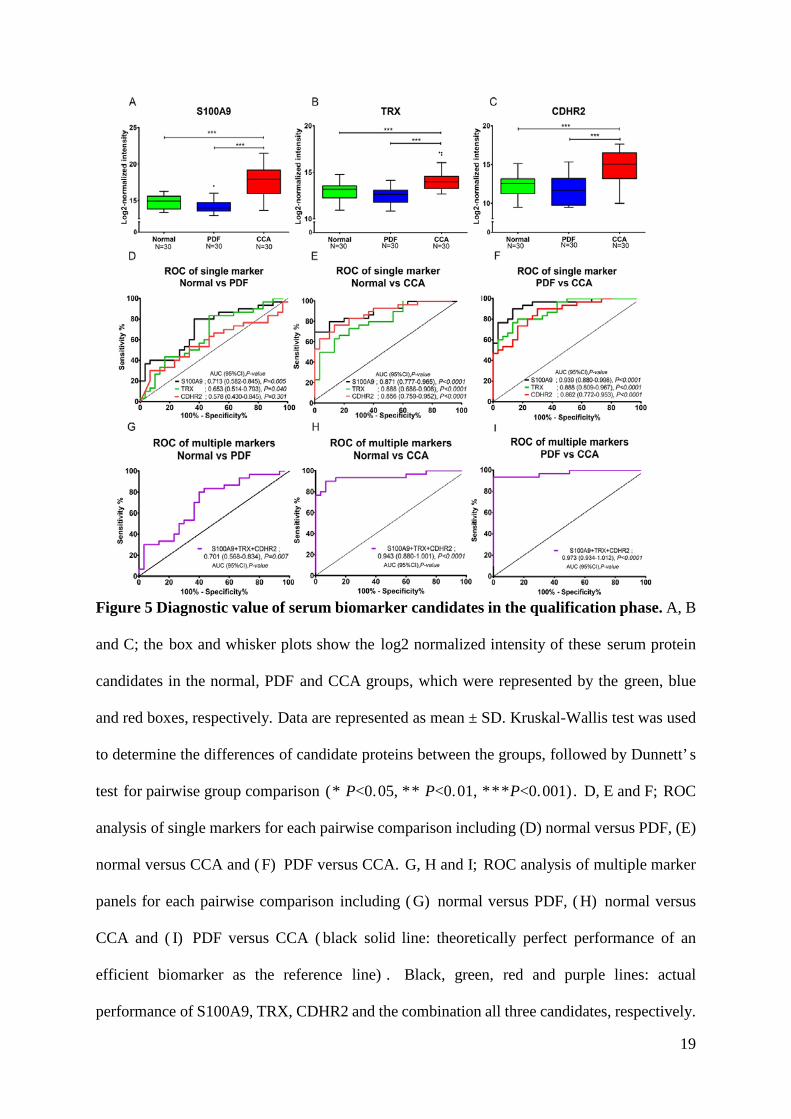
The three most significant qualified serum biomarker candidates for CCA were
S100A9, TRX and CDHR2 ( Figure 3B and Table 2) . All three proteins also showed strong
significant correlations and differences between the CCA group when compared with other
groups (p<0.0001) (Table 2 and Figure 5A-C). Interestingly, there was an increase in the level
of the inter-correlation between TRX and S100A9 for the CCA group when compared with the
normal group. Although there were positive correlations with these biological processes-

17
related proteins in both groups, these were higher in the CCA group. The area under the receiver
operating characteristic ( AUROC) curve was used to measure the diagnostic performance of
the potential single and multiple marker model for each pairwise comparison. As an individual
marker (Figure 5D-F), S100A9 can significantly discriminate the CCA group from the normal
and PDF groups with AUC 0.871 (95%CI; 0.777-0.965) and 0.939 (95%CI; 0.880-0.980),
respectively. Moreover, TRX can significantly discriminate the CCA group from the normal
and PDF groups with AUC 0.797 (95%CI; 0.686-0.907) and 0.888 (95%CI; 0.809-0.967),
respectively. Finally, CDHR2 distinguishes the CCA group from the normal and PDF groups
with AUC 0. 797 ( 95% CI; 0. 759- 0. 953) and 0. 888 ( 95% CI; 0. 782- 0. 953) , respectively.
However, to distinguish the normal groups from the PDF groups was possible only in S100A9
and TRX with AUC 0. 713 ( 95% CI; 0. 582- 0. 845) and 0. 653 ( 95% CI; 0. 514- 0. 793) ,
respectively (Figure 5D). A multiple marker model combining S100A9, TRX and CDHR2 was
used to evaluate the diagnostic performance for CCA diagnosis. The results showed that the
multiple marker panel showed a better performance than the single marker panel for
distinguishing between the CCA groups and the normal and PDF groups with AUC 0. 943
(95%CI; 0.880-1.001) and 0.973 (95%CI; 0.934-1.012), respectively.
18
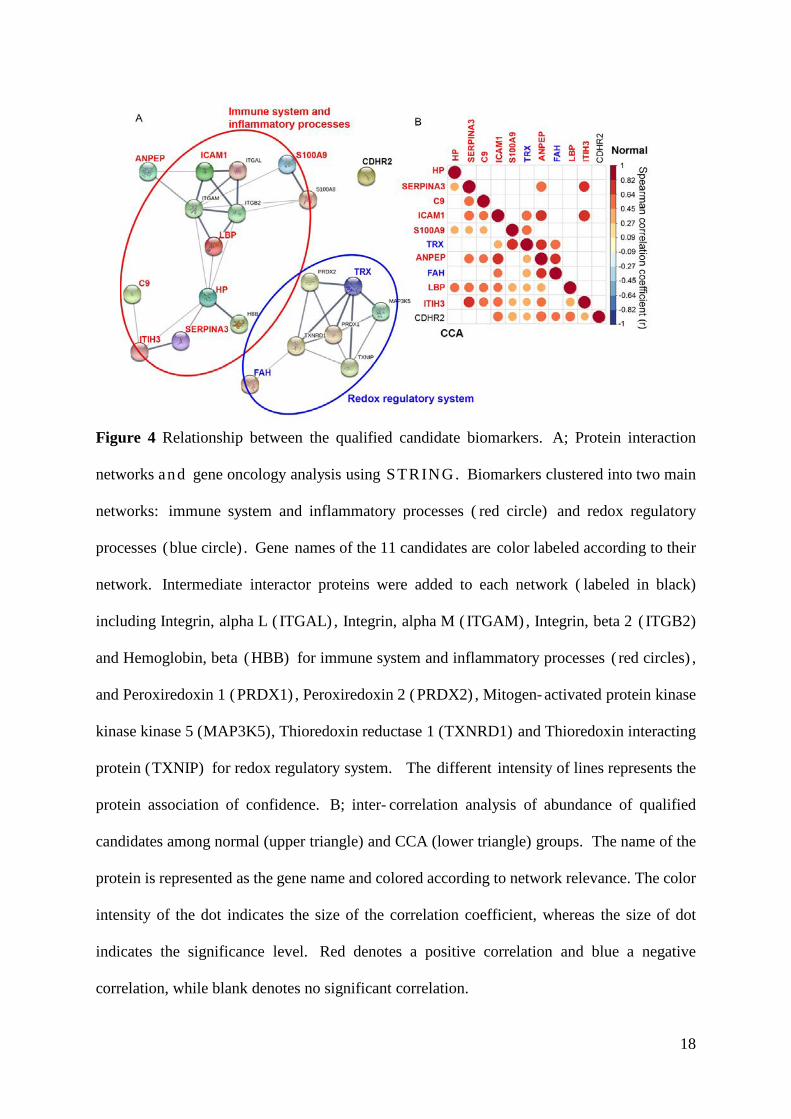
Figure 4 Relationship between the qualified candidate biomarkers. A; Protein interaction
networks and gene oncology analysis using STRING. Biomarkers clustered into two main
networks: immune system and inflammatory processes ( red circle) and redox regulatory
processes (blue circle) . Gene names of the 11 candidates are color labeled according to their
network. Intermediate interactor proteins were added to each network ( labeled in black)
including Integrin, alpha L ( ITGAL) , Integrin, alpha M ( ITGAM) , Integrin, beta 2 ( ITGB2)
and Hemoglobin, beta ( HBB) for immune system and inflammatory processes ( red circles) ,
and Peroxiredoxin 1 ( PRDX1) , Peroxiredoxin 2 ( PRDX2) , Mitogen- activated protein kinase
kinase kinase 5 (MAP3K5), Thioredoxin reductase 1 (TXNRD1) and Thioredoxin interacting
protein (TXNIP) for redox regulatory system. The different intensity of lines represents the
protein association of confidence. B; inter- correlation analysis of abundance of qualified
candidates among normal (upper triangle) and CCA (lower triangle) groups. The name of the
protein is represented as the gene name and colored according to network relevance. The color
intensity of the dot indicates the size of the correlation coefficient, whereas the size of dot
indicates the significance level. Red denotes a positive correlation and blue a negative
correlation, while blank denotes no significant correlation.
19
Figure 5 Diagnostic value of serum biomarker candidates in the qualification phase. A, B
and C; the box and whisker plots show the log2 normalized intensity of these serum protein
candidates in the normal, PDF and CCA groups, which were represented by the green, blue
and red boxes, respectively. Data are represented as mean ± SD. Kruskal-Wallis test was used
to determine the differences of candidate proteins between the groups, followed by Dunnett’ s
test for pairwise group comparison (* P<0.05, ** P<0.01, ***P<0.001). D, E and F; ROC
analysis of single markers for each pairwise comparison including (D) normal versus PDF, (E)
normal versus CCA and ( F) PDF versus CCA. G, H and I; ROC analysis of multiple marker
panels for each pairwise comparison including ( G) normal versus PDF, ( H) normal versus
CCA and ( I) PDF versus CCA ( black solid line: theoretically perfect performance of an
efficient biomarker as the reference line) . Black, green, red and purple lines: actual
performance of S100A9, TRX, CDHR2 and the combination all three candidates, respectively.
20
Antibody-based orthogonal evaluation of the top three candidates
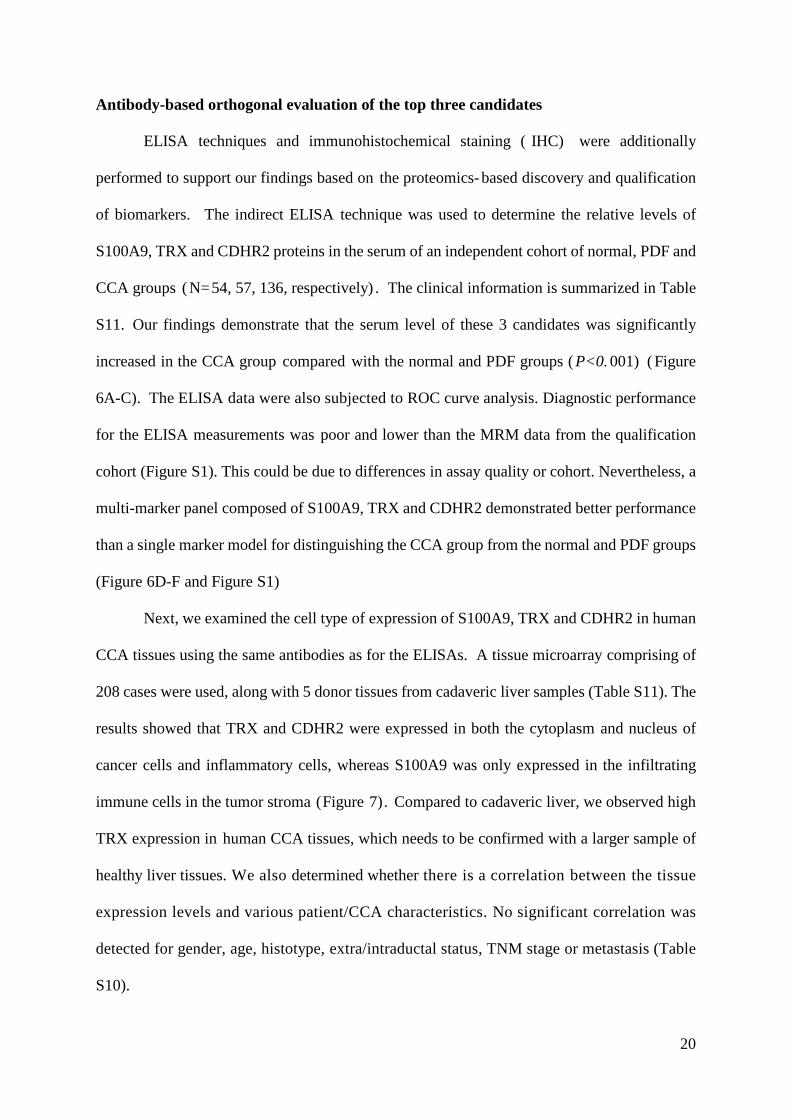
ELISA techniques and immunohistochemical staining ( IHC) were additionally
performed to support our findings based on the proteomics- based discovery and qualification
of biomarkers. The indirect ELISA technique was used to determine the relative levels of
S100A9, TRX and CDHR2 proteins in the serum of an independent cohort of normal, PDF and
CCA groups (N=54, 57, 136, respectively) . The clinical information is summarized in Table
S11. Our findings demonstrate that the serum level of these 3 candidates was significantly
increased in the CCA group compared with the normal and PDF groups ( P<0. 001) ( Figure
6A-C). The ELISA data were also subjected to ROC curve analysis. Diagnostic performance
for the ELISA measurements was poor and lower than the MRM data from the qualification
cohort (Figure S1). This could be due to differences in assay quality or cohort. Nevertheless, a
multi-marker panel composed of S100A9, TRX and CDHR2 demonstrated better performance
than a single marker model for distinguishing the CCA group from the normal and PDF groups
(Figure 6D-F and Figure S1)
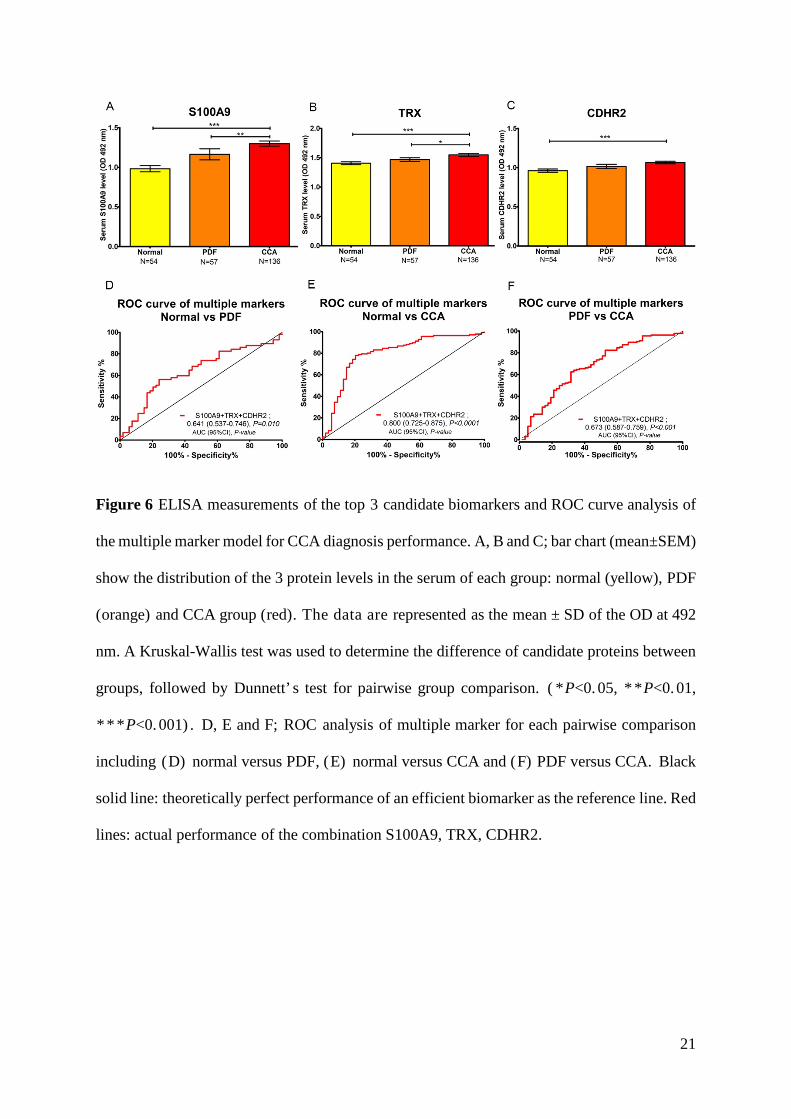
Next, we examined the cell type of expression of S100A9, TRX and CDHR2 in human
CCA tissues using the same antibodies as for the ELISAs. A tissue microarray comprising of
208 cases were used, along with 5 donor tissues from cadaveric liver samples (Table S11). The
results showed that TRX and CDHR2 were expressed in both the cytoplasm and nucleus of
cancer cells and inflammatory cells, whereas S100A9 was only expressed in the infiltrating
immune cells in the tumor stroma (Figure 7). Compared to cadaveric liver, we observed high
TRX expression in human CCA tissues, which needs to be confirmed with a larger sample of
healthy liver tissues. We also determined whether there is a correlation between the tissue
expression levels and various patient/CCA characteristics. No significant correlation was
detected for gender, age, histotype, extra/intraductal status, TNM stage or metastasis (Table
S10).
21
Figure 6 ELISA measurements of the top 3 candidate biomarkers and ROC curve analysis of
the multiple marker model for CCA diagnosis performance. A, B and C; bar chart (mean±SEM)
show the distribution of the 3 protein levels in the serum of each group: normal (yellow), PDF
(orange) and CCA group (red). The data are represented as the mean ± SD of the OD at 492
nm. A Kruskal-Wallis test was used to determine the difference of candidate proteins between
groups, followed by Dunnett’ s test for pairwise group comparison. ( * P<0. 05, * * P<0. 01,
* * * P<0. 001) . D, E and F; ROC analysis of multiple marker for each pairwise comparison
including (D) normal versus PDF, (E) normal versus CCA and (F) PDF versus CCA. Black
solid line: theoretically perfect performance of an efficient biomarker as the reference line. Red
lines: actual performance of the combination S100A9, TRX, CDHR2.
22
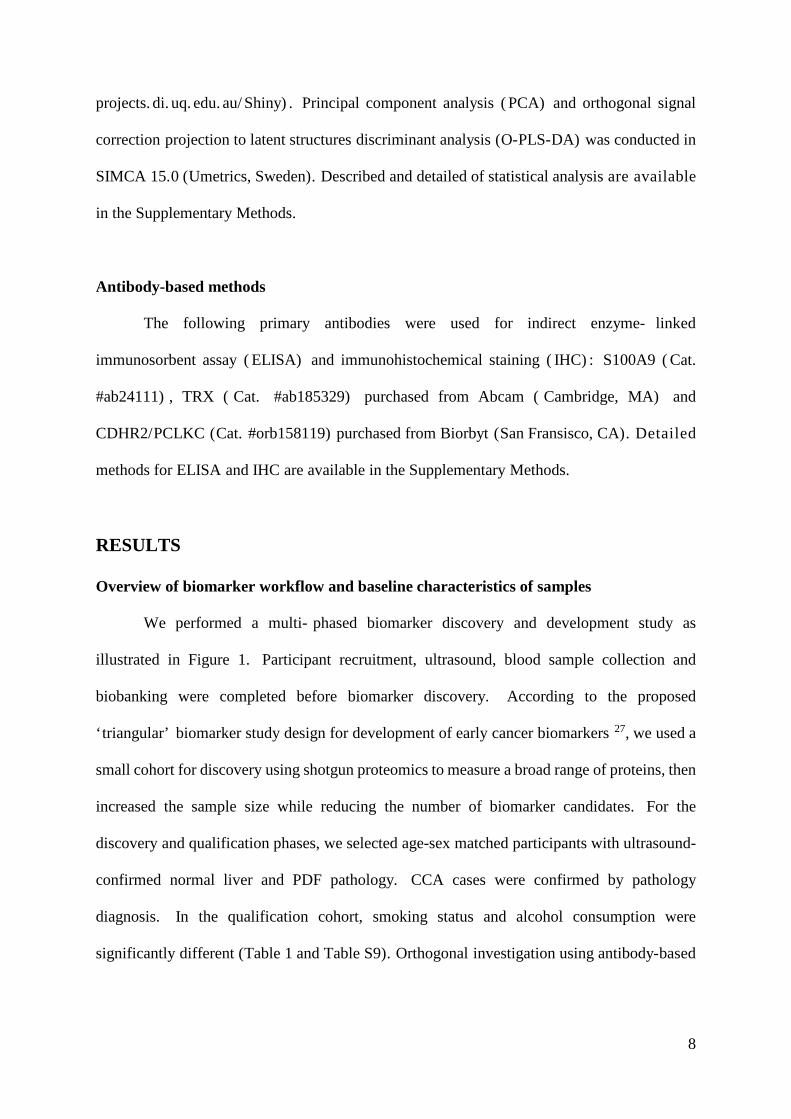
Figure 7 Immunohistochemical staining of the three candidate proteins, Protein S100A9
( S100A9) , Thioredoxin ( TRX) and Cadherin- related family member 2 ( CDHR2) , was
performed on cadaveric donor liver tissues ( upper panel) and human CCA microtissue arrays
(lower panel).
DISCUSSION
As a first step towards screening/surveillance of the high risk population in the endemic
area in northern Thailand, we completed the first serum protein biomarker discovery and
qualification study for differential diagnosis of CCA from healthy controls, and from PDF
which results from Ov infection and is the pre-malignant condition for Ov-associated CCA.2-3
Importantly, we used ultrasonography diagnosis as the gold standard for the normal and PDF
groups. 7 The serum protein biomarker pipeline was composed of the discovery phase using
shotgun proteomics ( LC- MS/ MS) , the qualification phase using targeted proteomics
(MRM/MS) and orthogonal evaluation using antibody-based assays (ELISA and IHC). Out of
the 238 serum proteins measured in the discovery phase, 40 (16.8%) were selected as candidate
23
CCA biomarkers to progress to the qualification phase, from which 11 were qualified (26.2%)
in an independent cohort to have diagnostic value for CCA versus normal or PDF. Network
and GO analyses of the 11 qualified biomarker candidates revealed two biological functions
which are known to be important in carcinogenesis: immune system and inflammatory
processes, and redox regulatory processes. In contrast, although PDF is driven by oxidative
damage and inflammation, there were no serum protein candidates that could distinguish the
PDF from the normal group. This result suggests that development of PDF into CCA is
accompanied by additional changes in secreted proteins.
From the descriptive clinical data on the samples in the qualification set, smoking status
and alcohol consumption were significantly more common in the CCA population when
compared with the PDF group. This is expected as smoking and alcohol consumption increase
the risk of hepatocellular carcinomas ( HCC) and CCA. 30 Previous investigations found that
smokers show an increased risk of intrahepatic cholangiocarcinoma (ICC) (HR =1.47, 95%
CI: 1. 07– 2. 02) and alcohol consumption is associated with a 68% increased ICC risk
(HR=1.68, 95% CI: 0.99–2.86). To determine if any of the biomarker candidates were
related to smoking or alcohol consumption, a Mann Whitney U-test was conducted on the
MRM data. This analysis showed a significant correlation with smoking status for TRX
(p=0.01), CDHR2 (p=0.009), ICAM1 (p=0.003), ANPEP (p=0.008) and FAH (p=0.007)
(Figure S2). Further evaluation is needed to decipher the relationships between these CCA
biomarker candidates with smoking/alcohol.
Following the mass spectrometry-based discovery and qualification phases, we further
evaluated the three most significant candidates (S100A9, TRX and CDHR2) using antibodies.
There are major technical differences between the mass spectrometry-based measurements and
the antibody-based techniques. While the former technique measures peptides and then infers
protein levels based on a few peptides, the latter technique directly measures proteins but only
24
the proteoforms that are recognized by the antibody used. Secondly, due to detection limits of
the mass spectrometer in a complex matrix, serum samples were processed through
immunodepletion which was not necessary for the antibody- based methods. Finally,
normalization for the mass spectrometry assays was at the level of protein quantity following
immunodepletion, whereas the ELISA was normalized by serum volume. Although both MRM
and ELISA assays can provide absolute quantitation when appropriate external standards are
used in the assay, such reagents were not available/ developed for the current biomarker
qualification phases. Despite the numerous technical differences and the independent patient
cohorts, we observed similar trends for the ELISA and MRM data sets. S100A9, TRX and
CDHR2 were significantly elevated in the serum of CCA patients compared with the PDF and
normal groups. Although the MRM data reported high diagnostic values for individual markers
(AUROC range from 0.797 to 0.967) and for multi-marker panels (AUC 0.943 for CCA versus
normal, AUC 0.973 for CCA versus PDF), the diagnostic values obtained from the ELISA
data were not impressive.
The calcium binding protein S100A9 heterodimerizes with S100A8 to form
calprotectin, and is generally released from neutrophils as an inflammatory mediator. 31 In
agreement, we detected S1 0 0 A9 protein expression in the infiltrating immune cells of CCA
tissues. S100A9 has been reported to be elevated in several cancers, including colorectal cancer
32, cervical cancer 33 and lung cancer. 3 4 Although elevated S100A9 expression has not been
reported in CCA, the related calcium- binding protein S100P was recently reported to be
upregulated in CCA.35
Thioredoxin is a small redox-regulating protein that plays crucial roles in maintaining
cellular redox homeostasis and cell survival. TRX is highly expressed in many cancers
including lung, cervix, pancreatic, colorectal, hepatocellular carcinomas ( HCC) , gastric
carcinomas and breast cancer.36-42 Previous studies have also shown the overexpression of TRX
25
in both human CCA tissues and liver fluke- induced CCA in the hamster model. 43 Moreover,
they suggest that TRX plays a role in the transformation of bile duct epithelial cells and tumor
progression during cholangiocarcinogenesis.43
Cadherin- related family member 2 ( CHDR2) , also known as the proto- cadherin liver
kidney and colon protein ( PCLKC) or protocadherin- 24 ( PCDH24) , plays a role in contact
inhibition at the lateral surface of epithelial cells.44 A previous study has suggested that CDHR2
can act as a tumor suppressor that induces contact inhibition in colon cancer cells, thereby
inhibiting tumor formation.44 Although we detected CDHR2 protein expression in CCA tissue,
there was an insufficient number of normal cases for statistical evaluation in this study. Our
serum data using MRM and ELISA showed elevated CDHR2 protein in the CCA compared to
the normal and PDF groups. This may indicate the release of CDHR2 from CCA tissue.
Additional tissue- serum sample comparison will need to be conducted to determine if there is
a significant correlation. Interestingly, although CDHR2 does not have a known role in
inflammatory or redox regulation, its serum levels positively correlated with the other CCA
biomarker candidates in our cohort.
CONCLUSION
In summary, through serum biomarker discovery and qualification steps, we report
eleven potential biomarker candidates for CCA diagnosis. These biomarker candidates have
known functions in immune/inflammatory and redox regulatory processes, supporting the role
of these pathways in carcinogenesis. The main strength of this study is that it was conducted at
a population- based level in an endemic area using ultrasonography diagnosis of PDF and
healthy controls. Future studies should evaluate these serum CCA biomarker candidates in
other independent cohorts, prior to prospective trials.

26
DATA AVAILABILAITY
The raw mass spectrometry proteomics data along with database search results have been
deposited at the publicly accessible platform ProteomeXchange via the PRIDE partner
repository45 for the discovery cohort with the data set identifier PXD011804, and via
PASSEL46 for the qualification cohort has the dataset identifier PASS01298.
AUTHOR INFORMATION
CORRESPONDENECE:
Associate Professor Watcharin Loilome,
Department of Biochemistry, Faculty of Medicine, Khon Kaen University,
123 Mitraphab Road, Khon Kaen Province, Thailand 40002.
Tel: +66 8 1954 1184, Email: [email protected]
Associate Professor Michelle Hill,
QIMR Berghofer Medical Research Institute,
300 Herston Rd, Herston, QLD, Australia 4006.
Tel: +61 7 3845 3020, Email: [email protected]
AUTHOR CONTRIBUTIONS
W.L., P.Y., R.T., A.T., S.R., J.M. and M.H. participated in the project planning, co-ordination
and the experimental design. N. K and N. C. contributed to confirmation by ultrasonography
results. K. D. conducted protein isolation, peptide preparation and proteomics- related
experiments. K.D. , T.S. , A.S. , A.M. contributed to method development and data analysis.
27
K.D., A.M., A.S., J.P., and WL analyzed and interpreted the data. K.D. drafted the manuscript,
W.L., J.M. and M.H. edited the manuscript. All authors approved the manuscript.
FOOTNOTES
The authors declare that the research was conducted with no conflict of interest in the
absence of any commercial or financial relationships.
SUPPORTING INFORMATION
Detail of method for protein depletion and concentration; trypsin digest and sample
preparation for MS analysis; LC-MS/MS and data searching for discovery phase; MRM/MS
assay development; MRM-MS analysis of qualification cohort; bioinformatics and statistical
analysis; ELISA and IHC (PDF)
Table S1A. Total protein identification in the discovery phase processed in MaxQuant output.
Some proteins were excluded by following the criteria. (XLSX)
Table S1B. Total peptide identification and their sequences in the discovery phase processed
in MaxQuant output. Some proteins were excluded by following the criteria. (XLSX)
Table S2. The significant serum candidates list from the discovery phase following criteria
selection for the MRM-MS experiment. (XLSX)
Table S3. All peptides and transition of selected serum candidate proteins for the MRM-MS
experiment. (XLSX)
Table S4. Area under the curve of each peptide (sum of all transitions) of serum candidates
by exporting output from Skyline software. (XLSX)
Table S5. The normalization of peptide area under peak using 1) the median normalized iRT
as normalizing factor and 2) normalization of all peptides in each sample. (XLSX)
28
Table S6. The log2-transformed data of normalized intensity in each protein that has a
normalized peptide intensity correlation > 0.9 using Pearson correlation. (XLSX)
Table S7. The correlation coefficient values and univariate analysis of all qualified serum
protein candidates by MRM/MS and O-PLS-DA analysis. (XLSX)
Table S8. The functional gene ontology (GO) enrichment analysis of the qualified serum
candidates using STRING software (http://string-db.org) to predict protein-protein
associations with other proteins in different pathways. (XLSX)
Table S9. The statistical analysis of multiple comparison of significant clinical data
differences by sample group comparison in the qualification phase. (PDF)
Table S10. The correlation of clinical pathological data with the expression of the 3
diagnostic biomarkers. (PDF)
Table S11 The clinical information of the validation cohort set for ELISA and IHC assays
(PDF)
Figure S1 ROC analysis for single marker in each pairwise comparison including normal
versus PDF, normal versus CCA and PDF versus CCA (PDF)
Figure S2 Confounder analysis for smoking status of 11 serum biomarker candidates (PDF)
ABBREVIATIONS
A1AC /SERPIN3 Alpha-1-antichymotrypsin
ANPEP Aminopeptidase N
AUROC Area under receiver operating characteristic

29
C9 Complement 9
CCA Cholangiocarcinoma
CDHR2 Cadherin-related family member 2
ELISA Enzyme-linked immunosorbent assay
FAH Fumarylacetoacetase
HP Haptoglobin
ICAM1 Intercellular adhesion molecule 1
IDA Information-dependent acquisition
IHC Immunohistochemistry staining
ITIH3 Inter-alpha-trypsin inhibitor heavy chain H3
LBP Lipopolysaccharide-binding protein
LC-MS/MS Liquid chromatography-tandem mass spectrometry
LFQ Label-free quantification
MRM Multiple reactions monitoring
OPD O-phenylenediamine dihydrochloride
Ov Opisthorchis viverrini
O-PLS-DA Orthogonal partial least squares discriminant analysis
PCA Principal component analysis
PDF Periductal fibrosis
ROC Receiver operating characteristic
S100A9 ProteinS100A9
SRM Selected reaction monitoring
TMA Tissues microarrays
TRX/TXN Thioredoxin
US Ultrasonography
30
ACKNOWLEDGMENT
This research was supported by Thailand Research Fund through Royal Golden Jubilee Ph. D.
Program and Khon Kaen University (Grant No. PHD/0145/2556) to W.L. and K.D. , a grant
from Cholangiocarcinoma Screening and Care Program (Grant No. CASCAP-09), the grant of
Faculty of Medicine to K.D. (Grant No. IN 59340) a grant from the Thailand Research Fund
(Grant No. RSA5980013) allocated to W.L. Mass spectrometry was conducted at the QIMR
Berghofer Medical Research Institute, and the University of Queensland Centre for Clinical
Research. We thank Dr. Sarah Reed and Buddhika Jayakody for the technical support. We
thank Professor Trevor N. Petney for editing the MS via the Publication Clinic KKU, Thailand.
REFERENCES
1. Blechacz, B.; Komuta, M.; Roskams, T.; Gores, G. J., Clinical diagnosis and staging of
cholangiocarcinoma. Nat Rev Gastroenterol Hepatol 2011, 8 (9), 512-22.
2. Sripa, B.; Pairojkul, C., Cholangiocarcinoma: lessons from Thailand. Current opinion
in gastroenterology 2008, 24 (3), 349-56.
3. Haswell- Elkins, M. R. ; Mairiang, E. ; Mairiang, P. ; Chaiyakum, J. ; Chamadol, N. ;
Loapaiboon, V.; Sithithaworn, P.; Elkins, D. B., Cross-sectional study of Opisthorchis viverrini
infection and cholangiocarcinoma in communities within a high- risk area in northeast
Thailand. Int J Cancer 1994, 59 (4), 505-9.
4. Pinlaor, S. ; Hiraku, Y. ; Ma, N. ; Yongvanit, P. ; Semba, R. ; Oikawa, S. ; Murata, M. ;
Sripa, B.; Sithithaworn, P.; Kawanishi, S., Mechanism of NO-mediated oxidative and nitrative
DNA damage in hamsters infected with Opisthorchis viverrini: a model of inflammation-
mediated carcinogenesis. Nitric Oxide 2004, 11 (2), 175-83.

31
5. Thanan, R. ; Murata, M. ; Pinlaor, S. ; Sithithaworn, P. ; Khuntikeo, N. ; Tangkanakul,
W. ; Hiraku, Y. ; Oikawa, S. ; Yongvanit, P. ; Kawanishi, S. , Urinary 8- oxo- 7,8- dihydro- 2'-
deoxyguanosine in patients with parasite infection and effect of antiparasitic drug in relation to
cholangiocarcinogenesis. Cancer Epidemiol Biomarkers Prev 2008, 17 (3), 518-24.
6. Yongvanit, P. ; Pinlaor, S. ; Loilome, W. , Risk biomarkers for assessment and
chemoprevention of liver fluke-associated cholangiocarcinoma. J Hepatobiliary Pancreat Sci
2014, 21 (5), 309-15.
7. Chamadol, N. ; Pairojkul, C. ; Khuntikeo, N. ; Laopaiboon, V. ; Loilome, W. ;
Sithithaworn, P. ; Yongvanit, P. , Histological confirmation of periductal fibrosis from
ultrasound diagnosis in cholangiocarcinoma patients. J Hepatobiliary Pancreat Sci 2014, 21
(5), 316-22.
8. Bichsel, V. E.; Liotta, L. A.; Petricoin, E. F., 3rd, Cancer proteomics: from biomarker
discovery to signal pathway profiling. Cancer J 2001, 7 (1), 69-78.
9. Ru, Q. C.; Zhu, L. A.; Silberman, J.; Shriver, C. D., Label-free semiquantitative peptide
feature profiling of human breast cancer and breast disease sera via two- dimensional liquid
chromatography- mass spectrometry. Molecular & cellular proteomics : MCP 2006, 5 ( 6) ,
1095-104.
10. de Noo, M. E.; Mertens, B. J.; Ozalp, A.; Bladergroen, M. R.; van der Werff, M. P.;
van de Velde, C. J. ; Deelder, A. M. ; Tollenaar, R. A. , Detection of colorectal cancer using
MALDI-TOF serum protein profiling. European journal of cancer 2006, 42 (8), 1068-76.
11. Adam, B. L. ; Qu, Y. ; Davis, J. W.; Ward, M. D.; Clements, M. A.; Cazares, L. H. ;
Semmes, O. J. ; Schellhammer, P. F. ; Yasui, Y. ; Feng, Z. ; Wright, G. L. , Jr. , Serum protein
fingerprinting coupled with a pattern- matching algorithm distinguishes prostate cancer from
benign prostate hyperplasia and healthy men. Cancer research 2002, 62 (13), 3609-14.
32
12. Jacot, W. ; Lhermitte, L. ; Dossat, N. ; Pujol, J. L. ; Molinari, N. ; Daures, J. P. ;
Maudelonde, T. ; Mange, A. ; Solassol, J. , Serum proteomic profiling of lung cancer in high-
risk groups and determination of clinical outcomes. Journal of thoracic oncology : official
publication of the International Association for the Study of Lung Cancer 2008, 3 (8), 840-50.
13. Sriwanitchrak, P. ; Viyanant, V. ; Chaijaroenkul, W. ; Srivatanakul, P. ; Gram, H. R. ;
Eursiddhichai, V. ; Na- Bangchang, K. , Proteomics analysis and evaluation of biomarkers for
detection of cholangiocarcinoma. Asian Pac J Cancer Prev 2011, 12 (6), 1503-10.
14. Shi, Y.; Deng, X.; Zhan, Q.; Shen, B.; Jin, X.; Zhu, Z.; Chen, H.; Li, H.; Peng, C., A
prospective proteomic- based study for identifying potential biomarkers for the diagnosis of
cholangiocarcinoma. J Gastrointest Surg 2013, 17 (9), 1584-91.
15. Darby, I. A.; Vuillier-Devillers, K.; Pinault, E.; Sarrazy, V.; Lepreux, S.; Balabaud, C.;
Bioulac- Sage, P. ; Desmouliere, A. , Proteomic analysis of differentially expressed proteins in
peripheral cholangiocarcinoma. Cancer Microenviron 2010, 4 (1), 73-91.
16. Chambers, A. G.; Percy, A. J.; Simon, R.; Borchers, C. H., MRM for the verification
of cancer biomarker proteins: recent applications to human plasma and serum. Expert Rev
Proteomics 2014, 11 (2), 137-48.
17. Parker, C. E.; Domanski, D.; Percy, A. J.; Chambers, A. G.; Camenzind, A. G.; Smith,
D. S. ; Borchers, C. H. , Mass spectrometry in high- throughput clinical biomarker assays:
multiple reaction monitoring. Top Curr Chem 2014, 336, 117-37.
18. Abbatiello, S. E.; Schilling, B.; Mani, D. R.; Zimmerman, L. J.; Hall, S. C.; MacLean,
B.; Albertolle, M.; Allen, S.; Burgess, M.; Cusack, M. P.; Gosh, M.; Hedrick, V.; Held, J. M.;
Inerowicz, H. D.; Jackson, A.; Keshishian, H.; Kinsinger, C. R.; Lyssand, J. ; Makowski, L.;
Mesri, M.; Rodriguez, H.; Rudnick, P.; Sadowski, P.; Sedransk, N.; Shaddox, K.; Skates, S. J.;
Kuhn, E.; Smith, D.; Whiteaker, J. R.; Whitwell, C.; Zhang, S.; Borchers, C. H.; Fisher, S. J.;
Gibson, B. W.; Liebler, D. C.; MacCoss, M. J.; Neubert, T. A.; Paulovich, A. G.; Regnier, F.
33
E. ; Tempst, P. ; Carr, S. A. , Large- Scale Interlaboratory Study to Develop, Analytically
Validate and Apply Highly Multiplexed, Quantitative Peptide Assays to Measure Cancer-
Relevant Proteins in Plasma. Mol Cell Proteomics 2015, 14 (9), 2357-74.
19. Addona, T. A.; Abbatiello, S. E.; Schilling, B.; Skates, S. J.; Mani, D. R.; Bunk, D. M.;
Spiegelman, C. H. ; Zimmerman, L. J. ; Ham, A. J. ; Keshishian, H. ; Hall, S. C. ; Allen, S. ;
Blackman, R. K.; Borchers, C. H.; Buck, C.; Cardasis, H. L.; Cusack, M. P.; Dodder, N. G.;
Gibson, B. W.; Held, J. M.; Hiltke, T.; Jackson, A.; Johansen, E. B.; Kinsinger, C. R.; Li, J.;
Mesri, M. ; Neubert, T. A. ; Niles, R. K. ; Pulsipher, T. C. ; Ransohoff, D. ; Rodriguez, H. ;
Rudnick, P. A.; Smith, D.; Tabb, D. L.; Tegeler, T. J.; Variyath, A. M.; Vega-Montoto, L. J.;
Wahlander, A. ; Waldemarson, S. ; Wang, M. ; Whiteaker, J. R. ; Zhao, L. ; Anderson, N. L. ;
Fisher, S. J.; Liebler, D. C.; Paulovich, A. G.; Regnier, F. E.; Tempst, P.; Carr, S. A., Multi-
site assessment of the precision and reproducibility of multiple reaction monitoring- based
measurements of proteins in plasma. Nat Biotechnol 2009, 27 (7), 633-41.
20. Shah, A. K. ; Hartel, G. ; Brown, I. ; Winterford, C. ; Na, R. ; Le Cao, K. A. ; Spicer, B.
A.; Dunstone, M. A.; Phillips, W. A.; Lord, R. V.; Barbour, A. P.; Watson, D. I.; Joshi, V.;
Whiteman, D. C. ; Hill, M. M. , Evaluation of serum glycoprotein biomarker candidates for
detection of esophageal adenocarcinoma and surveillance of Barrett's esophagus. Mol Cell
Proteomics 2018, 17 (12), 2324-2334.
21. Brock, R. ; Xiong, B. ; Li, L. ; Vanbogelen, R. A. ; Christman, L. , A multiplex serum
protein assay for determining the probability of colorectal cancer. Am J Cancer Res 2012, 2
(5), 598-605.
22. Shah, A. K.; Cao, K. A.; Choi, E.; Chen, D.; Gautier, B.; Nancarrow, D.; Whiteman,
D. C.; Saunders, N. A.; Barbour, A. P.; Joshi, V.; Hill, M. M., Serum Glycoprotein Biomarker
Discovery and Qualification Pipeline Reveals Novel Diagnostic Biomarker Candidates for
Esophageal Adenocarcinoma. Mol Cell Proteomics 2015, 14 (11), 3023-39.
34
23. Dave, K. A.; Norris, E. L.; Bukreyev, A. A.; Headlam, M. J.; Buchholz, U. J.; Singh,
T.; Collins, P. L.; Gorman, J. J., A comprehensive proteomic view of responses of A549 type
II alveolar epithelial cells to human respiratory syncytial virus infection. Mol Cell Proteomics
2014, 13 (12), 3250-69.
24. Cox, J. ; Hein, M. Y. ; Luber, C. A. ; Paron, I. ; Nagaraj, N. ; Mann, M. , Accurate
proteome- wide label- free quantification by delayed normalization and maximal peptide ratio
extraction, termed MaxLFQ. Mol Cell Proteomics 2014, 13 (9), 2513-26.
25. Cox, J.; Mann, M., MaxQuant enables high peptide identification rates, individualized
p.p.b.-range mass accuracies and proteome-wide protein quantification. Nat Biotechnol 2008,
26 (12), 1367-72.
26. MacLean, B.; Tomazela, D. M.; Shulman, N.; Chambers, M.; Finney, G. L.; Frewen,
B.; Kern, R.; Tabb, D. L.; Liebler, D. C.; MacCoss, M. J., Skyline: an open source document
editor for creating and analyzing targeted proteomics experiments. Bioinformatics 2010, 26
(7), 966-8.
27. Rifai, N.; Gillette, M. A.; Carr, S. A., Protein biomarker discovery and validation: the
long and uncertain path to clinical utility. Nat Biotechnol 2006, 24 (8), 971-83.
28. Percy, A. J.; Chambers, A. G.; Yang, J.; Domanski, D.; Borchers, C. H., Comparison
of standard- and nano-flow liquid chromatography platforms for MRM-based quantitation of
putative plasma biomarker proteins. Anal Bioanal Chem 2012, 404 (4), 1089-101.
29. Szklarczyk, D.; Morris, J. H.; Cook, H.; Kuhn, M.; Wyder, S.; Simonovic, M.; Santos,
A.; Doncheva, N. T.; Roth, A.; Bork, P.; Jensen, L. J.; von Mering, C., The STRING database
in 2017: quality- controlled protein- protein association networks, made broadly accessible.
Nucleic Acids Res 2017, 45 (D1), D362-D368.
30. Petrick, J. L.; Campbell, P. T.; Koshiol, J.; Thistle, J. E.; Andreotti, G.; Beane-Freeman,
L. E.; Buring, J. E.; Chan, A. T.; Chong, D. Q.; Doody, M. M.; Gapstur, S. M.; Gaziano, J. M.;
35
Giovannucci, E.; Graubard, B. I.; Lee, I. M.; Liao, L. M.; Linet, M. S.; Palmer, J. R.; Poynter,
J. N.; Purdue, M. P.; Robien, K.; Rosenberg, L.; Schairer, C.; Sesso, H. D.; Sinha, R.; Stampfer,
M. J. ; Stefanick, M.; Wactawski-Wende, J. ; Zhang, X. ; Zeleniuch-Jacquotte, A. ; Freedman,
N. D. ; McGlynn, K. A. , Tobacco, alcohol use and risk of hepatocellular carcinoma and
intrahepatic cholangiocarcinoma: The Liver Cancer Pooling Project. Br J Cancer 2018, 118
(7), 1005-1012.
31. Shabani, F.; Farasat, A.; Mahdavi, M.; Gheibi, N., Calprotectin (S100A8/S100A9): a
key protein between inflammation and cancer. Inflamm Res 2018, 67 (10), 801-812.
32. Shu, P.; Zhao, L.; Wagn, J.; Shen, X.; Zhang, X.; Shen, S.; Ma, J.; Li, X., [Association
between serum levels of S100A8/ S100A9 and clinical features of colorectal cancer patients] .
Zhong Nan Da Xue Xue Bao Yi Xue Ban 2016, 41 (6), 553-9.
33. Zhu, H.; Pei, H. P.; Zeng, S.; Chen, J.; Shen, L. F.; Zhong, M. Z.; Yao, R. J.; Shen, H.,
Profiling protein markers associated with the sensitivity to concurrent chemoradiotherapy in
human cervical carcinoma. J Proteome Res 2009, 8 (8), 3969-76.
34. Kawai, H.; Minamiya, Y.; Takahashi, N., Prognostic impact of S100A9 overexpression
in non-small cell lung cancer. Tumour Biol 2011, 32 (4), 641-6.
35. Hamada, S. ; Satoh, K. ; Hirota, M. ; Kanno, A. ; Ishida, K. ; Umino, J. ; Ito, H. ; Kikuta,
K. ; Kume, K. ; Masamune, A. ; Katayose, Y. ; Unno, M. ; Shimosegawa, T. , Calcium- binding
protein S100P is a novel diagnostic marker of cholangiocarcinoma. Cancer Sci 2011, 102 (1),
150-6.
36. Kim, H. J.; Chae, H. Z.; Kim, Y. J.; Kim, Y. H.; Hwangs, T. S.; Park, E. M.; Park, Y.
M. , Preferential elevation of Prx I and Trx expression in lung cancer cells following hypoxia
and in human lung cancer tissues. Cell Biol Toxicol 2003, 19 (5), 285-98.
37. Hedley, D. ; Pintilie, M. ; Woo, J. ; Nicklee, T. ; Morrison, A. ; Birle, D. ; Fyles, A. ;
Milosevic, M. ; Hill, R. , Up- regulation of the redox mediators thioredoxin and
36
apurinic/ apyrimidinic excision ( APE) / Ref- 1 in hypoxic microregions of invasive cervical
carcinomas, mapped using multispectral, wide-field fluorescence image analysis. Am J Pathol
2004, 164 (2), 557-65.
38. Han, H.; Bearss, D. J.; Browne, L. W.; Calaluce, R.; Nagle, R. B.; Von Hoff, D. D.,
Identification of differentially expressed genes in pancreatic cancer cells using cDNA
microarray. Cancer Res 2002, 62 (10), 2890-6.
39. Raffel, J.; Bhattacharyya, A. K.; Gallegos, A.; Cui, H.; Einspahr, J. G.; Alberts, D. S.;
Powis, G., Increased expression of thioredoxin-1 in human colorectal cancer is associated with
decreased patient survival. J Lab Clin Med 2003, 142 (1), 46-51.
40. Choi, J. H. ; Kim, T. N. ; Kim, S. ; Baek, S. H. ; Kim, J. H. ; Lee, S. R. ; Kim, J. R. ,
Overexpression of mitochondrial thioredoxin reductase and peroxiredoxin III in hepatocellular
carcinomas. Anticancer Res 2002, 22 (6A), 3331-5.
41. Grogan, T. M.; Fenoglio-Prieser, C. ; Zeheb, R. ; Bellamy, W.; Frutiger, Y. ; Vela, E. ;
Stemmerman, G.; Macdonald, J.; Richter, L.; Gallegos, A.; Powis, G., Thioredoxin, a putative
oncogene product, is overexpressed in gastric carcinoma and associated with increased
proliferation and increased cell survival. Hum Pathol 2000, 31 (4), 475-81.
42. Cha, M. K.; Suh, K. H.; Kim, I. H., Overexpression of peroxiredoxin I and thioredoxin1
in human breast carcinoma. J Exp Clin Cancer Res 2009, 28, 93.
43. Yoon, B. I. ; Kim, Y. H. ; Yi, J. Y. ; Kang, M. S. ; Jang, J. J. ; Joo, K. H. ; Kim, Y. ;
McHugh Law, J. ; Kim, D. Y. , Expression of thioredoxin during progression of hamster and
human cholangiocarcinoma. Cancer Sci 2010, 101 (1), 281-8.
44. Okazaki, N.; Takahashi, N.; Kojima, S.; Masuho, Y.; Koga, H., Protocadherin LKC, a
new candidate for a tumor suppressor of colon and liver cancers, its association with contact
inhibition of cell proliferation. Carcinogenesis 2002, 23 (7), 1139-48.
37
45. Vizcaino, J. A.; Csordas, A.; del-Toro, N.; Dianes, J. A.; Griss, J.; Lavidas, I.; Mayer,
G.; Perez-Riverol, Y.; Reisinger, F.; Ternent, T.; Xu, Q. W.; Wang, R.; Hermjakob, H., 2016
update of the PRIDE database and its related tools. Nucleic Acids Res 2016, 44 ( D1) , D447-
56.
46. Farrah, T. ; Deutsch, E. W. ; Kreisberg, R. ; Sun, Z. ; Campbell, D. S. ; Mendoza, L. ;
Kusebauch, U. ; Brusniak, M. Y. ; Huttenhain, R. ; Schiess, R. ; Selevsek, N. ; Aebersold, R. ;
Moritz, R. L., PASSEL: the PeptideAtlas SRMexperiment library. Proteomics 2012, 12 (8),
1170-5.
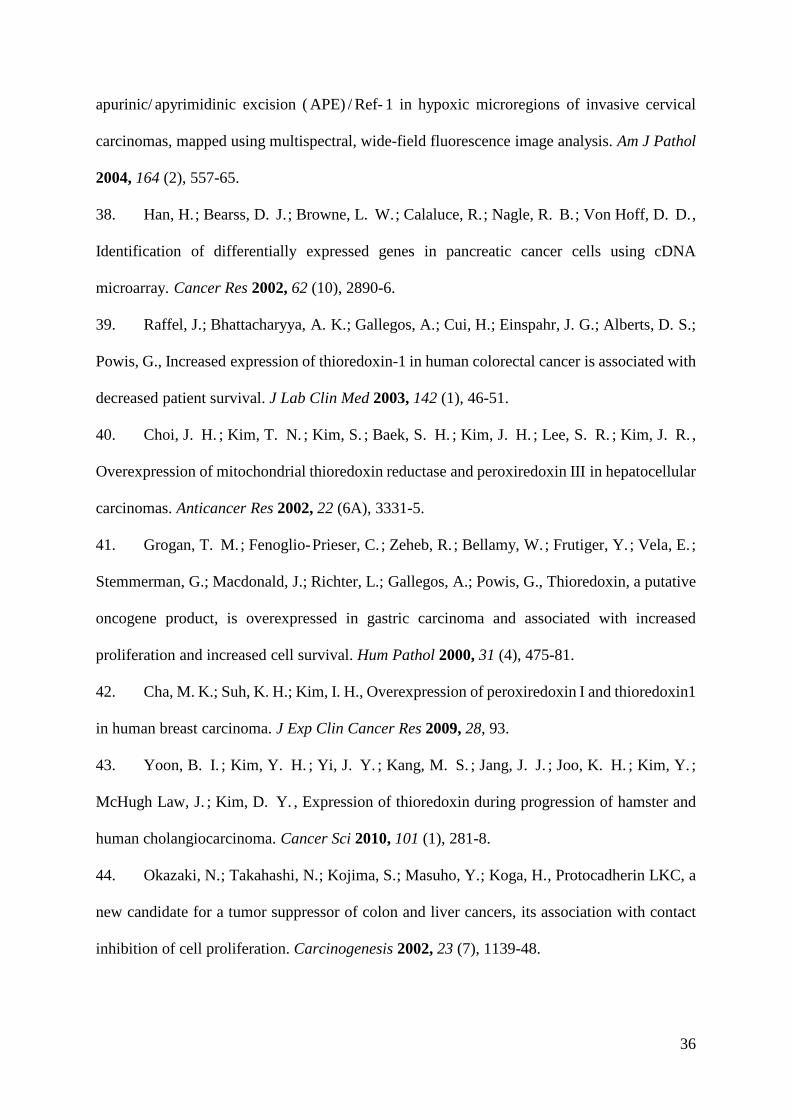
GRAPHICAL ABSTRACT
“For TOC Only”