Embed Size (px)
Citation preview

Discovery and Validation of prostate cancer biomarkers
Flip_Jansen.indd 1 30-7-2013 8:43:35

Flip_Jansen.indd 2 30-7-2013 8:43:35

Discovery anD valiDation of
prostate cancer biomarkers
Flip H. Jansen
Flip_Jansen.indd 3 30-7-2013 8:43:35

ISBN: 978-90-9027673-1
DISCOVERY AND VALIDATION OF PROSTATE CANCER BIOMARKERS
Flip H. JansenEmail: [email protected]
The studies described in this thesis were performed at the Departments of Urology, Clinical Chemistry, and Clinical Genetics and Neurology, Erasmus MC, and the Department of Biomolecular Mass Spectrometry, Utrecht University, The Netherlands.
Part of the contents of this thesis is based on articles published in different scientific journals. Differences may exist in exact wording between the text in this thesis and the text of the published version of the articles due to editorial changes and linguistic differences.
Cover design: Flip Jansen and TextceteraDesign and layout: TextceteraPrinted by: Wilco, Amersfoort
©2013 Flip H. Jansen. All rights reserved. No part of this thesis may be reproduced, stored in a retrieval system of any nature, or transmitted, in any form or by any means, electronic, mechanical, photocopying, recording or otherwise, without permission of the author.
The printing of this thesis was financially supported by (alphabetically):AbbVie, Astellas, Bayer, Beckman Coulter, ChipSoft, Eurocept, GlaxoSmithKline, Hoogland Medical, Ipsen, Janssen, Pohl-Boskamp, ProstaatKankerStichting.nl, Rochester Medical, Sanofi-Aventis, Star-MDC, Stichting Campbell In Situ, Stichting Urologisch Wetenschappelijk Onderzoek (SUWO), Stichting Wetenschappelijk Onderzoek Prostaatkanker (SWOP).
Flip_Jansen.indd 4 30-7-2013 8:43:35
Discovery anD valiDation oF Prostate cancer Biomarkers
Ontdekking en validatie van biomerkers voor prostaatkanker
Proefschrift
ter verkrijging van de graad van doctor aan de
Erasmus Universiteit Rotterdam
op gezag van de
rector magnificus
Prof.dr. H.G. Schmidt
en volgens besluit van het College voor Promoties.
De openbare verdediging zal plaatsvinden op
dinsdag 17 september 2013 om 13.30 uur
door
Filippus Hubertus Jansen
geboren te Gouda
Flip_Jansen.indd 5 30-7-2013 8:43:35

Promotiecommissie
Promotor:
Prof.dr.ir. G. Jenster
Overige leden:
Prof.dr. L.H.J. Looijenga
Dr. M.J. Roobol
Prof.dr. P.A.E. Sillevis Smitt
Flip_Jansen.indd 6 30-7-2013 8:43:35
COntents 7
contents1 General introduction and scope of the thesis 10
2 exosomal secretion of cytoplasmic prostate cancer xenograft-derived proteins 30
3 profiling of antibody production against xenograft-released proteins by protein microarrays discovers prostate cancer markers 66
4 prostate-specific antigen isoform p2psa in combination with total psa and free psa improves diagnostic accuracy in prostate cancer detection 100
5 clinical impact of new prostate-specific antigen WHo standardisation on biopsy rates and cancer detection 114
6 General discussion 128
epilogue 139summary 141samenvatting 145curriculum vitae 149Dankwoord 155abbreviations 157references 159phD portfolio 179about the author 181
Flip_Jansen.indd 7 30-7-2013 8:43:35

Flip_Jansen.indd 8 30-7-2013 8:43:35

chap
ter
1
chapter 1
Flip_Jansen.indd 9 30-7-2013 8:43:36
chapter 1
General introDuction anD scope of tHe tHesis
partly derived from: screening for prostate cancer in 2008 ii: the importance of molecular subforms of prostate-specific antigen and tissue kallikreins. european urology. 2009 march;55(3):563-74*
flip H. Jansen1
monique J. roobol1
Guido Jenster1
fritz H. schröder1
chris H. bangma1
1 Department of Urology, erasmus MC, Rotterdam, the netherlands
* Adapted with permission from european Urology
Flip_Jansen.indd 10 30-7-2013 8:43:36
ChApteR 1 11
1. the prostate
The prostate, derived from the Greek word προστάτης – prostates, meaning “the one
who stands before”, is a walnut-sized exocrine gland, part of the male genitourinary
tract. It produces and stores an alkaline fluid, which liquefies the semen and prolongs
the life-span of the spermatozoa. Anatomically, the prostate is located underneath
the bladder and in front of the rectum, surrounding the urethra. The prostate can be
divided into four distinct zones: the peripheral zone, the central zone, the transition
zone and the anterior fibromuscular zone. The majority of prostate cancers (PCa)
originate from the peripheral zone. The transition zone is responsible for the disease
of benign prostatic hyperplasia (BPH)1.
2. prostate-specific antigen
The epithelial cells of the prostate gland produce prostate-specific antigen (PSA), a
34kD glycoprotein. It is also known as kallikrein III (KLK3), seminin, semenogelase,
γ-seminoprotein or P-30 antigen. PSA is the protein in prostate fluid which is
responsible for the lysis of the gel proteins, resulting in the liquefaction of the semen2.
In 1971, PSA was discovered by a Japanese research group as a result from a forensic
search to identify specific proteins present in the ejaculate and was originally named
γ-seminoprotein3. Later, PSA was specifically linked to the prostate and prostatic
disease and was shown to be almost exclusively present in the epithelial cells of the
prostate4-6. PSA was first measured quantitatively in human serum by Papsidero and
Kuriyama et al. in 19807-9.
Normally, PSA is confined within the prostate and only a minute amount leaks
into the circulation. In men with PCa, PSA serum levels may be increased. Unlike
what might be expected, these elevated serum concentrations in PCa patients are
not the result of increased expression of PSA but of an increased release of PSA in
the bloodstream, most likely resulting from disruption of the prostate architecture
in PCa (Figure 1)10,11. As PSA is prostate-specific but not PCa-specific, increased
PSA serum levels may also result from prostatitis, irritation or BPH. The clinical
usefulness of PSA in PCa detection was first shown by Stamey et al. in 1987, who
carried out the initial clinical validation12,13.
Flip_Jansen.indd 11 30-7-2013 8:43:36
Discovery anD valiDation of prostate cancer biomarkers12
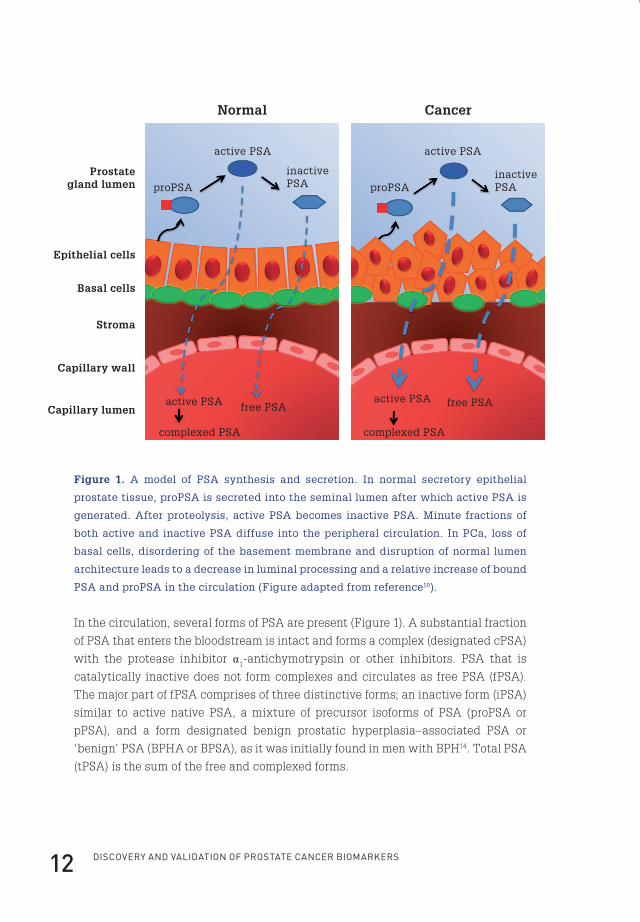
In the circulation, several forms of PSA are present (Figure 1). A substantial fraction
of PSA that enters the bloodstream is intact and forms a complex (designated cPSA)
with the protease inhibitor α1-antichymotrypsin or other inhibitors. PSA that is
catalytically inactive does not form complexes and circulates as free PSA (fPSA).
The major part of fPSA comprises of three distinctive forms; an inactive form (iPSA)
similar to active native PSA, a mixture of precursor isoforms of PSA (proPSA or
pPSA), and a form designated benign prostatic hyperplasia–associated PSA or
‘benign’ PSA (BPHA or BPSA), as it was initially found in men with BPH14. Total PSA
(tPSA) is the sum of the free and complexed forms.
Normal Cancer
active PSAactive PSA
Prostategland lumen
Epithelial cells
Basal cells
Stroma
Capillary wall
Capillary lumenactive PSAactive PSA
complexed PSAcomplexed PSA
free PSAfree PSA
proPSAproPSAinactivePSA
inactivePSA
Figure 1. A model of PSA synthesis and secretion. In normal secretory epithelial
prostate tissue, proPSA is secreted into the seminal lumen after which active PSA is
generated. After proteolysis, active PSA becomes inactive PSA. Minute fractions of
both active and inactive PSA diffuse into the peripheral circulation. In PCa, loss of
basal cells, disordering of the basement membrane and disruption of normal lumen
architecture leads to a decrease in luminal processing and a relative increase of bound
PSA and proPSA in the circulation (Figure adapted from reference10).
Flip_Jansen.indd 12 30-7-2013 8:43:37
ChApteR 1 13
3. characteristics, diagnosis and screening of prostate cancer
3.1 Characteristics of prostate cancerProstate cancer is mainly diagnosed within the elderly male population. As
mentioned, PCa mostly originates from the peripheral zone of the prostate. Therefore,
it may never cause any symptoms as most prostate tumours are slow-growing, and
meanwhile patients die of other causes. However, in a minority of men cancer cells
metastasize or progress locally, causing late symptoms such as pain or micturition
complaints.
PCa constitutes a major health issue worldwide and is considered as one of the most
common causes of cancer-related deaths. The American Cancer Society estimated
that in 2013, 238,590 men will be diagnosed with PCa and 29,720 men will die of PCa
within the United States15. Extrapolated, this means that one out of every six men
will be diagnosed with PCa during his lifetime, and one out of every 36 men will die
of it. This is in accordance with results from autopsy studies, showing microscopic
PCa lesions in 50% of men in their sixth decade, increasing to more than 75% in men
older than 85 years16,17.
Not surprisingly, this poses an enormous burden on total healthcare costs. In 2010,
medical costs associated with PCa in the United States alone estimated $12 billion,
expected to increase to $16 billion in 202018. In the Netherlands, 168 million euro’s
were spend on PCa care in 2007, about 0.23% of the total national healthcare budget19.
For several decades now there has been an extensive search for biomarkers for PCa,
in order to detect PCa at an early stage in which curative treatment is still possible.
In addition, it is important to distinguish aggressive from indolent disease, hereby
limiting overtreatment of PCa.
3.2 The diagnosis of prostate cancerBefore the discovery of PSA, a digital rectal examination (DRE) was the only pre-
diagnostic tool to detect PCa. However, often the disease had progressed at time
of diagnosis, limiting curative treatment. Originally, tPSA resembled the ideal
biomarker for PCa detection. After its introduction and thereafter widespread use
in the late 1980s, a dramatic change in the epidemiology of PCa was observed20. An
enormous increase in the number of newly diagnosed PCa cases was seen, peaking
in 1992 and declining thereafter, however not falling back to the level of the pre-PSA
era (Figure 2)21,22. In addition, it has been suggested that increased PCa awareness
as well as improved diagnostic means have also contributed to the increase in PCa
incidence during the early 1990s23.
Flip_Jansen.indd 13 30-7-2013 8:43:37

Discovery anD valiDation of prostate cancer biomarkers14
0
50
100
150
200
250
1970 1975 1980 1985 1990 1995 2000 2005 2010
Rat
e p
er 1
00,0
0
Year of diagnosis
Figure 2. Age-adjusted incidence of PCa (rate per 100,000) by year of diagnosis (all
ages) for all races. Data adapted from Surveillance, Epidemiology, and End Results
(SEER) Program (www.seer.cancer.gov).
Next to the increased number of detected PCa cases, the widespread use of PSA
led to a stage shift, i.e. more cancers were detected at an earlier stage. This is
illustrated by the fact that PCa diagnosed by PSA testing has a 70-80% change of
being organ-confined, in contrast to only 20-30% before the introduction of PSA24,25.
Initially, tPSA levels below 4.0 ng/ml were considered more or less as ‘normal’, or
associated with negligible risk of PCa. However, by evaluating prostate biopsies
in men with tPSA values below 4.0 ng/ml it became clear that the risk of PCa is
certainly not negligible in this patient category26. For example, the risk of being
diagnosed with PCa at a tPSA level below 2.0 ng/ml is still 17%, including cases of
high-grade PCa. By subsequently lowering the threshold limit for prostate biopsies,
tPSA theoretically has the capacity to detect the great majority of prostate cancers,
though at the cost of greatly increasing the number of false positive outcomes.
This, in turn, would lead to an enormous increase in unnecessary biopsies with
all the accompanying morbidity. So, tPSA should be regarded as a continuous
variable providing a spectrum of PCa risk, rather than focusing on a fixed threshold
level, which is set to acquire prostate biopsies or to withdraw from taking action.
Flip_Jansen.indd 14 30-7-2013 8:43:37

ChApteR 1 15
In addition, personal risk factors can be added to this spectrum, such as age,
ethnicity, family history of PCa, the presence of urinary symptoms and DRE results.
Several PCa risk calculators have been developed combining tPSA results and these
personal factors, leading indeed to a more accurate calculation of the probability
of positive prostate biopsies than by utilizing tPSA alone27,28. Other strategies to
enhance the diagnostic performance of tPSA include the use of age-specific tPSA
cut-offs, tPSA density (tPSA/prostate volume) and tPSA velocity (tPSA over time),
showing inconsistent results in increasing the diagnostic accuracy of tPSA29.
3.3 Prostate cancer screeningToday, many controversies about tPSA-based PCa screening exist. As it is known
that most men die with PCa rather than from PCa, tPSA based screening leads
to an overwhelming overdiagnosis, often resulting in overtreatment of low-risk
PCa patients30,31. Several large studies have been performed or are still ongoing
to answer the question whether or not screening for PCa actually saves lives and
at what costs32-34. The rationale for this screening is that by regularly measuring
tPSA levels in combination with performing a DRE, PCa might be identified in an
early stage in which definitive cure is still possible. However, as PCa is generally
a low-grade and slow-growing disease, it takes more than a decade to draw any
conclusions whether or not men could actually benefit from this form of screening.
The often low-grade and slow-growing nature of PCa also hampers large scale
prospective testing and validation of novel promising biomarkers. A recent report
of the Prostate, Lung, Colorectal and Ovary (PLCO) screening trial, involving more
than 76,000 men between 55 and 74 years, concluded that PCa screening did not
result in a decrease in mortality32. After thirteen years of follow-up, the cumulative
mortality rates from PCa in the screening and control arms were 3.7 and 3.4 deaths
per 10,000 person-years, respectively, resulting in a statistically non-significant
difference. However, the failure to reach statistical significance might be caused by
opportunistic screening in the control arm of this study. In addition, a substantial
number of men were pre-screened before randomisation and inclusion. Therefore,
it is questionable if this study has sufficient power to demonstrate an effect of
screening on PCa mortality35. The results of the PLCO screening study are in contrast
with the European Randomized Study of Screening for Prostate Cancer (ERSPC).
This study involves more than 182,000 men aged 50 to 74 years. After a median
follow-up of 11 years the relative reduction in risk of death from PCa in the screening
group was 29%. The absolute reduction in mortality in the screening group was
0.10 deaths per 1,000 person-years. To prevent one death from PCa at 11 years of
follow-up, 1,055 men would need to be screened and 37 cancers would need to be
detected34. In contrast to the PLCO study, the number of men pre-screened before
Flip_Jansen.indd 15 30-7-2013 8:43:37
Discovery anD valiDation of prostate cancer biomarkers16
randomisation was estimated to be low and contamination in the control arm was at
most 15%, making this study adequately powered to draw conclusions on the effect
of screening on PCa mortality. However, based on the conflicting results of these
and other screening programs in addition to the large number of men needed to treat
for each avoided death, most international and national screening guidelines still
recommend against population-based or opportunistic screening for PCa.
Surprisingly, there have not been many studies evaluating the economic
consequences of PCa screening. Also from an economic perspective, PCa screening
is debatable. Using data from the ERSPC, researchers estimated that $5.2 million
would have to be spent on screening to prevent one death from PCa36. Extrapolated,
this would be $262,758 per life-year saved. However, a recent ERSPC report showed
that the number of cancers needed to detect to prevent one death from PCa is
decreasing after further follow-up time. So, most likely the costs associated with
screening will be lower than the initial estimates, however further studies regarding
cost-effectiveness of PCa screening are needed37.
In conclusion, novel biomarkers are eagerly awaited, as these might help in the
more selective identification of men with aggressive forms of PCa, thereby limiting
overdiagnosis and overtreatment, and thus limiting overall healthcare costs.
4. biomarkers for prostate cancer
According to the National Institute of Health, a biomarker is defined as a
characteristic that is objectively measured and evaluated as an indicator of
normal biologic processes, pathogenic processes, or pharmacologic responses to a
therapeutic intervention38. Specifically related to PCa, these biomarkers could serve
four different purposes39:
1. Risk: these markers are used to identify men with an increased risk of developing
PCa during their lifetime.
2. Diagnostic and screening: these biomarkers can replace classical
histopathological characteristics in assessing the presence or absence of PCa
and can be preferably implemented in large-scale screening programs to detect
PCa at an early stage.
3. Prognostic, predictive and monitoring: these biomarkers are used to predict the
outcome of patients diagnosed with PCa, predict the outcome of therapy, and
monitor treatment.
4. Surrogate endpoint: these biomarkers are a substitute for a clinical endpoint.
Flip_Jansen.indd 16 30-7-2013 8:43:37
ChApteR 1 17
Ideally, a single biomarker would be able to define all characteristics as described
above. However, it would be more realistic to suppose that a panel consisting of
several biomarkers would be needed to reach such a goal.
4.1 Biomarkers of risk assessment for prostate cancerIt is known that some men have a familial predisposition for developing PCa40. Also,
it has been shown that African American men have higher PCa incidences and
mortality rates compared to European American men, followed by Asian American
men and Hispanic men41,42. This might be based on certain gene polymorphisms,
but might also be due to environmental or behavioural factors. Having a first-
degree relative with PCa increases the risk of developing PCa by approximately
two- to three-fold43. This risk is further increased by early age at onset and multiple
relatives with PCa44,45. In total, it has been estimated that 5-10% of PCa cases are
accounted for by genetic susceptibility46. Since the last decades, genetic research
has been conducted to identify the polymorphisms and genes responsible for
this PCa susceptibility. Genome wide association studies (GWAS) have revealed
more than forty germline variants of various genes or chromosomal loci that are
significantly associated with PCa susceptibility47,48. However, for only a few of these
their biological significance and function has been elucidated. In the future, larger
GWAS analyses in diverse ethnic groups might provide further genetic insights.
These could then be translated into risk estimation and the development of a reliable
biomarker for identifying PCa susceptible men.
4.2 Diagnostic and screening biomarkers for prostate cancerThe perfect biomarker (or as mentioned before more likely a panel of biomarkers)
would be able to state the diagnosis of PCa at near 100% sensitivity and specificity.
Preferably, this marker would also state prognostic information or specifically
detect aggressive forms of PCa that need to be treated. If such a biomarker would
be available, all PCa cases could be detected with negligible false positive or false
negative outcomes. As already extensively described above, the most widely used
biomarker to detect PCa is PSA. In addition, PSA forms also the basis of all screening
programs to detect PCa population-wide. During the last decades, several isoforms
of PSA have been discovered, which have been evaluated in the detection of PCa.
4.2.1 Isoforms of prostate-specific antigenPSA is produced as a prepro-protein, containing 261 amino acids. After removal of
the 17-amino acid leader sequence, an inactive 244-amino acid precursor protein
termed proPSA (or pPSA) results (Figure 3)49.
Flip_Jansen.indd 17 30-7-2013 8:43:37

Discovery anD valiDation of prostate cancer biomarkers18
-22 -7 1 237preproPSA
leader sequence
co-translational cleaving
(-7)proPSA
cleavage by hK2
active PSA
propeptide
-1/-2/-4/-5
truncated proPSA forms
internal cleavages
BPHA145-146 182-183
Figure 3. PSA is initially produced as a 261 amino acid prepro-protein. After
cotranslational removal of the amino-terminal leader sequence, the non-catalytic
zymogen (-7)pPSA results. After cleavage by hK2, the 7 amino acid propeptide is
removed and catalytically active mature PSA (237 amino acids) is formed. Alternatively,
truncated forms of pPSA are formed due to cleavage within the propeptide. As a result
of internal cleavages within active PSA between residues 145-146 and 182-183 the
inactive BPHA can be produced (Figure adapted from reference10).
After cleavage by human kallikrein 2 (hK2) it is converted to mature, active PSA
(237 amino acids)50,51. Originally, pPSA was defined as the only precursor form of
PSA, consisting of 244 amino acids including a 7 amino-acid pro-peptide leader
and was therefore named (-7)proPSA. However, later reports presented several
other truncated forms of pPSA, such as (-1), (-2), (-4), and (-5)pPSA, containing 1,
2, 4, or 5 amino acids in the pro-peptide leader, instead of the native 7 amino acids
(Figure 3)52,53.
pPSA was shown to be differentially elevated in peripheral zone cancer and
undetectable in most specimens of the transition zone, leading to the assumption
that pPSA represented a more cancer-specific form of PSA54. Initial attempts
to confirm the presence of pPSA in serum were unsuccessful, but later others
unequivocally confirmed the presence of several pPSA forms in serum of PCa
patients52,53,55,56. The molecular basis for the increased serum levels of truncated
pPSA forms in PCa patients is unknown, but most likely reflects decreased cleavage
Flip_Jansen.indd 18 30-7-2013 8:43:38
ChApteR 1 19
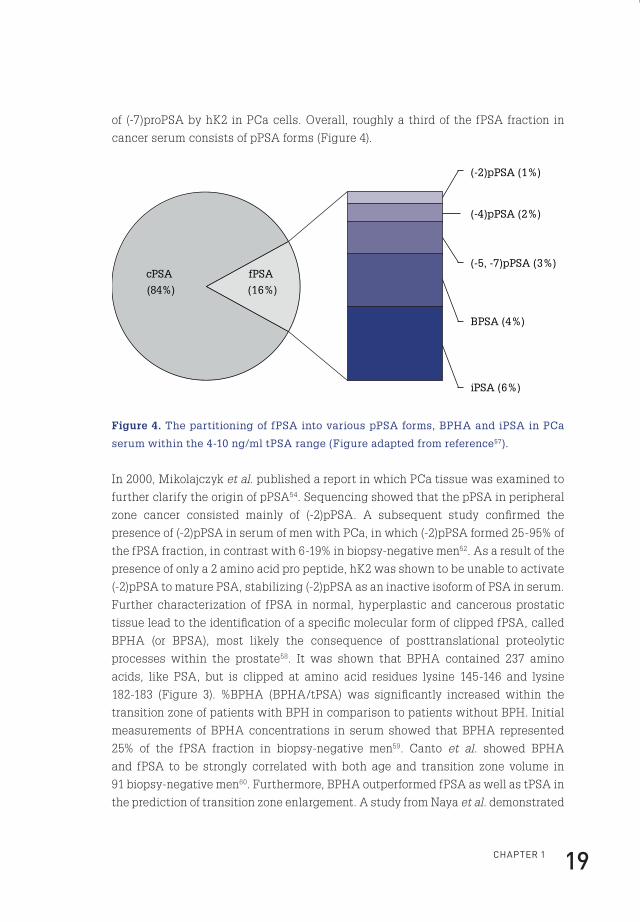
of (-7)proPSA by hK2 in PCa cells. Overall, roughly a third of the fPSA fraction in
cancer serum consists of pPSA forms (Figure 4).
cPSA
(84%)
(-2)pPSA (1%)
(-4)pPSA (2%)
(-5, -7)pPSA (3%)
BPSA (4%)
iPSA (6%)
fPSA
(16%)
Figure 4. The partitioning of fPSA into various pPSA forms, BPHA and iPSA in PCa
serum within the 4-10 ng/ml tPSA range (Figure adapted from reference57).
In 2000, Mikolajczyk et al. published a report in which PCa tissue was examined to
further clarify the origin of pPSA54. Sequencing showed that the pPSA in peripheral
zone cancer consisted mainly of (-2)pPSA. A subsequent study confirmed the
presence of (-2)pPSA in serum of men with PCa, in which (-2)pPSA formed 25-95% of
the fPSA fraction, in contrast with 6-19% in biopsy-negative men52. As a result of the
presence of only a 2 amino acid pro peptide, hK2 was shown to be unable to activate
(-2)pPSA to mature PSA, stabilizing (-2)pPSA as an inactive isoform of PSA in serum.
Further characterization of fPSA in normal, hyperplastic and cancerous prostatic
tissue lead to the identification of a specific molecular form of clipped fPSA, called
BPHA (or BPSA), most likely the consequence of posttranslational proteolytic
processes within the prostate58. It was shown that BPHA contained 237 amino
acids, like PSA, but is clipped at amino acid residues lysine 145-146 and lysine
182-183 (Figure 3). %BPHA (BPHA/tPSA) was significantly increased within the
transition zone of patients with BPH in comparison to patients without BPH. Initial
measurements of BPHA concentrations in serum showed that BPHA represented
25% of the fPSA fraction in biopsy-negative men59. Canto et al. showed BPHA
and fPSA to be strongly correlated with both age and transition zone volume in
91 biopsy-negative men60. Furthermore, BPHA outperformed fPSA as well as tPSA in
the prediction of transition zone enlargement. A study from Naya et al. demonstrated
Flip_Jansen.indd 19 30-7-2013 8:43:38
Discovery anD valiDation of prostate cancer biomarkers20
that BPHA, %BPHA and %fPSA (fPSA/tPSA) performed similarly in the prediction of
prostate volume (PV).
In addition to tPSA, the specific value of PSA isoforms in the detection of PCa has
been evaluated. Catalona et al. measured (-2)pPSA values in a cohort of 1091 serum
samples of men with and without PCa within the tPSA ranges of 2-4 ng/ml and
4-10 ng/ml61. This two-center study showed that (-2)pPSA levels were higher in PCa
patients compared to non-PCa patients, but only in one of the two centres statistical
significance was reached within the 2-4 ng/ml tPSA range. The predictive power
of %(-2)pPSA (=(-2)pPSA/fPSA) was smaller compared to %pPSA. Mikolajczyk et al. later confirmed these results for the 4-10 ng/ml tPSA range in 380 serum samples62.
However, as Naya et al. found no significant difference in (-2)pPSA or %(-2)pPSA
levels in men with and without PCa, it remains unclear whether PSA isoforms do
possess any additional value in the detection of PCa63,64. For BPHA, it was shown
that BPHA could not predict the presence of PCa and was not related to tumour
volume63.
4.2.2 Prostate cancer antigen 3 and the TMPRSS2:ERG fusion geneNext to tPSA, the other commercially available and FDA (US Food and Drug
Administration) approved test for the detection of PCa is the differential display
clone 3 (DD3) or PCA3 assay (Progensa® PCA3 , Gen-Probe, San Diego, California)65.
Following a digital rectal examination, PCA3 mRNA can be quantified in urine
specimens together with PSA mRNA to generate a so-called PCA3 score. One of
the aims of the PCA3 test was to decrease the number of unnecessary prostate
biopsies. Several studies have indeed shown a slight increase in diagnostic accuracy
over tPSA, although the sensitivity of PCA3 is limited in the tPSA zone of 2-10 ng/
ml38,66-68. Recently, PCA3 has also been assessed in a screening protocol for PCa.
It was shown that PCA3 missed fewer cancers compared to tPSA (32 vs. 65%), but
it should be mentioned that this was a tPSA-pre-screened cohort, so results in an
unscreened population should be awaited. Alike the tPSA assay, the PCA3 score is
also a continuous variable69. According to the summary of safety and effectiveness
data as published by the FDA, a PCA3 score <25 is associated with a decreased
likelihood of a positive prostate biopsy.
Another promising urinary based assay (which is not yet commercially available),
is the TMPRSS2:ERG gene fusion test. The TMPRSS2:ERG gene fusion is a PCa-
specific genomic rearrangement consisting of a fusion between the strong androgen-
regulated TMPRSS2 gene and the proto-oncogene ERG, a member of the ETS
transcription factor family. This results in an androgen-regulated TMPRSS2:ERG
fusion gene and is found in approximately 50% of all prostate tumours70.
Flip_Jansen.indd 20 30-7-2013 8:43:38
ChApteR 1 21
In 108 PCa patients, urinary sediments were analysed for the presence of fusion
transcripts. This resulted in a very high specificity of 93%, in contrast to a limited
sensitivity of 37%71. A combination of the PCA3 test with the TMPRSS2:ERG assay
has shown to further increase diagnostic accuracy. A study performed in 105
men showed that PCA3 alone had an AUC (area under the curve) of 0.65, while
the combination of PCA3 and TMPRSS2:ERG increased the AUC to 0.77. This was
further increased to 0.80 by adding tPSA to this multivariate model72.
So, although the addition of PSA isoforms, PCA3 and TMPRSS2:ERG to the tPSA
test seems promising, it is clear that more specific markers to identify men with PCa
would be of tremendous value.
4.3 Prognostic, predictive and monitoring biomarkers for prostate cancer
4.3.1 Prognostic biomarkers for prostate cancerNext to diagnosing PCa, an ideal biomarker would also state prognostic information. In
this way, indolent disease, for which treatment could be deferred, can be differentiated
from aggressive cases of PCa. In addition to the controversies surrounding tPSA in
PCa diagnosis, there is an ongoing debate on the role of tPSA as a prognostic factor. It
has been shown that higher preoperative tPSA values are associated with increased
odds of extracapsular extension, positive surgical margins, seminal vesicle invasion
and increased risk of biochemical progression73. However, when restricted to
tumours identified by needle biopsy because of an elevated tPSA level (<10 ng/ml),
pretreatment tPSA levels were only marginally related to biochemical progression.
Another study showed that tPSA is an independent predictor of several pathologic
stages and may improve the accuracy of multivariate models predicting pathologic
stage74. Currently, the best predictor for survival at the time of PCa diagnosis is the
pathologic grade of the tumour tissue (Gleason score) within the prostate biopsies.
A Gleason score (GS) is given based upon the microscopic appearance of the tumour
tissue (Figure 5). A first grade is assigned to the most common tumour pattern,
and a second grade to the next most common tumour pattern. These two grades
together form the GS, which ranges from 2 to 10 (Figure 5). The scoring system is
named after Donald Gleason, a pathologist who developed the scoring system in
the 1970s75. Tumours with a higher GS behave more aggressive and are significantly
associated with a worse prognosis76. A drawback of the GS grading system is that
it is partly subjective, showing significant observer variability77. In addition, due to
the stage and grade shift of presently detected prostate cancers caused by tPSA
screening, the prognostic power of the Gleason scoring system has diminished, as
nowadays most patients present with a GS of 6, 7 or 878-80.
Flip_Jansen.indd 21 30-7-2013 8:43:38

Discovery anD valiDation of prostate cancer biomarkers22
Small, uniform glands
More space between glands
In�ltration of cells from glandsat margins
Irregular masses of cells with few glands
Lack of glands,sheets of cells
Figure 5. Dr. Gleason’s drawing of the five Gleason grades75.
In the last decades, many alternative prognostic markers for PCa have been proposed,
on protein as well as on RNA and genomic level. Examples of alternative markers
on protein level are numerous, including various PSA-isoforms. A study by Catalona
et al. specifically analysed pPSA forms in relationship to PCa aggressiveness81. It
was shown that (-2)pPSA could not discriminate between cancers confined to the
prostate and cancers with extracapsular extension and did not perform significantly
better than %pPSA and %fPSA in the detection of cancers with a GS >7. These
results were later confirmed by de Vries et al. in a smaller study82. A recent report by
de Vries et al. describing 61 men diagnosed with PCa showed that also BPHA failed
to discriminate between favourable and poor prognostic PCa82.
Also the possible role of PCA3 in PCa prognosis has been evaluated, resulting in
conflicting outcomes. While some studies found a relationship between PCA3 and
small volume tumours and insignificant PCa, others failed to find such a correlation83.
Furthermore, PCA3 is not significantly associated with locally advanced disease
Flip_Jansen.indd 22 30-7-2013 8:43:39
ChApteR 1 23
and it has limited value in the identification of aggressive tumours83. With regard
to the TMPRSS2:ERG gene fusion, no significant relationship was found between
the presence of the fusion transcripts and Gleason scores in prostate biopsies38,71,84.
In addition, data on the association of TMPRSS2:ERG and patient outcome are
conflicting85. Other markers that have been evaluated are PSCA (prostate stem
cell antigen), hK2 (human kallikrein 2), EPCA (early prostate cancer antigen) and
AMACR (alpha-methylacyl CoA racemase), but none of these has entered into
routine clinical practice yet86-90. Currently, the best and independent pretreatment
prognostic marker is the pathologic grade of the tumour tissue within the prostate
biopsies, so prognostic blood or urine based biomarkers are urgently awaited76.
4.3.2 Monitoring and predictive biomarkers for prostate cancerRegarding the monitoring of men treated for PCa with curative intent, either by
radiation therapy (RT) or radical prostatectomy (RP), the use of tPSA has been
extensively studied. After a successful RP, all prostatic tissue is removed and
tPSA levels should become undetectable. Hence, detectable serum tPSA levels are
indicative of residual prostatic tissue, which presumably represents locoregional
or systemic cancer91. The American Urological Association (AUA) has defined a
biochemical recurrence as a serum tPSA level ≥0.2 ng/ml, confirmed by a second
determination, after initial undetectable tPSA levels following RP92. The kinetics
of tPSA increment after RP are indicative of the location of tumour recurrence. If
tPSA never falls to undetectable levels or is rising rapidly after RP, systemic disease
is more likely than residual disease93,94. In contrast, if tPSA levels rise slowly after
having been undetectable for a longer period of time, isolated local recurrence in
the prostatic bed is more likely93,95. In this way, tPSA can be used to guide adjuvant
therapy after RP.
After external RT, brachytherapy (internal RT) or cryotherapy (freezing of prostate
tissue) tPSA may still be detectable, as the prostate gland is not removed. This
makes it more difficult to define biochemical recurrence compared to RP. The decline
in tPSA after RT is gradual and the mean time for tPSA to reach its nadir (the lowest
level to which tPSA drops) is 18 months or longer96. This nadir is a strong indicator
of treatment success, however, the rate of decline does not correlate to the risk of
PCa relapse96-99. According to the latest definition, a tPSA level higher than 2 ng/
ml above the nadir is considered as a biochemical failure after RT100. A complicated
issue is the phenomenon of a tPSA bounce after RT, typically occurring after 12 to
18 months101. This can occur in the absence of disease and does not necessarily
signify treatment failure. Up to date, there are no definitive methods or markers to
distinguish a tPSA bounce from cancer recurrence. So, novel markers distinguishing
the latter two conditions could have additional value in guiding patient therapy.
Flip_Jansen.indd 23 30-7-2013 8:43:39

Discovery anD valiDation of prostate cancer biomarkers24
4.4 Surrogate endpoint biomarkers for prostate cancerAs PCa is usually a low aggressive and slow-growing disease, trials and studies
involving PCa are often of extensive duration. Therefore true endpoints, such as
mortality from PCa, are often replaced by surrogate endpoints such as tPSA. An
extensive review on tPSA as a surrogate endpoint marker for PCa concluded that
tPSA is not a suitable replacement for survival, especially when second or third line
treatments become more efficacious102. This is further illustrated by the fact that
prognostic studies have shown that in hormone independent disease only 17% of
survival is explained by time-dependent tPSA measurements, showing sufficient
variation in survival unaccounted for by tPSA measurements103. Therefore, also from
the viewpoint of surrogate endpoints, novel markers are currently awaited.
5. challenges in biomarker research
5.1 Biomarker research phasesThe search for novel biomarkers for PCa can be divided into three distinctive phases.
First, there is a discovery phase, resulting in the identification of a number of
promising candidate markers. Then, during the verification phase, the list of potential
candidates is narrowed, allowing only the most promising candidates to enter the
validation phase, which should ultimately lead to the clinical implementation of a
novel biomarker. All these three phases have their own difficulties and challenges.
5.2 Selection of biological specimenWhen searching for a novel biomarker, the first question that should be addressed is
which body fluid should be utilized. Preferably, this body fluid should be accessible
in a non or minimally invasive way. So, the two body fluids that would be most
appropriate are urine or blood. The drawback of utilizing the first one is that there
are currently no biobanks available containing large numbers of urine samples
with long-term follow-up, so large scale validation of novel markers is seriously
hampered. Due to the slow-growing and low-grade characteristics of the majority of
PCa cases, it would take up to a decade to draw any conclusions from a prospective
urine-based study, especially from a prognostic point of view. So, at least for now,
this favours blood (serum or plasma) as the more suitable of the two. In addition, as
physicians are so familiar to PSA-based decision making, it is highly unlikely that a
novel biomarker will replace PSA, meaning blood will we be drawn anyway.
Flip_Jansen.indd 24 30-7-2013 8:43:39
ChApteR 1 25
5.3 Selection of cellular materialThe second question that should be addressed is which cellular material should be
explored to look for novel markers. In short, this could be on metabolite, protein,
RNA or DNA level. As proteins produced by cancer cells (or their microenvironment)
may eventually enter the circulation, these could be directly assessed in the serum
or plasma of men suspected of having PCa. This is the case for most successful
tumour markers applied in the clinic today, such as alpha fetoprotein (AFP), beta
human chorionic gonadotropin (β-hCG), cancer antigen 125 (CA125), and of course
PSA.
Another advantage of a protein biomarker would be that standard detection
techniques could be utilized, such as enzyme-linked immunosorbent assays
(ELISA), facilitating incorporation into current clinical laboratory practice.
Next to protein markers, novel biomarkers could also be found on RNA and DNA
levels, as genetic and epigenetic alterations are common events in PCa. In contrast
to protein markers, these are usually detected in tissue samples, requiring invasive
methods to obtain the tissue itself. Another option is the detection of RNA and DNA
directly in serum or in circulating tumour cells, but this requires more elaborate
techniques, currently not standard in clinical laboratory practice. However, recent
publications have shown that RNA profiling of whole blood samples is a feasible
technique which might yield prognostic information in PCa104,105.
5.4 Mass spectrometry for biomarker identificationOne approach to discover novel biomarkers is by utilizing comparative mass
spectrometry (MS), analysing human serum samples in search of tumour-specific
proteins shed into the circulation by tumour cells. MS is an analytical chemistry
technique based on the determination of the mass of an analyte ion. This analyte
can be fragmented inside the mass spectrometer to give charged product ions. The
masses of the fragment ions can then be determined in a second stage of MS, giving
rise to the term MS/MS or tandem mass spectrometry. Improved specificity can be
obtained by monitoring a precursor ion and one of its collision-induced dissociation-
generated product ions, a technique known as multiple reaction monitoring (MRM).
This technique also reduces the possibility of a false-positive identification and
inaccurate quantitation. As well, MRM analysis can be multiplexed, allowing the
quantitation of hundreds or even thousands of target molecules in a single analysis.
In addition, a recent multi-laboratory analysis showed that MRM results are
reproducible between different laboratories106.
To identify specific proteins, a bottom-up approach can be used in which a proteolytic
enzyme, typically trypsin, is used to degrade proteins into smaller peptides.
Subsequently, these peptides can be introduced into the mass spectrometer and
Flip_Jansen.indd 25 30-7-2013 8:43:39
Discovery anD valiDation of prostate cancer biomarkers26
identified. The identified masses can be used as input for a database search of
predicted masses that would arise from digestion of a list of known proteins. If a
protein sequence in the reference list gives rise to a significant number of predicted
masses, there is evidence that this protein is present in the original sample.
However, serum is a highly complex fluid with a high variability between human
serum samples. It has a vast dynamic range in protein concentrations (>1010)
and dominance of a small number of high abundant proteins, such as albumin
and immunoglobulins, which constitute more than 99% of the entire protein
content, masking the presence of low abundant proteins, including possible novel
biomarkers107.
To rule out these variables, hundreds to thousands of samples have to be analysed in
order to identify discriminating proteins. In addition, current technologies, capable
of analyzing protein concentrations spanning four orders of magnitude, would be
missing the lower abundant proteins (such as PSA) which are likely to constitute the
next generation of biomarkers.
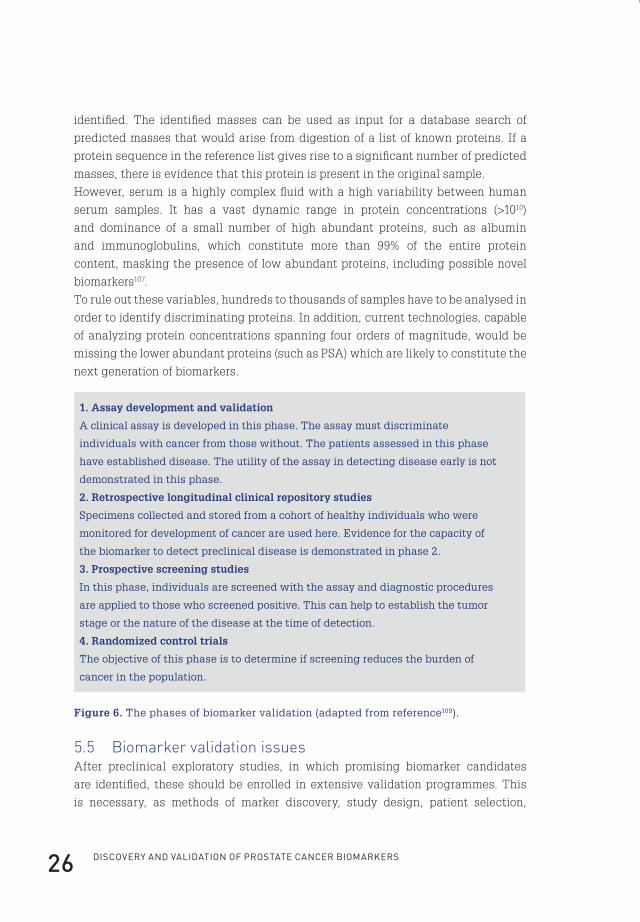
1. Assay development and validation
A clinical assay is developed in this phase. The assay must discriminate
individuals with cancer from those without. The patients assessed in this phase
have established disease. The utility of the assay in detecting disease early is not
demonstrated in this phase.
2. Retrospective longitudinal clinical repository studies
Specimens collected and stored from a cohort of healthy individuals who were
monitored for development of cancer are used here. Evidence for the capacity of
the biomarker to detect preclinical disease is demonstrated in phase 2.
3. Prospective screening studies
In this phase, individuals are screened with the assay and diagnostic procedures
are applied to those who screened positive. This can help to establish the tumor
stage or the nature of the disease at the time of detection.
4. Randomized control trials
The objective of this phase is to determine if screening reduces the burden of
cancer in the population.
Figure 6. The phases of biomarker validation (adapted from reference109).
5.5 Biomarker validation issuesAfter preclinical exploratory studies, in which promising biomarker candidates
are identified, these should be enrolled in extensive validation programmes. This
is necessary, as methods of marker discovery, study design, patient selection,
Flip_Jansen.indd 26 30-7-2013 8:43:39
ChApteR 1 27
interpatient heterogeneity and intratumour heterogeneity are all confounding
factors, especially in the case of PCa. Other important confounding factors are the
danger of bias, the risk of overfitting of data and issues related to the handling
and storage of clinical specimens108. Several phases can be identified in the process
of biomarker validation, as depicted in Figure 6109. Ideally, all phases should be
successfully completed before a biomarker enters clinical practice.
5.6 Biomarker standardisation issuesAnother issue related to the validation of a biomarker is its standardisation or
calibration. Preferably, before a biomarker enters clinical practice, identical
calibration protocols and standards should be used, resulting in identical diagnostic
performances amongst different assay platforms. Unfortunately, this is only partly
the case for tPSA.
The number of ordered tPSA tests has increased dramatically during the last decade.
In the Netherlands, almost 28% of men older than 65 years had their tPSA tested
in 2001, increasing to over 45% in 2011110. As these tPSA tests are performed on
various assay platforms, standardisation is of utmost importance to improve clinical
interchangeability and to compare long-term results. Today, more than 30 different
types of tPSA assay reagent sets are available111. In the past, several publications
have shown that this wide variety of tPSA assays leads to significantly different
values for tPSA. Possible causes of this lack of interchangeability are differences in
assay design, differential epitope recognition, cross-reactivity to tPSA homologous
antigens and the lack of equimolarity5,112-115.
As most clinicians are unaware of their local assay used to measure tPSA levels,
misinterpretation of tPSA values will occur, for example influencing the decision
to recommend that a patient undergoes a prostate biopsy for PCa detection113. To
improve the interchangeability of tPSA assays, the First International Standard for
tPSA was introduced in 1992 and later adopted by the World Health Organization
(WHO)116,117. This indeed decreased differences between the various tPSA assays118-120.
However, for certain tPSA assays, this restandardisation caused a shift in mass
units, resulting in a potential under or over-recovery of tPSA values. Consequently,
if this shift is not fully appreciated around the threshold for prostate biopsies, a
change in PCa detection rates may result with possible life-altering consequences
for individual patients.
Flip_Jansen.indd 27 30-7-2013 8:43:39
DisCOveRy AnD vAliDAtiOn Of pROstAte CAnCeR biOMARkeRs28
6. scope of the thesis
This thesis focuses on the full spectrum of PCa biomarkers, ranging from the
discovery and (pre-) validation of novel markers, to assessing the clinical value of
recently discovered PSA isoforms and the implications of the introduction of a tPSA
calibration standard to decrease interassay variability.
In order to specifically detect proteins secreted into the circulation by PCa cells, we
developed a xenograft model system (Chapter 2). In this system, human prostate
cancer cell lines are transplanted onto athymic nude mice. We hypothesized
that after successful inoculation, PCa cells would shed proteins into the mouse
circulation, mimicking the situation in humans. Thus, a normal nude mouse would
only have mouse proteins in its circulation, while the serum of a nude mouse
bearing a human xenograft would also contain human proteins in addition to mouse
proteins. In order to identify these tumour-derived proteins, the serum of normal and
xenografted mice was analysed by mass spectrometry.
In Chapter 3, this xenograft model system was further exploited by utilizing the
mouse immune system. We hypothesized that by immunizing immune-competent
congenic mice with serum drawn from nude mice grafted with human prostate
cancers, an immune response would occur, generating immunoglobulins specifically
directed against PCa-derived proteins. Subsequently, protein microarrays were
utilized to profile the antibody production and indirectly identify PCa xenograft-
derived antigens.
In Chapter 4, we analysed the diagnostic and prognostic performances of the PSA
isoforms BPHA and p2PSA in a large multicenter study. We hypothesized that these
isoforms, as well as its derivative phi (Beckman Coulter Inc. name for the “prostate
health index,” a mathematical combination of PSA, fPSA and p2PSA, see www.
prostatehealthindex.org), would have significant additional value in PCa detection,
next to tPSA and fPSA. Secondly, we hypothesized that these PSA isoforms could
have additional value in discriminating aggressive from indolent disease and
thereby aid in PCa prognosis.
Another essential step in the establishment of a biomarker is its international
calibration or standardisation. In Chapter 5, we focused on the consequences of the
implementation of an international calibration standard for tPSA assays, specifically
for the Beckman Coulter tPSA assay. We hypothesized that the implementation
of this international calibration standard would lead to a significant shift in tPSA
results, thereby directly influencing PCa detection rates.
Flip_Jansen.indd 28 30-7-2013 8:43:39

cHapter 2
cHap
ter
2
Flip_Jansen.indd 29 30-7-2013 8:43:39

cHapter 2
exosomal secretion of cytoplasmic prostate cancer xenoGraft-DeriveD proteins
molecular and cellular proteomics. 2009 June;8(6):1192-205*
flip H. Jansen1
Jeroen krijgsveld2
angelique van rijswijk1
Gert-Jan van den bemd1
mirella s. van den berg1
Wytske m. van Weerden1
rob Willemsen3
lennard J. Dekker4
theo m. luider4
Guido Jenster1
1 Department of Urology, erasmus MC, Rotterdam;2 Department of biomolecular Mass spectrometry, Utrecht University;3 Department of Clinical Genetics, erasmus MC, Rotterdam;4 Department of neurology, erasmus MC, Rotterdam, the netherlands
* Reprinted with permission from Molecular and Cellular proteomics
Flip_Jansen.indd 30 30-7-2013 8:43:40
ChApteR 2 31
abstract
Novel markers for prostate cancer (PCa) are needed because current established
markers such as prostate-specific antigen lack diagnostic specificity and
prognostic value. Proteomics analysis of serum from mice grafted with human PCa
xenografts resulted in the identification of 44 tumour-derived proteins. Besides
secreted proteins we identified several cytoplasmic proteins, among which were
most subunits of the proteasome. Native gel electrophoresis and sandwich ELISA
showed that these subunits are present as proteasome complexes in the serum from
xenograft-bearing mice. We hypothesized that the presence of proteasome subunits
and other cytoplasmic proteins in serum of xenografted mice could be explained by
the secretion of small vesicles by cancer cells, so-called exosomes. Therefore, mass
spectrometry and Western blotting analyses of the protein content of exosomes
isolated from PCa cell lines was performed. This resulted in the identification of
mainly cytoplasmic proteins of which several had previously been identified in the
serum of xenografted mice, including proteasome subunits. The isolated exosomes
also contained RNA, including the gene fusion TMPRSS2:ERG product. These
observations suggest that although their function is not clearly defined cancer-
derived exosomes offer possibilities for the identification of novel biomarkers for PCa.
introduction
For several decades now, prostate-specific antigen (PSA) has been utilized as
the “gold standard” biomarker for the detection of prostate cancer (PCa)13. Its
introduction caused a dramatic decrease in the prevalence of advanced stages of
PCa20. However, ongoing efforts are being made to discover new biomarkers for PCa
because it became clear that PSA has limited diagnostic specificity and prognostic
value, leading to an enormous increase in unnecessary biopsies and overtreatment
of low risk PCa patients26. In the last decades, many alternative diagnostic or
prognostic markers for PCa have been proposed on protein as well as on RNA and
genomic levels. Examples of alternative markers on the protein level are numerous,
including various PSA isoforms, prostate stem cell antigen, human kallikrein 2,
early prostate cancer antigen, and α-methylacyl-CoA racemase86-90. On the RNA
level, the PCA3 test and especially the recently discovered fusion of TMPRSS2
with ETS transcription factors may hold promise for PCa detection and potentially
prognosis in the near future121,122. One of the drawbacks of the latter two as markers
for PCa is the fact that they are detected in urine, after a standardized prostatic
massage, instead of in serum or plasma. This will hamper retrospective validation
Flip_Jansen.indd 31 30-7-2013 8:43:40
Discovery anD valiDation of prostate cancer biomarkers32
as most historical biorepositories do not contain urine. Although several validation
studies of promising candidates have been performed in the past or are currently
underway, no single marker has yet outperformed PSA, justifying ongoing efforts
in searching for PCa biomarkers. One approach is the screening of large series of
serum samples from men with and without PCa. However, given the large sample
variability, the high complexity, and dynamic range of proteins in serum samples,
large numbers of human serum samples have to be analysed to achieve any
statistical significance. Also identified proteins may be related to secondary body
defence mechanisms rather than being directly derived from the tumour cells as are
most tumour markers applied in the clinic today. To circumvent these problems, we
have exploited the xenograft model system as a platform for the discovery of new
biomarkers for PCa123. As has recently been reported, this model system is indeed
capable of identifying human proteins that are shed into the circulation by human
prostate cancer cells124. In the present study we further exploited this approach and
performed an in-depth proteomics analysis of serum of mice carrying androgen-
sensitive (PC346) or androgen-independent prostate cancer xenografts (PC339).
Among the discovered human proteins were numerous cytoplasmic proteins, such
as glyceraldehyde-3-phosphate dehydrogenase (GAPDH), lactate dehydrogenases
A and B, and various subunits of the proteolytic proteasome complex124. Many of
these cytoplasmic proteins are also present in the human plasma proteome as
retrieved from the database of the Human Proteome Organisation Plasma Proteome
Project125. We hypothesized that the presence of cytoplasmic tumour-derived
proteins in the xenograft sera could be explained by the secretion of exosomes.
Exosomes are small membrane vesicles secreted by virtually every cell type,
including tumour cells126. Exosomes are formed in multivesicular bodies by inward
budding, thereby encapsulating cytoplasmic components126,127. The exact function
of exosomes in tumour cells has yet to be elucidated but is expected to relate to roles
in cell-to-cell contact, tumour-stroma interaction, protein degradation, and antigen
presentation126,127. In addition to containing proteins, it was recently discovered that
exosomes also contain functional RNA, proposed as “exosomal shuttle RNA”128.
To confirm our hypothesis that the cytoplasmic tumour-derived proteins in the
serum of xenograft-bearing mice were the result of exosomal secretion, we isolated
exosomes from the PC346C cell line and analysed their protein content. To further
explore the contents of exosomes we isolated and analysed exosomal RNA from
both the PC346C and VCaP cell lines.
Flip_Jansen.indd 32 30-7-2013 8:43:40
ChApteR 2 33
experimental procedures
Xenograft serum collectionHuman prostate cancer xenografts were grown on immune-incompetent mice
athymic male nude (nu/nu) BALB/c mice (n=9 for each xenograft; Taconic, Ry,
Denmark)123,124. We used the human prostate cancer cell lines PC346 (androgen-
sensitive) and PC339 (androgen-independent). Specific characteristics have
been described previously129. Prior control serum was collected by retro-orbital
punction. Tumour-bearing mice were sacrificed after 4–5 weeks, and blood was
collected. Samples were stored at -80 °C. The protocol was approved by the Animal
Experiments Committee under the national Experiments on Animals Act and
adhered to the rules laid down in this national law that serves the implementation
of “Guidelines on the protection of experimental animals” by the council of Europe
under Directive 86/609/EC.
Preparation of xenograft sera for mass spectrometryAfter filtration using a 0.22-μm spin filter, high abundance proteins were removed
utilizing Multi Affinity Removal Spin cartridges (Agilent Technologies, Wilmington,
DE) according to the manufacturer’s instructions. Depleted samples were
concentrated on 5-kDa-cutoff ultracentrifugation columns (Agilent Technologies).
Total protein concentration was determined by the Bradford method (Bio-Rad).
Precast 4–20% polyacrylamide linear gradient gels (Bio-Rad) were utilized to
separate 10 μg of protein of depleted mouse serum (pooled from nine individual
control mice, nine PC339 xenograft-bearing mice, or nine PC346 xenograft-bearing
mice) by SDS-PAGE (Mini-Protean III, Bio-Rad). Prestained high range molecular
weight markers (See- Blue, Invitrogen) were loaded on each gel. After running, gels
were stained by Coomassie Brilliant Blue (Merck). Gel lanes (range, 5–200 kDa)
were excised and divided into 3-mm sections. Gel slices were washed, destained
twice (50% (v/v) acetonitrile in 50 mM ammonium bicarbonate), dehydrated (100%
acetonitrile), and reduced with 6.5 mM DTT in 50 mM ammonium bicarbonate for
1 h at 37 °C. After alkylation with 54 mM iodoacetamide in 50 mM ammonium
bicarbonate, proteins were dehydrated in 100% acetonitrile and then rehydrated
with the digestion solution containing 10 ng/l ultra grade sequencing trypsin
(Promega, Madison, WI) for 30 min at room temperature. After addition of 30 µl of
50 mM ammonium bicarbonate solution, gel particles were incubated overnight at
37 °C. The peptides were extracted using 0.5% formic acid in 50% acetonitrile, dried
completely in a vacuum centrifuge, and stored at 80 °C until analysis.
Flip_Jansen.indd 33 30-7-2013 8:43:40
Discovery anD valiDation of prostate cancer biomarkers34
Liquid chromatography-mass spectrometry of xenograft seraNanoflow LC-tandem mass spectrometry was performed for samples by coupling
an Agilent 1100 HPLC system (Agilent Technologies), operated as described
previously124, to a 7-tesla LTQ-FT mass spectrometer (FT-ICR-MS, Thermo Electron,
Bremen, Germany). For protein identification, database searches were performed
using Mascot version 2.0 (Matrix Science, London, UK) allowing 5-ppm mass
deviation for the precursor ion, a 0.6-Da tolerance on the fragment ions, and trypsin
as the digestion enzyme. A maximum number of one missed cleavage was allowed,
and carbamidomethylated cysteine and oxidized methionine were set as fixed
and optional modifications, respectively. Only peptides with Mascot scores >30
were accepted. Scaffold (version 01_05_06, Proteome Software Inc., Portland, OR)
was used to validate MS/MS-based peptide and protein identifications. Peptide
identifications were accepted if they could be established at greater than 90.0%
probability as specified by the Peptide Prophet algorithm130. Protein identifications
were accepted if they could be established at greater than 95.0% probability and
contained at least two identified peptides. Protein probabilities were assigned by
the Protein Prophet algorithm131. Before we annotated a certain peptide derived from
the xenograft-bearing mice as human, a stringent selection procedure was followed
(see Figure 1). First all peptide mass values identified in the serum from control
mice and PC339 or PC346 xenograft-bearing mice were searched against both the
International Protein Index (IPI) mouse and IPI human databases (version 3.18,
containing 53,788 and 60,090 proteins, respectively). Then a selection was made
of peptides uniquely present in the serum of PC346 or PC339 xenograft-bearing
mice. These peptides were subsequently divided into a group of human-specific
peptides (identified only in the IPI human database) and a group of homologous
peptides (present in both the IPI human and IPI mouse databases). Homologous
peptides were annotated as tumour-derived if four or more times higher abundant
in the serum of PC339 or PC346 xenografted mice in comparison with control serum
as listed in Scaffold. Additionally to double check human specificity, the identified
human-specific peptides were blasted against the Swiss-Prot database of the
National Center for Biotechnology Information (NCBI) database.
Two-dimensional SDS-PAGE analysis of proteasomesTo clean up samples from contaminants, for each xenograft-derived serum sample
(50 μg of protein) the 2-D Clean-Up kit (Amersham Biosciences) was utilized
according to the manufacturer’s instructions. Next samples were solubilised in
125 µl of rehydration buffer (8 M urea, 2% CHAPS, 0.5% IPG buffer, 0.2% DTT, trace of
bromphenol blue, all dissolved in H2O). The samples were loaded onto Immobiline dry
strip gels (pH 3–10, non-linear, 7 cm; Amersham Biosciences). Isoelectric focusing
Flip_Jansen.indd 34 30-7-2013 8:43:40
ChApteR 2 35
was carried out as follows: 30 V for 10 h, 300 V for 2 h, 1000 V for 30 min, 5000 V for 90
min, 5000 V for 30 min, and 20 V for 20 h. Before starting the second dimension, strips
were reduced and alkylated for 15 min in DTT equilibration buffer (6 M urea, 50 mM
Tris, pH 8.8, 20% glycerol, 2% SDS, 1% DTT) and iodoacetamide equilibration buffer
(6 M urea, 50 mM Tris, pH 8.8, 20% glycerol, 2% SDS, 2.5% iodoacetamide). Next the
IPG strips were placed upon a Criterion XT bis-Tris gel (12%; Bio-Rad). The second
dimension was run at 100 V for ±2 h with XT MOPS buffer (Bio-Rad). After running
the second dimension, gels were blotted onto Protran nitrocellulose membrane in
Tris-glycine-SDS buffer (Bio-Rad). The immunoblot was blocked for 1 h and after
washing twice incubated overnight at 4 °C with a monoclonal antibody (1:2000)
against proteasome subunits 6, 2, 4, 5, 1, and 3 (clone MCP231, Biomol International,
Exeter, UK). This corresponds with the subunits 1, 2, 3, 5, 6, and 7 according to
the nomenclature of Baumeister et al.132. In addition, monoclonal antibodies
specifically directed against the proteasome 1 subunit (PSMA1; 6 according to the
Baumeister et al.132 nomenclature) (clone MCP20, Biomol International) or 3 subunits
(PSMA3; 7 according to the Baumeister et al.132 nomenclature) (clone MCP72, Biomol
International) were utilized. The immunoblot was washed and incubated for 1 h with
a 1:1000 solution of a goat anti-mouse horseradish peroxidase-conjugated antibody
(DakoCytomation, Glostrup, Denmark). The secondary antibody was visualized
with a chemiluminescence detection kit (Roche Applied Science). For reprobing,
blots were immersed in a 0.04 M Tris-HCl, 0.06 M Tris base, 0.07 M SDS, 0.10 M
β-mercaptoethanol solution for 20 min at 50 °C.
Native gel electrophoresis of proteasomesThe protocol for characterization of the proteasome by native gel electrophoresis
was followed as previously described by Elsasser et al.133. Depleted xenograft and
control serum samples were mixed with 5sample buffer containing 250 mM Tris-
HCl, pH 7.4, 50% glycerol, 60 ng/ml xylene cyanol. Samples were either directly
loaded or denatured by heating at 96 °C for 5 min. Gels were run for 3–4 h at 4 °C.
Gels were transferred onto Protran nitrocellulose membranes at 250 mA for 1.5 h.
Sandwich ELISA for quantification of the proteasomeSerum proteasome concentrations were measured as previously described by
Dutaud et al.134 with some minor modifications. Briefly serum from control (n=3) and
PC339 (n=3) or PC346 (n=3) xenograft-bearing mice (1:20 diluted) was incubated for
1 h on a plate coated with a 1:4500 dilution of a monoclonal antibody against PSMA1
(clone MCP20, Biomol International). After addition of a 1:1500 solution of a rabbit
anti-proteasome antibody (directed against β subunits of the proteasome; PW 8155,
Biomol International) cells were extensively washed with PBS-Tween 20 buffer.
Flip_Jansen.indd 35 30-7-2013 8:43:40
Discovery anD valiDation of prostate cancer biomarkers36
Then a 1:4000 solution of goat anti-rabbit horseradish peroxidase-conjugated
antibody (DakoCytomation) was added, and the plate was incubated for 1 h in the
dark. To reveal horseradish peroxidase activity, 50 mM phosphate, 25 mM citrate
buffer, pH 5.0 was added to the cells. After 15 min, the reaction was stopped with
2.5 M sulfuric acid. Absorbance values were measured at 492 nm. All analyses were
performed in triplicate.
Cell culture and isolation of PC346C and VCaP-derived exosomesThe human prostate cancer cell line PC346C was cultured in Dulbecco’s modified
Eagle’s medium-Ham’s F-12 medium (Cambrex Bio Science, Verviers, Belgium)
supplemented with 0.1 nM R1881, 2% FCS (PAN Biotech, Aidenbach, Germany),
1% insulin-transferrin-selenium (Invitrogen), 0.01% BSA (Roche Applied Science),
10 ng/ml epidermal growth factor (Sigma-Aldrich), 100 units/ml penicillin and
100 g/ml streptomycin antibiotics (Cambrex Bio Science), 100 ng/ml fibronectin
(Harbor Bio-Products, Tebu-bio, the Netherlands), 20 g/ml fetuin (ICN Biomedicals,
Zoetermeer, The Netherlands), 50 ng/ml cholera toxin (Sigma-Aldrich), 0.1 mM
phosphoethanolamine (Sigma-Aldrich), and 0.6 ng/ml triiodothyronine (Sigma-
Aldrich)129. The human PCa cell line VCaP was cultured in RPMI 1640 medium
(Cambrex Bio Science) supplemented with 10% dextran-coated charcoal-treated
FCS (PAN Biotech) and 100 units/ml penicillin and 100 g/ml streptomycin
antibiotics (Cambrex Bio Science). Exosomes were isolated according to the protocol
described previously by Hegmans et al.135. Briefly PC346C and VCaP were cultured
in their respective medium to 80% confluency. Cultures were washed twice with
PBS and incubated for 48 h in a humidified atmosphere of 5% CO2, 95% air with
serum-free medium consisting of Dulbecco’s modified Eagle’s medium-Ham’s
F-12 or RPMI 1640 medium (Cambrex Bio Science) supplemented with 0.1 nM
R1881. After incubation cell culture supernatants were subjected to successive
centrifugations of 400 g (10 min), 3000 g (20 min), and 10,000 g (30 min). Exosomes
were then pelleted at 64,000 g for 110 min using an SW28 rotor (Beckman Coulter
Instruments, Fullerton, CA). Exosome pellets were resuspended in 0.32 M sucrose
and centrifuged at 100,000 g for 1 h (SW60 rotor, Beckman Coulter Instruments).
For several experiments, the isolated exosomes from PC346C were further purified
by immobilization onto magnetic beads. In short, 25 µl of Dynabeads, precoated
with goat anti-mouse immune globulin G (Invitrogen Dynal AS, Oslo, Norway) were
incubated for 1 h with 30 µl of an anti-CD9 monoclonal antibody (clone MM2/57,
Chemicon International, London, UK). Thereafter beads were incubated by rotation
top end over with 20 µg of exosomes for 1 h at 4 °C. After washing four times, beads
and exosomes were resuspended in PBS for further experiments.
Flip_Jansen.indd 36 30-7-2013 8:43:40

ChApteR 2 37
Electron microscopy of isolated exosomesExosomes from PC346C obtained after ultracentrifugation of cell culture
supernatants were resuspended in 10 µl of Milli-Q and spotted onto Formvarcoated
grids (200 mesh). Adsorbed exosomes were fixed in 2% paraformaldehyde for 5 min
at room temperature. After fixation the exosomes were either directly negatively
stained using uranyl acetate or immunolabeled with antibodies against CD9 (clone
MM2/57, Chemicon International). Antigen-antibody complexes were visualized
with protein A conjugated with 10-nm colloidal gold particles (1:20 dilution; Aurion,
Wageningen, The Netherlands) followed by negative staining (see above). The
specificity of the labelling procedure was tested by omitting the primary antibody.
Grids were examined by a Philips CM100 electron microscope at 80 kV.
Mass spectrometry of exosomesAfter resuspending the exosome pellet in PBS, 10 µg of isolated exosomes and
10 µg of supernatant fraction were applied onto two 10% SDS-polyacrylamide
gels. After running, one of the gels was silver-stained as described previously by
Mortz et al.136. This gel was used to identify distinct bands present in the exosome
fraction (see Figure 4b). Subsequently these bands were excised from a Coomassie
Brilliant Blue (Merck)- stained gel and cut in 3-mm sections. Preparation for mass
spectrometry was performed using the protocol described under “Preparation
of Xenograft Sera for Mass Spectrometry”. Peptide separation was performed on
a nanoscale liquid chromatography system (nanoLC Ultimate 3000) (Dionex,
Sunnyvale, CA) with a 50-min gradient (5–40% acetonitrile, H2O, 0.1% formic acid).
The injection volume was 5 µl of the tryptically digested sample. Peptides were
separated on a C18 PepMap column (150 mm 75 μm inner diameter) (Dionex) at
200 nl/min after preconcentration on a trap column (1 mm 300 μm inner diameter).
Separated peptides were detected by a linear ion trap Orbitrap (LTQ-Orbitrap)
mass spectrometer (Finnigan LTQ Orbitrap XL, Thermo Electron). Samples were
measured in a data-dependent acquisition mode. In the measurement method used,
the peptide masses are measured in a survey scan at a maximum resolution of 60,000.
To obtain a maximum mass accuracy a prescan is used to keep the ion population
in the Orbitrap for each scan approximately the same. During the high resolution
scan in the Orbitrap the five most intense monoisotopic peaks in the spectra were
fragmented and measured in the LTQ. The fragment ion masses were measured in
the LTQ to have a maximum sensitivity and a maximum amount of MS/MS data. For
a full analysis of the exosomal proteome, 10 µg of the isolated exosome fraction was
applied onto a 10% SDS-polyacrylamide gel and run for 1.5 cm inside the running
gel. Thereafter this gel section was excised and divided into 3-mm sections,
washed, destained (100% acetonitrile followed by 50 mM ammonium bicarbonate),
Flip_Jansen.indd 37 30-7-2013 8:43:40
Discovery anD valiDation of prostate cancer biomarkers38
dehydrated (100% acetonitrile), and reduced with 6.5 mM DTT in 50 mM ammonium
bicarbonate for 45 min at 60 °C. After alkylation with 54 mM iodoacetamide in 50 mM
ammonium bicarbonate, proteins were dehydrated in 100% acetonitrile and then
rehydrated with the digestion solution containing 10 ng/l ultra grade sequencing
trypsin (Promega) for 30 min on ice. After removal of the redundant trypsin solution
and addition of 50 mM ammonium bicarbonate solution to cover the gel pieces, gel
particles were incubated overnight at 37 °C. After extraction, the peptides were
dissolved in 5% formic acid and stored at -80 °C until analysis. Mass spectrometry
was performed using the protocol described under “Liquid Chromatography-Mass
Spectrometry of Xenograft Sera.” For protein identification, database searches
were performed using Mascot version 2.2 (Matrix Science) allowing 5-ppm mass
deviation for the precursor ion, a 0.6-Da tolerance on the fragment ions, and trypsin
as the digestion enzyme. A maximum number of one missed cleavage was allowed,
and carbamidomethylated cysteine and oxidized methionine were set as fixed and
optional modifications, respectively. All peptide mass values identified in the isolated
exosomes were searched against the IPI human database (version 3.37, containing
69,164 proteins). Only peptides with Mascot scores >30 were accepted. Scaffold
(version 2_01_02, Proteome Software Inc., Portland, OR) was used to validate MS/
MS-based peptide and protein identifications. Peptide identifications were accepted
if they could be established at greater than 90.0% probability as specified by the
Peptide Prophet algorithm130. Protein identifications were accepted if they could be
established at greater than 95.0% probability and contained at least two identified
peptides. Protein probabilities were assigned by the Protein Prophet algorithm131.
One-dimensional SDS-PAGE analysis and western blottingFor one-dimensional electrophoresis, samples containing 10 µg of protein
were mixed with Laemmli sample buffer (1:1 ratio) and loaded onto 10% SDS-
polyacrylamide gels. Gels were transferred onto a Protran nitrocellulose membrane
for Western blotting. The following antibodies were used: CD9 (1:500 dilution; clone
MM2/57, Chemicon International), RAB5A (1:200 dilution; clone FL-215, Santa Cruz
Biotechnology, Santa Cruz, CA), RAB11A (1:100 dilution; Invitrogen), hepatocyte
growth factor-regulated tyrosine kinase substrate (HGS; previously known as
HRS; 1:500 dilution; Alexis Biochemicals, San Diego, CA), GAPDH (1:500 dilution;
clone 7B, LabFrontier, Seoul, Korea), ENO1 (1:1000 dilution; clone H300, Santa Cruz
Biotechnology), 14-3-3 θ (1:1000 dilution; clone 3B9, Calbiochem, San Diego, CA),
PSA (1:500 dilution; clone A0562, DakoCytomation), proteasome subunits 6, 2, 4, 5, 1,
and 3 (1:2000 dilution; clone MCP231, Biomol International), PSMA1 (1:1000 dilution;
clone MCP20, Biomol International), PSMA3 (1:1000 dilution; clone MCP72, Biomol
Flip_Jansen.indd 38 30-7-2013 8:43:40
ChApteR 2 39
International), and proteasome subunit β1 (PSMB1; β6 according to the Baumeister
et al.132 nomenclature; Biomol International).
Isolation and analysis of exosomal RNAExosomal total RNA was isolated using the RNeasy Mini kit (Qiagen, Hilden,
Germany) as described by Valadi et al.128. In short, pelleted exosomes were disrupted
and homogenized in 350 µl of buffer RLT (Qiagen), and 1050 µl of 100% ethanol was
added before samples were transferred to the RNeasy Mini spin column. Hereafter
the procedure was followed as described by the manufacturer’s protocol. Analysis of
RNA expression was performed by RT-PCR. One microgram of exosomal RNA was
reverse transcribed using Moloney murine leukaemia virus reverse transcriptase
(Invitrogen) and an oligo- (dT)12 primer. Primer combinations used were as follows:
PSA-4A (5-ACGTGTGTGCAAGTTCACC-3) and PSA-5B (5-TGTACAGGGAA-
GGCCTTTCG- 3), TMPRSS2-E1 (5-AGCGCGGCAGGAAGCCTTA- 3) and ERG-R
(5-GTAGGCACACTCAAACAACGACTGG-3), and GAPDH 462U17 (5-CATGT-
TCGTCATGGGTG-3) and GAPDH 589L20 (5-ACTGTGGTCATGAGTCCTTC-3).
PCR was performed for 27 cycles at an annealing temperature of 58 °C.
Flip_Jansen.indd 39 30-7-2013 8:43:40

Discovery anD valiDation of prostate cancer biomarkers40
results
Identification of 44 tumor-derived proteins in xenografted miceThe selection procedure followed to annotate identified proteins as tumour-derived
in the circulation of human prostate cancer-xenografted mice is depicted in Figure 1.
After serum collection from control mice (n=9) and PC346 (n=9) and PC339 (n=9)
xenografted mice, samples were pooled and depleted of high abundance proteins,
and proteins were separated by one-dimensional gel electrophoresis. Following
tryptic digestion, peptides were subsequently analysed by LTQ-FT-ICR-MS/MS.
After data analysis, 44 proteins were identified as tumour-derived (at greater than
95.0% probability and with two or more identified peptides) (Table 1). Of those,
22 were annotated as cytoplasmic proteins by the Gene Ontology database. The
cytoplasmic proteins contained 12 of the subunits of the proteasome of which seven
were identified based on the presence of human-specific peptides in the serum of
xenograft-bearing mice.
Flip_Jansen.indd 40 30-7-2013 8:43:40
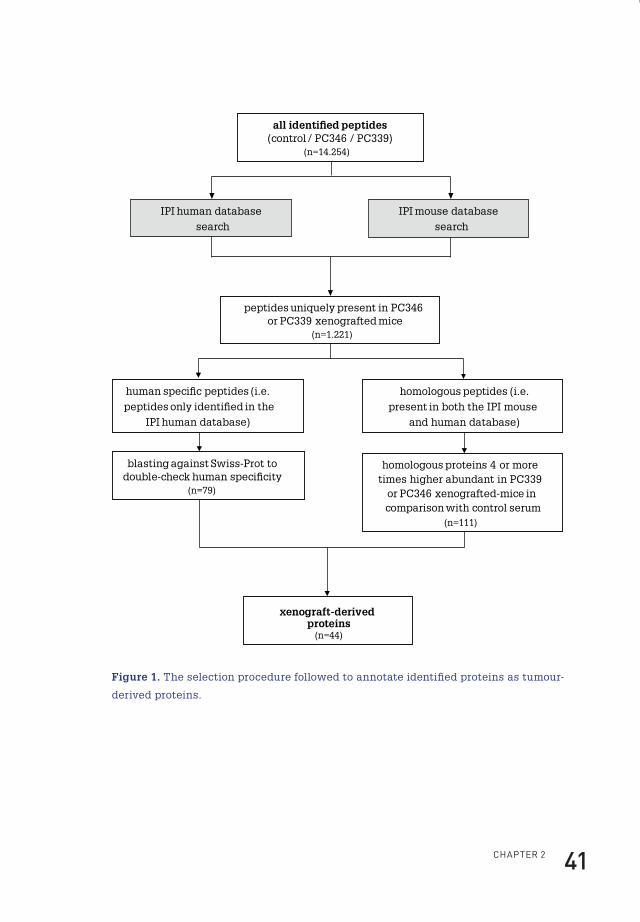
ChApteR 2 41
all identi�ed peptides(control / PC346 / PC339)
(n=14.254)
peptides uniquely present in PC346 or PC339 xenografted mice
(n=1.221)
IPI human database search
IPI mouse database search
human speci�c peptides (i.e. peptides only identi�ed in the
IPI human database)
homologous peptides (i.e. present in both the IPI mouse
and human database)
xenograft-derived proteins
(n=44)
homologous proteins 4 or more times higher abundant in PC339
or PC346 xenografted-mice in comparison with control serum
(n=111)
blasting against Swiss-Prot to double-check human speci�city
(n=79)
Figure 1. The selection procedure followed to annotate identified proteins as tumour-
derived proteins.
Flip_Jansen.indd 41 30-7-2013 8:43:41
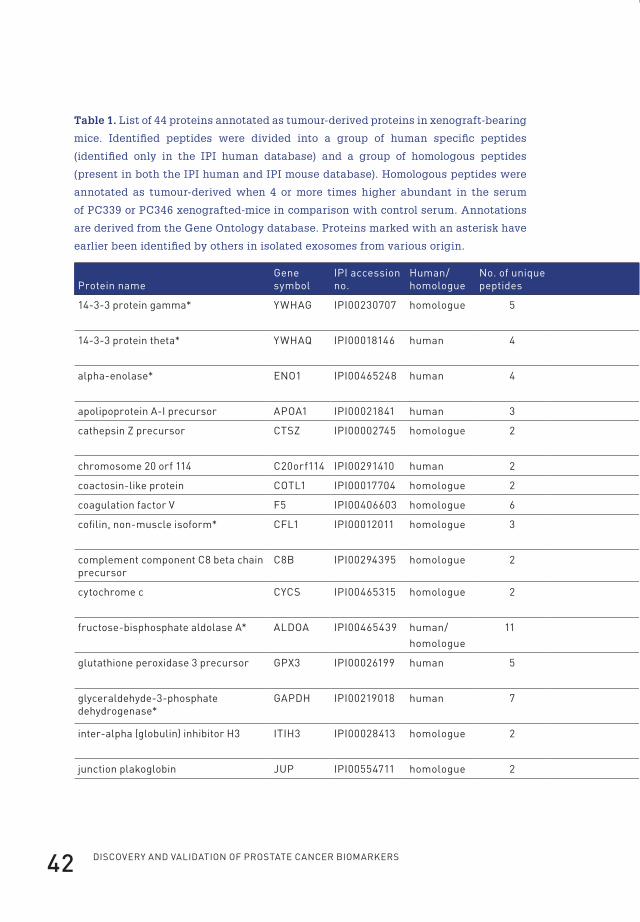
Discovery anD valiDation of prostate cancer biomarkers42
Table 1. List of 44 proteins annotated as tumour-derived proteins in xenograft-bearing
mice. Identified peptides were divided into a group of human specific peptides
(identified only in the IPI human database) and a group of homologous peptides
(present in both the IPI human and IPI mouse database). Homologous peptides were
annotated as tumour-derived when 4 or more times higher abundant in the serum
of PC339 or PC346 xenografted-mice in comparison with control serum. Annotations
are derived from the Gene Ontology database. Proteins marked with an asterisk have
earlier been identified by others in isolated exosomes from various origin.
protein nameGene symbol
ipi accession no.
human/homologue
no. of unique peptides
% sequence coverage Xenograft Molecular function biological process location
14-3-3 protein gamma* yWhAG ipi00230707 homologue 5 20.65 pC339 protein kinase C binding regulation of signal transduction
cytoplasm
14-3-3 protein theta* yWhAQ ipi00018146 human 4 15.92 pC339 protein kinase C inhibitor activity
regulation of progression through cell cycle
cytoplasm
alpha-enolase* enO1 ipi00465248 human 4 26.67 pC339 phosphopyruvate hydratase activity
glycolysis cytoplasm
apolipoprotein A-i precursor ApOA1 ipi00021841 human 3 16.24 pC339 lipid binding cholesterol metabolism secreted
cathepsin Z precursor CtsZ ipi00002745 homologue 2 5.61 pC346 cysteine-type peptidase activity
proteolysis lysosome
chromosome 20 orf 114 C20orf114 ipi00291410 human 2 4.34 pC346 lipid binding
coactosin-like protein COtl1 ipi00017704 homologue 2 9.15 pC339 actin binding
coagulation factor v f5 ipi00406603 homologue 6 3.55 pC339 oxidoreductase activity blood coagulation secreted
cofilin, non-muscle isoform* Cfl1 ipi00012011 homologue 3 21.69 pC339 protein binding cytoskeleton organization and biogenesis
cytoplasm
complement component C8 beta chain precursor
C8b ipi00294395 homologue 2 5.66 pC339 immune response secreted
cytochrome c CyCs ipi00465315 homologue 2 17.14 pC346/339 heme binding caspase activation via cytochrome c
mitochondrion matrix
fructose-bisphosphate aldolase A* AlDOA ipi00465439 human/homologue
11 30.77 pC346/339 fructose-bisphosphate aldolase activity
glycolysis
glutathione peroxidase 3 precursor GpX3 ipi00026199 human 5 23.01 pC339 gluthatione peroxidase activity
hydrogen peroxide catabolism
secreted
glyceraldehyde-3-phosphate dehydrogenase*
GApDh ipi00219018 human 7 25.97 pC346/339 glyceraldehyde-3-phosphate dehydrogenase activity
cytoplasm
inter-alpha (globulin) inhibitor h3 itih3 ipi00028413 homologue 2 3.03 pC346 serine-type endopeptidase inhibitor activity
hyaluronan metabolism secreted
junction plakoglobin JUp ipi00554711 homologue 2 2.81 pC339 cytoskeletal protein binding cell adhesion
Flip_Jansen.indd 42 30-7-2013 8:43:41
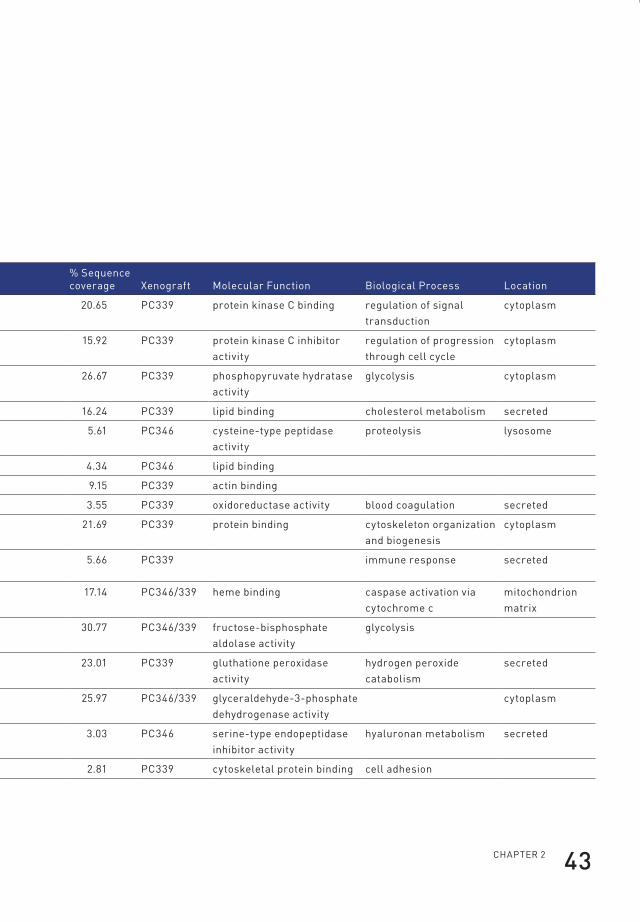
ChApteR 2 43
Table 1. List of 44 proteins annotated as tumour-derived proteins in xenograft-bearing
mice. Identified peptides were divided into a group of human specific peptides
(identified only in the IPI human database) and a group of homologous peptides
(present in both the IPI human and IPI mouse database). Homologous peptides were
annotated as tumour-derived when 4 or more times higher abundant in the serum
of PC339 or PC346 xenografted-mice in comparison with control serum. Annotations
are derived from the Gene Ontology database. Proteins marked with an asterisk have
earlier been identified by others in isolated exosomes from various origin.
protein nameGene symbol
ipi accession no.
human/homologue
no. of unique peptides
% sequence coverage Xenograft Molecular function biological process location
14-3-3 protein gamma* yWhAG ipi00230707 homologue 5 20.65 pC339 protein kinase C binding regulation of signal transduction
cytoplasm
14-3-3 protein theta* yWhAQ ipi00018146 human 4 15.92 pC339 protein kinase C inhibitor activity
regulation of progression through cell cycle
cytoplasm
alpha-enolase* enO1 ipi00465248 human 4 26.67 pC339 phosphopyruvate hydratase activity
glycolysis cytoplasm
apolipoprotein A-i precursor ApOA1 ipi00021841 human 3 16.24 pC339 lipid binding cholesterol metabolism secreted
cathepsin Z precursor CtsZ ipi00002745 homologue 2 5.61 pC346 cysteine-type peptidase activity
proteolysis lysosome
chromosome 20 orf 114 C20orf114 ipi00291410 human 2 4.34 pC346 lipid binding
coactosin-like protein COtl1 ipi00017704 homologue 2 9.15 pC339 actin binding
coagulation factor v f5 ipi00406603 homologue 6 3.55 pC339 oxidoreductase activity blood coagulation secreted
cofilin, non-muscle isoform* Cfl1 ipi00012011 homologue 3 21.69 pC339 protein binding cytoskeleton organization and biogenesis
cytoplasm
complement component C8 beta chain precursor
C8b ipi00294395 homologue 2 5.66 pC339 immune response secreted
cytochrome c CyCs ipi00465315 homologue 2 17.14 pC346/339 heme binding caspase activation via cytochrome c
mitochondrion matrix
fructose-bisphosphate aldolase A* AlDOA ipi00465439 human/homologue
11 30.77 pC346/339 fructose-bisphosphate aldolase activity
glycolysis
glutathione peroxidase 3 precursor GpX3 ipi00026199 human 5 23.01 pC339 gluthatione peroxidase activity
hydrogen peroxide catabolism
secreted
glyceraldehyde-3-phosphate dehydrogenase*
GApDh ipi00219018 human 7 25.97 pC346/339 glyceraldehyde-3-phosphate dehydrogenase activity
cytoplasm
inter-alpha (globulin) inhibitor h3 itih3 ipi00028413 homologue 2 3.03 pC346 serine-type endopeptidase inhibitor activity
hyaluronan metabolism secreted
junction plakoglobin JUp ipi00554711 homologue 2 2.81 pC339 cytoskeletal protein binding cell adhesion
Flip_Jansen.indd 43 30-7-2013 8:43:41
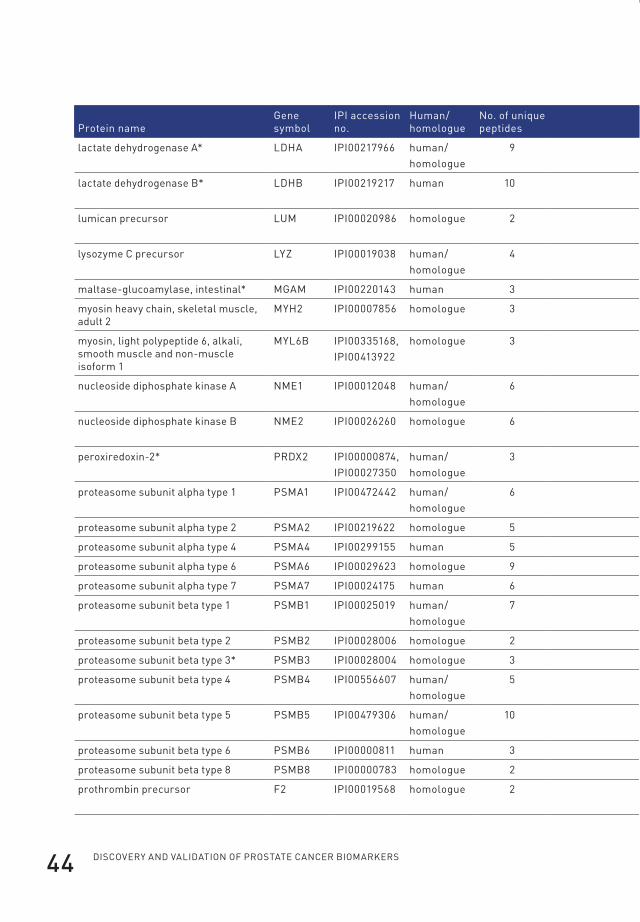
Discovery anD valiDation of prostate cancer biomarkers44
protein nameGene symbol
ipi accession no.
human/homologue
no. of unique peptides
% sequence coverage Xenograft Molecular function biological process location
lactate dehydrogenase A* lDhA ipi00217966 human/homologue
9 21.69 pC346/339 l-lactate dehydrogenase activity
anaerobic glycolysis cytoplasm
lactate dehydrogenase b* lDhb ipi00219217 human 10 29.94 pC346/339 l-lactate dehydrogenase activity
anaerobic glycolysis cytoplasm
lumican precursor lUM ipi00020986 homologue 2 5.92 pC339 collagen binding collagen fibril organization
secreted
lysozyme C precursor lyZ ipi00019038 human/homologue
4 23.65 pC346/339 lysozyme activity inflammatory response
maltase-glucoamylase, intestinal* MGAM ipi00220143 human 3 1.18 pC346/339 protein binding carbohydrate metabolism cell membrane
myosin heavy chain, skeletal muscle, adult 2
Myh2 ipi00007856 homologue 3 4.94 pC346 actin binding
myosin, light polypeptide 6, alkali, smooth muscle and non-muscle isoform 1
Myl6b ipi00335168, ipi00413922
homologue 3 14.42 pC339 structural component of muscle
muscle filament sliding
nucleoside diphosphate kinase A nMe1 ipi00012048 human/homologue
6 46.71 pC339 nucleoside diphosphate kinase activity
negative regulation of cell proliferation
cytoplasm
nucleoside diphosphate kinase b nMe2 ipi00026260 homologue 6 42.76 pC339 nucleoside diphosphate kinase activity
negative regulation of cell proliferation
cytoplasm
peroxiredoxin-2* pRDX2 ipi00000874, ipi00027350
human/homologue
3 13.13 pC339 thioredoxin peroxidase activity
anti-apoptosis cytoplasm
proteasome subunit alpha type 1 psMA1 ipi00472442 human/homologue
6 24.91 pC346/339 peptidase activity proteolysis cytoplasm
proteasome subunit alpha type 2 psMA2 ipi00219622 homologue 5 22.64 pC346/339 peptidase activity proteolysis cytoplasm
proteasome subunit alpha type 4 psMA4 ipi00299155 human 5 17.30 pC339 peptidase activity proteolysis cytoplasm
proteasome subunit alpha type 6 psMA6 ipi00029623 homologue 9 37.80 pC346 peptidase activity proteolysis cytoplasm
proteasome subunit alpha type 7 psMA7 ipi00024175 human 6 21.37 pC339 peptidase activity proteolysis cytoplasm
proteasome subunit beta type 1 psMb1 ipi00025019 human/homologue
7 34.02 pC346/339 peptidase activity proteolysis cytoplasm
proteasome subunit beta type 2 psMb2 ipi00028006 homologue 2 12.44 pC346 peptidase activity proteolysis cytoplasm
proteasome subunit beta type 3* psMb3 ipi00028004 homologue 3 18.05 pC346/339 peptidase activity proteolysis cytoplasm
proteasome subunit beta type 4 psMb4 ipi00556607 human/homologue
5 17.80 pC346/339 peptidase activity proteolysis cytoplasm
proteasome subunit beta type 5 psMb5 ipi00479306 human/homologue
10 38.78 pC346/339 peptidase activity proteolysis cytoplasm
proteasome subunit beta type 6 psMb6 ipi00000811 human 3 12.97 pC346/339 peptidase activity proteolysis cytoplasm
proteasome subunit beta type 8 psMb8 ipi00000783 homologue 2 5.88 pC346 protein binding proteolysis cytoplasm
prothrombin precursor f2 ipi00019568 homologue 2 2.25 pC346 thrombin activity regulation of progression through cell cycle
secreted
Flip_Jansen.indd 44 30-7-2013 8:43:41

ChApteR 2 45
protein nameGene symbol
ipi accession no.
human/homologue
no. of unique peptides
% sequence coverage Xenograft Molecular function biological process location
lactate dehydrogenase A* lDhA ipi00217966 human/homologue
9 21.69 pC346/339 l-lactate dehydrogenase activity
anaerobic glycolysis cytoplasm
lactate dehydrogenase b* lDhb ipi00219217 human 10 29.94 pC346/339 l-lactate dehydrogenase activity
anaerobic glycolysis cytoplasm
lumican precursor lUM ipi00020986 homologue 2 5.92 pC339 collagen binding collagen fibril organization
secreted
lysozyme C precursor lyZ ipi00019038 human/homologue
4 23.65 pC346/339 lysozyme activity inflammatory response
maltase-glucoamylase, intestinal* MGAM ipi00220143 human 3 1.18 pC346/339 protein binding carbohydrate metabolism cell membrane
myosin heavy chain, skeletal muscle, adult 2
Myh2 ipi00007856 homologue 3 4.94 pC346 actin binding
myosin, light polypeptide 6, alkali, smooth muscle and non-muscle isoform 1
Myl6b ipi00335168, ipi00413922
homologue 3 14.42 pC339 structural component of muscle
muscle filament sliding
nucleoside diphosphate kinase A nMe1 ipi00012048 human/homologue
6 46.71 pC339 nucleoside diphosphate kinase activity
negative regulation of cell proliferation
cytoplasm
nucleoside diphosphate kinase b nMe2 ipi00026260 homologue 6 42.76 pC339 nucleoside diphosphate kinase activity
negative regulation of cell proliferation
cytoplasm
peroxiredoxin-2* pRDX2 ipi00000874, ipi00027350
human/homologue
3 13.13 pC339 thioredoxin peroxidase activity
anti-apoptosis cytoplasm
proteasome subunit alpha type 1 psMA1 ipi00472442 human/homologue
6 24.91 pC346/339 peptidase activity proteolysis cytoplasm
proteasome subunit alpha type 2 psMA2 ipi00219622 homologue 5 22.64 pC346/339 peptidase activity proteolysis cytoplasm
proteasome subunit alpha type 4 psMA4 ipi00299155 human 5 17.30 pC339 peptidase activity proteolysis cytoplasm
proteasome subunit alpha type 6 psMA6 ipi00029623 homologue 9 37.80 pC346 peptidase activity proteolysis cytoplasm
proteasome subunit alpha type 7 psMA7 ipi00024175 human 6 21.37 pC339 peptidase activity proteolysis cytoplasm
proteasome subunit beta type 1 psMb1 ipi00025019 human/homologue
7 34.02 pC346/339 peptidase activity proteolysis cytoplasm
proteasome subunit beta type 2 psMb2 ipi00028006 homologue 2 12.44 pC346 peptidase activity proteolysis cytoplasm
proteasome subunit beta type 3* psMb3 ipi00028004 homologue 3 18.05 pC346/339 peptidase activity proteolysis cytoplasm
proteasome subunit beta type 4 psMb4 ipi00556607 human/homologue
5 17.80 pC346/339 peptidase activity proteolysis cytoplasm
proteasome subunit beta type 5 psMb5 ipi00479306 human/homologue
10 38.78 pC346/339 peptidase activity proteolysis cytoplasm
proteasome subunit beta type 6 psMb6 ipi00000811 human 3 12.97 pC346/339 peptidase activity proteolysis cytoplasm
proteasome subunit beta type 8 psMb8 ipi00000783 homologue 2 5.88 pC346 protein binding proteolysis cytoplasm
prothrombin precursor f2 ipi00019568 homologue 2 2.25 pC346 thrombin activity regulation of progression through cell cycle
secreted
Flip_Jansen.indd 45 30-7-2013 8:43:41
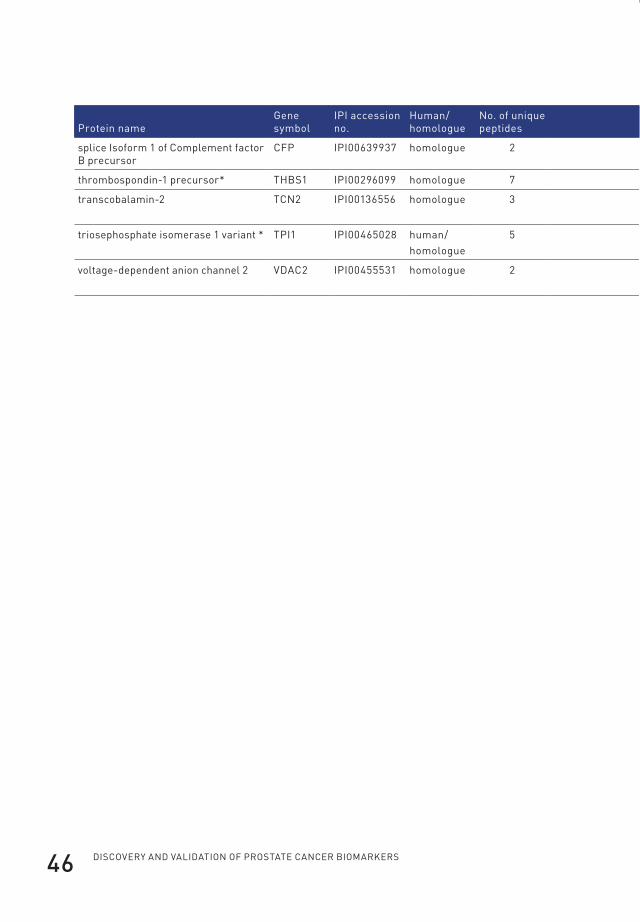
Discovery anD valiDation of prostate cancer biomarkers46
protein nameGene symbol
ipi accession no.
human/homologue
no. of unique peptides
% sequence coverage Xenograft Molecular function biological process location
splice isoform 1 of Complement factor b precursor
Cfp ipi00639937 homologue 2 4.90 pC346/339 complement binding complement activation secreted
thrombospondin-1 precursor* thbs1 ipi00296099 homologue 7 7.26 pC346/339 signal transducer activity cell motility secreted
transcobalamin-2 tCn2 ipi00136556 homologue 3 6.09 pC339 cobalamin transporter activity
cobalamin transport secreted
triosephosphate isomerase 1 variant * tpi1 ipi00465028 human/homologue
5 22.09 pC346/339 triose-phosphate isomerase activity
glycolysis
voltage-dependent anion channel 2 vDAC2 ipi00455531 homologue 2 7.77 pC346 voltage-gated anion channel porin activity
anion transport mitochondrion outer membrane
Flip_Jansen.indd 46 30-7-2013 8:43:42
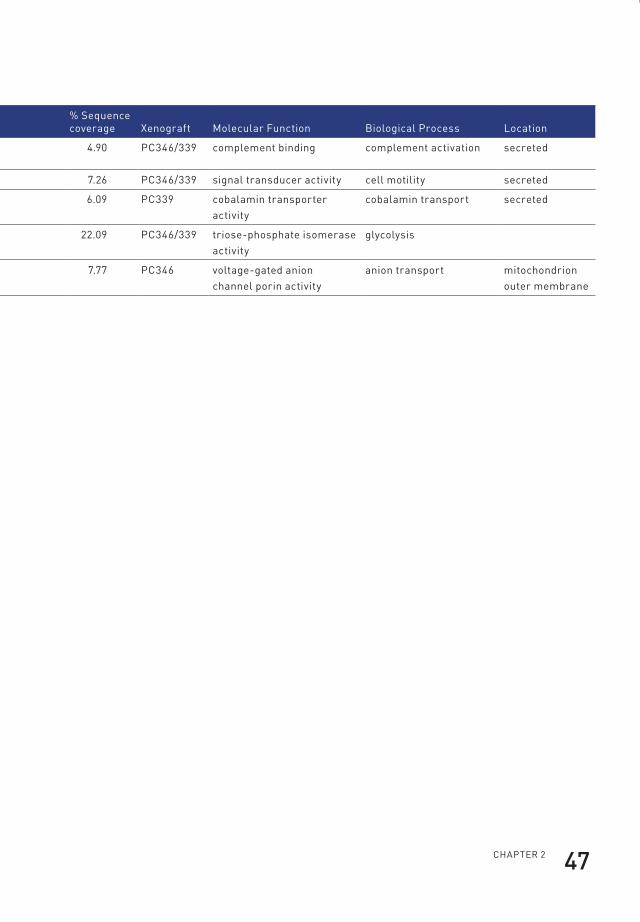
ChApteR 2 47
protein nameGene symbol
ipi accession no.
human/homologue
no. of unique peptides
% sequence coverage Xenograft Molecular function biological process location
splice isoform 1 of Complement factor b precursor
Cfp ipi00639937 homologue 2 4.90 pC346/339 complement binding complement activation secreted
thrombospondin-1 precursor* thbs1 ipi00296099 homologue 7 7.26 pC346/339 signal transducer activity cell motility secreted
transcobalamin-2 tCn2 ipi00136556 homologue 3 6.09 pC339 cobalamin transporter activity
cobalamin transport secreted
triosephosphate isomerase 1 variant * tpi1 ipi00465028 human/homologue
5 22.09 pC346/339 triose-phosphate isomerase activity
glycolysis
voltage-dependent anion channel 2 vDAC2 ipi00455531 homologue 2 7.77 pC346 voltage-gated anion channel porin activity
anion transport mitochondrion outer membrane
Flip_Jansen.indd 47 30-7-2013 8:43:42

Discovery anD valiDation of prostate cancer biomarkers48
Validation and characterization of proteasome subunits in xenograft seraTo specify and validate the presence of tumour-derived proteasome subunits in
the circulation of the xenografted mice, two-dimensional SDS-PAGE analysis of
xenograft-derived serum samples was performed. Figure 2 shows a comparison
between serum from control mice (n=3) and serum from PC339 (n=3) and PC346
(n=3) xenografted mice.
37kD
37kD
37kD
25kD
25kD
25kD
CM
PC346
PC339
4 5 6 7
PSMA3 PSMA1
Figure 2. 2D PAGE Western blotting analysis of depleted serum from control mice
(CM), PC346 xenograft-bearing mice (PC346), and PC339 xenograft-bearing mice
(PC339). Spots were detected by using a monoclonal antibody to proteasome subunits
6, 2, 4, 5, 1, and 3. The presence of PSMA1 and PSMA3 proteasome subunits was
confirmed with specific monoclonal antibodies. Strong signals are visible in the serum
from both the PC346 and PC339 mice. Also faint signals were detected in the control
serum because of crossreactivity with mouse proteasome subunits, which are present
under normal conditions in the mouse serum.
Flip_Jansen.indd 48 30-7-2013 8:43:42
ChApteR 2 49
Proteasome subunits were detected using a monoclonal antibody directed against
subunits 6, 2, 4, 5, 1, and 3 of the proteasome. Strong signals were observed in the
serum from both the PC346 and PC339 xenografted mice. As the proteasome antibody
recognizes both mouse and human proteasome subunits, also faint signals were visible
in the control serum that are known to be normally present in the mouse circulation.
This is in line with the identification of mouse-specific proteasome peptides as
detected by FT-ICRMS/ MS (data not shown). After stripping, blots were reprobed,
and two of the spots could be specifically identified in the serum of PC339 and PC346
xenografted mice as the PSMA1 and PSMA3 subunits by using specific monoclonal
antibodies directed against these proteins. The identified spots were consistent
regarding molecular weight and pI with an earlier study performed by Claverol et al.137.
Proteasome subunits are circulating as a complex in xenograft seraTo investigate whether the identified proteasome subunits were present as
proteasome complexes in the serum of xenografted mice, native gel electrophoresis
of control serum and serum from xenograft-bearing mice was performed. Figure 3a
shows the presence of high molecular weight proteasome complexes in the
xenograft sera. In both the 12.5% gel and 3.5% gel high molecular weight complexes
are visible in the samples that were run under native conditions. After denaturation,
the high molecular weight complexes disappeared, indicating disintegration into
single proteasome subunits. The same effect is seen in the endogenous proteasome
subunits of the control mouse. The presence of intact proteasome complexes was
also investigated by sandwich ELISA.
Serum samples from control (n=3) and xenograft mice (n=6) were diluted 1:20 and
analysed in triplicate under native conditions and after denaturation by heating at
96 °C for 5 min. Proteasome levels (mean ± S.D.) under native conditions in control,
PC346, and PC339 serum were 10.5 ± 10.6, 32,759 ± 1720.0, and 20,339 ± 5062.2
ng/ml, respectively. After denaturation, proteasome concentrations (mean ± S.D.)
decreased to 0.040 ± 0.03, 0.17 ± 0.16, and 0.28 ± 0.10 ng/ml in control, PC346,
and PC339 serum, respectively (Figure 3b). Because the capture antibody of the
sandwich ELISA is directed against the 1 subunit (PSMA1) of the proteasome
whereas the detection antibody is directed against β subunits, this confirms the
presence of proteasome complexes in the serum of the xenografted mice.
Flip_Jansen.indd 49 30-7-2013 8:43:42
Discovery anD valiDation of prostate cancer biomarkers50
Electron microscopy of isolated exosomesA large portion of the cytoplasmic tumour-derived proteins identified in the xenograft
model has previously been identified as part of the human exosomal protein content.
To explore the origin of the cytoplasmic proteins identified in the xenograft serum,
exosomes were isolated from the PC346C cell line. To confirm that the structures
isolated were indeed exosomes, they were examined by electron microscopy
(Figure 4a). This showed a homogenous mixture of small bilayer membrane vesicles
with an average diameter of 140 nm. ImmunoGold labelling of exosomes with an
antibody to CD9 (Tetraspanin 29), an established marker for tumour cell-derived
exosomes, showed positive exosome membrane staining (Figure 4a).
Flip_Jansen.indd 50 30-7-2013 8:43:42
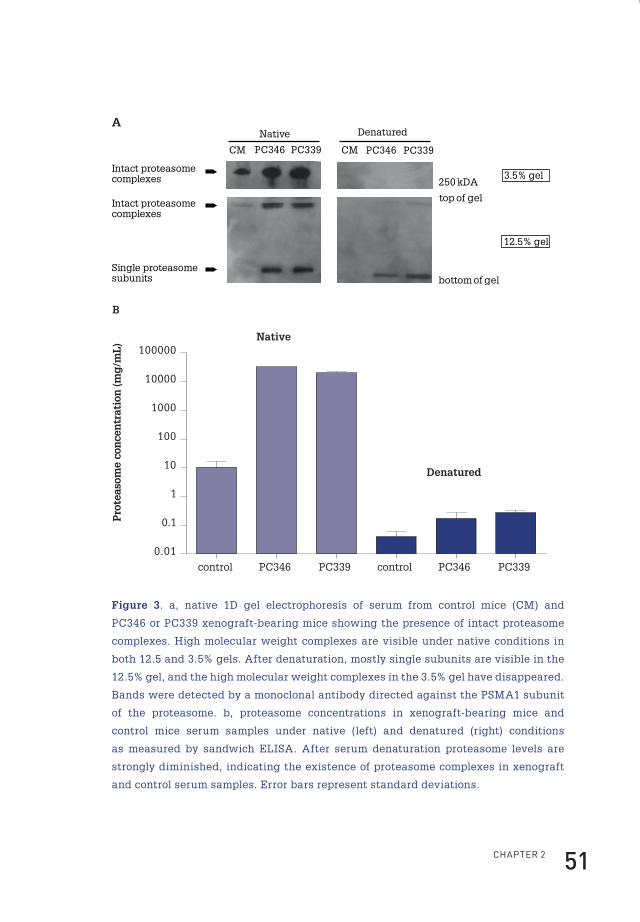
ChApteR 2 51
12.5% gel
3.5% gel
Intact proteasome complexes
Single proteasome subunits
Intact proteasome complexes 250 kDA
top of gel
bottom of gel
PC339
DenaturedNative
CM PC346 CM PC346 PC339
A
control PC346 PC339 PC346 PC339
0.01
0.1
1
10
100
1000
10000
100000Native
Denatured
Pro
teas
ome
con
cen
trat
ion
(mg
/mL
)
control
B
Figure 3. a, native 1D gel electrophoresis of serum from control mice (CM) and
PC346 or PC339 xenograft-bearing mice showing the presence of intact proteasome
complexes. High molecular weight complexes are visible under native conditions in
both 12.5 and 3.5% gels. After denaturation, mostly single subunits are visible in the
12.5% gel, and the high molecular weight complexes in the 3.5% gel have disappeared.
Bands were detected by a monoclonal antibody directed against the PSMA1 subunit
of the proteasome. b, proteasome concentrations in xenograft-bearing mice and
control mice serum samples under native (left) and denatured (right) conditions
as measured by sandwich ELISA. After serum denaturation proteasome levels are
strongly diminished, indicating the existence of proteasome complexes in xenograft
and control serum samples. Error bars represent standard deviations.
Flip_Jansen.indd 51 30-7-2013 8:43:43
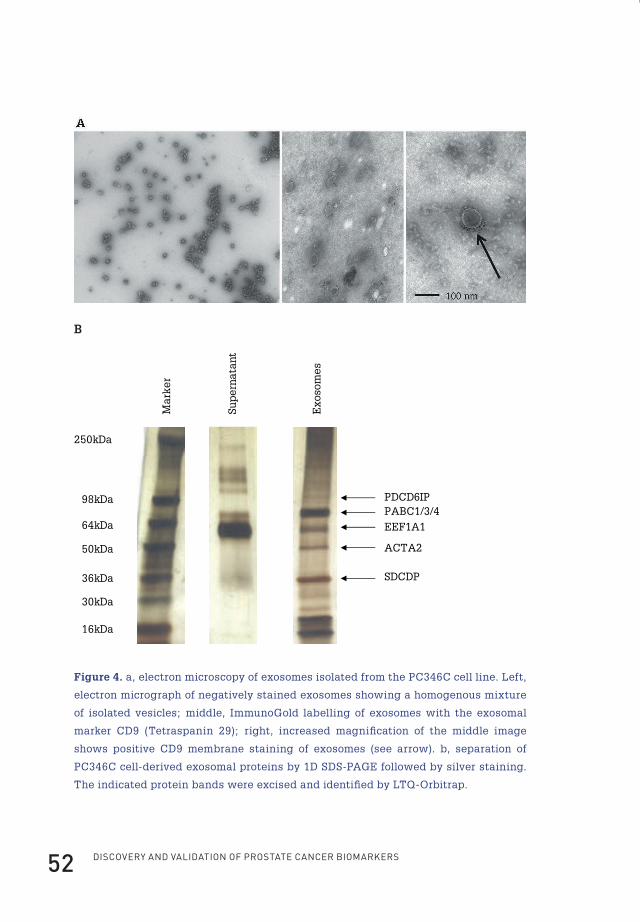
Discovery anD valiDation of prostate cancer biomarkers52
Exo
som
es
Mar
ker
250kDa
98kDa
64kDa
50kDa
36kDa
30kDa
16kDa
PDCD6IPPABC1/3/4
EEF1A1
ACTA2
SDCDP
Sup
ern
atan
t
B
Figure 4. a, electron microscopy of exosomes isolated from the PC346C cell line. Left,
electron micrograph of negatively stained exosomes showing a homogenous mixture
of isolated vesicles; middle, ImmunoGold labelling of exosomes with the exosomal
marker CD9 (Tetraspanin 29); right, increased magnification of the middle image
shows positive CD9 membrane staining of exosomes (see arrow). b, separation of
PC346C cell-derived exosomal proteins by 1D SDS-PAGE followed by silver staining.
The indicated protein bands were excised and identified by LTQ-Orbitrap.
Flip_Jansen.indd 52 30-7-2013 8:43:43

ChApteR 2 53
Proteomics analysis of exosomesSupernatant and exosome fractions of the PC346C cell line were separated by 1D
SDS-PAGE followed by silver staining (Figure 4b). The exosome fractions showed
several distinct bands, which were absent in the supernatant fraction. Several bands
were excised and subjected to LTQ-Orbitrap mass spectrometry (MS/MS) leading
to the identification of five proteins: programmed cell death 6 protein (PDCD6IP;
10 unique peptides, 10.65% sequence coverage), poly(A)-binding protein 1 (PABC1;
12 unique peptides, 18.71% sequence coverage), eukaryotic translation elongation
factor 1 α 1 (EEF1A1; three unique peptides, 6.28% sequence coverage), α-actin-2
(ACTA2; 13 unique peptides, 45.62% sequence coverage), and syndecan-binding
protein (syntenin; four unique peptides, 14.77% sequence coverage). An in-depth
proteomics analysis of the whole exosome fraction was performed by LTQ-FT-ICR-
MS/MS. A total of 48 unique proteins were discovered in the exosome fraction of
the PC346C cell line at a protein identification probability of 99% and 2 peptides
per protein (Table 2). At a protein probability of 99% and 1 peptide per protein 126
proteins were identified. Among those proteins identified with two or more peptides
per protein were two of the proteins that had earlier been identified in the serum of
xenograft-bearing mice (GAPDH and lactate dehydrogenase B)124. Also the presence
of the exosomal marker CD9 and the prostate-specific protein folate hydrolase 1
(FOLH1; prostate-specific membrane antigen) were confirmed. ENO1 and fructose-
bisphosphate aldolase A, also previously identified in the serum of xenograft-bearing
mice, were positively identified at a probability of one peptide per protein (data not
shown). All proteins identified in the specific exosome bands but ACTA2 (Figure 4b)
were also recovered in the in-depth proteomics analysis.
Flip_Jansen.indd 53 30-7-2013 8:43:43
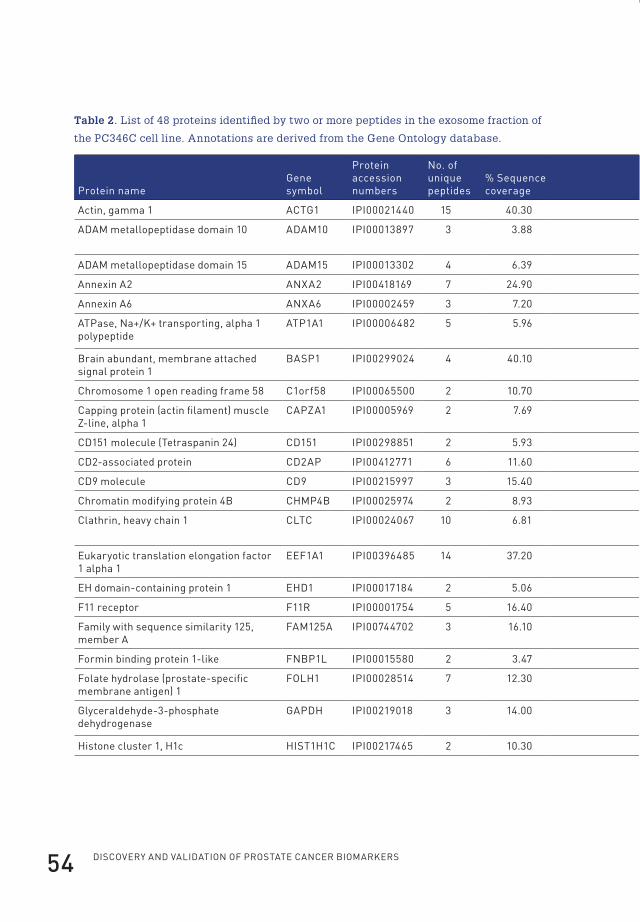
Discovery anD valiDation of prostate cancer biomarkers54
Table 2. List of 48 proteins identified by two or more peptides in the exosome fraction of
the PC346C cell line. Annotations are derived from the Gene Ontology database.
protein nameGene symbol
protein accession numbers
no. of unique peptides
% sequence coverage Molecular function biological process location
Actin, gamma 1 ACtG1 ipi00021440 15 40.30 structural constituent of cytoskeleton cell motility cytoplasm
ADAM metallopeptidase domain 10 ADAM10 ipi00013897 3 3.88 protein homodimerization activity protein amino acid phosphorylation
cell membrane
ADAM metallopeptidase domain 15 ADAM15 ipi00013302 4 6.39 proteolysis and peptidolysis cell adhesion cell membrane
Annexin A2 AnXA2 ipi00418169 7 24.90 phospholipase inhibitor activity skeletal development secreted protein
Annexin A6 AnXA6 ipi00002459 3 7.20 calcium ion binding
Atpase, na+/k+ transporting, alpha 1 polypeptide
Atp1A1 ipi00006482 5 5.96 sodium:potassium-exchanging Atpase activity
sodium ion transport cell membrane
brain abundant, membrane attached signal protein 1
bAsp1 ipi00299024 4 40.10 cell membrane
Chromosome 1 open reading frame 58 C1orf58 ipi00065500 2 10.70
Capping protein (actin filament) muscle Z-line, alpha 1
CApZA1 ipi00005969 2 7.69 actin binding cell motility
CD151 molecule (tetraspanin 24) CD151 ipi00298851 2 5.93 protein binding cell adhesion cell membrane
CD2-associated protein CD2Ap ipi00412771 6 11.60 structural constituent of cytoskeleton cell migration cytoplasm
CD9 molecule CD9 ipi00215997 3 15.40 protein binding cell motility cell membrane
Chromatin modifying protein 4b ChMp4b ipi00025974 2 8.93 cytoplasm
Clathrin, heavy chain 1 CltC ipi00024067 10 6.81 signal transducer activity receptor-mediated endocytosis
cell membrane
eukaryotic translation elongation factor 1 alpha 1
eef1A1 ipi00396485 14 37.20 translation elongation factor activity translation elongation cytoplasm
eh domain-containing protein 1 ehD1 ipi00017184 2 5.06 Atp binding cell membrane
f11 receptor f11R ipi00001754 5 16.40 cell motility cell membrane
family with sequence similarity 125, member A
fAM125A ipi00744702 3 16.10 cytoplasm
formin binding protein 1-like fnbp1l ipi00015580 2 3.47 cytoplasm
folate hydrolase (prostate-specific membrane antigen) 1
fOlh1 ipi00028514 7 12.30 dipeptidase activity proteolysis cell membrane
Glyceraldehyde-3-phosphate dehydrogenase
GApDh ipi00219018 3 14.00 glyceraldehyde-3-phosphate dehydrogenase activity
glycolysis cytoplasm
histone cluster 1, h1c hist1h1C ipi00217465 2 10.30 DnA binding nucleosome assembly nucleus
Flip_Jansen.indd 54 30-7-2013 8:43:44
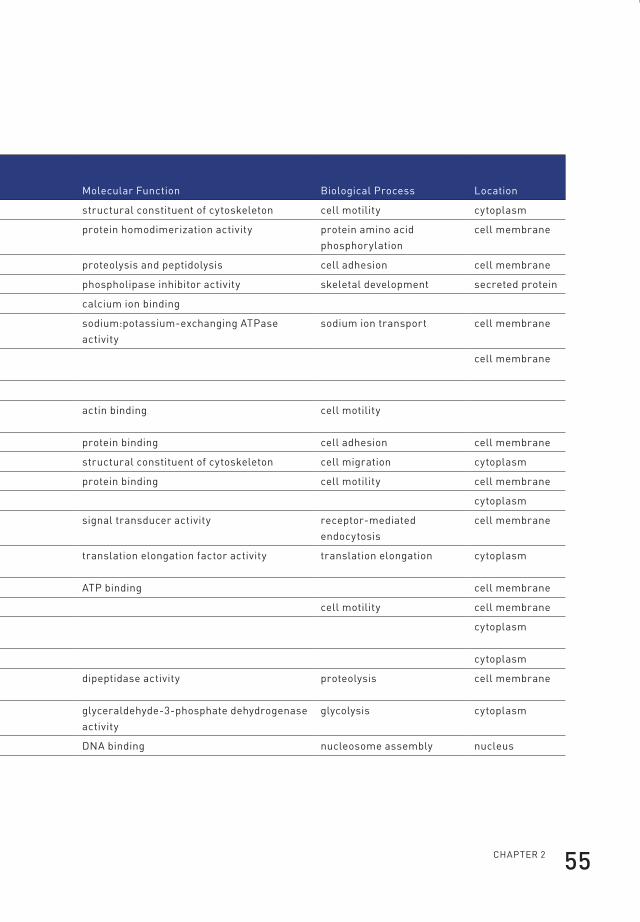
ChApteR 2 55
Table 2. List of 48 proteins identified by two or more peptides in the exosome fraction of
the PC346C cell line. Annotations are derived from the Gene Ontology database.
protein nameGene symbol
protein accession numbers
no. of unique peptides
% sequence coverage Molecular function biological process location
Actin, gamma 1 ACtG1 ipi00021440 15 40.30 structural constituent of cytoskeleton cell motility cytoplasm
ADAM metallopeptidase domain 10 ADAM10 ipi00013897 3 3.88 protein homodimerization activity protein amino acid phosphorylation
cell membrane
ADAM metallopeptidase domain 15 ADAM15 ipi00013302 4 6.39 proteolysis and peptidolysis cell adhesion cell membrane
Annexin A2 AnXA2 ipi00418169 7 24.90 phospholipase inhibitor activity skeletal development secreted protein
Annexin A6 AnXA6 ipi00002459 3 7.20 calcium ion binding
Atpase, na+/k+ transporting, alpha 1 polypeptide
Atp1A1 ipi00006482 5 5.96 sodium:potassium-exchanging Atpase activity
sodium ion transport cell membrane
brain abundant, membrane attached signal protein 1
bAsp1 ipi00299024 4 40.10 cell membrane
Chromosome 1 open reading frame 58 C1orf58 ipi00065500 2 10.70
Capping protein (actin filament) muscle Z-line, alpha 1
CApZA1 ipi00005969 2 7.69 actin binding cell motility
CD151 molecule (tetraspanin 24) CD151 ipi00298851 2 5.93 protein binding cell adhesion cell membrane
CD2-associated protein CD2Ap ipi00412771 6 11.60 structural constituent of cytoskeleton cell migration cytoplasm
CD9 molecule CD9 ipi00215997 3 15.40 protein binding cell motility cell membrane
Chromatin modifying protein 4b ChMp4b ipi00025974 2 8.93 cytoplasm
Clathrin, heavy chain 1 CltC ipi00024067 10 6.81 signal transducer activity receptor-mediated endocytosis
cell membrane
eukaryotic translation elongation factor 1 alpha 1
eef1A1 ipi00396485 14 37.20 translation elongation factor activity translation elongation cytoplasm
eh domain-containing protein 1 ehD1 ipi00017184 2 5.06 Atp binding cell membrane
f11 receptor f11R ipi00001754 5 16.40 cell motility cell membrane
family with sequence similarity 125, member A
fAM125A ipi00744702 3 16.10 cytoplasm
formin binding protein 1-like fnbp1l ipi00015580 2 3.47 cytoplasm
folate hydrolase (prostate-specific membrane antigen) 1
fOlh1 ipi00028514 7 12.30 dipeptidase activity proteolysis cell membrane
Glyceraldehyde-3-phosphate dehydrogenase
GApDh ipi00219018 3 14.00 glyceraldehyde-3-phosphate dehydrogenase activity
glycolysis cytoplasm
histone cluster 1, h1c hist1h1C ipi00217465 2 10.30 DnA binding nucleosome assembly nucleus
Flip_Jansen.indd 55 30-7-2013 8:43:44
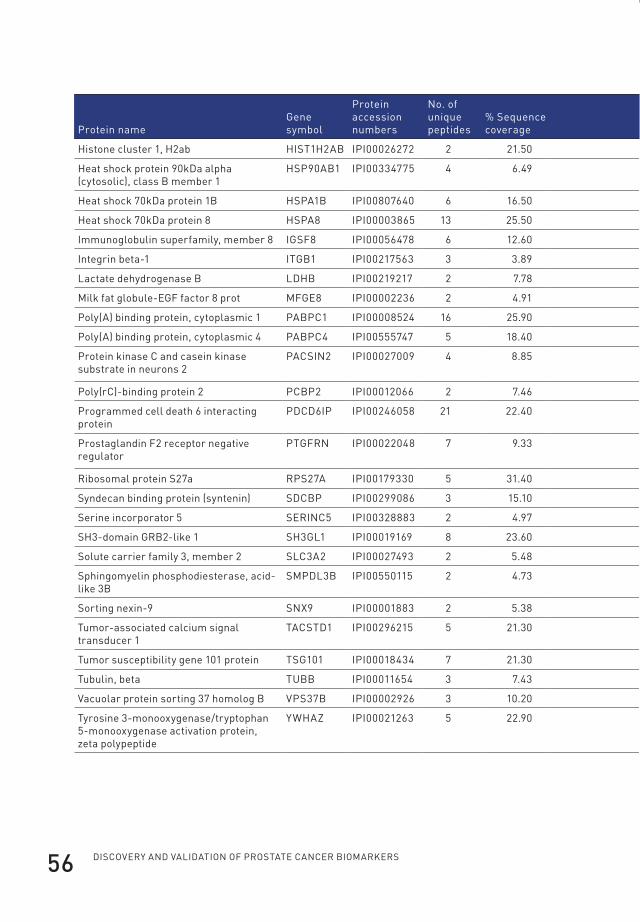
Discovery anD valiDation of prostate cancer biomarkers56
protein nameGene symbol
protein accession numbers
no. of unique peptides
% sequence coverage Molecular function biological process location
histone cluster 1, h2ab hist1h2Ab ipi00026272 2 21.50 DnA binding nucleosome assembly nucleus
heat shock protein 90kDa alpha (cytosolic), class b member 1
hsp90Ab1 ipi00334775 4 6.49 unfolded protein binding response to unfolded protein cytoplasm
heat shock 70kDa protein 1b hspA1b ipi00807640 6 16.50 unfolded protein binding anti-apoptosis cytoplasm
heat shock 70kDa protein 8 hspA8 ipi00003865 13 25.50 Atpase activity protein folding cytoplasm
immunoglobulin superfamily, member 8 iGsf8 ipi00056478 6 12.60 protein binding cell motility cell membrane
integrin beta-1 itGb1 ipi00217563 3 3.89 protein heterodimerization activity cell migration cell membrane
lactate dehydrogenase b lDhb ipi00219217 2 7.78 l-lactate dehydrogenase activity anaerobic glycolysis cytoplasm
Milk fat globule-eGf factor 8 prot MfGe8 ipi00002236 2 4.91 cell adhesion cell membrane
poly(A) binding protein, cytoplasmic 1 pAbpC1 ipi00008524 16 25.90 translation activator activity mRnA stabilization cytoplasm
poly(A) binding protein, cytoplasmic 4 pAbpC4 ipi00555747 5 18.40 protein / RnA binding RnA processing cytoplasm
protein kinase C and casein kinase substrate in neurons 2
pACsin2 ipi00027009 4 8.85 transporter activity intracellular protein transport
cytoplasm
poly(rC)-binding protein 2 pCbp2 ipi00012066 2 7.46 protein / RnA binding mRnA metabolic process cytoplasm
programmed cell death 6 interacting protein
pDCD6ip ipi00246058 21 22.40 signal transducer activity apoptosis cytoplasm
prostaglandin f2 receptor negative regulator
ptGfRn ipi00022048 7 9.33 protein binding negative regulation of protein biosynthetic process
cell membrane
Ribosomal protein s27a Rps27A ipi00179330 5 31.40 structural constituent of ribosome translation cytoplasm
syndecan binding protein (syntenin) sDCbp ipi00299086 3 15.10 protein heterodimerization activity cell migration cell membrane
serine incorporator 5 seRinC5 ipi00328883 2 4.97 cell membrane
sh3-domain GRb2-like 1 sh3Gl1 ipi00019169 8 23.60 protein binding signal transduction cell membrane
solute carrier family 3, member 2 slC3A2 ipi00027493 2 5.48 catalytic activity amino acid transport cell membrane
sphingomyelin phosphodiesterase, acid-like 3b
sMpDl3b ipi00550115 2 4.73 hydrolase activity carbohydrate metabolism secreted protein
sorting nexin-9 snX9 ipi00001883 2 5.38 protein binding protein localization
tumor-associated calcium signal transducer 1
tACstD1 ipi00296215 5 21.30 cell membrane
tumor susceptibility gene 101 protein tsG101 ipi00018434 7 21.30 transcription corepressor activity regulation of cell growth cytoplasm
tubulin, beta tUbb ipi00011654 3 7.43 structural constituent of cytoskeleton spindle assembly
vacuolar protein sorting 37 homolog b vps37b ipi00002926 3 10.20
tyrosine 3-monooxygenase/tryptophan 5-monooxygenase activation protein, zeta polypeptide
yWhAZ ipi00021263 5 22.90 transcription factor binding signal transduction cytoplasm
Flip_Jansen.indd 56 30-7-2013 8:43:44

ChApteR 2 57
protein nameGene symbol
protein accession numbers
no. of unique peptides
% sequence coverage Molecular function biological process location
histone cluster 1, h2ab hist1h2Ab ipi00026272 2 21.50 DnA binding nucleosome assembly nucleus
heat shock protein 90kDa alpha (cytosolic), class b member 1
hsp90Ab1 ipi00334775 4 6.49 unfolded protein binding response to unfolded protein cytoplasm
heat shock 70kDa protein 1b hspA1b ipi00807640 6 16.50 unfolded protein binding anti-apoptosis cytoplasm
heat shock 70kDa protein 8 hspA8 ipi00003865 13 25.50 Atpase activity protein folding cytoplasm
immunoglobulin superfamily, member 8 iGsf8 ipi00056478 6 12.60 protein binding cell motility cell membrane
integrin beta-1 itGb1 ipi00217563 3 3.89 protein heterodimerization activity cell migration cell membrane
lactate dehydrogenase b lDhb ipi00219217 2 7.78 l-lactate dehydrogenase activity anaerobic glycolysis cytoplasm
Milk fat globule-eGf factor 8 prot MfGe8 ipi00002236 2 4.91 cell adhesion cell membrane
poly(A) binding protein, cytoplasmic 1 pAbpC1 ipi00008524 16 25.90 translation activator activity mRnA stabilization cytoplasm
poly(A) binding protein, cytoplasmic 4 pAbpC4 ipi00555747 5 18.40 protein / RnA binding RnA processing cytoplasm
protein kinase C and casein kinase substrate in neurons 2
pACsin2 ipi00027009 4 8.85 transporter activity intracellular protein transport
cytoplasm
poly(rC)-binding protein 2 pCbp2 ipi00012066 2 7.46 protein / RnA binding mRnA metabolic process cytoplasm
programmed cell death 6 interacting protein
pDCD6ip ipi00246058 21 22.40 signal transducer activity apoptosis cytoplasm
prostaglandin f2 receptor negative regulator
ptGfRn ipi00022048 7 9.33 protein binding negative regulation of protein biosynthetic process
cell membrane
Ribosomal protein s27a Rps27A ipi00179330 5 31.40 structural constituent of ribosome translation cytoplasm
syndecan binding protein (syntenin) sDCbp ipi00299086 3 15.10 protein heterodimerization activity cell migration cell membrane
serine incorporator 5 seRinC5 ipi00328883 2 4.97 cell membrane
sh3-domain GRb2-like 1 sh3Gl1 ipi00019169 8 23.60 protein binding signal transduction cell membrane
solute carrier family 3, member 2 slC3A2 ipi00027493 2 5.48 catalytic activity amino acid transport cell membrane
sphingomyelin phosphodiesterase, acid-like 3b
sMpDl3b ipi00550115 2 4.73 hydrolase activity carbohydrate metabolism secreted protein
sorting nexin-9 snX9 ipi00001883 2 5.38 protein binding protein localization
tumor-associated calcium signal transducer 1
tACstD1 ipi00296215 5 21.30 cell membrane
tumor susceptibility gene 101 protein tsG101 ipi00018434 7 21.30 transcription corepressor activity regulation of cell growth cytoplasm
tubulin, beta tUbb ipi00011654 3 7.43 structural constituent of cytoskeleton spindle assembly
vacuolar protein sorting 37 homolog b vps37b ipi00002926 3 10.20
tyrosine 3-monooxygenase/tryptophan 5-monooxygenase activation protein, zeta polypeptide
yWhAZ ipi00021263 5 22.90 transcription factor binding signal transduction cytoplasm
Flip_Jansen.indd 57 30-7-2013 8:43:44
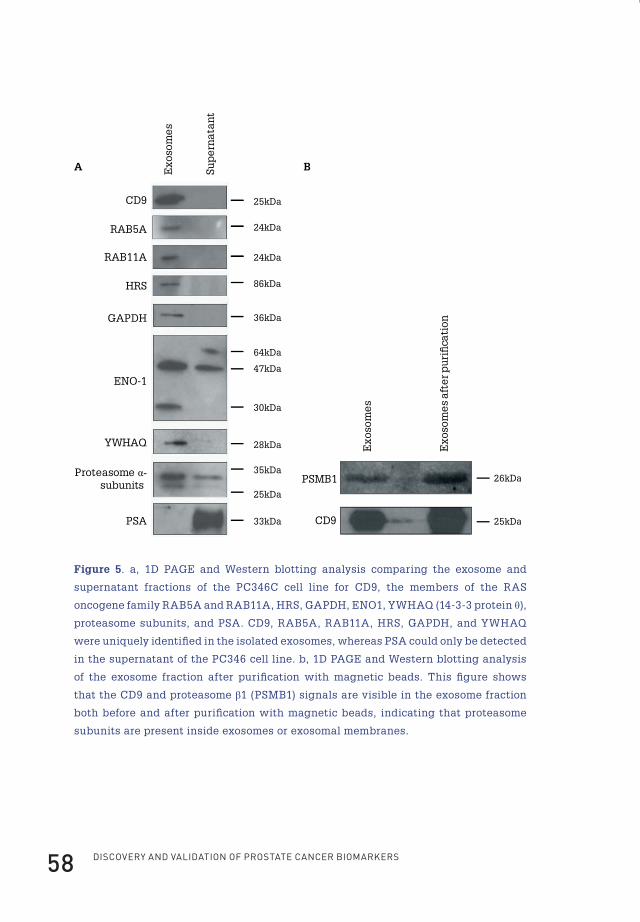
Discovery anD valiDation of prostate cancer biomarkers58
36kDa
Exo
som
es
Sup
ern
atan
t
GAPDH
ENO-147kDa
30kDa
64kDa
28kDaYWHAQ
35kDa
25kDa
Proteasome α-subunits
PSA 33kDa
25kDaCD9
A B
Exo
som
es
Exo
som
es
afte
r pu
ri�
cati
on
26kDa
25kDa
PSMB1
CD9
86kDaHRS
RAB11A
RAB5A
24kDa
24kDa
Figure 5. a, 1D PAGE and Western blotting analysis comparing the exosome and
supernatant fractions of the PC346C cell line for CD9, the members of the RAS
oncogene family RAB5A and RAB11A, HRS, GAPDH, ENO1, YWHAQ (14-3-3 protein θ),
proteasome subunits, and PSA. CD9, RAB5A, RAB11A, HRS, GAPDH, and YWHAQ
were uniquely identified in the isolated exosomes, whereas PSA could only be detected
in the supernatant of the PC346 cell line. b, 1D PAGE and Western blotting analysis
of the exosome fraction after purification with magnetic beads. This figure shows
that the CD9 and proteasome β1 (PSMB1) signals are visible in the exosome fraction
both before and after purification with magnetic beads, indicating that proteasome
subunits are present inside exosomes or exosomal membranes.
Flip_Jansen.indd 58 30-7-2013 8:43:45
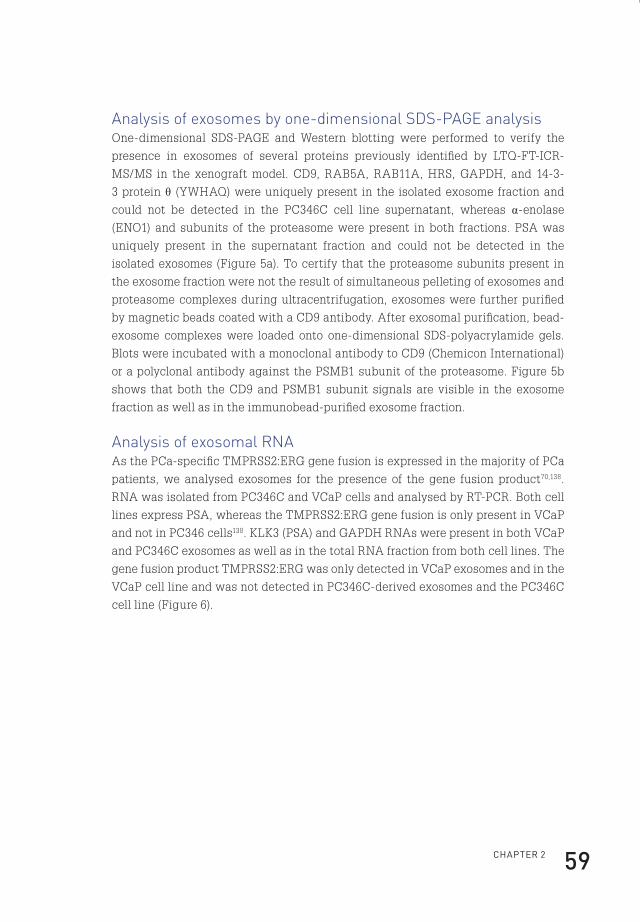
ChApteR 2 59
Analysis of exosomes by one-dimensional SDS-PAGE analysisOne-dimensional SDS-PAGE and Western blotting were performed to verify the
presence in exosomes of several proteins previously identified by LTQ-FT-ICR-
MS/MS in the xenograft model. CD9, RAB5A, RAB11A, HRS, GAPDH, and 14-3-
3 protein θ (YWHAQ) were uniquely present in the isolated exosome fraction and
could not be detected in the PC346C cell line supernatant, whereas α-enolase
(ENO1) and subunits of the proteasome were present in both fractions. PSA was
uniquely present in the supernatant fraction and could not be detected in the
isolated exosomes (Figure 5a). To certify that the proteasome subunits present in
the exosome fraction were not the result of simultaneous pelleting of exosomes and
proteasome complexes during ultracentrifugation, exosomes were further purified
by magnetic beads coated with a CD9 antibody. After exosomal purification, bead-
exosome complexes were loaded onto one-dimensional SDS-polyacrylamide gels.
Blots were incubated with a monoclonal antibody to CD9 (Chemicon International)
or a polyclonal antibody against the PSMB1 subunit of the proteasome. Figure 5b
shows that both the CD9 and PSMB1 subunit signals are visible in the exosome
fraction as well as in the immunobead-purified exosome fraction.
Analysis of exosomal RNAAs the PCa-specific TMPRSS2:ERG gene fusion is expressed in the majority of PCa
patients, we analysed exosomes for the presence of the gene fusion product70,138.
RNA was isolated from PC346C and VCaP cells and analysed by RT-PCR. Both cell
lines express PSA, whereas the TMPRSS2:ERG gene fusion is only present in VCaP
and not in PC346 cells138. KLK3 (PSA) and GAPDH RNAs were present in both VCaP
and PC346C exosomes as well as in the total RNA fraction from both cell lines. The
gene fusion product TMPRSS2:ERG was only detected in VCaP exosomes and in the
VCaP cell line and was not detected in PC346C-derived exosomes and the PC346C
cell line (Figure 6).
Flip_Jansen.indd 59 30-7-2013 8:43:45
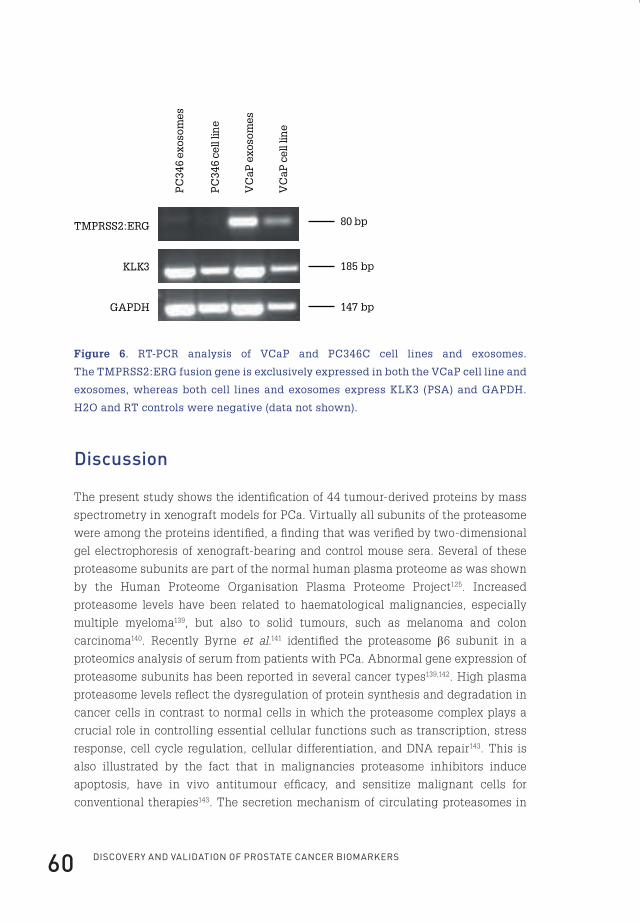
Discovery anD valiDation of prostate cancer biomarkers60
TMPRSS2:ERG
KLK3
GAPDH
PC
346
exos
omes
PC
346
cell
line
VC
aP e
xoso
mes
VC
aP c
ell l
ine
80 bp
185 bp
147 bp
Figure 6. RT-PCR analysis of VCaP and PC346C cell lines and exosomes.
The TMPRSS2:ERG fusion gene is exclusively expressed in both the VCaP cell line and
exosomes, whereas both cell lines and exosomes express KLK3 (PSA) and GAPDH.
H2O and RT controls were negative (data not shown).
Discussion
The present study shows the identification of 44 tumour-derived proteins by mass
spectrometry in xenograft models for PCa. Virtually all subunits of the proteasome
were among the proteins identified, a finding that was verified by two-dimensional
gel electrophoresis of xenograft-bearing and control mouse sera. Several of these
proteasome subunits are part of the normal human plasma proteome as was shown
by the Human Proteome Organisation Plasma Proteome Project125. Increased
proteasome levels have been related to haematological malignancies, especially
multiple myeloma139, but also to solid tumours, such as melanoma and colon
carcinoma140. Recently Byrne et al.141 identified the proteasome β6 subunit in a
proteomics analysis of serum from patients with PCa. Abnormal gene expression of
proteasome subunits has been reported in several cancer types139,142. High plasma
proteasome levels reflect the dysregulation of protein synthesis and degradation in
cancer cells in contrast to normal cells in which the proteasome complex plays a
crucial role in controlling essential cellular functions such as transcription, stress
response, cell cycle regulation, cellular differentiation, and DNA repair143. This is
also illustrated by the fact that in malignancies proteasome inhibitors induce
apoptosis, have in vivo antitumour efficacy, and sensitize malignant cells for
conventional therapies143. The secretion mechanism of circulating proteasomes in
Flip_Jansen.indd 60 30-7-2013 8:43:45
ChApteR 2 61
cancer patients and healthy donors is still unknown. Elevated proteasome
concentrations in culture media of human leukemic cell lines have been reported,
suggesting a proteasome secretion mechanism by tumour cells144. In this study, we
have shown, using native gel electrophoresis and sandwich ELISA of sera from
xenografted and control male mice, that at least part of the circulating proteasome
subunits are present as proteasome complexes. This is in line with the observation
that circulating proteasomes are intact and enzymatically active in plasma from
healthy donors and patients with autoimmune disease or leukaemia145,146. About half
of the tumour-derived proteins circulating in the xenograft-bearing mice, including
proteasome subunits, are not secreted proteins but are annotated as being
cytoplasmic. One possible explanation for their presence could be the occurrence of
necrosis or apoptosis in the xenografts, a well known characteristic of most cancers.
Although we did not find evidence for necrosis in the xenografts used for this study,
protein secretion via cell death cannot be excluded. Microarray expression data of
the identified cytoplasmic proteins showed that these indeed corresponded to genes
that are highly expressed in PCa. However, none of the proteins of the 100 most
highly expressed genes in PCa (such as ribosomal and cytoskeletal genes) have
been identified in the circulation of the xenograft-bearing mice (data not shown).
One would expect to detect the proteins of these highly expressed genes if these are
the result of tumour apoptosis. Although this does not rule out the contribution of
apoptosis or necrosis, this points toward certain specific processes responsible for
the secretion of cytoplasmic proteins. We hypothesized that one such specific
process could be the secretion of proteins via exosomes. A literature search revealed
that 13 of the 44 (30%) identified proteins in the xenograft model had earlier been
identified in exosomes among which was also the β3 subunit of the proteasome
(Table 1). First, we showed that the human PCa cell line PC346C is indeed capable
of the secretion of exosomes (Figure 4a). Second, LTQ-FT-ICR-MS/MS and Western
blotting analyses of isolated exosomes showed the presence of mainly cytoplasmic
proteins, including GAPDH, fructose-bisphosphate aldolase A, ENO1, lactate
dehydrogenase B, 14-3-3 protein θ, and proteasome subunits (see Table 2 and Figure
5a). Also the exosomal marker CD9 and several proteins up-regulated in PCa, among
which was FOLH1, were identified. In addition RAB5A, RAB11A, and HRS, proteins
involved in vesicular and endosomal trafficking, were present in the exosome
fraction as shown by Western blotting (Figure 5a). The detection of HRS by Western
blotting confirmed the identification of HRS by LTQ-FT-ICR-MS/MS at a setting of
one peptide per protein (data not shown). To argue against the fact that the
proteasome signal in the exosome fraction was the result of simultaneous pelleting
of exosomes and proteasome complexes, exosomes were further purified by
immunoaffinity precipitation utilizing anti-CD9 antibody-coated magnetic beads.
Flip_Jansen.indd 61 30-7-2013 8:43:45

Discovery anD valiDation of prostate cancer biomarkers62
This strengthened our finding that proteasomes are present inside exosomes and/or
tightly associated with exosomal membranes or external macromolecules. Our
observation is in agreement with Almeida et al.147 and Dong et al.148 who showed the
presence of proteasomes in late endosomes from which exosomes are formed by
invagination and budding. To our knowledge, the present study is the first to
describe a specific clearance mechanism for proteasome subunits in cancer cells,
providing a possible explanation for the increased proteasome serum levels that
have been observed in several types of cancer patients. An important observation is
that PSA was not detectable in the exosome pellets but was abundant in the
supernatant. This means that we experimentally separated protein secretion via
two different secretion pathways: (i) the typical secretion of signal peptide-
containing proteins via the rough endoplasmic reticulum and Golgi apparatus
secretory pathway and (ii) the multivesicular body-exosome secretion route. This is
in line with our observation that of a total of 48 proteins identified in the exosome
fraction the majority are annotated as cytoplasmic whereas only two proteins are
annotated as secreted according to the Gene Ontology database. In contrast, 10 of
44 tumour-derived proteins identified in the serum of xenograft-bearing mice are
annotated as secreted proteins (Tables 1 and 2). Thus, it seems that several of the
cytoplasmic proteins, including proteasome subunits, present in xenograft sera are
at least partly secreted via the exosome pathway in contrast with proteins such as
PSA that are typically secreted via the Golgi consecutive secretory pathway. The
putative in vivo analogues of exosomes could be prostasomes, secreted vesicles in
human seminal fluid, secreted by epithelial prostate cells. Proteomics analysis of
human prostasomes revealed 139 proteins, showing a small overlap (7 of 139) with
the proteins identified in exosomes in the present study. Among the proteins
identified in prostasomes were several glycolysis-related enzymes, heat-shock
proteins, and proteins of the annexin family149. In contrast, no proteasome subunits
or members of the tetraspanin family were identified in prostasomes isolated from
seminal fluid. It was recently reported by Valadi et al.128 that exosomes not only
contain proteins but also mRNAs, suggesting a potential novel mechanism of
genetic exchange between cells. By RNase and trypsin treatment of the isolated
exosomes it was confirmed that the mRNA was indeed confined within exosomes
and not on external structures or macromolecules. This prompted us to isolate
exosomal RNA from the PC346C and VCaP cell lines. Of these cell lines it has been
shown that the VCaP cell line expresses the TMPRSS2:ERG fusion gene, whereas
PC346C does not70,138. RT-PCR analysis correctly showed that the PCa-specific
TMPRSS2:ERG fusion gene is present in exosomal RNA from the VCaP cell line
whereas it is absent in exosomal RNA from the PC346C cell line. As it has been
reported that exosomes exist in human serum, prostate-specific proteins present in
Flip_Jansen.indd 62 30-7-2013 8:43:45
ChApteR 2 63
the membrane of exosomes, such as FOLH1, could be used to isolate prostate-
specific exosomes to discover and validate new markers for PCa150. For example, this
could lead to the development of a serum test for RNA transcribed from the
TMPRSS2:ERG gene fusion. The specific role of exosomes in cancer is still not fully
understood, and involvement in processes such as cell-cell communication and
antigen representation has been suggested126-128. The content of exosomes may
represent a fingerprint of the cytoplasm of the cancer cell and may establish a
unique environment that allows for the occurrence of specific processes. For
example, Stoeck et al.151 showed that exosomes may be a platform for ectodomain
shedding of transmembrane proteins. In the present study, the presence of a distinct
30-kDa ENO1 band specifically present in the exosome fraction may point toward
the occurrence of unique proteolytic activity inside exosomes (Figure 5a). It has
recently been suggested that exosomes secreted from cancer cells support immune
escape as well as tumour growth127. Also exosomes have been reported to induce
angiogenesis and to transfer metastatic activity from highly to poorly metastatic
tumour cells152. Of the proteins identified in the exosomes in the present study,
CD151 and the metalloproteinases ADAM10 and ADAM15 have been linked to
tumour invasiveness and prognosis153-155. The proteasomes identified in exosomes
may harbour a similar function. In conclusion, the present study shows that,
although their function is unclear, exosomes offer unique possibilities for PCa
biomarker discovery as they give insight information about the interior of the cancer
cell both on the protein and RNA levels. Future studies will focus on the validation
of several identified exosomal proteins as well as on the detection of exosomal RNA,
including the TMPRSS2:ERG and other gene fusion transcripts in exosomes isolated
from patient populations, to establish new biomarkers for PCa diagnosis and
prognosis.
AcknowledgmentsWe are indebted to Dr. Irmgard Schwarte-Waldhoff (Department of Internal Medicine,
Immunologisch-Molekularbiologisches Labor, Knappschaftskrankenhaus,
University of Bochum, Bochum, Germany) and Dr. Hans Romijn (Department of
Urology) for advice throughout this project. We thank Corrina de Ridder, Susan
Reneman (Department of Urology), and Dr. Joost Hegmans (Department of
Pulmonary Medicine) for technical assistance and advice.
FundingThis work was supported by the Netherlands Genomics Initiative (Horizon
Breakthrough Project 050-71-106), the Netherlands Proteomic Centre, and the
Adessium Foundation.
Flip_Jansen.indd 63 30-7-2013 8:43:45

Flip_Jansen.indd 64 30-7-2013 8:43:45

cHapter 3
cHap
ter
3
Flip_Jansen.indd 65 30-7-2013 8:43:45

cHapter 3
profilinG of antiboDy proDuction aGainst xenoGraft-releaseD proteins by protein microarrays Discovers prostate cancer markers
Journal of proteome research. 2012 february 3;11(2):728-35*
f.H. Jansen1
a. van rijswijk1
W. teubel1
W.m. van Weerden1
s. reneman1
G.J. van den bemd1
m.J. roobol1
c.H. bangma1
f.J.t. staal2
G. Jenster1
1 Department of Urology, erasmus MC, Rotterdam; 2 Department of immunology, erasmus MC, Rotterdam, the netherlands
* Reprinted with permission from the Journal of proteome Research
Flip_Jansen.indd 66 30-7-2013 8:43:45
ChApteR 3 67
abstractThis study describes a novel xenograft-based biomarker discovery platform
and proves its usefulness in the discovery of serum markers for prostate cancer.
By immunizing immuno-competent mice with serum from nude mice bearing
prostate cancer xenografts, an antibody response against xenograft-derived
antigens was elicited. By probing protein microarrays with serum from immunized
mice, several prostate cancer-derived antigens were identified, of which a subset
was successfully retrieved in serum from mice bearing prostate cancer xenografts
and prevalidated in human serum samples of prostate cancer patients. Among the
discovered and validated proteins were the members of the TAM receptor family
(TYRO3, AXL, and MERTK), ACY1, and PSMA1. In conclusion, this novel method
allows for the identification of low abundant cancer-derived serum proteins,
circumventing dynamic range and host-response issues in standard patient cohort
proteomics comparisons.
introduction
For several decades, prostate specific antigen (PSA) is the “gold standard” biomarker
for the detection of prostate cancer (PCa)13. However, additional biomarkers are
urgently needed, as PSA lacks diagnostic specificity and prognostic value, causing
an enormous increase in unnecessary biopsies and overtreatment of low-risk PCa
patients26. A possible approach to discover new serum-shed markers for PCa is by
screening large series of human serum samples for tumour-associated proteins.
However, this approach is hampered by the large variability and complexity of
protein content, with a vast dynamic range in protein concentrations (>1010) and
dominance of a small number of high abundant proteins that constitute 99% of
the entire protein content, masking the detection of other proteins107. Due to these
high abundant proteins and unequal protein concentrations, current technologies,
capable of analyzing protein concentrations spanning four orders of magnitude,
can only detect proteins ranging over two orders of magnitude, missing the lower
abundant proteins (such as PSA) which are likely to constitute the next generation
of biomarkers. In general, studies exploiting this approach so far have only reported
changes in relatively abundant and/or acute phase proteins156-159.
To evade these dilemmas, xenograft model systems have been exploited to
discover new biomarkers, by comparing serum of tumour-bearing with serum of
non-tumour-bearing mice124,160,161. Although more specific and with less variability,
this approach is still hampered by serum protein complexity and with standard
liquid chromatography mass spectroscopy (LC-MS) technology will only result in
detection of high abundant proteins.
Flip_Jansen.indd 67 30-7-2013 8:43:45
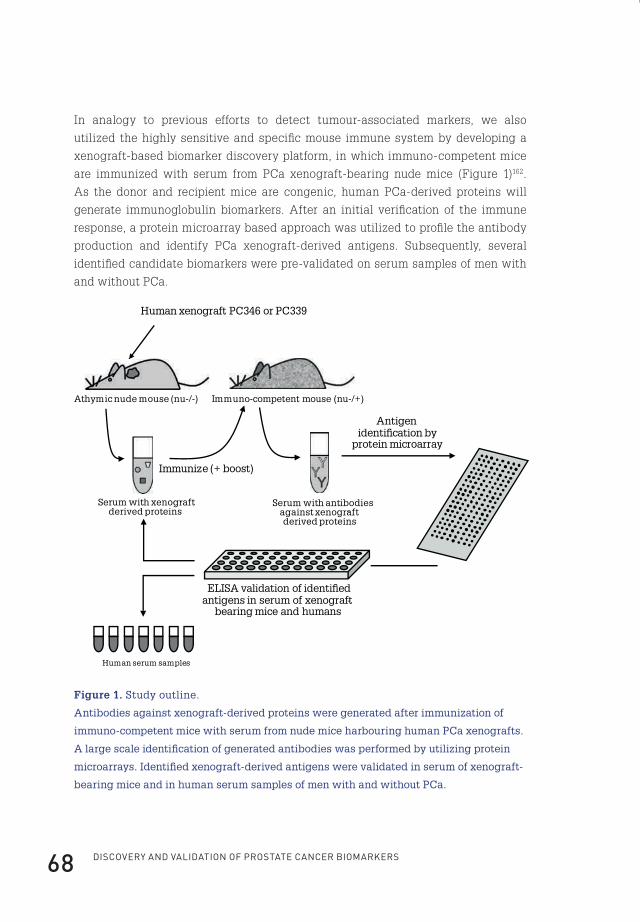
Discovery anD valiDation of prostate cancer biomarkers68
In analogy to previous efforts to detect tumour-associated markers, we also
utilized the highly sensitive and specific mouse immune system by developing a
xenograft-based biomarker discovery platform, in which immuno-competent mice
are immunized with serum from PCa xenograft-bearing nude mice (Figure 1)162.
As the donor and recipient mice are congenic, human PCa-derived proteins will
generate immunoglobulin biomarkers. After an initial verification of the immune
response, a protein microarray based approach was utilized to profile the antibody
production and identify PCa xenograft-derived antigens. Subsequently, several
identified candidate biomarkers were pre-validated on serum samples of men with
and without PCa.
Human xenograft PC346 or PC339
Athymic nude mouse (nu-/-) Immuno-competent mouse (nu-/+)
Serum with xenograft-derived proteins
Immunize (+ boost)
Serum with antibodies against xenograft-derived proteins
Antigen identi�cation by
protein microarray
ELISA validation of identi�ed antigens in serum of xenograft-
bearing mice and humans
Human serum samples
Figure 1. Study outline.
Antibodies against xenograft-derived proteins were generated after immunization of
immuno-competent mice with serum from nude mice harbouring human PCa xenografts.
A large scale identification of generated antibodies was performed by utilizing protein
microarrays. Identified xenograft-derived antigens were validated in serum of xenograft-
bearing mice and in human serum samples of men with and without PCa.
Flip_Jansen.indd 68 30-7-2013 8:43:46
ChApteR 3 69
methods
Immunization protocolAn overview of the animal experiments is given in Figure 1. Human PCa xenografts
were grown in immune-incompetent athymic male nude (nu/nu) BALB/c mice
(n=3 for each xenograft, Taconic, Ry, Denmark)123,124. We utilized the human PCa
cell lines PC346 (androgen-sensitive) and PC339 (androgen-independent). Specific
characteristics of both cell lines have been described previously129. Prior to tumour
inoculation, control serum was collected by retro-orbital punction. Tumour-bearing
mice were sacrificed when tumours reached a volume of 500-700 mm3 and blood was
collected (annotated as PC346 mouse serum and PC339 mouse serum, respectively).
A portion of the collected serum was depleted from high-abundant serum proteins.
A portion of the collected serum was depleted from high-abundant serum proteins
utilizing Multi Affinity Removal Spin Cartridges (Agilent Technologies, Wilmington,
DE, USA) according to manufacturer’s instructions. Depleted serum samples were
concentrated on 5 kDa cut off ultracentrifugation columns (Agilent Technologies,
Wilmington, DE, USA). All samples were stored at -80°C.
Ten immuno-competent male nude (nu/+) BALB/c mice were immunized with
pools (n=3) of either depleted control serum (two mice, annotated as control boost),
depleted PC346 serum (three mice, annotated as PC346 boost depleted), depleted
PC339 serum (three mice, annotated as PC339 boost depleted), full PC346 serum (one
mouse, annotated as PC346 boost full) or full PC339 serum (one mouse, annotated
as PC339 boost full). Prior to immunization, preimmune serum was collected. For
immunization, mice were subcutaneously injected with 100 µl of a mixture of 10 µg
serum and 50 µl complete Freund’s adjuvant. After 3 weeks a boost-immunization
was performed with a mixture of 10 µg serum and 50 µl incomplete Freund’s
adjuvant. After 6 weeks a second boost-immunization with full serum derived from
PC346 or PC339 bearing mice was performed in two mice previously immunized
with either depleted PC346 or PC339 serum (annotated as PC346 depleted-full or
PC339 depleted-full, respectively). Four weeks after the last boost-immunization,
mice were sacrificed and serum was collected. The protocol was approved by the
Animal Experiments Committee under the national Experiments on Animals Act
(DEC EUR 310; OZP102-04-03 and EUR 593; OZP102-05-12) and adhered to the rules
laid down in this national law that serves the implementation of “Guidelines on
the protection of experimental animals” by the council of Europe under Directive
86/609/EC.
Flip_Jansen.indd 69 30-7-2013 8:43:46

Discovery anD valiDation of prostate cancer biomarkers70
Mouse serum concentrationFor several experiments, 15 times concentrated mouse serum was utilized. This
was obtained by concentration of 4,5 mL of either pooled control mouse serum or
serum from mice inoculated with a PC346 or PC339 xenografts. Concentration was
performed on 5 kDa cut off ultracentrifugation columns (Agilent Technologies). All
samples were stored at -80°C.
One-dimensional SDS-PAGE analysis and western blottingFor one-dimensional electrophoresis 10 µg of PC346 and LNCaP cell line protein
extracts was mixed with Laemmli sample buffer (1:1 ratio) and loaded onto a 10%
SDS-PAGE gel163. Gels were transferred onto a Protran nitrocellulose membrane for
western blotting. Blots were developed with 1:250 diluted serum samples derived
from either control mice or mice immunized with serum from mice bearing PC346 or
PC339 xenografts. Blots were exposed for equal amounts of time.
Measurement of serum PSA concentrations and detection of antibodies against PSAFrom each mouse utilized in the immunization protocol (normal nude mice, and
mice grafted with a PC339 or PC346 xenograft) 10 µl of serum was taken to measure
serum PSA concentrations. PSA concentrations were determined by routine clinical
chemistry applying the Access Hybritech Total PSA assay (Beckman-Coulter, Inc.,
Fullerton, CA) which has a lower detection limit of 0.10 ng/ml.
To detect antibodies directed against PSA in mice immunized with serum from mice
inoculated with a PC346 or PC339 xenograft, 96-well plates were coated with 300 ng
of purified PSA (Sigma-Aldrich, Milan, Italy) diluted in 0.1 M carbonate-bicarbonate
buffer (pH 9.5) and incubated overnight at 4ºC. After washing with PBS-Tween
(0.05%), plates were blocked for 1 hour by addition of a 1% BSA/PBS-Tween (0.05%)
solution and incubated at 37 ºC. Thereafter, serum samples diluted in PBS-Tween
were added and incubated for 1 hour at 37 ºC. As a reference standard, a dilution
of a polyclonal rabbit antibody directed against PSA (DakoCytomation, Glostrup,
Denmark) was utilized. Then, a 1:5,000 solution in 0.5% BSA/PBS-Tween of HRP
conjugated goat anti-rabbit IgG or goat-anti mouse antibody (DakoCytomation) was
added and samples were incubated for 1 hr in the dark. To reveal HRP activity, 50
mM phosphate / 25 mM citrate buffer, pH 5.0 containing 4 mM o-phenylenediamine
and 0.0015% H2O2 was added to the wells. After 15 min, the reaction was stopped
with 2.5 M sulphuric acid. Absorbance values were measured at 492 nm and PSA
antibody levels determined as compared to the dilution series of the commercial
PSA polyclonal rabbit antibody reference. All samples were measured in duplo.
Flip_Jansen.indd 70 30-7-2013 8:43:46

ChApteR 3 71
Detection of antibodies against human PCa xenograft-derived antigensFor immune response profiling of immunized mice ProtoArrays were utilized (Human
Protein Microarray version 4.0, Invitrogen Life Technologies, Carlsbad, CA). The
4.0 version contains approximately 8,000 unique human proteins immobilized on
a hydrophobic surface. Proteins are expressed as GST fusion proteins, purified and
double spotted within distinct subarrays with a number of assay-specific positive
and negative controls. ProtoArrays were developed according to the protocol of the
manufacturer. In short, after blocking, arrays were incubated with serum 1:500
diluted in PBS with 1% BSA and 0.1% Tween. ProtoArrays were developed using
two pools both consisting of two serum samples obtained prior to immunization
(annotated preimmune (1) and (2)), a pool of two serum samples obtained from mice
immunized with depleted serum from mice without a xenograft (control boost), two
serum samples obtained from mice immunized with depleted serum from mice
carrying either a PC346 or PC339 xenograft (PC346 depleted and PC339 depleted,
respectively), two serum samples obtained from mice immunized with full serum
from mice carrying either a PC346 or PC339 xenograft (PC346 full and PC339 full,
respectively), and two serum samples obtained from mice immunized with depleted
and full serum from mice carrying either a PC346 or PC339 xenograft (annotated
as PC346 depleted-full and PC339 depleted-full, respectively). After 90 minutes at
4ºC, arrays were washed and incubated with Alexa Fluor 647 conjugated rabbit
anti-mouse IgG (H+L) (Invitrogen) 1:2,000 diluted in PBS-Tween with 1% BSA for
90 minutes at 4°C. As a control, one ProtoArray was developed without serum
incubation utilizing only the Alexa Fluor 647 conjugated rabbit anti-mouse IgG 2nd
antibody. After washing, arrays were dried and immediately scanned in a ScanArray
Express HT (Perkin Elmer, The Netherlands). Spot intensities were quantified using
Prospector Imager (version 4.0, Invitrogen) and ProtoArray Prospector (version 4.0.0,
Invitrogen). Spot signals were normalized per mean array intensity. Spots were
sorted based on their preferential expression in mice immunized with serum from
xenograft-bearing animals vs. their expression in preimmune serum and serum
from mice immunized with serum from non-xenograft bearing mice. Spots with a
normalized expression value of >6 in either the preimmune (1), preimmune (2) or
control boost samples were excluded as well as spots with a normalized expression
<2 in mice immunized with serum from xenograft-bearing animals. The normalized
expression value of one of the spots developed with serum from xenograft-bearing
animals was set to exceed a value of three. The ProtoArray data discussed in this
publication are MIAME (Minimum Information About a Microarray Experiment)
compliant, have been deposited in NCBI’s Gene Expression Omnibus and are
accessible through GEO Series accession number GSE16220 (http://www.ncbi.nlm.
nih.gov/geo/).
Flip_Jansen.indd 71 30-7-2013 8:43:46

Discovery anD valiDation of prostate cancer biomarkers72
Patient samplesSerum samples of men without PCa were obtained from the biorepository of
the Rotterdam arm of the ERSPC164. The medical ethical committee of the
Erasmus University Medical Centre approved the ERSPC study (MEC number
138.741/1994/152). All participants provided written informed consent. To exclude
the presence of PCa in these men (n=40), PSA serum concentrations had to be below
0.4 ng/ml and no tumour had to be detected after transrectal ultrasound-guided
needle biopsy (≥6 cores). To ensure the absence of PCa, men without PCa were
only selected if there was no evidence of PCa in a twelve year follow-up period.
Samples of men with histologically proven PCa (≥6 core biopsy) were obtained from
the Department of Urology at the Erasmus MC, Rotterdam. These consisted of men
(n=40) with localized PCa treated with radical prostatectomy and no evidence of
biochemical recurrence in the follow-up (minimal 5 years), men with localized PCa
treated with radical prostatectomy and biochemical recurrence in the follow-up
(n=40), and men with bone and/or lymph metastasis, evidenced by bone scan and/or
histologically proven, at the moment of blood draw (n=33). All radical prostatectomy
patients reached a PSA nadir of <0.1 ng/ml within three months after surgery.
Biochemical recurrence was defined as PSA level ≥0.3 ng/ml. Patient characteristics
are depicted in Table 1.
Table 1. Patient characteristics. General characteristics of patients used for a
pre-validation of candidate biomarkers. (RP=radical prostatectomy)
frequency (n)Mean age (years) (range)
Median psA (ng/ml) (range)
Median fU after Rp (months) (range)
no-pCa 40 59 (55-66) 0.2 (0.1-0.4) -
pCa non-recurrence
40 62 (51-74) 6.2 (0.8-65.7) 128 (66-160)
pCa recurrence 40 64 (50-72) 7.9 (0.3-33.1) 140 (70-185)
pCa metastasis 33 68 (50-91) 23.5 (0.1-2550) -
ELISA for quantification of proteasome subunitsProteasome concentrations were measured as previously described by Dutaud
et al. with some minor modifications134. Briefly, human or mouse serum (1:20 and
1:10 diluted with PBS containing 0.3% sodium citrate, respectively) or xenograft
protein extract was incubated for 1hr on a plate coated with a 1:4,500 dilution
of a monoclonal antibody against PSMA1 (clone MCP20, Biomol International).
After addition of a 1:1,500 solution of a rabbit anti-proteasome antibody (directed
Flip_Jansen.indd 72 30-7-2013 8:43:46

ChApteR 3 73
against beta subunits of the proteasome, PW8155, Biomol International) plates
were extensively washed with PBS-Tween buffer. Then, a 1:4,000 solution of HRP
conjugated goat anti-rabbit IgG (DakoCytomation) was added and the plate was
incubated for 1 hr in the dark. To reveal HRP activity, 50 mM phosphate / 25 mM
citrate buffer, pH 5.0 containing 4 mM o-phenylenediamine and 0.0015% H2O2 was
added to the wells. After 15 min, the reaction was stopped with 2.5 M sulphuric
acid. Absorbance values were measured at 492 nm. A standard curve using purified
human 20S proteasomes (Biomol International) was calculated using a computer
generated 4-PL curve-fit.
ELISA for quantification of ACY1Human serum (1:20 diluted with PBS containing 0.3% sodium citrate) or 15 times
concentrated mouse serum or xenograft protein extract was incubated for 1hr on a
plate coated overnight with a 1:500 dilution of a mouse monoclonal antibody against
ACY1 (clone 4F1-B7, Abnova, Taipei, Taiwan). Mouse serum (control as well as
serum from xenografted mice) was concentrated to enhance the ELISA signal. After
addition of a 1:400 solution of a polyclonal antibody (R&D Systems) directed against
human ACY1 wells were washed with PBS-Tween buffer. Then, a 1:4,000 solution
of HRP conjugated rabbit anti-goat IgG (DakoCytomation) was added and the plate
was incubated for 1 hr in the dark. To reveal HRP activity, 50 mM phosphate / 25
mM citrate buffer, pH 5.0 containing 4 mM o-phenylenediamine and 0.0015% H2O2
was added to the wells. After 20 min, the reaction was stopped with 2.5 M sulphuric
acid. Absorbance values were measured at 492 nm. A standard curve using purified
ACY1 antigen (R&D Systems) was calculated using a computer generated 4-PL
curve-fit.
Measurement of TYRO3 concentrationsThe TYRO3 assay was performed according to the instructions of the manufacturer
(R&D Systems Minneapolis, MN, USA). Briefly, 96-well plates were coated overnight
with diluted capture antibody. After blocking with PBS and 1% BSA, human (1:20
dilution with 1% BSA/PBS), 15 times concentrated mouse serum samples or xenograft
protein extracts were incubated for 2 hours at room temperature. Mouse serum
(control as well as serum from xenografted mice) was concentrated to enhance the
ELISA signal. After addition of the detection antibody (diluted in 1% BSA/PBS) and
Streptavidin-HRP solution, a 1:1 mixture of H2O2 and tetramethylbenzidine was
added. The optical density of each well was determined at 450 nm, with wavelength
correction at 570 nm. A standard curve using purified TYRO3 antigen provided with
the assay was calculated using a computer generated 4-PL curve-fit.
Flip_Jansen.indd 73 30-7-2013 8:43:46
Discovery anD valiDation of prostate cancer biomarkers74
Measurement of AXL and MERTK concentrationsThe AXL and MERTK assays were performed according to the instructions of the
manufacturer (R&D Systems Minneapolis, MN, USA). Briefly, 96-well plates were
coated overnight with diluted capture antibody. After blocking with PBS and 1%
BSA, human serum samples were 1:20 diluted either in 1% BSA/PBS for the AXL
assay or a solution of 1% NP-40, 20 mM Tris, 137 mM NaCl, 10% glycerol, 2 mM EDTA
and 1mM activated sodium orthovanadate for the MERTK ELISA. Samples were
incubated for 2 hours at room temperature. After addition of the detection antibody
(diluted in 1% BSA/PBS or a solution of 20 mM Tris, 137 mM NaCl, 0.05% Tween
20 and 0.1% BSA for the AXL and MERTK assays, respectively) and Streptavidin-
HRP solution, a 1:1 mixture of H2O2 and tetramethylbenzidine was added. The
absorbance of each well was determined at 450 nm, with wavelength correction at
570 nm. A standard curve using purified AXL and MERTK antigen provided with
the assay was calculated using a computer generated 4-PL curve-fit.
Statistical analysisStatistical analyses were performed using the SPSS v15.0 software package (SPSS
Inc., Chicago, IL, USA). Differences in variables analysed by ELISA (TYRO3,
MERTK, AXL and ACY1) between the various sample groups were examined using
the Mann-Whitney U-test with two-sided P values. ROC curves were calculated
for TYRO3, MERTK, AXL and ACY1 to assess the diagnostic performances in PCa
detection of the various assays.
results
Proof-of-principle of the experimental setupWhen inbred immuno-competent mice are immunized with serum from nude mice
bearing human PCa xenografts, antibodies to human tumour antigens should be
produced162. To test this experimental set-up, western blots loaded with protein
extracts of the PC346 or LNCaP PCa cell lines were visualized with preimmune
serum or serum from immuno-competent mice immunized with full serum from
PC346 and PC339 bearing athymic nude mice (Figure 2). After equal exposure times,
several bands emerged in the lanes of the blots developed with immunized mouse
serum, in contrast with the blots developed with preimmune serum, indicating an
immune response in mice immunized with serum from xenograft-bearing mice.
Flip_Jansen.indd 74 30-7-2013 8:43:46
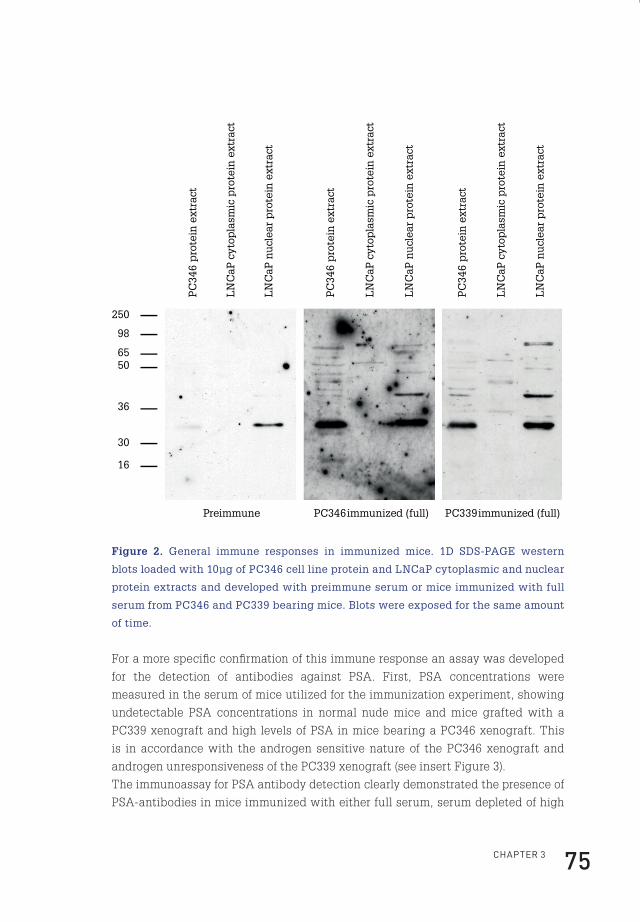
ChApteR 3 75
Preimmune PC346 immunized (full) PC339 immunized (full)
PC
346
pro
tein
ext
ract
LN
CaP
cyt
opla
smic
pro
tein
ext
ract
LN
CaP
nu
clea
r p
rote
in e
xtra
ct
250
98
6550
36
30
16
LN
CaP
cyt
opla
smic
pro
tein
ext
ract
LN
CaP
cyt
opla
smic
pro
tein
ext
ract
PC
346
pro
tein
ext
ract
PC
346
pro
tein
ext
ract
LN
CaP
nu
clea
r p
rote
in e
xtra
ct
LN
CaP
nu
clea
r p
rote
in e
xtra
ct
Figure 2. General immune responses in immunized mice. 1D SDS-PAGE western
blots loaded with 10µg of PC346 cell line protein and LNCaP cytoplasmic and nuclear
protein extracts and developed with preimmune serum or mice immunized with full
serum from PC346 and PC339 bearing mice. Blots were exposed for the same amount
of time.
For a more specific confirmation of this immune response an assay was developed
for the detection of antibodies against PSA. First, PSA concentrations were
measured in the serum of mice utilized for the immunization experiment, showing
undetectable PSA concentrations in normal nude mice and mice grafted with a
PC339 xenograft and high levels of PSA in mice bearing a PC346 xenograft. This
is in accordance with the androgen sensitive nature of the PC346 xenograft and
androgen unresponsiveness of the PC339 xenograft (see insert Figure 3).
The immunoassay for PSA antibody detection clearly demonstrated the presence of
PSA-antibodies in mice immunized with either full serum, serum depleted of high
Flip_Jansen.indd 75 30-7-2013 8:43:47
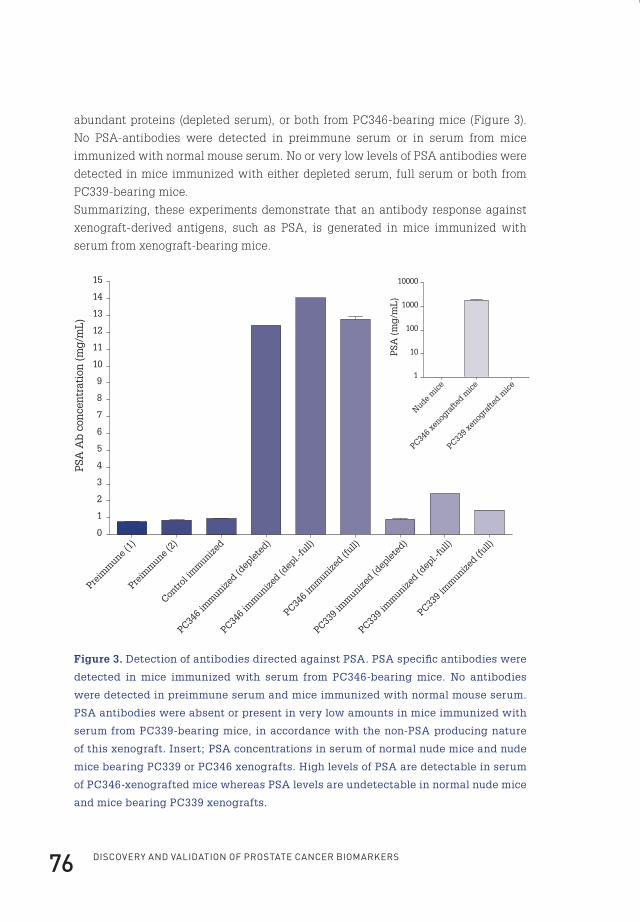
Discovery anD valiDation of prostate cancer biomarkers76
abundant proteins (depleted serum), or both from PC346-bearing mice (Figure 3).
No PSA-antibodies were detected in preimmune serum or in serum from mice
immunized with normal mouse serum. No or very low levels of PSA antibodies were
detected in mice immunized with either depleted serum, full serum or both from
PC339-bearing mice.
Summarizing, these experiments demonstrate that an antibody response against
xenograft-derived antigens, such as PSA, is generated in mice immunized with
serum from xenograft-bearing mice.
Preim
mune
(1)
Preim
mune
(2)
Contro
l im
munize
d
PC346
imm
unized (d
eple
ted)
PC346
imm
unized (d
epl.-
full)
PC346
imm
unized (f
ull)
PC339
imm
unized (d
eple
ted)
PC339
imm
unized (d
epl.-
full)
PC339
imm
unized (f
ull)0
1
2
3
4
5
6
7
8
9
10
11
12
13
14
15
PSA
Ab
con
cen
trat
ion
(m
g/m
L)
Nude m
ice
PC346
xenog
rafte
d mice
PC339
xenog
rafte
d mice
1
10
100
1000
10000
PSA
(m
g/m
L)
Figure 3. Detection of antibodies directed against PSA. PSA specific antibodies were
detected in mice immunized with serum from PC346-bearing mice. No antibodies
were detected in preimmune serum and mice immunized with normal mouse serum.
PSA antibodies were absent or present in very low amounts in mice immunized with
serum from PC339-bearing mice, in accordance with the non-PSA producing nature
of this xenograft. Insert; PSA concentrations in serum of normal nude mice and nude
mice bearing PC339 or PC346 xenografts. High levels of PSA are detectable in serum
of PC346-xenografted mice whereas PSA levels are undetectable in normal nude mice
and mice bearing PC339 xenografts.
Flip_Jansen.indd 76 30-7-2013 8:43:47
ChApteR 3 77
Identification of antibodies against human PCa-derived proteinsTo perform a large-scale identification of antibodies generated against human PCa-
derived proteins, sera from mice immunized with either depleted serum, full serum
or both from PC346 and PC339-bearing mice as well as preimmune serum and serum
from mice immunized with normal mouse serum, were incubated onto ProtoArrays.
These ProtoArrays contain approximately 8,000 partial and full-length human
proteins. Antibodies bound to spotted proteins were detected using a fluorescent
labelled secondary antibody. Processed ProtoArrays showed R2 >0.96 for duplicated
spots across all proteins. 99 Proteins to which an antibody response was observed
were identified (Table 2). The fluorescent expression values of the 25 top-ranked
identified proteins are depicted in Figure 4.
Flip_Jansen.indd 77 30-7-2013 8:43:47
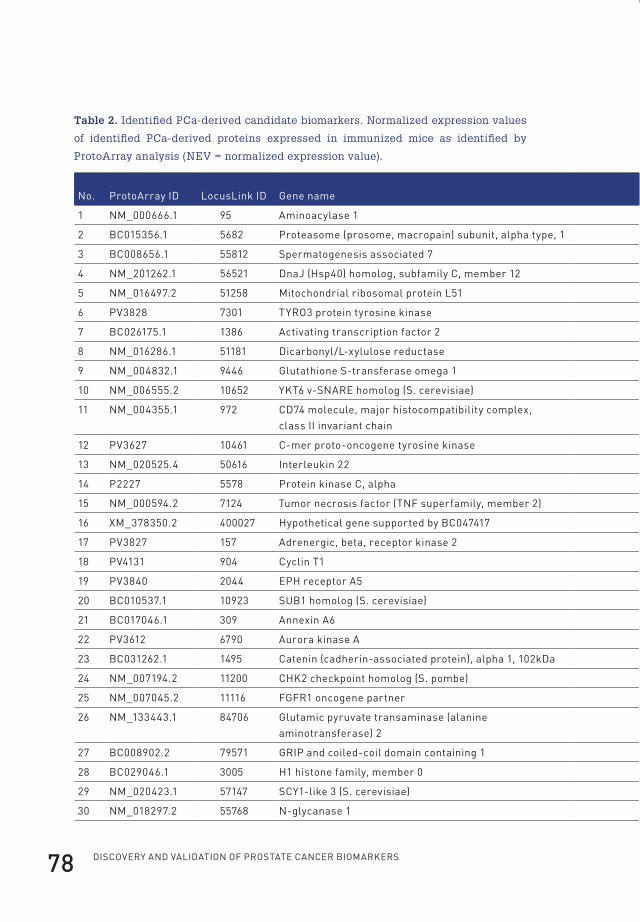
Discovery anD valiDation of prostate cancer biomarkers78
Table 2. Identified PCa-derived candidate biomarkers. Normalized expression values
of identified PCa-derived proteins expressed in immunized mice as identified by
ProtoArray analysis (NEV = normalized expression value).
no. protoArray iD locuslink iD Gene name Gene symbolMouse 2nd Ab only (nev)
preimmune (1) (nev)
preimmune (2) (nev)
control immunized (nev)
pC346 immunized (depleted) (nev)
1 nM_000666.1 95 Aminoacylase 1 ACy1 0.20 1.18 2.12 3.42 21.53
2 bC015356.1 5682 proteasome (prosome, macropain) subunit, alpha type, 1 psMA1 0.23 0.59 0.20 0.51 3.73
3 bC008656.1 55812 spermatogenesis associated 7 spAtA7 0.20 0.31 0.20 0.38 0.76
4 nM_201262.1 56521 DnaJ (hsp40) homolog, subfamily C, member 12 DnAJC12 0.20 0.77 0.49 0.77 0.85
5 nM_016497.2 51258 Mitochondrial ribosomal protein l51 MRpl51 0.20 0.34 0.20 0.62 1.03
6 pv3828 7301 tyRO3 protein tyrosine kinase tyRO3 0.20 0.42 0.22 1.33 0.40
7 bC026175.1 1386 Activating transcription factor 2 Atf2 0.51 1.61 0.20 0.71 2.18
8 nM_016286.1 51181 Dicarbonyl/l-xylulose reductase DCXR 0.20 1.06 1.08 0.65 4.43
9 nM_004832.1 9446 Glutathione s-transferase omega 1 GstO1 0.20 0.37 0.24 0.36 0.95
10 nM_006555.2 10652 ykt6 v-snARe homolog (s. cerevisiae) ykt6 0.20 0.55 0.22 1.34 2.38
11 nM_004355.1 972 CD74 molecule, major histocompatibility complex, class ii invariant chain
CD74 0.20 0.62 0.20 0.81 1.05
12 pv3627 10461 C-mer proto-oncogene tyrosine kinase MeRtk 0.20 0.31 0.20 0.35 1.61
13 nM_020525.4 50616 interleukin 22 il22 0.20 0.56 4.28 0.57 1.20
14 p2227 5578 protein kinase C, alpha pRkCA 0.20 0.53 1.83 2.76 0.22
15 nM_000594.2 7124 tumor necrosis factor (tnf superfamily, member 2) tnf 0.20 1.78 0.25 0.86 1.87
16 XM_378350.2 400027 hypothetical gene supported by bC047417 lOC400027 0.86 1.40 0.20 0.99 1.43
17 pv3827 157 Adrenergic, beta, receptor kinase 2 ADRbk2 0.20 0.20 0.20 0.76 0.25
18 pv4131 904 Cyclin t1 CCnt1 0.47 0.38 1.12 1.67 0.32
19 pv3840 2044 eph receptor A5 ephA5 0.20 0.78 0.20 0.46 0.58
20 bC010537.1 10923 sUb1 homolog (s. cerevisiae) sUb1 0.20 0.38 0.77 1.20 0.65
21 bC017046.1 309 Annexin A6 AnXA6 0.20 0.78 1.05 3.36 1.87
22 pv3612 6790 Aurora kinase A AURkA 0.44 0.29 3.60 1.32 0.32
23 bC031262.1 1495 Catenin (cadherin-associated protein), alpha 1, 102kDa CtnnA1 0.21 0.95 0.76 1.65 1.01
24 nM_007194.2 11200 Chk2 checkpoint homolog (s. pombe) Chek2 0.20 0.24 0.20 0.29 0.52
25 nM_007045.2 11116 fGfR1 oncogene partner fGfR1Op 0.23 1.68 0.20 2.63 1.42
26 nM_133443.1 84706 Glutamic pyruvate transaminase (alanine aminotransferase) 2
Gpt2 0.23 0.70 0.99 0.67 1.04
27 bC008902.2 79571 GRip and coiled-coil domain containing 1 GCC1 0.20 1.05 0.20 1.69 1.34
28 bC029046.1 3005 h1 histone family, member 0 h1f0 0.20 0.90 1.15 2.54 1.43
29 nM_020423.1 57147 sCy1-like 3 (s. cerevisiae) sCyl3 0.20 0.45 0.85 0.59 1.10
30 nM_018297.2 55768 n-glycanase 1 nGly1 0.20 0.41 0.20 0.42 0.80
Flip_Jansen.indd 78 30-7-2013 8:43:48
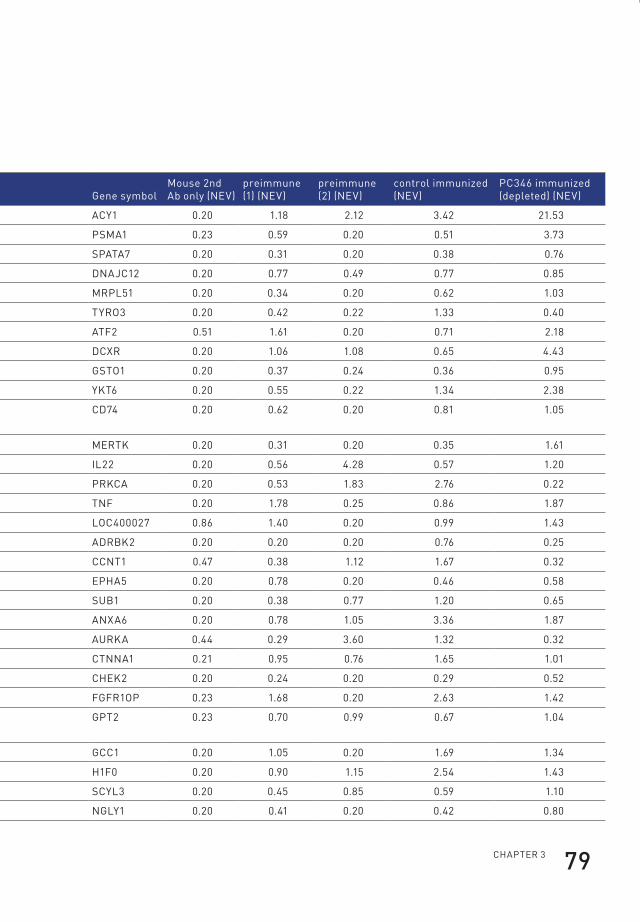
ChApteR 3 79
Table 2. Identified PCa-derived candidate biomarkers. Normalized expression values
of identified PCa-derived proteins expressed in immunized mice as identified by
ProtoArray analysis (NEV = normalized expression value).
no. protoArray iD locuslink iD Gene name Gene symbolMouse 2nd Ab only (nev)
preimmune (1) (nev)
preimmune (2) (nev)
control immunized (nev)
pC346 immunized (depleted) (nev)
1 nM_000666.1 95 Aminoacylase 1 ACy1 0.20 1.18 2.12 3.42 21.53
2 bC015356.1 5682 proteasome (prosome, macropain) subunit, alpha type, 1 psMA1 0.23 0.59 0.20 0.51 3.73
3 bC008656.1 55812 spermatogenesis associated 7 spAtA7 0.20 0.31 0.20 0.38 0.76
4 nM_201262.1 56521 DnaJ (hsp40) homolog, subfamily C, member 12 DnAJC12 0.20 0.77 0.49 0.77 0.85
5 nM_016497.2 51258 Mitochondrial ribosomal protein l51 MRpl51 0.20 0.34 0.20 0.62 1.03
6 pv3828 7301 tyRO3 protein tyrosine kinase tyRO3 0.20 0.42 0.22 1.33 0.40
7 bC026175.1 1386 Activating transcription factor 2 Atf2 0.51 1.61 0.20 0.71 2.18
8 nM_016286.1 51181 Dicarbonyl/l-xylulose reductase DCXR 0.20 1.06 1.08 0.65 4.43
9 nM_004832.1 9446 Glutathione s-transferase omega 1 GstO1 0.20 0.37 0.24 0.36 0.95
10 nM_006555.2 10652 ykt6 v-snARe homolog (s. cerevisiae) ykt6 0.20 0.55 0.22 1.34 2.38
11 nM_004355.1 972 CD74 molecule, major histocompatibility complex, class ii invariant chain
CD74 0.20 0.62 0.20 0.81 1.05
12 pv3627 10461 C-mer proto-oncogene tyrosine kinase MeRtk 0.20 0.31 0.20 0.35 1.61
13 nM_020525.4 50616 interleukin 22 il22 0.20 0.56 4.28 0.57 1.20
14 p2227 5578 protein kinase C, alpha pRkCA 0.20 0.53 1.83 2.76 0.22
15 nM_000594.2 7124 tumor necrosis factor (tnf superfamily, member 2) tnf 0.20 1.78 0.25 0.86 1.87
16 XM_378350.2 400027 hypothetical gene supported by bC047417 lOC400027 0.86 1.40 0.20 0.99 1.43
17 pv3827 157 Adrenergic, beta, receptor kinase 2 ADRbk2 0.20 0.20 0.20 0.76 0.25
18 pv4131 904 Cyclin t1 CCnt1 0.47 0.38 1.12 1.67 0.32
19 pv3840 2044 eph receptor A5 ephA5 0.20 0.78 0.20 0.46 0.58
20 bC010537.1 10923 sUb1 homolog (s. cerevisiae) sUb1 0.20 0.38 0.77 1.20 0.65
21 bC017046.1 309 Annexin A6 AnXA6 0.20 0.78 1.05 3.36 1.87
22 pv3612 6790 Aurora kinase A AURkA 0.44 0.29 3.60 1.32 0.32
23 bC031262.1 1495 Catenin (cadherin-associated protein), alpha 1, 102kDa CtnnA1 0.21 0.95 0.76 1.65 1.01
24 nM_007194.2 11200 Chk2 checkpoint homolog (s. pombe) Chek2 0.20 0.24 0.20 0.29 0.52
25 nM_007045.2 11116 fGfR1 oncogene partner fGfR1Op 0.23 1.68 0.20 2.63 1.42
26 nM_133443.1 84706 Glutamic pyruvate transaminase (alanine aminotransferase) 2
Gpt2 0.23 0.70 0.99 0.67 1.04
27 bC008902.2 79571 GRip and coiled-coil domain containing 1 GCC1 0.20 1.05 0.20 1.69 1.34
28 bC029046.1 3005 h1 histone family, member 0 h1f0 0.20 0.90 1.15 2.54 1.43
29 nM_020423.1 57147 sCy1-like 3 (s. cerevisiae) sCyl3 0.20 0.45 0.85 0.59 1.10
30 nM_018297.2 55768 n-glycanase 1 nGly1 0.20 0.41 0.20 0.42 0.80
Flip_Jansen.indd 79 30-7-2013 8:43:48
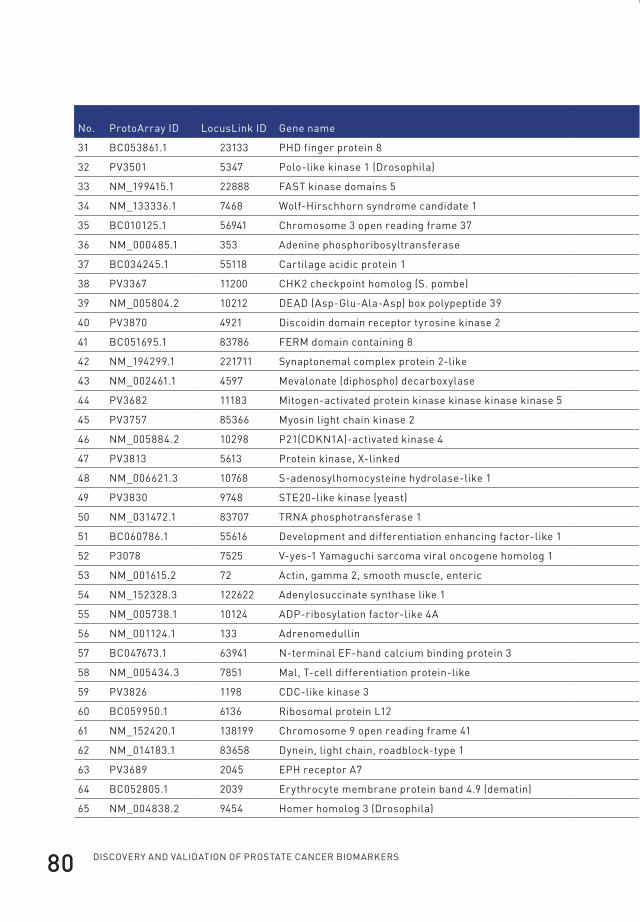
Discovery anD valiDation of prostate cancer biomarkers80
no. protoArray iD locuslink iD Gene name Gene symbolMouse 2nd Ab only (nev)
preimmune (1) (nev)
preimmune (2) (nev)
control immunized (nev)
pC346 immunized (depleted) (nev)
31 bC053861.1 23133 phD finger protein 8 phf8 0.20 0.87 0.20 1.24 1.12
32 pv3501 5347 polo-like kinase 1 (Drosophila) plk1 0.84 0.43 4.30 0.85 0.40
33 nM_199415.1 22888 fAst kinase domains 5 UbOX5 0.20 0.94 0.20 2.11 1.36
34 nM_133336.1 7468 Wolf-hirschhorn syndrome candidate 1 WhsC1 0.20 0.59 3.96 1.33 5.87
35 bC010125.1 56941 Chromosome 3 open reading frame 37 C3orf37 2.52 0.20 3.51 0.20 0.22
36 nM_000485.1 353 Adenine phosphoribosyltransferase ApRt 0.20 3.14 0.22 0.84 2.00
37 bC034245.1 55118 Cartilage acidic protein 1 CRtAC1 0.20 1.33 0.27 2.16 1.33
38 pv3367 11200 Chk2 checkpoint homolog (s. pombe) Chek2 0.20 0.42 0.33 1.01 0.69
39 nM_005804.2 10212 DeAD (Asp-Glu-Ala-Asp) box polypeptide 39 DDX39 0.20 0.76 0.20 1.71 3.29
40 pv3870 4921 Discoidin domain receptor tyrosine kinase 2 DDR2 0.20 0.81 0.53 0.50 0.99
41 bC051695.1 83786 feRM domain containing 8 fRMD8 0.20 0.20 3.07 0.20 0.22
42 nM_194299.1 221711 synaptonemal complex protein 2-like syCp2l 0.20 0.92 0.35 1.30 1.55
43 nM_002461.1 4597 Mevalonate (diphospho) decarboxylase MvD 0.20 1.06 0.91 0.97 1.44
44 pv3682 11183 Mitogen-activated protein kinase kinase kinase kinase 5 MAp4k5 0.20 0.29 0.36 1.31 0.38
45 pv3757 85366 Myosin light chain kinase 2 Mylk2 0.65 1.73 0.20 1.37 1.63
46 nM_005884.2 10298 p21(CDkn1A)-activated kinase 4 pAk4 0.20 0.64 2.22 1.41 1.21
47 pv3813 5613 protein kinase, X-linked pRkX 0.22 2.04 4.08 2.06 6.41
48 nM_006621.3 10768 s-adenosylhomocysteine hydrolase-like 1 AhCyl1 0.20 0.80 1.52 0.20 0.22
49 pv3830 9748 ste20-like kinase (yeast) slk 0.23 0.75 0.91 3.10 0.75
50 nM_031472.1 83707 tRnA phosphotransferase 1 tRpt1 0.51 0.87 3.61 0.61 1.16
51 bC060786.1 55616 Development and differentiation enhancing factor-like 1 DDefl1 0.20 0.90 0.20 1.00 1.28
52 p3078 7525 v-yes-1 yamaguchi sarcoma viral oncogene homolog 1 yes1 0.20 1.29 0.20 2.29 1.49
53 nM_001615.2 72 Actin, gamma 2, smooth muscle, enteric ACtG2 0.20 0.86 0.46 0.95 1.68
54 nM_152328.3 122622 Adenylosuccinate synthase like 1 ADssl1 0.20 0.20 1.77 0.20 0.22
55 nM_005738.1 10124 ADp-ribosylation factor-like 4A ARl4A 0.20 0.43 0.27 0.87 0.74
56 nM_001124.1 133 Adrenomedullin ADM 0.20 0.80 0.43 1.01 1.53
57 bC047673.1 63941 n-terminal ef-hand calcium binding protein 3 neCAb3 0.20 0.20 2.02 0.20 0.22
58 nM_005434.3 7851 Mal, t-cell differentiation protein-like MAll 0.20 0.36 2.41 0.44 0.73
59 pv3826 1198 CDC-like kinase 3 Clk3 0.20 1.29 0.82 1.62 1.23
60 bC059950.1 6136 Ribosomal protein l12 Rpl12 0.23 0.31 1.48 0.83 0.86
61 nM_152420.1 138199 Chromosome 9 open reading frame 41 C9orf41 0.21 0.97 1.31 1.84 1.77
62 nM_014183.1 83658 Dynein, light chain, roadblock-type 1 DynlRb1 0.57 0.85 0.55 0.72 1.26
63 pv3689 2045 eph receptor A7 ephA7 1.16 0.75 1.58 1.18 1.19
64 bC052805.1 2039 erythrocyte membrane protein band 4.9 (dematin) epb49 0.78 1.18 3.22 0.58 2.03
65 nM_004838.2 9454 homer homolog 3 (Drosophila) hOMeR3 0.20 1.57 0.90 0.96 1.59
Flip_Jansen.indd 80 30-7-2013 8:43:48
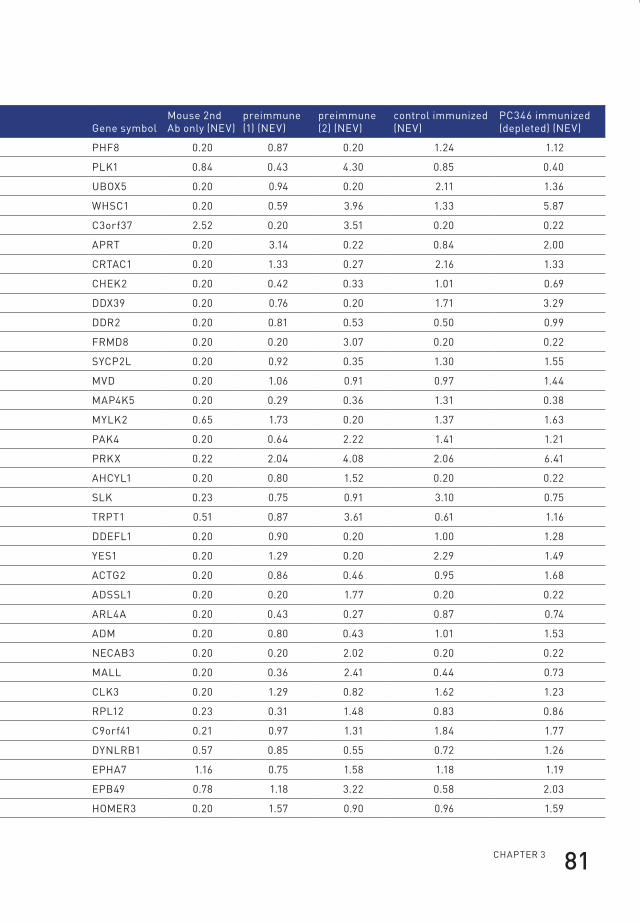
ChApteR 3 81
no. protoArray iD locuslink iD Gene name Gene symbolMouse 2nd Ab only (nev)
preimmune (1) (nev)
preimmune (2) (nev)
control immunized (nev)
pC346 immunized (depleted) (nev)
31 bC053861.1 23133 phD finger protein 8 phf8 0.20 0.87 0.20 1.24 1.12
32 pv3501 5347 polo-like kinase 1 (Drosophila) plk1 0.84 0.43 4.30 0.85 0.40
33 nM_199415.1 22888 fAst kinase domains 5 UbOX5 0.20 0.94 0.20 2.11 1.36
34 nM_133336.1 7468 Wolf-hirschhorn syndrome candidate 1 WhsC1 0.20 0.59 3.96 1.33 5.87
35 bC010125.1 56941 Chromosome 3 open reading frame 37 C3orf37 2.52 0.20 3.51 0.20 0.22
36 nM_000485.1 353 Adenine phosphoribosyltransferase ApRt 0.20 3.14 0.22 0.84 2.00
37 bC034245.1 55118 Cartilage acidic protein 1 CRtAC1 0.20 1.33 0.27 2.16 1.33
38 pv3367 11200 Chk2 checkpoint homolog (s. pombe) Chek2 0.20 0.42 0.33 1.01 0.69
39 nM_005804.2 10212 DeAD (Asp-Glu-Ala-Asp) box polypeptide 39 DDX39 0.20 0.76 0.20 1.71 3.29
40 pv3870 4921 Discoidin domain receptor tyrosine kinase 2 DDR2 0.20 0.81 0.53 0.50 0.99
41 bC051695.1 83786 feRM domain containing 8 fRMD8 0.20 0.20 3.07 0.20 0.22
42 nM_194299.1 221711 synaptonemal complex protein 2-like syCp2l 0.20 0.92 0.35 1.30 1.55
43 nM_002461.1 4597 Mevalonate (diphospho) decarboxylase MvD 0.20 1.06 0.91 0.97 1.44
44 pv3682 11183 Mitogen-activated protein kinase kinase kinase kinase 5 MAp4k5 0.20 0.29 0.36 1.31 0.38
45 pv3757 85366 Myosin light chain kinase 2 Mylk2 0.65 1.73 0.20 1.37 1.63
46 nM_005884.2 10298 p21(CDkn1A)-activated kinase 4 pAk4 0.20 0.64 2.22 1.41 1.21
47 pv3813 5613 protein kinase, X-linked pRkX 0.22 2.04 4.08 2.06 6.41
48 nM_006621.3 10768 s-adenosylhomocysteine hydrolase-like 1 AhCyl1 0.20 0.80 1.52 0.20 0.22
49 pv3830 9748 ste20-like kinase (yeast) slk 0.23 0.75 0.91 3.10 0.75
50 nM_031472.1 83707 tRnA phosphotransferase 1 tRpt1 0.51 0.87 3.61 0.61 1.16
51 bC060786.1 55616 Development and differentiation enhancing factor-like 1 DDefl1 0.20 0.90 0.20 1.00 1.28
52 p3078 7525 v-yes-1 yamaguchi sarcoma viral oncogene homolog 1 yes1 0.20 1.29 0.20 2.29 1.49
53 nM_001615.2 72 Actin, gamma 2, smooth muscle, enteric ACtG2 0.20 0.86 0.46 0.95 1.68
54 nM_152328.3 122622 Adenylosuccinate synthase like 1 ADssl1 0.20 0.20 1.77 0.20 0.22
55 nM_005738.1 10124 ADp-ribosylation factor-like 4A ARl4A 0.20 0.43 0.27 0.87 0.74
56 nM_001124.1 133 Adrenomedullin ADM 0.20 0.80 0.43 1.01 1.53
57 bC047673.1 63941 n-terminal ef-hand calcium binding protein 3 neCAb3 0.20 0.20 2.02 0.20 0.22
58 nM_005434.3 7851 Mal, t-cell differentiation protein-like MAll 0.20 0.36 2.41 0.44 0.73
59 pv3826 1198 CDC-like kinase 3 Clk3 0.20 1.29 0.82 1.62 1.23
60 bC059950.1 6136 Ribosomal protein l12 Rpl12 0.23 0.31 1.48 0.83 0.86
61 nM_152420.1 138199 Chromosome 9 open reading frame 41 C9orf41 0.21 0.97 1.31 1.84 1.77
62 nM_014183.1 83658 Dynein, light chain, roadblock-type 1 DynlRb1 0.57 0.85 0.55 0.72 1.26
63 pv3689 2045 eph receptor A7 ephA7 1.16 0.75 1.58 1.18 1.19
64 bC052805.1 2039 erythrocyte membrane protein band 4.9 (dematin) epb49 0.78 1.18 3.22 0.58 2.03
65 nM_004838.2 9454 homer homolog 3 (Drosophila) hOMeR3 0.20 1.57 0.90 0.96 1.59
Flip_Jansen.indd 81 30-7-2013 8:43:48
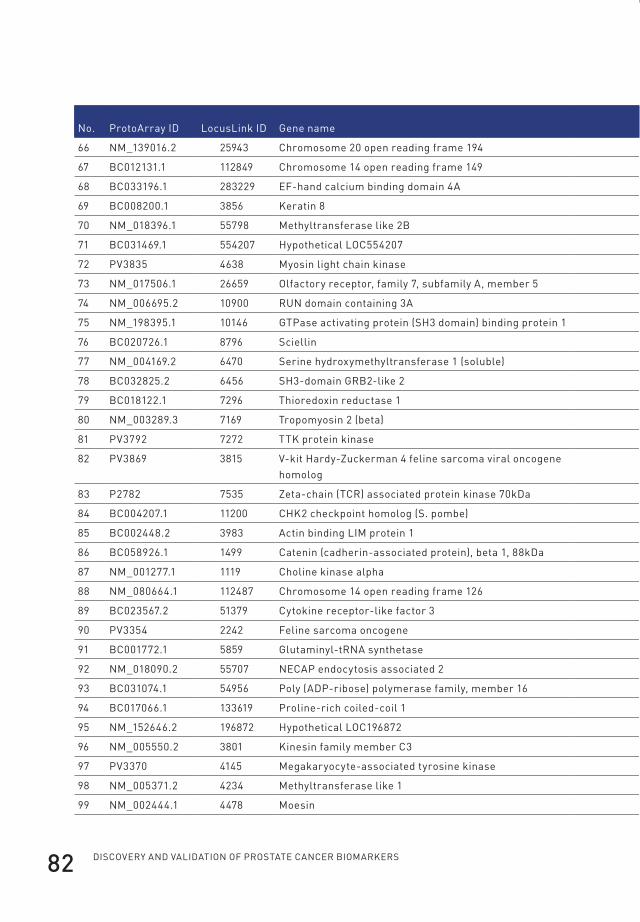
Discovery anD valiDation of prostate cancer biomarkers82
no. protoArray iD locuslink iD Gene name Gene symbolMouse 2nd Ab only (nev)
preimmune (1) (nev)
preimmune (2) (nev)
control immunized (nev)
pC346 immunized (depleted) (nev)
66 nM_139016.2 25943 Chromosome 20 open reading frame 194 C20orf194 0.28 0.20 2.16 0.20 0.22
67 bC012131.1 112849 Chromosome 14 open reading frame 149 C14orf149 0.20 0.44 0.83 0.66 1.11
68 bC033196.1 283229 ef-hand calcium binding domain 4A efCAb4A 0.20 1.79 2.02 1.31 2.61
69 bC008200.1 3856 keratin 8 kRt8 1.11 1.18 1.74 1.11 1.69
70 nM_018396.1 55798 Methyltransferase like 2b Mettl2b 0.20 0.63 0.39 0.57 0.91
71 bC031469.1 554207 hypothetical lOC554207 lOC554207 0.28 1.26 0.30 1.25 1.67
72 pv3835 4638 Myosin light chain kinase Mylk 0.45 0.67 0.20 2.27 0.74
73 nM_017506.1 26659 Olfactory receptor, family 7, subfamily A, member 5 OR7A5 0.20 0.49 0.63 1.45 1.20
74 nM_006695.2 10900 RUn domain containing 3A RUnDC3A 0.21 1.54 1.26 1.23 1.15
75 nM_198395.1 10146 Gtpase activating protein (sh3 domain) binding protein 1 G3bp1 1.09 0.89 1.15 3.03 1.48
76 bC020726.1 8796 sciellin sCel 1.46 1.18 4.60 2.60 1.61
77 nM_004169.2 6470 serine hydroxymethyltransferase 1 (soluble) shMt1 0.20 0.41 1.48 0.60 0.96
78 bC032825.2 6456 sh3-domain GRb2-like 2 sh3Gl2 0.79 0.20 3.20 0.20 0.22
79 bC018122.1 7296 thioredoxin reductase 1 tXnRD1 0.20 0.85 1.24 1.50 1.80
80 nM_003289.3 7169 tropomyosin 2 (beta) tpM2 0.20 0.20 2.56 0.20 0.22
81 pv3792 7272 ttk protein kinase ttk 0.38 1.36 2.13 1.88 0.76
82 pv3869 3815 v-kit hardy-Zuckerman 4 feline sarcoma viral oncogene homolog
kit 0.25 0.55 0.39 1.94 0.42
83 p2782 7535 Zeta-chain (tCR) associated protein kinase 70kDa ZAp70 0.22 0.57 3.36 1.46 0.36
84 bC004207.1 11200 Chk2 checkpoint homolog (s. pombe) Chek2 0.20 0.40 0.93 0.61 1.29
85 bC002448.2 3983 Actin binding liM protein 1 AbliM1 2.16 1.21 2.01 1.49 1.39
86 bC058926.1 1499 Catenin (cadherin-associated protein), beta 1, 88kDa Ctnnb1 0.20 1.40 0.46 1.36 1.72
87 nM_001277.1 1119 Choline kinase alpha ChkA 0.28 0.94 2.43 1.95 2.52
88 nM_080664.1 112487 Chromosome 14 open reading frame 126 C14orf126 0.54 0.73 4.09 2.32 1.38
89 bC023567.2 51379 Cytokine receptor-like factor 3 CRlf3 0.20 1.33 0.78 2.36 1.62
90 pv3354 2242 feline sarcoma oncogene fes 0.32 0.71 1.82 2.54 0.93
91 bC001772.1 5859 Glutaminyl-tRnA synthetase QARs 0.24 0.56 0.79 0.36 0.90
92 nM_018090.2 55707 neCAp endocytosis associated 2 neCAp2 0.20 0.96 2.23 0.90 1.26
93 bC031074.1 54956 poly (ADp-ribose) polymerase family, member 16 pARp16 0.20 0.65 0.88 1.63 0.97
94 bC017066.1 133619 proline-rich coiled-coil 1 pRRC1 0.20 0.90 1.46 0.51 1.16
95 nM_152646.2 196872 hypothetical lOC196872 MGC23270 0.86 2.49 3.13 0.81 2.66
96 nM_005550.2 3801 kinesin family member C3 kifC3 1.06 0.56 3.94 3.36 2.01
97 pv3370 4145 Megakaryocyte-associated tyrosine kinase MAtk 0.20 0.62 0.55 0.79 0.77
98 nM_005371.2 4234 Methyltransferase like 1 Mettl1 0.20 0.52 0.64 1.13 1.21
99 nM_002444.1 4478 Moesin Msn 0.20 1.56 0.44 1.47 2.68
Flip_Jansen.indd 82 30-7-2013 8:43:48
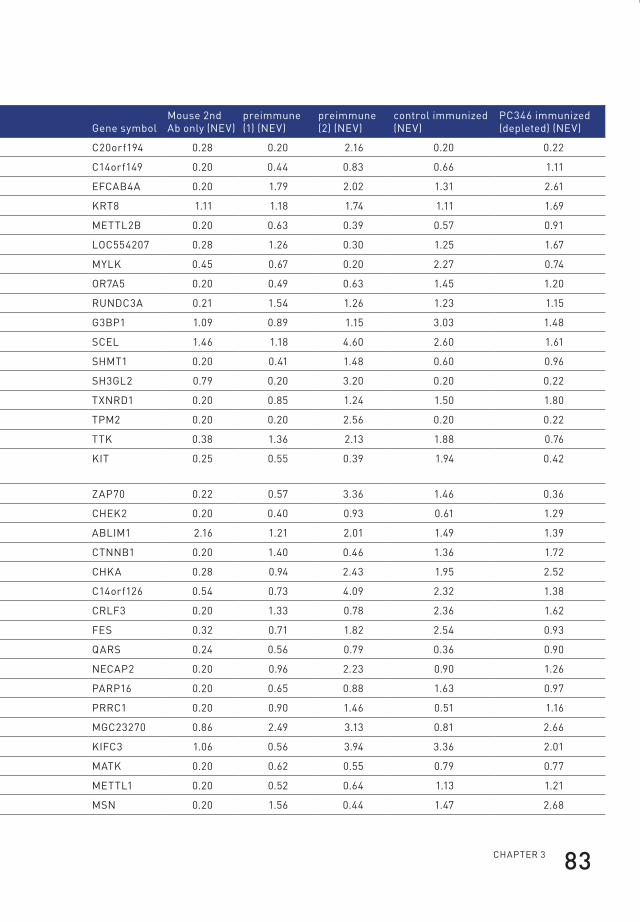
ChApteR 3 83
no. protoArray iD locuslink iD Gene name Gene symbolMouse 2nd Ab only (nev)
preimmune (1) (nev)
preimmune (2) (nev)
control immunized (nev)
pC346 immunized (depleted) (nev)
66 nM_139016.2 25943 Chromosome 20 open reading frame 194 C20orf194 0.28 0.20 2.16 0.20 0.22
67 bC012131.1 112849 Chromosome 14 open reading frame 149 C14orf149 0.20 0.44 0.83 0.66 1.11
68 bC033196.1 283229 ef-hand calcium binding domain 4A efCAb4A 0.20 1.79 2.02 1.31 2.61
69 bC008200.1 3856 keratin 8 kRt8 1.11 1.18 1.74 1.11 1.69
70 nM_018396.1 55798 Methyltransferase like 2b Mettl2b 0.20 0.63 0.39 0.57 0.91
71 bC031469.1 554207 hypothetical lOC554207 lOC554207 0.28 1.26 0.30 1.25 1.67
72 pv3835 4638 Myosin light chain kinase Mylk 0.45 0.67 0.20 2.27 0.74
73 nM_017506.1 26659 Olfactory receptor, family 7, subfamily A, member 5 OR7A5 0.20 0.49 0.63 1.45 1.20
74 nM_006695.2 10900 RUn domain containing 3A RUnDC3A 0.21 1.54 1.26 1.23 1.15
75 nM_198395.1 10146 Gtpase activating protein (sh3 domain) binding protein 1 G3bp1 1.09 0.89 1.15 3.03 1.48
76 bC020726.1 8796 sciellin sCel 1.46 1.18 4.60 2.60 1.61
77 nM_004169.2 6470 serine hydroxymethyltransferase 1 (soluble) shMt1 0.20 0.41 1.48 0.60 0.96
78 bC032825.2 6456 sh3-domain GRb2-like 2 sh3Gl2 0.79 0.20 3.20 0.20 0.22
79 bC018122.1 7296 thioredoxin reductase 1 tXnRD1 0.20 0.85 1.24 1.50 1.80
80 nM_003289.3 7169 tropomyosin 2 (beta) tpM2 0.20 0.20 2.56 0.20 0.22
81 pv3792 7272 ttk protein kinase ttk 0.38 1.36 2.13 1.88 0.76
82 pv3869 3815 v-kit hardy-Zuckerman 4 feline sarcoma viral oncogene homolog
kit 0.25 0.55 0.39 1.94 0.42
83 p2782 7535 Zeta-chain (tCR) associated protein kinase 70kDa ZAp70 0.22 0.57 3.36 1.46 0.36
84 bC004207.1 11200 Chk2 checkpoint homolog (s. pombe) Chek2 0.20 0.40 0.93 0.61 1.29
85 bC002448.2 3983 Actin binding liM protein 1 AbliM1 2.16 1.21 2.01 1.49 1.39
86 bC058926.1 1499 Catenin (cadherin-associated protein), beta 1, 88kDa Ctnnb1 0.20 1.40 0.46 1.36 1.72
87 nM_001277.1 1119 Choline kinase alpha ChkA 0.28 0.94 2.43 1.95 2.52
88 nM_080664.1 112487 Chromosome 14 open reading frame 126 C14orf126 0.54 0.73 4.09 2.32 1.38
89 bC023567.2 51379 Cytokine receptor-like factor 3 CRlf3 0.20 1.33 0.78 2.36 1.62
90 pv3354 2242 feline sarcoma oncogene fes 0.32 0.71 1.82 2.54 0.93
91 bC001772.1 5859 Glutaminyl-tRnA synthetase QARs 0.24 0.56 0.79 0.36 0.90
92 nM_018090.2 55707 neCAp endocytosis associated 2 neCAp2 0.20 0.96 2.23 0.90 1.26
93 bC031074.1 54956 poly (ADp-ribose) polymerase family, member 16 pARp16 0.20 0.65 0.88 1.63 0.97
94 bC017066.1 133619 proline-rich coiled-coil 1 pRRC1 0.20 0.90 1.46 0.51 1.16
95 nM_152646.2 196872 hypothetical lOC196872 MGC23270 0.86 2.49 3.13 0.81 2.66
96 nM_005550.2 3801 kinesin family member C3 kifC3 1.06 0.56 3.94 3.36 2.01
97 pv3370 4145 Megakaryocyte-associated tyrosine kinase MAtk 0.20 0.62 0.55 0.79 0.77
98 nM_005371.2 4234 Methyltransferase like 1 Mettl1 0.20 0.52 0.64 1.13 1.21
99 nM_002444.1 4478 Moesin Msn 0.20 1.56 0.44 1.47 2.68
Flip_Jansen.indd 83 30-7-2013 8:43:49
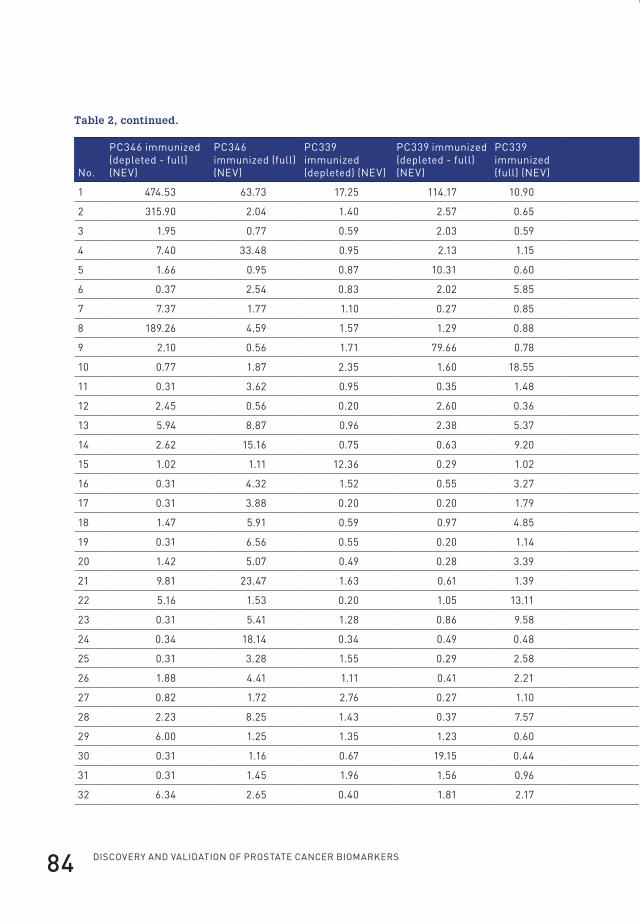
Discovery anD valiDation of prostate cancer biomarkers84
Table 2, continued.
no.
pC346 immunized (depleted - full) (nev)
pC346 immunized (full) (nev)
pC339 immunized (depleted) (nev)
pC339 immunized (depleted - full) (nev)
pC339 immunized (full) (nev) location type
prior linked to pCa
suggested as pCa biomarker
1 474.53 63.73 17.25 114.17 10.90 cytoplasm peptidase yes165 yes165
2 315.90 2.04 1.40 2.57 0.65 cytoplasm peptidase no no
3 1.95 0.77 0.59 2.03 0.59 unknown other no no
4 7.40 33.48 0.95 2.13 1.15 unknown other yes166 no
5 1.66 0.95 0.87 10.31 0.60 cytoplasm other no no
6 0.37 2.54 0.83 2.02 5.85 plasma membrane kinase no no
7 7.37 1.77 1.10 0.27 0.85 nucleus transcription regulator yes167 no
8 189.26 4.59 1.57 1.29 0.88 cytoplasm enzyme yes168 yes168
9 2.10 0.56 1.71 79.66 0.78 cytoplasm enzyme yes169 no
10 0.77 1.87 2.35 1.60 18.55 cytoplasm enzyme no no
11 0.31 3.62 0.95 0.35 1.48 plasma membrane transmembrane receptor yes170 no
12 2.45 0.56 0.20 2.60 0.36 plasma membrane kinase yes171 no
13 5.94 8.87 0.96 2.38 5.37 extracellular space cytokine no no
14 2.62 15.16 0.75 0.63 9.20 cytoplasm kinase yes172 no
15 1.02 1.11 12.36 0.29 1.02 extracellular space cytokine yes173 yes174
16 0.31 4.32 1.52 0.55 3.27 unknown other no no
17 0.31 3.88 0.20 0.20 1.79 cytoplasm kinase no no
18 1.47 5.91 0.59 0.97 4.85 nucleus transcription regulator no no
19 0.31 6.56 0.55 0.20 1.14 plasma membrane kinase no no
20 1.42 5.07 0.49 0.28 3.39 nucleus transcription regulator no no
21 9.81 23.47 1.63 0.61 1.39 plasma membrane other no no
22 5.16 1.53 0.20 1.05 13.11 nucleus kinase yes175 no
23 0.31 5.41 1.28 0.86 9.58 plasma membrane other yes176 yes177
24 0.34 18.14 0.34 0.49 0.48 nucleus kinase yes178 no
25 0.31 3.28 1.55 0.29 2.58 cytoplasm other no no
26 1.88 4.41 1.11 0.41 2.21 unknown enzyme no no
27 0.82 1.72 2.76 0.27 1.10 cytoplasm other no no
28 2.23 8.25 1.43 0.37 7.57 nucleus other no no
29 6.00 1.25 1.35 1.23 0.60 cytoplasm kinase no no
30 0.31 1.16 0.67 19.15 0.44 cytoplasm enzyme no no
31 0.31 1.45 1.96 1.56 0.96 unknown other no no
32 6.34 2.65 0.40 1.81 2.17 nucleus kinase yes179 yes179
Flip_Jansen.indd 84 30-7-2013 8:43:49
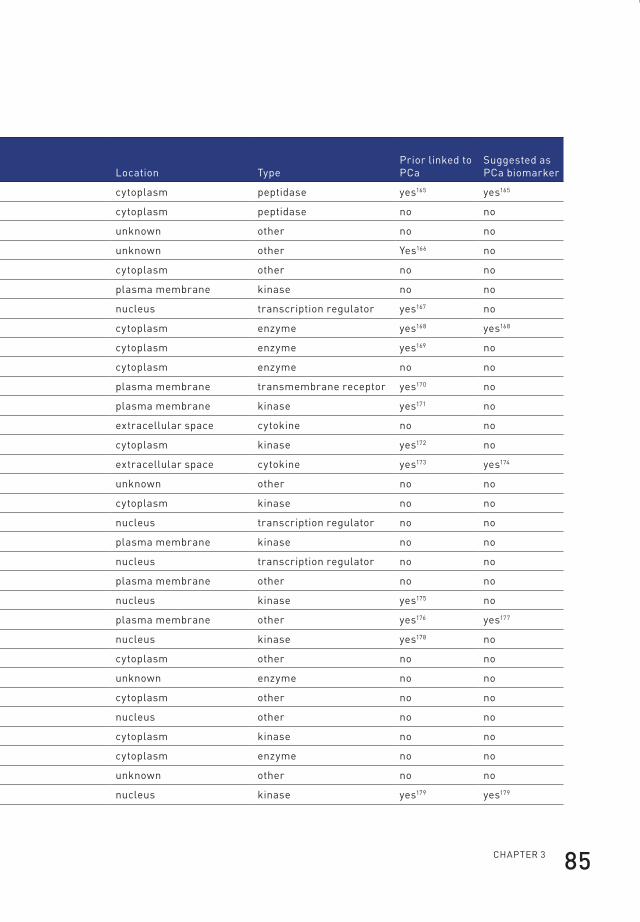
ChApteR 3 85
Table 2, continued.
no.
pC346 immunized (depleted - full) (nev)
pC346 immunized (full) (nev)
pC339 immunized (depleted) (nev)
pC339 immunized (depleted - full) (nev)
pC339 immunized (full) (nev) location type
prior linked to pCa
suggested as pCa biomarker
1 474.53 63.73 17.25 114.17 10.90 cytoplasm peptidase yes165 yes165
2 315.90 2.04 1.40 2.57 0.65 cytoplasm peptidase no no
3 1.95 0.77 0.59 2.03 0.59 unknown other no no
4 7.40 33.48 0.95 2.13 1.15 unknown other yes166 no
5 1.66 0.95 0.87 10.31 0.60 cytoplasm other no no
6 0.37 2.54 0.83 2.02 5.85 plasma membrane kinase no no
7 7.37 1.77 1.10 0.27 0.85 nucleus transcription regulator yes167 no
8 189.26 4.59 1.57 1.29 0.88 cytoplasm enzyme yes168 yes168
9 2.10 0.56 1.71 79.66 0.78 cytoplasm enzyme yes169 no
10 0.77 1.87 2.35 1.60 18.55 cytoplasm enzyme no no
11 0.31 3.62 0.95 0.35 1.48 plasma membrane transmembrane receptor yes170 no
12 2.45 0.56 0.20 2.60 0.36 plasma membrane kinase yes171 no
13 5.94 8.87 0.96 2.38 5.37 extracellular space cytokine no no
14 2.62 15.16 0.75 0.63 9.20 cytoplasm kinase yes172 no
15 1.02 1.11 12.36 0.29 1.02 extracellular space cytokine yes173 yes174
16 0.31 4.32 1.52 0.55 3.27 unknown other no no
17 0.31 3.88 0.20 0.20 1.79 cytoplasm kinase no no
18 1.47 5.91 0.59 0.97 4.85 nucleus transcription regulator no no
19 0.31 6.56 0.55 0.20 1.14 plasma membrane kinase no no
20 1.42 5.07 0.49 0.28 3.39 nucleus transcription regulator no no
21 9.81 23.47 1.63 0.61 1.39 plasma membrane other no no
22 5.16 1.53 0.20 1.05 13.11 nucleus kinase yes175 no
23 0.31 5.41 1.28 0.86 9.58 plasma membrane other yes176 yes177
24 0.34 18.14 0.34 0.49 0.48 nucleus kinase yes178 no
25 0.31 3.28 1.55 0.29 2.58 cytoplasm other no no
26 1.88 4.41 1.11 0.41 2.21 unknown enzyme no no
27 0.82 1.72 2.76 0.27 1.10 cytoplasm other no no
28 2.23 8.25 1.43 0.37 7.57 nucleus other no no
29 6.00 1.25 1.35 1.23 0.60 cytoplasm kinase no no
30 0.31 1.16 0.67 19.15 0.44 cytoplasm enzyme no no
31 0.31 1.45 1.96 1.56 0.96 unknown other no no
32 6.34 2.65 0.40 1.81 2.17 nucleus kinase yes179 yes179
Flip_Jansen.indd 85 30-7-2013 8:43:49

Discovery anD valiDation of prostate cancer biomarkers86
no.
pC346 immunized (depleted - full) (nev)
pC346 immunized (full) (nev)
pC339 immunized (depleted) (nev)
pC339 immunized (depleted - full) (nev)
pC339 immunized (full) (nev) location type
prior linked to pCa
suggested as pCa biomarker
33 0.33 4.21 1.80 0.32 1.73 nucleus other no no
34 6.09 6.23 1.93 0.44 2.02 nucleus other no no
35 4.90 0.23 0.20 3.19 1.87 unknown other no no
36 0.99 1.51 2.79 0.32 1.13 cytoplasm enzyme no no
37 0.84 1.41 2.79 0.20 1.05 extracellular space other no no
38 0.38 39.30 0.35 0.29 1.30 nucleus kinase yes178 no
39 1.18 0.63 1.19 0.26 0.82 nucleus enzyme no no
40 6.32 2.20 0.62 0.22 1.87 plasma membrane kinase no no
41 13.23 0.23 0.20 1.15 0.20 unknown other no no
42 1.13 2.68 1.41 0.38 2.56 unknown other no no
43 1.68 1.36 7.18 0.95 1.33 cytoplasm enzyme no no
44 1.24 2.03 0.20 0.42 2.66 cytoplasm kinase no no
45 0.31 2.95 1.30 0.20 3.64 cytoplasm kinase no no
46 21.28 6.36 0.74 0.90 1.48 cytoplasm kinase yes180 no
47 2.70 9.88 1.53 9.87 8.00 cytoplasm kinase no no
48 1.48 0.23 0.20 0.63 3.85 cytoplasm enzyme no no
49 0.98 3.75 3.92 0.63 3.20 nucleus kinase no no
50 5.69 1.61 0.97 2.05 4.01 unknown enzyme no no
51 0.85 1.50 2.80 0.21 1.19 unknown other no no
52 0.31 5.38 0.85 0.20 3.34 cytoplasm kinase no no
53 1.98 0.78 3.40 0.42 0.86 cytoplasm other yes181 no
54 2.15 0.23 0.20 1.75 0.20 cytoplasm enzyme no no
55 0.56 5.18 0.66 0.20 0.62 nucleus enzyme no no
56 2.03 1.25 2.86 0.40 1.42 extracellular space other yes182 no
57 1.54 0.23 0.20 20.11 0.20 cytoplasm other no no
58 4.85 2.81 0.65 0.50 0.64 plasma membrane other no no
59 1.17 7.73 1.30 0.23 0.99 nucleus kinase yes183 no
60 15.07 1.42 0.63 0.52 1.25 cytoplasm other no no
61 2.34 11.87 1.39 0.90 2.46 unknown other no no
62 0.89 1.68 3.02 0.28 0.87 cytoplasm other yes184 no
63 1.69 7.24 0.64 0.73 1.20 plasma membrane kinase yes185 no
64 3.73 4.04 1.49 1.20 2.74 plasma membrane other yes186 no
65 2.53 10.58 2.76 0.79 1.99 plasma membrane other no no
66 6.04 0.23 0.20 0.87 0.20 nucleus other no no
Flip_Jansen.indd 86 30-7-2013 8:43:49
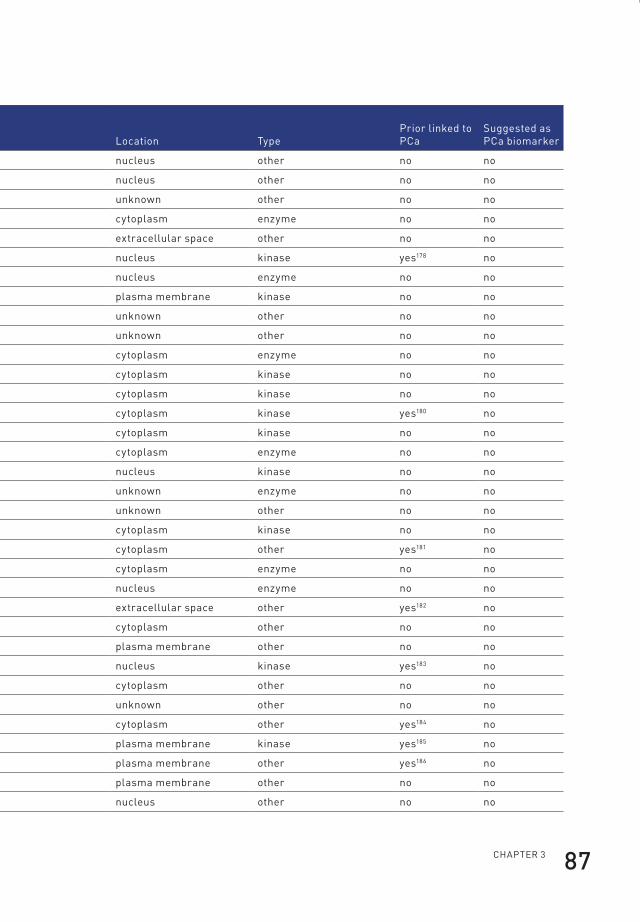
ChApteR 3 87
no.
pC346 immunized (depleted - full) (nev)
pC346 immunized (full) (nev)
pC339 immunized (depleted) (nev)
pC339 immunized (depleted - full) (nev)
pC339 immunized (full) (nev) location type
prior linked to pCa
suggested as pCa biomarker
33 0.33 4.21 1.80 0.32 1.73 nucleus other no no
34 6.09 6.23 1.93 0.44 2.02 nucleus other no no
35 4.90 0.23 0.20 3.19 1.87 unknown other no no
36 0.99 1.51 2.79 0.32 1.13 cytoplasm enzyme no no
37 0.84 1.41 2.79 0.20 1.05 extracellular space other no no
38 0.38 39.30 0.35 0.29 1.30 nucleus kinase yes178 no
39 1.18 0.63 1.19 0.26 0.82 nucleus enzyme no no
40 6.32 2.20 0.62 0.22 1.87 plasma membrane kinase no no
41 13.23 0.23 0.20 1.15 0.20 unknown other no no
42 1.13 2.68 1.41 0.38 2.56 unknown other no no
43 1.68 1.36 7.18 0.95 1.33 cytoplasm enzyme no no
44 1.24 2.03 0.20 0.42 2.66 cytoplasm kinase no no
45 0.31 2.95 1.30 0.20 3.64 cytoplasm kinase no no
46 21.28 6.36 0.74 0.90 1.48 cytoplasm kinase yes180 no
47 2.70 9.88 1.53 9.87 8.00 cytoplasm kinase no no
48 1.48 0.23 0.20 0.63 3.85 cytoplasm enzyme no no
49 0.98 3.75 3.92 0.63 3.20 nucleus kinase no no
50 5.69 1.61 0.97 2.05 4.01 unknown enzyme no no
51 0.85 1.50 2.80 0.21 1.19 unknown other no no
52 0.31 5.38 0.85 0.20 3.34 cytoplasm kinase no no
53 1.98 0.78 3.40 0.42 0.86 cytoplasm other yes181 no
54 2.15 0.23 0.20 1.75 0.20 cytoplasm enzyme no no
55 0.56 5.18 0.66 0.20 0.62 nucleus enzyme no no
56 2.03 1.25 2.86 0.40 1.42 extracellular space other yes182 no
57 1.54 0.23 0.20 20.11 0.20 cytoplasm other no no
58 4.85 2.81 0.65 0.50 0.64 plasma membrane other no no
59 1.17 7.73 1.30 0.23 0.99 nucleus kinase yes183 no
60 15.07 1.42 0.63 0.52 1.25 cytoplasm other no no
61 2.34 11.87 1.39 0.90 2.46 unknown other no no
62 0.89 1.68 3.02 0.28 0.87 cytoplasm other yes184 no
63 1.69 7.24 0.64 0.73 1.20 plasma membrane kinase yes185 no
64 3.73 4.04 1.49 1.20 2.74 plasma membrane other yes186 no
65 2.53 10.58 2.76 0.79 1.99 plasma membrane other no no
66 6.04 0.23 0.20 0.87 0.20 nucleus other no no
Flip_Jansen.indd 87 30-7-2013 8:43:49

Discovery anD valiDation of prostate cancer biomarkers88
no.
pC346 immunized (depleted - full) (nev)
pC346 immunized (full) (nev)
pC339 immunized (depleted) (nev)
pC339 immunized (depleted - full) (nev)
pC339 immunized (full) (nev) location type
prior linked to pCa
suggested as pCa biomarker
67 1.74 1.29 1.00 0.42 2.81 unknown other no no
68 4.55 6.31 1.12 3.23 5.14 unknown other no no
69 3.24 13.41 1.53 0.47 1.46 cytoplasm kinase yes187 yes187
70 0.83 1.17 0.90 0.33 28.95 unknown enzyme no no
71 0.31 2.32 1.35 1.36 0.88 no no
72 0.31 4.22 0.42 0.20 1.43 cytoplasm kinase no no
73 1.49 0.93 0.95 0.37 10.01 plasma membrane other no no
74 1.47 1.32 5.70 0.38 0.97 cytoplasm other no no
75 1.83 3.55 2.23 2.62 3.78 nucleus enzyme no no
76 7.25 7.48 1.56 2.83 8.29 cytoplasm other no no
77 4.95 1.53 0.73 1.45 1.13 cytoplasm enzyme no no
78 5.59 0.23 0.20 1.21 0.20 plasma membrane enzyme no no
79 14.15 2.31 1.42 1.60 1.57 cytoplasm enzyme no no
80 2.91 0.23 0.20 2.75 0.20 cytoplasm other no no
81 2.54 31.31 1.77 2.07 3.53 nucleus kinase no no
82 0.70 3.58 0.52 0.20 3.05 plasma membrane kinase yes188 yes189
83 25.50 1.69 0.24 1.26 1.46 plasma membrane kinase no no
84 1.22 11.15 0.99 0.25 0.72 nucleus kinase yes178 no
85 3.14 8.23 1.09 0.76 2.19 cytoplasm other no no
86 15.97 1.75 1.25 0.45 1.34 nucleus transcription regulator yes190 no
87 22.35 2.18 1.29 0.42 1.82 cytoplasm kinase no no
88 6.72 1.31 1.09 4.00 1.50 unknown other no no
89 1.25 1.61 1.75 0.48 7.13 unknown other no no
90 1.87 3.63 0.48 0.35 7.62 cytoplasm kinase no no
91 6.71 1.50 0.55 0.46 0.38 cytoplasm enzyme no no
92 2.29 1.87 6.92 0.87 2.30 cytoplasm other no no
93 1.99 1.51 1.31 0.87 3.68 unknown other no no
94 1.76 2.22 0.86 1.66 1.79 unknown other no no
95 6.52 2.59 0.88 1.49 5.03 unknown other no no
96 5.47 4.82 2.10 2.30 2.13 cytoplasm enzyme no no
97 0.31 3.56 0.63 0.49 1.26 no no
98 1.39 3.46 0.98 0.43 0.83 unknown enzyme no no
99 0.31 4.14 1.27 0.47 1.79 plasma membrane other yes191 no
Flip_Jansen.indd 88 30-7-2013 8:43:50
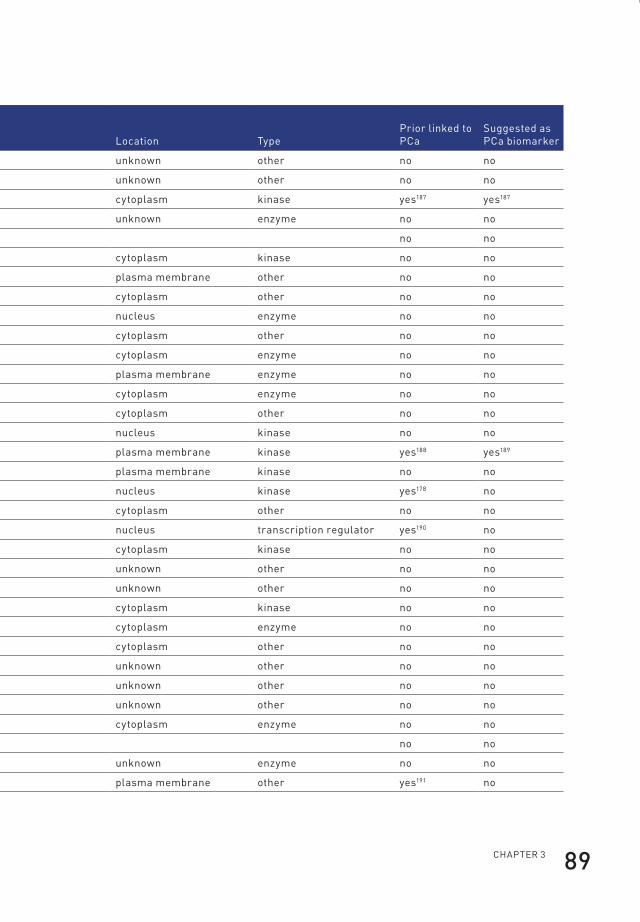
ChApteR 3 89
no.
pC346 immunized (depleted - full) (nev)
pC346 immunized (full) (nev)
pC339 immunized (depleted) (nev)
pC339 immunized (depleted - full) (nev)
pC339 immunized (full) (nev) location type
prior linked to pCa
suggested as pCa biomarker
67 1.74 1.29 1.00 0.42 2.81 unknown other no no
68 4.55 6.31 1.12 3.23 5.14 unknown other no no
69 3.24 13.41 1.53 0.47 1.46 cytoplasm kinase yes187 yes187
70 0.83 1.17 0.90 0.33 28.95 unknown enzyme no no
71 0.31 2.32 1.35 1.36 0.88 no no
72 0.31 4.22 0.42 0.20 1.43 cytoplasm kinase no no
73 1.49 0.93 0.95 0.37 10.01 plasma membrane other no no
74 1.47 1.32 5.70 0.38 0.97 cytoplasm other no no
75 1.83 3.55 2.23 2.62 3.78 nucleus enzyme no no
76 7.25 7.48 1.56 2.83 8.29 cytoplasm other no no
77 4.95 1.53 0.73 1.45 1.13 cytoplasm enzyme no no
78 5.59 0.23 0.20 1.21 0.20 plasma membrane enzyme no no
79 14.15 2.31 1.42 1.60 1.57 cytoplasm enzyme no no
80 2.91 0.23 0.20 2.75 0.20 cytoplasm other no no
81 2.54 31.31 1.77 2.07 3.53 nucleus kinase no no
82 0.70 3.58 0.52 0.20 3.05 plasma membrane kinase yes188 yes189
83 25.50 1.69 0.24 1.26 1.46 plasma membrane kinase no no
84 1.22 11.15 0.99 0.25 0.72 nucleus kinase yes178 no
85 3.14 8.23 1.09 0.76 2.19 cytoplasm other no no
86 15.97 1.75 1.25 0.45 1.34 nucleus transcription regulator yes190 no
87 22.35 2.18 1.29 0.42 1.82 cytoplasm kinase no no
88 6.72 1.31 1.09 4.00 1.50 unknown other no no
89 1.25 1.61 1.75 0.48 7.13 unknown other no no
90 1.87 3.63 0.48 0.35 7.62 cytoplasm kinase no no
91 6.71 1.50 0.55 0.46 0.38 cytoplasm enzyme no no
92 2.29 1.87 6.92 0.87 2.30 cytoplasm other no no
93 1.99 1.51 1.31 0.87 3.68 unknown other no no
94 1.76 2.22 0.86 1.66 1.79 unknown other no no
95 6.52 2.59 0.88 1.49 5.03 unknown other no no
96 5.47 4.82 2.10 2.30 2.13 cytoplasm enzyme no no
97 0.31 3.56 0.63 0.49 1.26 no no
98 1.39 3.46 0.98 0.43 0.83 unknown enzyme no no
99 0.31 4.14 1.27 0.47 1.79 plasma membrane other yes191 no
Flip_Jansen.indd 89 30-7-2013 8:43:50

Discovery anD valiDation of prostate cancer biomarkers90
ACY1
PSMA1
SPATA7
DNAJC12
MRPL51TYRO3
ATF2
DCXR
GSTO1
YKT6CD74
MERTK
IL22
PRKCA
TNFLOC400027
ADRBK2
CCNT1
EPHA5
SUB1ANXA6
AURKA
CTNNA1
CHEK2
FGFR1OP
0 2 4 6 8
pre
imm
un
e (1
)
pre
imm
un
e (2
)
con
trol
imm
un
ized
PC34
6 im
mu
niz
ed (d
eple
ted)
PC34
6 im
mu
niz
ed (d
epl.-
full)
PC34
6 im
mu
niz
ed (f
ull)
PC33
9 im
mu
niz
ed (d
eple
ted)
PC33
9 im
mu
niz
ed (d
epl.-
full)
PC33
9 im
mu
niz
ed (f
ull)
normalized �uorescent expression value
Mou
se 2
nd
Ab
on
ly
Figure 4. Top-ranked ProtoArray-identified proteins.
Heatmap of the top-25 PCa-derived proteins identified in immunized mice by ProtoArray
analysis. A full overview of all identified proteins is depicted in Table 2.
Flip_Jansen.indd 90 30-7-2013 8:43:50
ChApteR 3 91
Validation of identified PCa-derived antigens in serum of xenograft-bearing miceA second confirmation of the experimental setup consisted of the quantification
of identified proteins in the serum of nude athymic mice, mice bearing a PC346 or
PC339 xenograft and in the xenografted tissue. For this purpose, immunoassays
were developed to estimate levels of the two proteins with the highest ProtoArray
expression in immunized mice, aminoacylase 1 (ACY1) and proteasome subunit
alpha type 1 (PSMA1). A commercial immunoassay was obtained to measure levels of
another high-ranked candidate, TYRO3 tyrosine protein kinase (TYRO3), a member
of the TAM family of receptor tyrosine kinases (RTKs) (Figure 4). Figure 5a shows
that ACY1 is detectable in concentrated serum of PC346 and PC339 harbouring
mice and was absent in the concentrated serum of normal non-xenografted nude
mice. In addition, ACY1 was detected in both xenograft protein extracts. The
protein with the second highest ProtoArray expression, PSMA1, was present in the
serum of both xenograft-bearing mice as well as in both xenograft protein extracts,
while absent in the serum of normal nude mice (Figure 5b). TYRO3 was detected in
the concentrated serum of PC346 xenograft-bearing mice and the protein extracts
of both xenografts but absent in the concentrated serum of normal non-xenografted
nude mice and mice harbouring a PC339 xenograft (Figure 5c). Hence, the detection
of ACY1, PSMA1 and TYRO3 in serum of xenograft-bearing mice confirms their
identification by ProtoArray analysis and provides a second validation of the
experimental setup.
Flip_Jansen.indd 91 30-7-2013 8:43:50

Discovery anD valiDation of prostate cancer biomarkers92
0.0
0.5
1.0
1.5
2.0A
AC
Y1
(ng/
mL)
Contro
l mou
se se
rum
1000
10000
100000
B
PSM
A1
(ng
/mL
)
0
20
40
60
80
100
120300
500C
TY
RO
3 (p
g/m
L)
PC346
mou
se se
rum
PC339
mou
se se
rum
PC346
xeno
prote
in
PC339
xeno
prote
in
Contro
l mou
se se
rum
PC346
mou
se se
rum
PC339
mou
se se
rum
PC346
xeno
prote
in
PC339
xeno
prote
in
Contro
l mou
se se
rum
PC346
mou
se se
rum
PC339
mou
se se
rum
PC346
xeno
prote
in
PC339
xeno
prote
in
Figure 5. Expression of identified antigens in xenograft-bearing mice. Mean
concentrations (± standard error of the mean) of ACY1 (panel A), PSMA1 (panel B)
and TYRO3 (panel C) in serum of nude mice, serum of mice bearing a PC346 or PC339
xenograft and PC346 and PC339 xenograft protein extracts.
Flip_Jansen.indd 92 30-7-2013 8:43:51
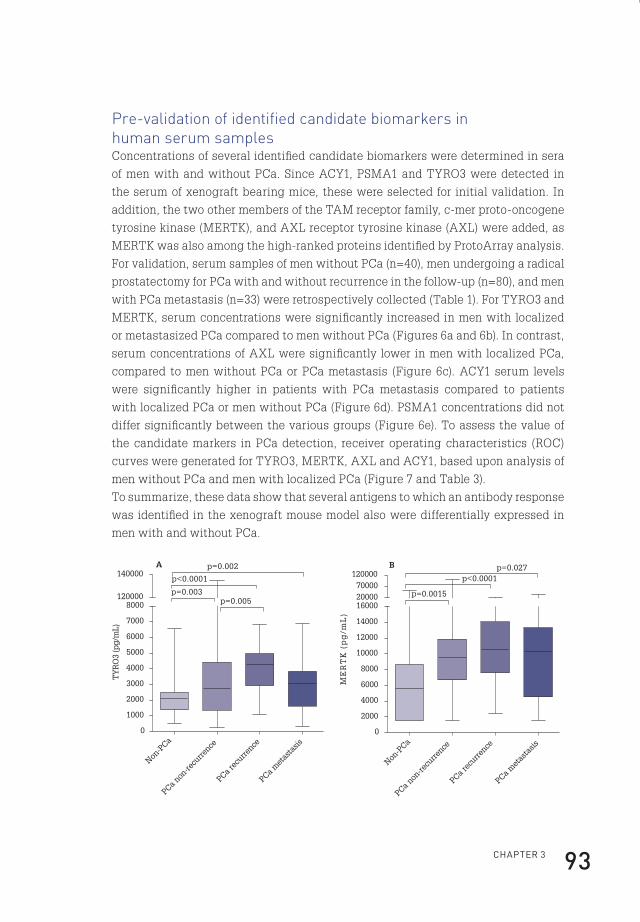
ChApteR 3 93
Pre-validation of identified candidate biomarkers in human serum samplesConcentrations of several identified candidate biomarkers were determined in sera
of men with and without PCa. Since ACY1, PSMA1 and TYRO3 were detected in
the serum of xenograft bearing mice, these were selected for initial validation. In
addition, the two other members of the TAM receptor family, c-mer proto-oncogene
tyrosine kinase (MERTK), and AXL receptor tyrosine kinase (AXL) were added, as
MERTK was also among the high-ranked proteins identified by ProtoArray analysis.
For validation, serum samples of men without PCa (n=40), men undergoing a radical
prostatectomy for PCa with and without recurrence in the follow-up (n=80), and men
with PCa metastasis (n=33) were retrospectively collected (Table 1). For TYRO3 and
MERTK, serum concentrations were significantly increased in men with localized
or metastasized PCa compared to men without PCa (Figures 6a and 6b). In contrast,
serum concentrations of AXL were significantly lower in men with localized PCa,
compared to men without PCa or PCa metastasis (Figure 6c). ACY1 serum levels
were significantly higher in patients with PCa metastasis compared to patients
with localized PCa or men without PCa (Figure 6d). PSMA1 concentrations did not
differ significantly between the various groups (Figure 6e). To assess the value of
the candidate markers in PCa detection, receiver operating characteristics (ROC)
curves were generated for TYRO3, MERTK, AXL and ACY1, based upon analysis of
men without PCa and men with localized PCa (Figure 7 and Table 3).
To summarize, these data show that several antigens to which an antibody response
was identified in the xenograft mouse model also were differentially expressed in
men with and without PCa.
Non-P
Ca
PCa non
-recu
rrence
PCa rec
urrence
PCa met
asta
sis
0
1000
2000
3000
4000
5000
6000
7000
8000120000
140000p<0.0001
p=0.003
p=0.002A
p=0.005
TY
RO
3 (p
g/m
L)
0
2000
4000
6000
8000
10000
12000
14000
160002000070000
120000B p=0.027
p<0.0001
p=0.0015
ME
RT
K (
pg
/mL
)
Non-P
Ca
PCa non
-recu
rrence
PCa rec
urrence
PCa met
asta
sis
Flip_Jansen.indd 93 30-7-2013 8:43:51

Discovery anD valiDation of prostate cancer biomarkers94
0
10000
20000
30000
40000
50000
60000
70000 C *
*
**
*p<0.0001
AX
L (p
g/m
L)
0
100
200
300
400
500
600
700
800 D
p=0.009p<0.0001
p=0.003
AC
Y1
(ng/
mL)
0
1000
2000
3000
400017000
19000E
PSM
A1
(ng
/mL
)
Non-P
Ca
PCa non
-recu
rrence
PCa rec
urrence
PCa met
asta
sis
Non-P
Ca
PCa non
-recu
rrence
PCa rec
urrence
PCa met
asta
sis
Non-P
Ca
PCa non
-recu
rrence
PCa rec
urrence
PCa met
asta
sis
Figure 6. Expression of discovered PCa xenograft-derived antigens in human serum.
Box plots of serum concentrations of TYRO3 (panel A), MERTK (panel B), AXL (panel
C), ACY1 (panel D) and PSMA1 (panel E) in men without PCA, men with PCa without
recurrence, men with PCa and recurrence and men with PCa metastasis. (Boxes,
interquartile range, containing 50% of values; whiskers extending from the highest to
lowest values; line across box, median).
Flip_Jansen.indd 94 30-7-2013 8:43:51

ChApteR 3 95
0 25 50 75 100
0
25
50
75
100
TYRO3 (AUC=0.84)
MERTK (AUC=0.73)
AXL (AUC=0.80)
ACY1 (AUC=0.55)
100%-Speci�city
Sensitivity
Figure 7. Predictive value of identified candidate biomarkers in PCa detection.
ROC curves of TYRO3, MERTK, AXL and ACY1 based on men without PCa and the
combined groups of men with localized PCa. Detailed information on the areas under
the curve (AUCs) is depicted in Table 3.
Table 3. Backward stepwise logistic regression model of identified candidate
biomarkers in PCa. Areas under the curve (AUCs) of TYRO3, MERTK, AXL and ACY1.
AUC (95% Ci) p-value
tyRO3 0.84 (0.77-0.91) <0.0001
MeRtk 0.73 (0.63-0.84) <0.0001
AXl 0.80 (0.71-0.89) <0.0001
ACy1 0.55 (0.44-0.65) 0.41
Flip_Jansen.indd 95 30-7-2013 8:43:51
Discovery anD valiDation of prostate cancer biomarkers96
Discussion
The present study describes a unique xenograft-based biomarker discovery
platform and proves its usefulness in the discovery of novel serum markers for PCa.
By immunizing immuno-competent mice with serum from nude mice bearing PCa
xenografts, an antibody response against xenograft-derived antigens was elicited.
By probing protein microarrays with serum from immunized mice, several PCa-
derived antigens were identified, of which a subset was successfully retrieved in
serum from mice bearing PCa xenografts (Figure 5) and validated in human serum
samples (Figure 6).
A literature search learned that the majority of identified proteins have not been
previously reported in relation with PCa, although some proteins have been proposed
as possible markers (Table 2). Furthermore, the validated candidate biomarkers have
been shown to be present in mouse and human sera in the ng/ml and pg/mL ranges,
which is in the same serologic detection range as PSA, making them feasible for
diagnostic purposes and confirming the ability of this biomarker discovery platform
to detect the low abundant proteins. To exclude the presence of false-positive results
due to possible background noise in the present ProtoArray and immunoassay based
approaches, we performed several control experiments, including samples without
the antigen, with standard series of antigen and preimmune serum hybridizations.
In addition, a ProtoArray was developed with secondary antibody only, showing only
a few protein spots that were quite strongly recognized by the secondary antibody.
Due to the heterogenic nature of PCa, a multitude of different PCa xenografts would
be required to identify markers for each patient subpopulation. For this reason
we utilized two different xenografts in this study, androgen sensitive PC346 and
androgen unresponsive PC339, representing early and late stage disease, from
which we indeed identified differences in antigens (Figure 4 and Table 2). Besides
analysis of xenografts from different origin, also tumour location (e.g. subcutaneous,
orthotopic or bone metastasis) might result in differential xenograft protein
expression and can be studied using our approach.
Distinct differences are seen in detected xenograft-derived antigens between mice
immunized with either full or depleted sera (Figure 4). Only for ACY1, a ProtoArray
response is seen in all samples, while the antibody responses after immunization
with either full or depleted serum seem exclusive. Overall, immunization with
depleted serum showed the least pronounced ProtoArray responses.
This variability can be attributed to the individual antibody-responses between
the immuno-competent mice, as is well-established192-194. Secondly, differences in
antibody responses may be attributable to the use of either full or depleted serum.
Flip_Jansen.indd 96 30-7-2013 8:43:51

ChApteR 3 97
After depletion of high abundant proteins, also low-molecular-weight proteins are
removed, as albumin and immunoglobulin G function as carrier proteins195,196.
Overexpression of TAM receptors has been reported for a wide spectrum of cancers.
With respect to PCa, different expression patterns of AXL and MERTK have been
reported171,197-199. Differences in expression patterns were also observed in the serum
concentrations of the TAM receptors in men with and without PCa in the present
study (Figure 5), strengthened by data extracted from Oncomine, showing an
increased gene expression of MERTK in PCa tissue compared to normal prostate
tissue, while gene expression of AXL shows the opposite (Figure 8)200.
MERTK
Normal prostate PCa
-1
0
1
2
3
Normal prostate PCa
-0.50
-0.25
0.00
0.25
0.50
0.75
AXL
nor
mal
ized
exp
ress
ion
un
its
nor
mal
ized
exp
ress
ion
un
its
Figure 8. Expression of MERTK and AXL in normal and PCa tissue. Oncomine gene
expression results of TAM receptors over- or underexpressed in normal prostate
compared to PCa tissue showing opposite patterns for MERTK and AXL. Significant
results regarding TYRO3 expression in normal compared to malignant prostate tissue
are not available. (P-value threshold: 1E-4; Outlier rank threshold: 50)
Recently, the proteasome β6 subunit was identified in serum from PCa patients141.
The contrasting finding of high concentrations in serum xenograft-bearing mice
and the absence of increased PSMA1 concentrations in men with PCa may be
explained by the fact that the amount of released proteasomes from PCa cells does
not significantly contribute to the total amount of proteasomes circulating under
normal physiological conditions.
ACY1 has been detected as overexpressed in PCa needle biopsy specimens165. The
present study showed that ACY1 concentrations were significantly higher in men
with PCa metastasis compared to men without PCa or with localized PCa. ACY1 may
thus function as a potential marker for patients suspected of having disseminated
disease.
Flip_Jansen.indd 97 30-7-2013 8:43:52
DisCOveRy AnD vAliDAtiOn Of pROstAte CAnCeR biOMARkeRs98
To conclude, this study shows that by utilizing a unique xenograft-based
immunization method it is possible to detect novel PCa biomarkers. The same
approach could be taken for any human cancer, greatly assisting current biomarker
discovery. The initial results of TYRO3, MERTK and AXL with respect to PCa
detection are promising, although further validation of these and other candidate
biomarkers in multi-center series is necessary.
AcknowledgementsWe are indebted to C. de Ridder (Department of Urology) and Wilfred van IJcken
(Center for Biomics) for technical assistance. The authors thank dr. E. Schenk
(Department of Urology) and drs. Th. M. Luider, L. J. Dekker and P. Burger
(Department of Neurology) for their advice throughout this project. We thank Prof.
dr. F.H. Schröder of the Rotterdam arm of the European Study of Screening for
Prostate Cancer for providing human serum samples.
FundingThis work was supported by a grant from the Adessium Foundation and an Erasmus
MC Translational Research Grant.
Flip_Jansen.indd 98 30-7-2013 8:43:52

cHapter 4
cHap
ter
4
Flip_Jansen.indd 99 30-7-2013 8:43:52

cHapter 4
prostate-specific antiGen isoform p2psa in combination WitH total psa anD free psa improves DiaGnostic accuracy in prostate cancer Detection
european urology. 2010 June;57(6):921-7*flip H. Jansen1
ron H.n. van schaik2
Joep kurstjens2
Wolfgang Horninger3
Helmut klocker3
Jasmin bektic3
mark f. Wildhagen1
monique J. roobol1
chris H. bangma1
Georg bartsch3
1 Department of Urology, erasmus MC, Rotterdam;2 Department of Clinical Chemistry, erasmus MC, Rotterdam, the netherlands;3 Department of Urology, innsbruck Medical University, Austria
* Reprinted with permission from european Urology
Flip_Jansen.indd 100 30-7-2013 8:43:52
ChApteR 4 101
abstract
Background: Novel markers for prostate cancer (PCa) detection are needed.
Total prostate-specific antigen (tPSA) and percent free prostate-specific antigen
(%fPSA = tPSA/fPSA) lack diagnostic specificity.
Objective: To evaluate the use of prostate-specific antigen (PSA) isoforms p2PSA
and benign prostatic hyperplasia–associated PSA (BPHA).
Design, setting, and participants: Our study included 405 serum samples from the
Rotterdam arm of the European Randomised Study of Screening for Prostate Cancer
and 351 samples from the Urology Department of Innsbruck Medical University.
Measurements: BPHA, tPSA, fPSA, and p2PSA levels were measured by Beckman-
Coulter Access Immunoassay. In addition, the Beckman Coulter Prostate Health
Index was calculated: phi = (p2PSA/fPSA) x √(tPSA).
Results and limitations: The p2PSA and phi levels differed significantly between
men with and without PCa. No difference in BPHA levels was observed. The highest
PCa predictive value in both cohorts was achieved by phi with areas under the
curve (AUCs) of 0.750 and 0.709, a significant increase compared to tPSA (AUC:
0.585 and 0.534) and %fPSA (AUC: 0.675 and 0.576). Also, %p2PSA (p2PSA/fPSA)
showed significantly higher AUCs compared to tPSA and %fPSA (AUC: 0.716 and
0.695, respectively). At 95% and 90% sensitivity, the specificities of phi were 23% and
31% compared to 10% and 8% for tPSA, respectively. In both cohorts, multivariate
analysis showed a significant increase in PCa predictive value after addition of
p2PSA to a model consisting of tPSA and fPSA (increase in AUC from 0.675 to 0.755
and from 0.581 to 0.697, respectively). Additionally, the specificity at 95% sensitivity
increased from 8% to 24% and 7% to 23%, respectively. Furthermore, %p2PSA, phi,
and the model consisting of tPSA and fPSA with or without the addition of p2PSA
missed the least of the tumours with a biopsy or pathologic Gleason score ≥7 at 95%
and 90% sensitivity.
Conclusions: This study shows significant increases in PCa predictive value and
specificity of phi and %p2PSA compared to tPSA and %fPSA. p2PSA has limited
additional value in identifying aggressive PCa (Gleason score ≥7).
introduction
Because serum total prostate-specific antigen (tPSA) and percent free prostate-
specific antigen (%fPSA) lack clear thresholds balancing specificity and sensitivity
for the early detection of prostate cancer (PCa), continuous efforts are being made
to discover new PCa markers. Detailed examination of the free prostate-specific
Flip_Jansen.indd 101 30-7-2013 8:43:52
Discovery anD valiDation of prostate cancer biomarkers102
antigen (fPSA) fraction resulted in the identification of several distinctive fPSA
forms, among which a mixture of precursor isoforms of prostate-specific antigen
(pPSA or proPSA) and a form designated ‘‘benign’’ PSA (i.e., benign prostatic
hyperplasia–associated PSA [BPHA])52-54,58,59,201. A study specifically concentrating
on the precursor isoform of PSA containing two amino acids in the propeptide leader
confirmed the presence of [-2]proPSA in serum of men with PCa, in which [-2]proPSA
formed 25–95% of the fPSA fraction, in contrast with 6–19% in biopsy-negative
men201. Initial reports investigating the clinical value of [-2]proPSA in screening for
PCa showed that [-2]proPSA serum concentrations were in general higher in men
with PCa compared to men without cancer61-64. Recently, reports by Sokoll et al.202
and Stephan et al.203 showed that [-2]proPSA is able to significantly improve PCa
detection. Characterisation of BPHA showed that it contains 237 amino acids like
PSA but is clipped at several specific amino acid residues58. Measurement of BPHA
concentrations in serum demonstrated that BPHA represented 25% of the fPSA
in biopsy-negative men and was significantly higher in benign compared to PCa
serum59. Furthermore, BPHA outperformed fPSA as well as tPSA in the prediction
of transition zone enlargement60. A recent study evaluating the use of BPHA in
discriminating PCa patients from patients without evidence of PCa showed that
BPHA might improve PCa detection204. Results on a possible prognostic role for
BPHA as well as [-2]proPSA have proven inconclusive81,82,203,204. In this two-centre
study, both p2PSA and BPHA serum concentrations were measured in men with
and without PCa to evaluate the additional clinical utility of p2PSA and BPHA next
to tPSA and fPSA in a screening setting for PCa. (Note that the analyte is referred
to as [-2]proPSA and the assay as p2PSA; for simplicity, p2PSA is used throughout
the remainder of this report.) Also, several calculated derivatives, among which the
Beckman Coulter Prostate Health Index (phi), a mathematical combination of PSA,
fPSA, and p2PSA, were assessed. In addition, all analysed variables were assessed
with respect to biopsy and pathologic Gleason scores and their ability to detect
cancers with a Gleason score of ≥7.
patients and methods
Patient selectionSerum samples from site 1 were obtained from the biorepository of the Rotterdam
arm of the European Study of Screening for Prostate Cancer. From 1994 to February
1997, indications for a prostate biopsy consisted of a tPSA level >4.0 ng/ml, abnormal
digital rectal examination (DRE), or abnormal transrectal ultrasound (TRUS). In 1997,
this combination was replaced by PSA testing only205. Serum samples from site 2 were
Flip_Jansen.indd 102 30-7-2013 8:43:52

ChApteR 4 103
enrolled from the PCa screening study at the Urology Department of the University
of Innsbruck, which started in 1993. Indications for biopsy were based upon cancer
probabilities estimated by an artificial neural network including tPSA, fPSA, age,
DRE, and TRUS206. In addition, the concept of PSA velocity was incorporated in the
diagnostic evaluation in 2005206. Only screen-detected samples of men with and
without PCa were included in the present study. Inclusion criteria were age ≥50 yr, a
tPSA concentration of 2–10 ng/ ml, a performed TRUS-guided needle biopsy (six or
more cores), and a histologically confirmed diagnosis. Exclusion criteria were a prior
history of PCa, acute prostatitis, urinary tract infection, prior transurethral resection
of the prostate, and use of drugs or other therapies within 6 wk preceding blood
draw that might influence PSA concentration. Blood specimens were processed and
refrigerated within 3 h of blood draw and stored at -80 °C. A total of 405 men could
be enrolled at site 1 (226 PCa cases, 179 non-PCa cases) and a total of 351 men at site
2 (174 PCa cases, 177 non-PCa cases).
Measurement of tPSA, fPSA, p2PSA, and BPHA serum concentrationsAt both sites, archival serum samples were analysed for tPSA, fPSA, p2PSA, and
BPHA on the Access 2 Immunoassay System (Beckman Coulter, Brea, CA, USA)
using the following serum assays: the US Food and Drug Association–approved
Access Hybritech PSA and Access Hybritech free PSA; Access BPHA, which
measures BPHA; and p2PSA, which measures p2PSA (the latter two for research use only, not for patient management). All assays were performed from one sample
cup and used the same batch of calibrators. tPSA and fPSA results were obtained in
single determinations, BPHA and p2PSA in duplicate determination. The analysis
was repeated in case of a coefficient of variation >20%.
Statistical analysisAll statistical analyses were performed using the SPSS v.15.0 software package
(SPSS, Chicago, IL, USA). Differences between men with and without PCa in median
levels of tPSA, fPSA, BPHA, and p2PSA were examined using the Mann-Whitney
U test with two-sided p values. Calculated derivatives of the assayed variables
included Hybritech phi, Beckman Coulter’s mathematical combination of PSA,
fPSA, and p2PSA. Beckman Coulter phi was calculated as (p2PSA/fPSA) x √(tPSA),
representing a simplified version of a logistic regression model developed at
Beckman Coulter. In addition, %fPSA (fPSA/tPSA x 100) and %p2PSA (p2PSA/fPSA
x 100) were calculated. The areas under the receiver operator characteristic (ROC)
area under the curve (AUC) as well as sensitivity and specificity were calculated to
assess the diagnostic performances in PCa detection of the various assays. AUCs
Flip_Jansen.indd 103 30-7-2013 8:43:52

Discovery anD valiDation of prostate cancer biomarkers104
of the ROC curves were compared using the method of DeLong et al207. In addition,
p2PSA was added to a multivariate model based on tPSA and fPSA to specifically
assess its additive value. Furthermore, using the Mann- Whitney U test with two-
sided p values, median values of all assessed variables were compared in tumours
with biopsy or pathologic Gleason score below or above 7. The number of missed
cancers with biopsy or pathologic Gleason score of ≥7 was calculated at sensitivities
of 95% or 90% for tPSA, %fPSA, %p2PSA, and phi.
results
Patient characteristics are depicted in Table 1. Overall characteristics did not differ
significantly except for the number of unknown pathologic Gleason scores and the
number of men who underwent prostatectomy. In both cohorts, the percentage of
tumours with a pathologic Gleason score ≥7 was higher than at the initial biopsy
because of upgrading based on the prostatectomy specimen.
Table 1. Characteristics of both cohorts of men with and without prostate cancer to
assess the additive value of p2PSA and BPHA next to total PSA and free PSA.
site 1 site 2 p-value
total no. of included men 405 351
pCa cases (%) 226 (55.8) 174 (49.6) ns
non-pCa cases (%) 179 (44.2) 177 (50.4) ns
Age range (yrs) (median) 55-75 (66) 50-77 (60) ns
tpsA range (ng/ml) (median) 2.0-10.0 (4.4) 2.0-9.7 (4.3) ns
biopsy Gleason score (%)
<7 168 (74.3) 122 (70.1) ns
≥7 55 (24.3) 48 (27.6) ns
Unknown 3 (1.3) 4 (2.3) ns
no. of men that underwent prostatectomy (%) 162 (71.7) 174 (100.0) p<0.0001
pathological Gleason score (%)
<7 96 (59.3) 88 (50.6) ns
≥7 53 (32.7) 86 (49.4) ns
Unknown 13 (8.0) 0 (0) p=0.0001
Flip_Jansen.indd 104 30-7-2013 8:43:52
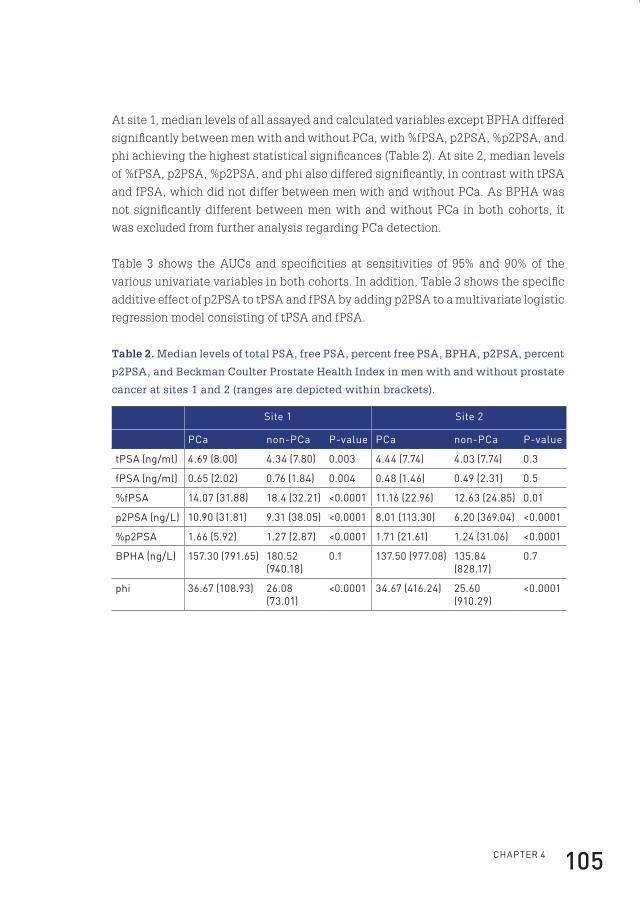
ChApteR 4 105
At site 1, median levels of all assayed and calculated variables except BPHA differed
significantly between men with and without PCa, with %fPSA, p2PSA, %p2PSA, and
phi achieving the highest statistical significances (Table 2). At site 2, median levels
of %fPSA, p2PSA, %p2PSA, and phi also differed significantly, in contrast with tPSA
and fPSA, which did not differ between men with and without PCa. As BPHA was
not significantly different between men with and without PCa in both cohorts, it
was excluded from further analysis regarding PCa detection.
Table 3 shows the AUCs and specificities at sensitivities of 95% and 90% of the
various univariate variables in both cohorts. In addition, Table 3 shows the specific
additive effect of p2PSA to tPSA and fPSA by adding p2PSA to a multivariate logistic
regression model consisting of tPSA and fPSA.
Table 2. Median levels of total PSA, free PSA, percent free PSA, BPHA, p2PSA, percent
p2PSA, and Beckman Coulter Prostate Health Index in men with and without prostate
cancer at sites 1 and 2 (ranges are depicted within brackets).
site 1 site 2
pCa non-pCa p-value pCa non-pCa p-value
tpsA (ng/ml) 4.69 (8.00) 4.34 (7.80) 0.003 4.44 (7.74) 4.03 (7.74) 0.3
fpsA (ng/ml) 0.65 (2.02) 0.76 (1.84) 0.004 0.48 (1.46) 0.49 (2.31) 0.5
%fpsA 14.07 (31.88) 18.4 (32.21) <0.0001 11.16 (22.96) 12.63 (24.85) 0.01
p2psA (ng/l) 10.90 (31.81) 9.31 (38.05) <0.0001 8.01 (113.30) 6.20 (369.04) <0.0001
%p2psA 1.66 (5.92) 1.27 (2.87) <0.0001 1.71 (21.61) 1.24 (31.06) <0.0001
bphA (ng/l) 157.30 (791.65) 180.52 (940.18)
0.1 137.50 (977.08) 135.84 (828.17)
0.7
phi 36.67 (108.93) 26.08 (73.01)
<0.0001 34.67 (416.24) 25.60 (910.29)
<0.0001
Flip_Jansen.indd 105 30-7-2013 8:43:52
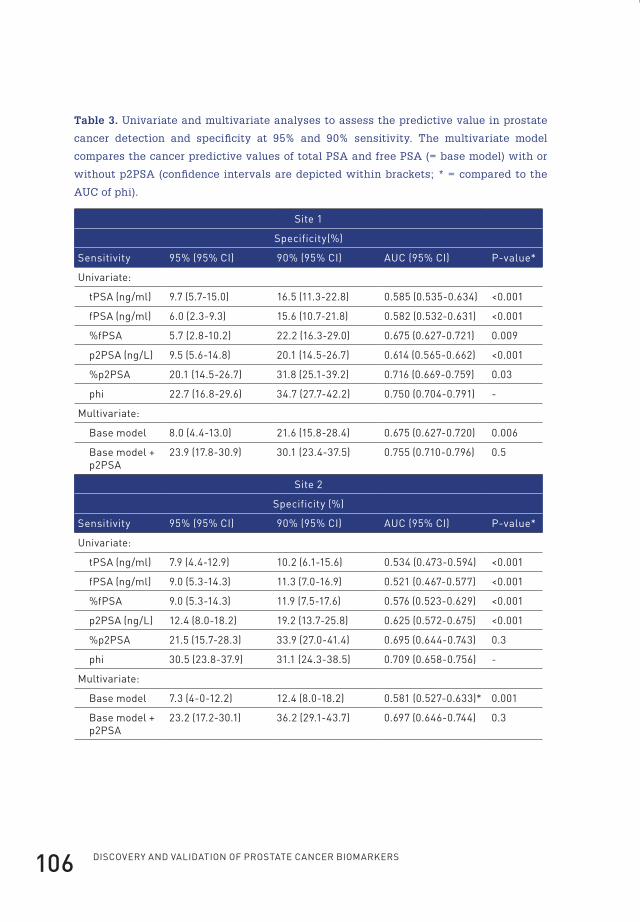
Discovery anD valiDation of prostate cancer biomarkers106
Table 3. Univariate and multivariate analyses to assess the predictive value in prostate
cancer detection and specificity at 95% and 90% sensitivity. The multivariate model
compares the cancer predictive values of total PSA and free PSA (= base model) with or
without p2PSA (confidence intervals are depicted within brackets; * = compared to the
AUC of phi).
site 1
specificity(%)
sensitivity 95% (95% Ci) 90% (95% Ci) AUC (95% Ci) p-value*
Univariate:
tpsA (ng/ml) 9.7 (5.7-15.0) 16.5 (11.3-22.8) 0.585 (0.535-0.634) <0.001
fpsA (ng/ml) 6.0 (2.3-9.3) 15.6 (10.7-21.8) 0.582 (0.532-0.631) <0.001
%fpsA 5.7 (2.8-10.2) 22.2 (16.3-29.0) 0.675 (0.627-0.721) 0.009
p2psA (ng/l) 9.5 (5.6-14.8) 20.1 (14.5-26.7) 0.614 (0.565-0.662) <0.001
%p2psA 20.1 (14.5-26.7) 31.8 (25.1-39.2) 0.716 (0.669-0.759) 0.03
phi 22.7 (16.8-29.6) 34.7 (27.7-42.2) 0.750 (0.704-0.791) -
Multivariate:
base model 8.0 (4.4-13.0) 21.6 (15.8-28.4) 0.675 (0.627-0.720) 0.006
base model + p2psA
23.9 (17.8-30.9) 30.1 (23.4-37.5) 0.755 (0.710-0.796) 0.5
site 2
specificity (%)
sensitivity 95% (95% Ci) 90% (95% Ci) AUC (95% Ci) p-value*
Univariate:
tpsA (ng/ml) 7.9 (4.4-12.9) 10.2 (6.1-15.6) 0.534 (0.473-0.594) <0.001
fpsA (ng/ml) 9.0 (5.3-14.3) 11.3 (7.0-16.9) 0.521 (0.467-0.577) <0.001
%fpsA 9.0 (5.3-14.3) 11.9 (7.5-17.6) 0.576 (0.523-0.629) <0.001
p2psA (ng/l) 12.4 (8.0-18.2) 19.2 (13.7-25.8) 0.625 (0.572-0.675) <0.001
%p2psA 21.5 (15.7-28.3) 33.9 (27.0-41.4) 0.695 (0.644-0.743) 0.3
phi 30.5 (23.8-37.9) 31.1 (24.3-38.5) 0.709 (0.658-0.756) -
Multivariate:
base model 7.3 (4-0-12.2) 12.4 (8.0-18.2) 0.581 (0.527-0.633)* 0.001
base model + p2psA
23.2 (17.2-30.1) 36.2 (29.1-43.7) 0.697 (0.646-0.744) 0.3
Flip_Jansen.indd 106 30-7-2013 8:43:52
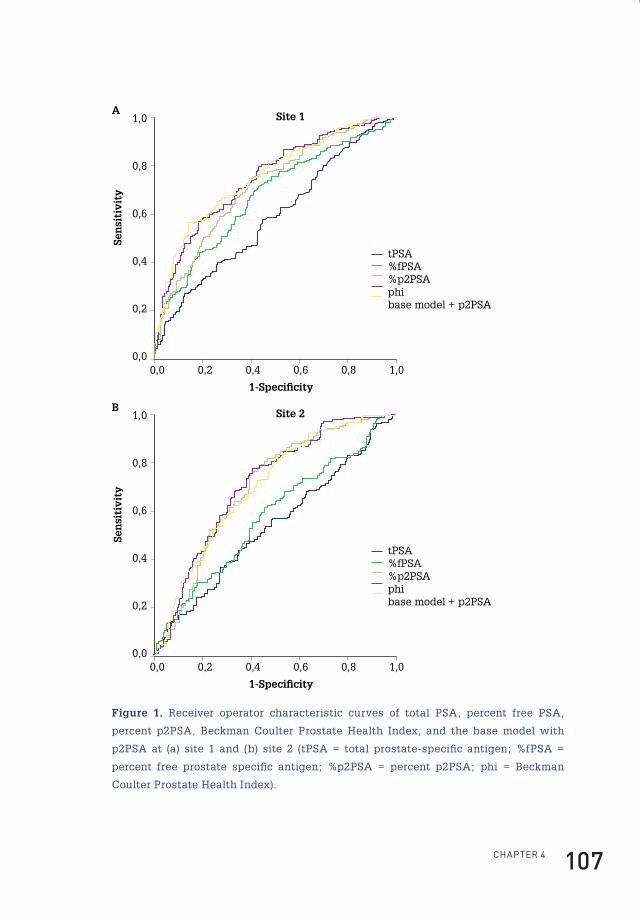
ChApteR 4 107
Site 1
1-Speci�city
Sen
siti
vity
0,0 0,2 0,4 0,6 0,8 1,0
1,0
0,8
0,6
0,4
0,2
0,0
tPSA%fPSA%p2PSAphibase model + p2PSA
A
Site 2
1-Speci�city
Sen
siti
vity
0,0 0,2 0,4 0,6 0,8 1,0
1,0
0,8
0,6
0,4
0,2
0,0
tPSA%fPSA%p2PSAphibase model + p2PSA
B
Figure 1. Receiver operator characteristic curves of total PSA, percent free PSA,
percent p2PSA, Beckman Coulter Prostate Health Index, and the base model with
p2PSA at (a) site 1 and (b) site 2 (tPSA = total prostate-specific antigen; %fPSA =
percent free prostate specific antigen; %p2PSA = percent p2PSA; phi = Beckman
Coulter Prostate Health Index).
Flip_Jansen.indd 107 30-7-2013 8:43:52
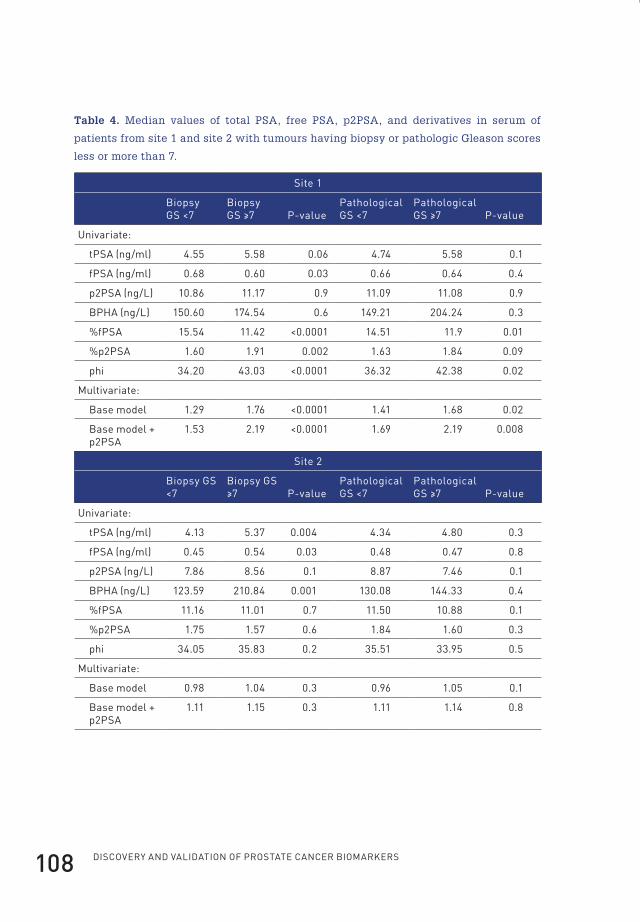
Discovery anD valiDation of prostate cancer biomarkers108
Table 4. Median values of total PSA, free PSA, p2PSA, and derivatives in serum of
patients from site 1 and site 2 with tumours having biopsy or pathologic Gleason scores
less or more than 7.
site 1
biopsy Gs <7
biopsy Gs ≥7 p-value
pathological Gs <7
pathological Gs ≥7 p-value
Univariate:
tpsA (ng/ml) 4.55 5.58 0.06 4.74 5.58 0.1
fpsA (ng/ml) 0.68 0.60 0.03 0.66 0.64 0.4
p2psA (ng/l) 10.86 11.17 0.9 11.09 11.08 0.9
bphA (ng/l) 150.60 174.54 0.6 149.21 204.24 0.3
%fpsA 15.54 11.42 <0.0001 14.51 11.9 0.01
%p2psA 1.60 1.91 0.002 1.63 1.84 0.09
phi 34.20 43.03 <0.0001 36.32 42.38 0.02
Multivariate:
base model 1.29 1.76 <0.0001 1.41 1.68 0.02
base model + p2psA
1.53 2.19 <0.0001 1.69 2.19 0.008
site 2
biopsy Gs <7
biopsy Gs ≥7 p-value
pathological Gs <7
pathological Gs ≥7 p-value
Univariate:
tpsA (ng/ml) 4.13 5.37 0.004 4.34 4.80 0.3
fpsA (ng/ml) 0.45 0.54 0.03 0.48 0.47 0.8
p2psA (ng/l) 7.86 8.56 0.1 8.87 7.46 0.1
bphA (ng/l) 123.59 210.84 0.001 130.08 144.33 0.4
%fpsA 11.16 11.01 0.7 11.50 10.88 0.1
%p2psA 1.75 1.57 0.6 1.84 1.60 0.3
phi 34.05 35.83 0.2 35.51 33.95 0.5
Multivariate:
base model 0.98 1.04 0.3 0.96 1.05 0.1
base model + p2psA
1.11 1.15 0.3 1.11 1.14 0.8
Flip_Jansen.indd 108 30-7-2013 8:43:53
ChApteR 4 109
To investigate the influence of DRE results, all analyses described above were
repeated after exclusion of all men with suspicious DRE results. This produced
nearly identical results (data not shown). To assess the relationship between the
assayed variables and Gleason score, median values were related to biopsy and
pathologic Gleason score above or below 7. At site 1, the highest statistical difference
in relationship to biopsy Gleason score was achieved by %fPSA, phi, and the base
model with or without p2PSA (Table 4).
In relationship to pathologic Gleason score, the base model including p2PSA
achieved the highest clinical significance followed by %fPSA and phi. In contrast, at
site 2, the highest statistical difference in relationship to biopsy Gleason score was
reached by BPHA followed by tPSA and fPSA. None of the assayed variables reached
statistical significance in discriminating tumours with pathologic Gleason score
above or below 7. In addition, we assessed which variable would miss the least
number of tumours with a biopsy or pathologic Gleason score ≥7. At site 1, at 95%
and 90% sensitivity, %p2PSA, phi, and the base model with or without p2PSA missed
the least number of tumours with a biopsy or pathologic Gleason score ≥7 (Table 5).
At site 2, at 95% sensitivity, %p2PSA and the base model consisting of fPSA and
tPSA missed the least number of tumours with a biopsy Gleason score of ≥7. At 90%
sensitivity, the base model with the addition of p2PSA missed the least number of
tumours with a biopsy Gleason score ≥7. At 95% sensitivity, %p2PSA missed the least
number of tumours with a pathologic Gleason score ≥7, whereas at 90% sensitivity,
the least number of tumours with a pathologic Gleason score ≥7 were missed by the
base model with p2PSA included.
Flip_Jansen.indd 109 30-7-2013 8:43:53
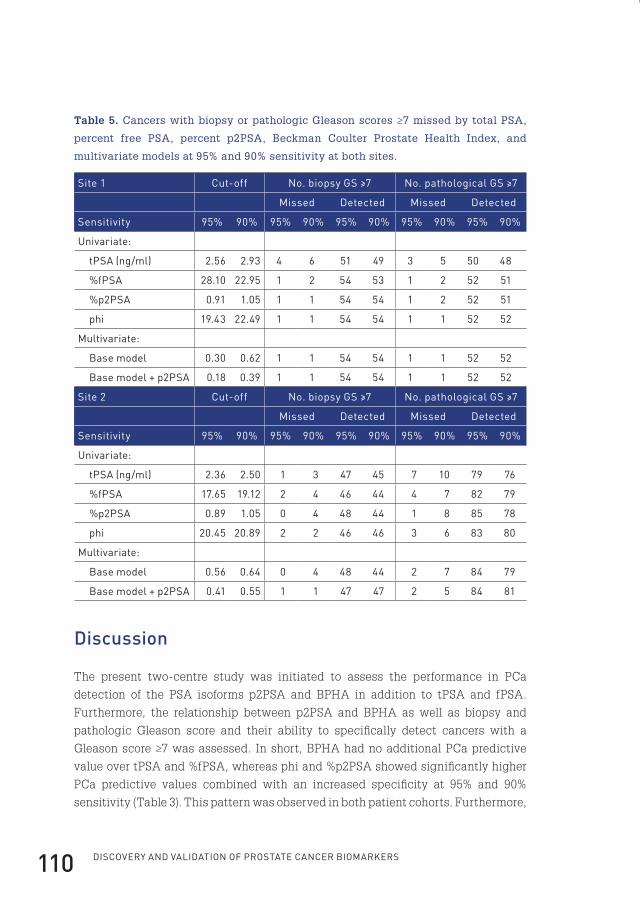
Discovery anD valiDation of prostate cancer biomarkers110
Table 5. Cancers with biopsy or pathologic Gleason scores ≥7 missed by total PSA,
percent free PSA, percent p2PSA, Beckman Coulter Prostate Health Index, and
multivariate models at 95% and 90% sensitivity at both sites.
site 1 Cut-off no. biopsy Gs ≥7 no. pathological Gs ≥7
Missed Detected Missed Detected
sensitivity 95% 90% 95% 90% 95% 90% 95% 90% 95% 90%
Univariate:
tpsA (ng/ml) 2.56 2.93 4 6 51 49 3 5 50 48
%fpsA 28.10 22.95 1 2 54 53 1 2 52 51
%p2psA 0.91 1.05 1 1 54 54 1 2 52 51
phi 19.43 22.49 1 1 54 54 1 1 52 52
Multivariate:
base model 0.30 0.62 1 1 54 54 1 1 52 52
base model + p2psA 0.18 0.39 1 1 54 54 1 1 52 52
site 2 Cut-off no. biopsy Gs ≥7 no. pathological Gs ≥7
Missed Detected Missed Detected
sensitivity 95% 90% 95% 90% 95% 90% 95% 90% 95% 90%
Univariate:
tpsA (ng/ml) 2.36 2.50 1 3 47 45 7 10 79 76
%fpsA 17.65 19.12 2 4 46 44 4 7 82 79
%p2psA 0.89 1.05 0 4 48 44 1 8 85 78
phi 20.45 20.89 2 2 46 46 3 6 83 80
Multivariate:
base model 0.56 0.64 0 4 48 44 2 7 84 79
base model + p2psA 0.41 0.55 1 1 47 47 2 5 84 81
Discussion
The present two-centre study was initiated to assess the performance in PCa
detection of the PSA isoforms p2PSA and BPHA in addition to tPSA and fPSA.
Furthermore, the relationship between p2PSA and BPHA as well as biopsy and
pathologic Gleason score and their ability to specifically detect cancers with a
Gleason score ≥7 was assessed. In short, BPHA had no additional PCa predictive
value over tPSA and %fPSA, whereas phi and %p2PSA showed significantly higher
PCa predictive values combined with an increased specificity at 95% and 90%
sensitivity (Table 3). This pattern was observed in both patient cohorts. Furthermore,
Flip_Jansen.indd 110 30-7-2013 8:43:53
ChApteR 4 111
multivariate analysis showed that the addition of p2PSA to a logistic regression
model consisting of tPSA and fPSA significantly increased PCa predictive value
and specificity (Table 3). Exclusion of men with suspicious DRE results resulted
in similar outcomes (data not shown). Regarding BPHA, our findings are similar
compared to those of prior reports, which showed that BPHA as a single marker is
unable to predict the presence of PCa59,60,63,82. However, BPHA might be of limited
additional value in combination with existing markers, as was illustrated by a
recent study by Stephan et al., but these results could not be reproduced by the
present study (data not shown)204. In contrast, p2PSA and %p2PSA levels have
been shown to be significantly elevated in men with PCa, resulting in an increase
in PCa predictive value compared to %fPSA61,62,202,203. These results are confirmed
in the present study, not only by univariate analysis but also by the addition of
p2PSA to a logistic regression model consisting of tPSA and fPSA (Tables 2 and
3). In addition, the present study evaluated the performance of phi, a calculated
derivative of p2PSA, fPSA, and tPSA. Comparable to p2PSA levels, phi is significantly
elevated in men with PCa (Table 2). With respect to PCa predictive value, phi
performed significantly better than tPSA and %fPSA. In cohort 1, phi performed
significantly better than %p2PSA, whereas in cohort 2, no difference was observed.
When compared to the multivariate model consisting of tPSA, fPSA, and p2PSA,
no significant difference in PCa predictive value was observed. Unfortunately, as
data regarding prostate volume were lacking in a large proportion of patients, the
performance of tPSA density and other density derivatives of the assayed variables
could not be assessed. Regarding the detection of PCa with a Gleason score ≥7,
phi, %fPSA, and the multivariate model with or without p2PSA performed equally
in cohort 1, so showing no specific additional value of p2PSA (Tables 4 and 5). At
site 2, BPHA and tPSA showed the highest significance in relationship to biopsy
Gleason scores, whereas none of the assayed variables showed a significant
relationship with pathologic Gleason score. Overall, no large differences between
the various variables regarding the specific detection of PCa with Gleason score ≥7
were observed. These results are in contrast with Catalona et al.81 and Stephan
et al.203, who showed that %p2PSA had selectivity for detecting PCa with Gleason
score ≥7. Another observation is the fact that tPSA and fPSA concentrations did not
differ significantly between men with and without PCa at site 2 in contrast with
site 1. These differences may largely result from discrepancies in the assays and
nomograms used for initial patient screening, resulting in cohorts with different PCa
characteristics (see section 2). A second explanation could be that at site 2, a greater
proportion of PCa cases were detected in later screening rounds. It has been shown
that the predictive value of tPSA decreases in successive screening rounds208-210.
This might be reflected in the fact that no significant relationship between tPSA
Flip_Jansen.indd 111 30-7-2013 8:43:53
DisCOveRy AnD vAliDAtiOn Of pROstAte CAnCeR biOMARkeRs112
and the presence of PCa was observed in cohort 2. Furthermore, the observed
differences between the two cohorts regarding biopsy and pathologic Gleason score
and the assayed variables, especially BPHA, might be contributable to the fact that
Gleason scores were assigned by different pathologists at both centres. In addition,
the number of patients with a known pathologic Gleason score might have been too
small to detect significant relationships. Another point of concern could be the risk
of a type one error resulting from the number of statistical tests and using an α level
of 0.05. However, to reduce the risk of a type two error, we have chosen not to apply a
correction method, such as the Bonferroni correction. Although differences between
both PCa cohorts exist, p2PSA and phi differ significantly between men with and
without PCa in both cohorts and are able to correctly predict the presence of PCa.
In addition, p2PSA showed a specific additional increase in PCa predictive value
when added to a multivariate model consisting of tPSA and fPSA. p2PSA has limited
additional value in identifying men with aggressive PCa (Gleason score ≥7). Further
study is needed to clearly define the definitive value of p2PSA in PCa detection
and its ability to modify the number of men undergoing prostate biopsy. Especially,
the performance of phi should be further evaluated, as other data investigating phi
are currently lacking. Preferentially, these should be prospective studies based on
direct PCa screening by p2PSA.
conclusions
The present study shows that p2PSA and, moreover, %p2PSA and phi could have
additional value with respect to tPSA and %fPSA in PCa detection within the tPSA
range of 2– 10 ng/ml by significantly increasing the predictive value and specificity
for PCa. By increasing the clinical specificity of phi and p2PSA relative to tPSA
and fPSA, the use of phi and p2PSA could potentially modify the number of men
receiving a recommendation for biopsy. In addition, p2PSA has limited additional
value in identifying men with aggressive PCa (Gleason score ≥7).
Financial disclosureBeckman Coulter Inc. provided an educational grant for the purpose of this study.
Flip_Jansen.indd 112 30-7-2013 8:43:53

cHapter 5
cHap
ter
5
Flip_Jansen.indd 113 30-7-2013 8:43:53
cHapter 5
clinical impact of neW prostate-specific antiGen WHo stanDarDisation on biopsy rates anD cancer Detection
clinical chemistry. 2008 December;54(12):1999-2006*
f.H. Jansen1
m. roobol1
c.H. bangma1
r.H.n. van schaik2
1 Department of Urology, erasmus MC, Rotterdam;2 Department of Clinical Chemistry, erasmus MC, Rotterdam, the netherlands
* Reprinted with permission from Clinical Chemistry
Flip_Jansen.indd 114 30-7-2013 8:43:53
ChApteR 5 115
abstract
Background: Clinicians may be unaware that replacement of the historical total
prostate-specific antigen (tPSA) standard with the WHO 96/670 international
standard leads to difficulties in interpreting tPSA results. Our aim was to investigate
the relationship between the Hybritech and WHO calibrations of the Beckman
Coulter tPSA assay, and to assess the impact on prostate cancer (PCa) detection.
Methods: tPSA concentrations were measured in 106 serum samples with both
Hybritech and WHO calibrations. The established relationships were used for an in
silico experiment with a cohort of 5865 men. Differences in prostate biopsy rates,
PCa detection, and characteristics of missed cancers were calculated at biopsy
thresholds of 3.0 and 4.0 ng/ml.
Results: A linear relationship was observed between the 2 calibrations, with a 20.3%
decrease in tPSA values with the WHO standard compared with the Hybritech
calibration. Applying the WHO calibration to the cohort of 5865 men yielded a 20%
or 19% decrease in prostate biopsies and a 19% or 20% decrease in detected cancers
compared with the Hybritech calibration, at a cut-off for biopsy of 3.0 or 4.0 ng/ml,
respectively. The decrease in detected cancers declined to 9% or 11% if an abnormal
result in a digital rectal examination or a transrectal ultrasound evaluation was used
as trigger for prostate biopsy (cut-off of 3.0 or 4.0 ng/ml, respectively).
Conclusions: Application of the WHO standard for tPSA assays with commonly used
tPSA thresholds leads to a significant decrease in PCa detection. Careful assessment
of the relationship between the WHO standard and the thresholds used for prostate
biopsy is hence necessary.
introduction
Numerous prostate-specific antigen (PSA) reagent sets are available for the
measurement of total PSA (tPSA) concentrations. Several publications have shown
that this wide variety of assays leads to very different values for tPSA. These
findings cannot always be satisfactorily explained, but possible underlying reasons
include differences in assay design, such as differential epitope recognition, cross-
reactivity with PSA-homologous antigens, and the lack of equimolarity5,112-115. The
last issue, which causes tPSA assays to overreport tPSA concentrations in patients
with benign prostate hyperplasia compared with those with prostate cancer (PCa),
has largely been resolved through major modifications in many of the tPSA assays.
Several studies have reported a small improvement in diagnostic performance,
which has been attributed to changes in the equimolar response211,212. If the assay
method applied and the specific reference range for the assay are unknown to the
Flip_Jansen.indd 115 30-7-2013 8:43:53

Discovery anD valiDation of prostate cancer biomarkers116
clinician, tPSA values may be misinterpreted, possibly influencing the decision
to recommend that patients undergo a prostate biopsy for PCa detection113. There
may be clinical implications if serial tPSA measurements are used to calculate
tPSA velocity or doubling time for the purpose of indicating PCa aggressiveness
or treatment failure110,213-218. In addition, the lack of interchangeability of the various
assays may prevent objective judgment and unbiased comparison of the results of
previous studies. The First Stanford Conference was convened in 1992 to improve
the interchangeability of tPSA assays. The Second Stanford Conference resulted in
a reference standard consisting of 90% purified PSA– antichymotrypsin and 10%
free PSA on a molar basis120. The WHO adoption of this standard resulted in the First
International Standard for tPSA under the National Institute of Biological Standards
and Control, also known as WHO 96/670116,117. Later, the WHO also introduced a
standard for free PSA116,117. Differences among tPSA assays seem to have decreased
since the introduction of the WHO 96/670 calibration, but they have not been
completely resolved and eliminated118-120. Therefore, the term “harmonization” has
become favoured instead of “standardisation,” because not all assays perform
equally, even after standardisation219,220. To minimize the likelihood of clinical
errors, several countries now require their laboratories to report tPSA concentrations
in accordance with the WHO 96/670 preparation221. Although most clinicians are
familiar with the fact that different tPSA assays produce different results, they
may not be aware that restandardisation from a historical standard to the WHO
calibration causes a shift in mass units, which yields a potential for underestimating
tPSA values. If this shift is not fully appreciated, especially with respect to the
tPSA threshold value for biopsy, a resulting decrease in PCa detection may produce
life-altering consequences for individual patients. Thus, different cut-off values are
required for the historical standard and the WHO calibration to achieve the same
clinical performance. With the introduction of the WHO 96/670 calibration for tPSA,
however, the question has arisen as to how this calibration would influence the
clinical outcomes for the current tPSA thresholds. It is clear that the thresholds and
methods used to measure tPSA are coupled; therefore, maintaining the established
clinical validity requires that significant changes in the assay be evaluated for
changes in reference values and cut-off thresholds. We describe our study focusing
on the effects of implementing the WHO standard on the Beckman Coulter tPSA
assay. This assay, the first tPSA assay to be approved by the US Food and Drug
Administration, established the conventional 4.0- ng/ml cut-off value for prostate
biopsy on the basis of a large multicenter prospective study by applying the gold
standard Hybritech tPSA assay222. Although age-specific reference intervals are now
available for tPSA, the 4.0- ng/ml tPSA threshold for prostate biopsy is well known,
not only by healthcare professionals but also by the general public. We also applied a
Flip_Jansen.indd 116 30-7-2013 8:43:53
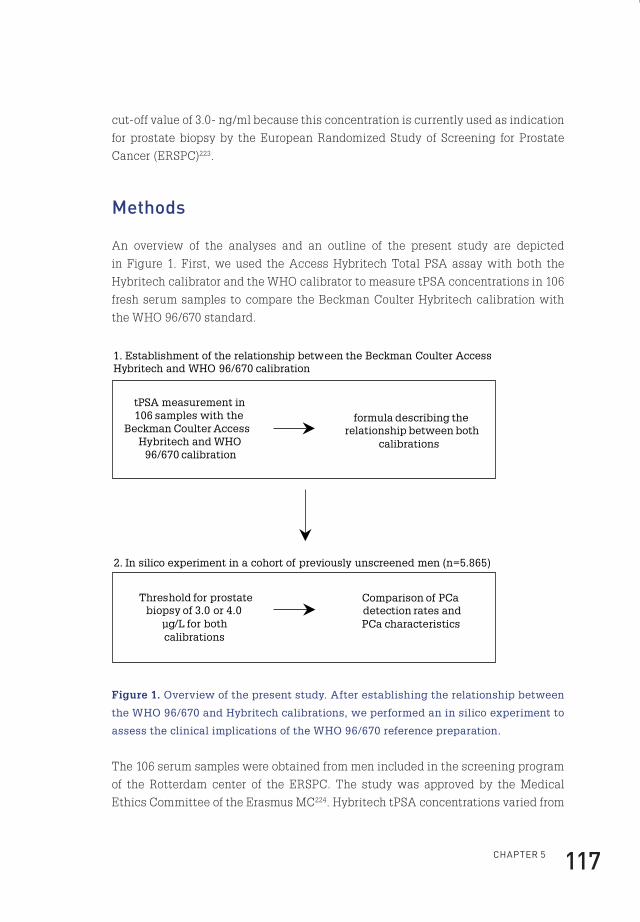
ChApteR 5 117
cut-off value of 3.0- ng/ml because this concentration is currently used as indication
for prostate biopsy by the European Randomized Study of Screening for Prostate
Cancer (ERSPC)223.
methods
An overview of the analyses and an outline of the present study are depicted
in Figure 1. First, we used the Access Hybritech Total PSA assay with both the
Hybritech calibrator and the WHO calibrator to measure tPSA concentrations in 106
fresh serum samples to compare the Beckman Coulter Hybritech calibration with
the WHO 96/670 standard.
tPSA measurement in 106 samples with the
Beckman Coulter Access Hybritech and WHO
96/670 calibration
formula describing the relationship between both
calibrations
2. In silico experiment in a cohort of previously unscreened men (n=5.865)
Threshold for prostate biopsy of 3.0 or 4.0
µg/L for both calibrations
1. Establishment of the relationship between the Beckman Coulter Access Hybritech and WHO 96/670 calibration
Comparison of PCa detection rates and PCa characteristics
Figure 1. Overview of the present study. After establishing the relationship between
the WHO 96/670 and Hybritech calibrations, we performed an in silico experiment to
assess the clinical implications of the WHO 96/670 reference preparation.
The 106 serum samples were obtained from men included in the screening program
of the Rotterdam center of the ERSPC. The study was approved by the Medical
Ethics Committee of the Erasmus MC224. Hybritech tPSA concentrations varied from
Flip_Jansen.indd 117 30-7-2013 8:43:53
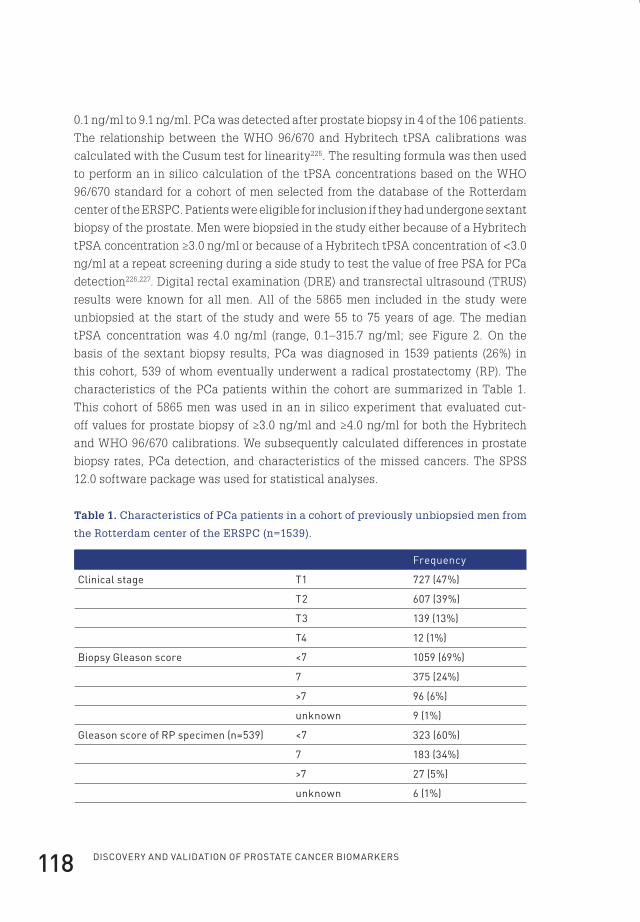
Discovery anD valiDation of prostate cancer biomarkers118
0.1 ng/ ml to 9.1 ng/ml. PCa was detected after prostate biopsy in 4 of the 106 patients.
The relationship between the WHO 96/670 and Hybritech tPSA calibrations was
calculated with the Cusum test for linearity225. The resulting formula was then used
to perform an in silico calculation of the tPSA concentrations based on the WHO
96/670 standard for a cohort of men selected from the database of the Rotterdam
center of the ERSPC. Patients were eligible for inclusion if they had undergone sextant
biopsy of the prostate. Men were biopsied in the study either because of a Hybritech
tPSA concentration ≥3.0 ng/ml or because of a Hybritech tPSA concentration of <3.0
ng/ml at a repeat screening during a side study to test the value of free PSA for PCa
detection226,227. Digital rectal examination (DRE) and transrectal ultrasound (TRUS)
results were known for all men. All of the 5865 men included in the study were
unbiopsied at the start of the study and were 55 to 75 years of age. The median
tPSA concentration was 4.0 ng/ml (range, 0.1–315.7 ng/ml; see Figure 2. On the
basis of the sextant biopsy results, PCa was diagnosed in 1539 patients (26%) in
this cohort, 539 of whom eventually underwent a radical prostatectomy (RP). The
characteristics of the PCa patients within the cohort are summarized in Table 1.
This cohort of 5865 men was used in an in silico experiment that evaluated cut-
off values for prostate biopsy of ≥3.0 ng/ml and ≥4.0 ng/ml for both the Hybritech
and WHO 96/670 calibrations. We subsequently calculated differences in prostate
biopsy rates, PCa detection, and characteristics of the missed cancers. The SPSS
12.0 software package was used for statistical analyses.
Table 1. Characteristics of PCa patients in a cohort of previously unbiopsied men from
the Rotterdam center of the ERSPC (n=1539).
frequency
Clinical stage t1 727 (47%)
t2 607 (39%)
t3 139 (13%)
t4 12 (1%)
biopsy Gleason score <7 1059 (69%)
7 375 (24%)
>7 96 (6%)
unknown 9 (1%)
Gleason score of Rp specimen (n=539) <7 323 (60%)
7 183 (34%)
>7 27 (5%)
unknown 6 (1%)
Flip_Jansen.indd 118 30-7-2013 8:43:53
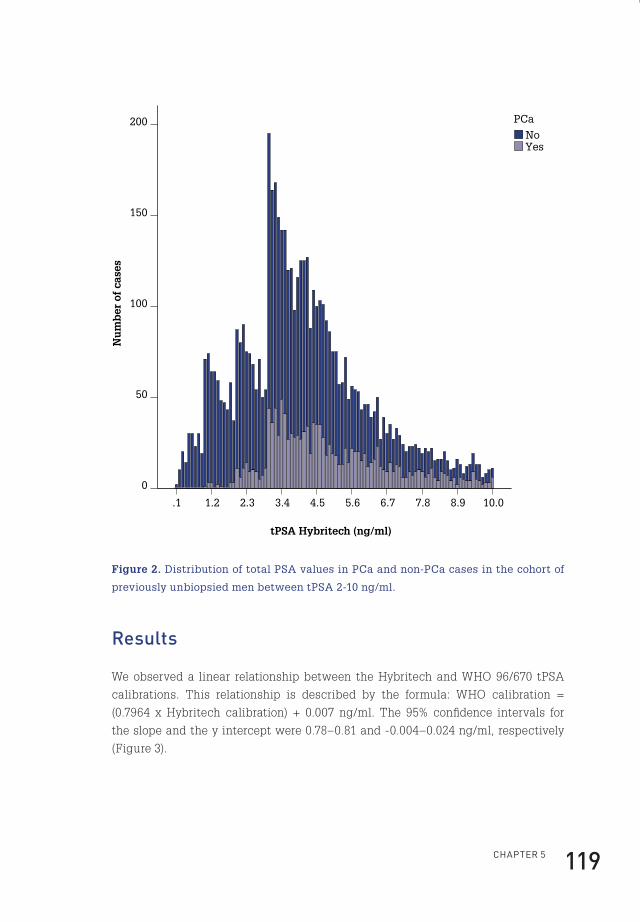
ChApteR 5 119
Nu
mb
er o
f ca
ses
200
150
100
50
0
tPSA Hybritech (ng/ml)
10.08.97.86.75.64.53.42.31.2.1
YesNo
PCa
Figure 2. Distribution of total PSA values in PCa and non-PCa cases in the cohort of
previously unbiopsied men between tPSA 2-10 ng/ml.
results
We observed a linear relationship between the Hybritech and WHO 96/670 tPSA
calibrations. This relationship is described by the formula: WHO calibration =
(0.7964 x Hybritech calibration) + 0.007 ng/ml. The 95% confidence intervals for
the slope and the y intercept were 0.78–0.81 and -0.004–0.024 ng/ml, respectively
(Figure 3).
Flip_Jansen.indd 119 30-7-2013 8:43:54
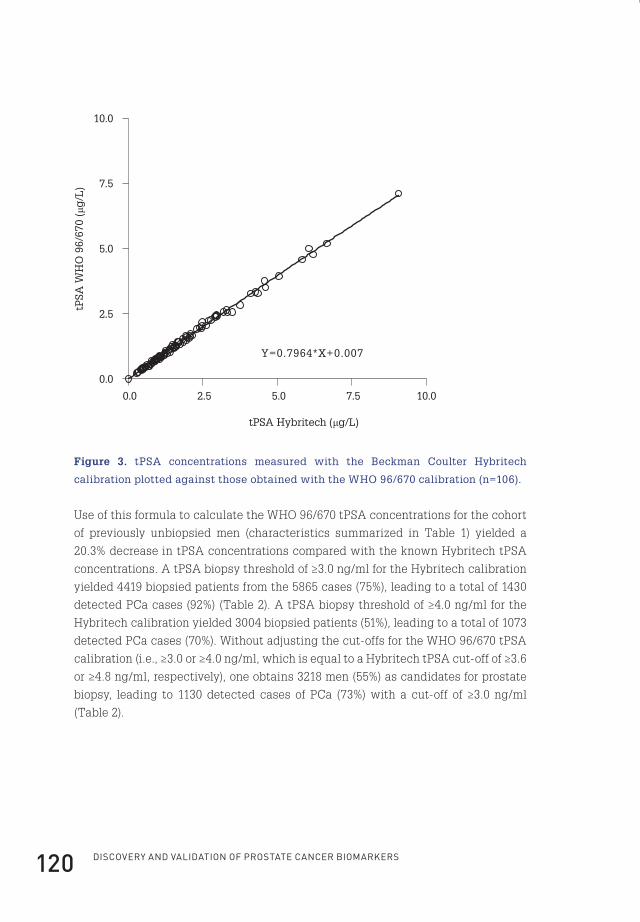
Discovery anD valiDation of prostate cancer biomarkers120
0.0 2.5 5.0 7.5 10.0
0.0
2.5
5.0
7.5
10.0
Y=0.7964*X+0.007
tPSA Hybritech (μg/L)
tPSA
WH
O 9
6/67
0 (μ
g/L
)
Figure 3. tPSA concentrations measured with the Beckman Coulter Hybritech
calibration plotted against those obtained with the WHO 96/670 calibration (n=106).
Use of this formula to calculate the WHO 96/670 tPSA concentrations for the cohort
of previously unbiopsied men (characteristics summarized in Table 1) yielded a
20.3% decrease in tPSA concentrations compared with the known Hybritech tPSA
concentrations. A tPSA biopsy threshold of ≥3.0 ng/ml for the Hybritech calibration
yielded 4419 biopsied patients from the 5865 cases (75%), leading to a total of 1430
detected PCa cases (92%) (Table 2). A tPSA biopsy threshold of ≥4.0 ng/ml for the
Hybritech calibration yielded 3004 biopsied patients (51%), leading to a total of 1073
detected PCa cases (70%). Without adjusting the cut-offs for the WHO 96/670 tPSA
calibration (i.e., ≥3.0 or ≥4.0 ng/ml, which is equal to a Hybritech tPSA cut-off of ≥3.6
or ≥4.8 ng/ml, respectively), one obtains 3218 men (55%) as candidates for prostate
biopsy, leading to 1130 detected cases of PCa (73%) with a cut-off of ≥3.0 ng/ml
(Table 2).
Flip_Jansen.indd 120 30-7-2013 8:43:54
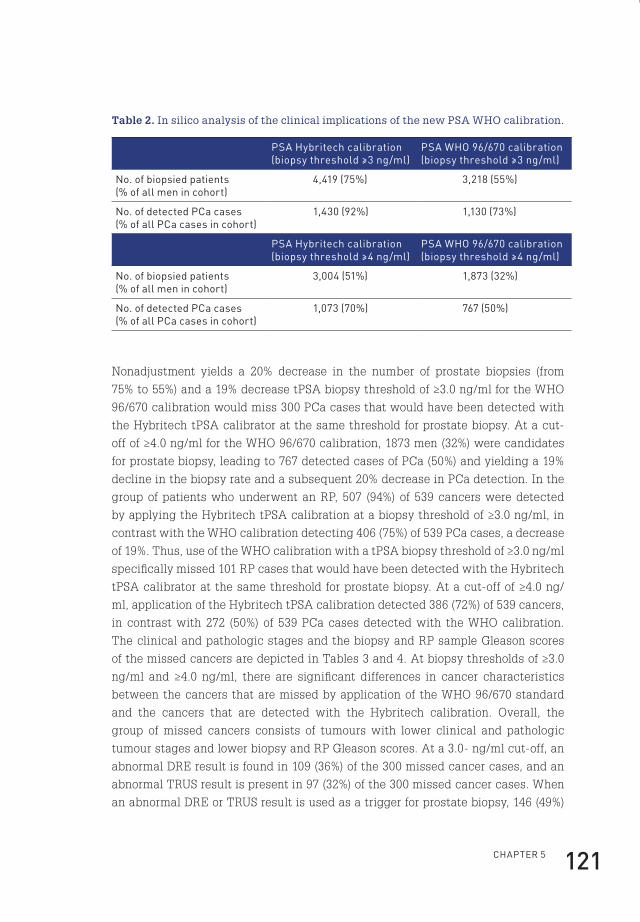
ChApteR 5 121
Table 2. In silico analysis of the clinical implications of the new PSA WHO calibration.
psA hybritech calibration(biopsy threshold ≥3 ng/ml)
psA WhO 96/670 calibration(biopsy threshold ≥3 ng/ml)
no. of biopsied patients(% of all men in cohort)
4,419 (75%) 3,218 (55%)
no. of detected pCa cases(% of all pCa cases in cohort)
1,430 (92%) 1,130 (73%)
psA hybritech calibration(biopsy threshold ≥4 ng/ml)
psA WhO 96/670 calibration(biopsy threshold ≥4 ng/ml)
no. of biopsied patients(% of all men in cohort)
3,004 (51%) 1,873 (32%)
no. of detected pCa cases(% of all pCa cases in cohort)
1,073 (70%) 767 (50%)
Nonadjustment yields a 20% decrease in the number of prostate biopsies (from
75% to 55%) and a 19% decrease tPSA biopsy threshold of ≥3.0 ng/ml for the WHO
96/670 calibration would miss 300 PCa cases that would have been detected with
the Hybritech tPSA calibrator at the same threshold for prostate biopsy. At a cut-
off of ≥4.0 ng/ml for the WHO 96/670 calibration, 1873 men (32%) were candidates
for prostate biopsy, leading to 767 detected cases of PCa (50%) and yielding a 19%
decline in the biopsy rate and a subsequent 20% decrease in PCa detection. In the
group of patients who underwent an RP, 507 (94%) of 539 cancers were detected
by applying the Hybritech tPSA calibration at a biopsy threshold of ≥3.0 ng/ml, in
contrast with the WHO calibration detecting 406 (75%) of 539 PCa cases, a decrease
of 19%. Thus, use of the WHO calibration with a tPSA biopsy threshold of ≥3.0 ng/ml
specifically missed 101 RP cases that would have been detected with the Hybritech
tPSA calibrator at the same threshold for prostate biopsy. At a cut-off of ≥4.0 ng/
ml, application of the Hybritech tPSA calibration detected 386 (72%) of 539 cancers,
in contrast with 272 (50%) of 539 PCa cases detected with the WHO calibration.
The clinical and pathologic stages and the biopsy and RP sample Gleason scores
of the missed cancers are depicted in Tables 3 and 4. At biopsy thresholds of ≥3.0
ng/ml and ≥4.0 ng/ml, there are significant differences in cancer characteristics
between the cancers that are missed by application of the WHO 96/670 standard
and the cancers that are detected with the Hybritech calibration. Overall, the
group of missed cancers consists of tumours with lower clinical and pathologic
tumour stages and lower biopsy and RP Gleason scores. At a 3.0- ng/ml cut-off, an
abnormal DRE result is found in 109 (36%) of the 300 missed cancer cases, and an
abnormal TRUS result is present in 97 (32%) of the 300 missed cancer cases. When
an abnormal DRE or TRUS result is used as a trigger for prostate biopsy, 146 (49%)
Flip_Jansen.indd 121 30-7-2013 8:43:54
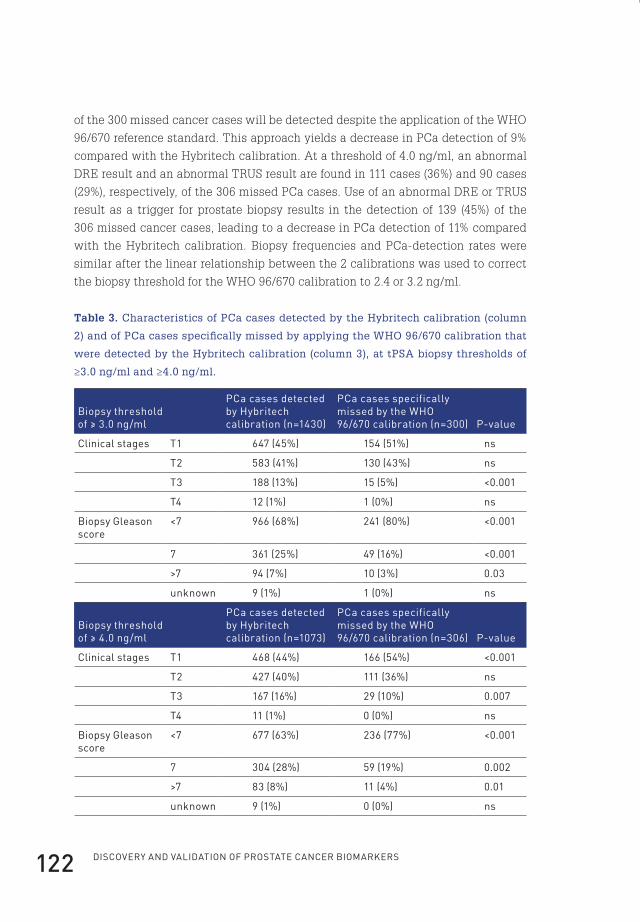
Discovery anD valiDation of prostate cancer biomarkers122
of the 300 missed cancer cases will be detected despite the application of the WHO
96/670 reference standard. This approach yields a decrease in PCa detection of 9%
compared with the Hybritech calibration. At a threshold of 4.0 ng/ml, an abnormal
DRE result and an abnormal TRUS result are found in 111 cases (36%) and 90 cases
(29%), respectively, of the 306 missed PCa cases. Use of an abnormal DRE or TRUS
result as a trigger for prostate biopsy results in the detection of 139 (45%) of the
306 missed cancer cases, leading to a decrease in PCa detection of 11% compared
with the Hybritech calibration. Biopsy frequencies and PCa-detection rates were
similar after the linear relationship between the 2 calibrations was used to correct
the biopsy threshold for the WHO 96/670 calibration to 2.4 or 3.2 ng/ml.
Table 3. Characteristics of PCa cases detected by the Hybritech calibration (column
2) and of PCa cases specifically missed by applying the WHO 96/670 calibration that
were detected by the Hybritech calibration (column 3), at tPSA biopsy thresholds of
≥3.0 ng/ml and ≥4.0 ng/ml.
biopsy threshold of ≥ 3.0 ng/ml
pCa cases detected by hybritech calibration (n=1430)
pCa cases specifically missed by the WhO 96/670 calibration (n=300) p-value
Clinical stages t1 647 (45%) 154 (51%) ns
t2 583 (41%) 130 (43%) ns
t3 188 (13%) 15 (5%) <0.001
t4 12 (1%) 1 (0%) ns
biopsy Gleason score
<7 966 (68%) 241 (80%) <0.001
7 361 (25%) 49 (16%) <0.001
>7 94 (7%) 10 (3%) 0.03
unknown 9 (1%) 1 (0%) ns
biopsy threshold of ≥ 4.0 ng/ml
pCa cases detected by hybritech calibration (n=1073)
pCa cases specifically missed by the WhO 96/670 calibration (n=306) p-value
Clinical stages t1 468 (44%) 166 (54%) <0.001
t2 427 (40%) 111 (36%) ns
t3 167 (16%) 29 (10%) 0.007
t4 11 (1%) 0 (0%) ns
biopsy Gleason score
<7 677 (63%) 236 (77%) <0.001
7 304 (28%) 59 (19%) 0.002
>7 83 (8%) 11 (4%) 0.01
unknown 9 (1%) 0 (0%) ns
Flip_Jansen.indd 122 30-7-2013 8:43:54

ChApteR 5 123
Table 4. Characteristics of RP cases that were detected with the Hybritech calibration
(column 2) and of RP cases specifically missed by applying the WHO 96/670 calibration
that were detected with the Hybritech calibration (column 3), at biopsy thresholds of
≥3.0 ng/ml and ≥4.0 ng/ml.
biopsy threshold of ≥3.0 ng/ml
pCa cases detected by hybritech calibration n(=507)
Rp cases specifically missed by the WhO 96/670 calibration (n=101) p-value
pathological stages
t2 387 (76%) 88 (87%) 0.02
t3 98 (19%) 11 (11%) 0.04
t4 21 (4%) 2 ( 2%) ns
unknown 1 (0%) 0 (0%) ns
Gleason score of Rp specimen
<7 300 (59%) 65 (64%) ns
7 175 (35%) 33 (33%) ns
>7 26 (5%) 3 (3%) ns
unknown 6 (1%) 0 (0%) ns
biopsy threshold of ≥4.0 ng/ml
pCa cases detected by hybritech calibration (n=386)
Rp cases specifically missed by the WhO 96/670 calibration (n=114) p-value
pathological stages
t2 283 (73%) 97 (85%) 0.01
t3 83 (22%) 13 (11%) 0.02
t4 19 (5%) 4 (4%) ns
unknown 1 (0%) 0 (0%) ns
Gleason score of Rp specimen
<7 223 (58%) 77 (68%) ns
7 134 (35%) 30 (26%) ns
>7 23 (6%) 6 (5%) ns
unknown 6 (2%) 1 (1%) ns
Flip_Jansen.indd 123 30-7-2013 8:43:54
Discovery anD valiDation of prostate cancer biomarkers124
Discussion
Our results show that application of the WHO 96/670 calibration for tPSA yields
a 20.3% decrease in tPSA values compared with the historical Beckman Coulter
Hybritech calibration. If the threshold for prostate biopsy is not adjusted accordingly,
there will be a significant decline in prostate biopsy rates (20% or 19%) and a
subsequent decrease in detected PCa cases (19% or 20%) for the Beckman Coulter
tPSA assay at commonly used cut-offs for biopsy (3.0 and 4.0 ng/ml, respectively).
This decrease in detected PCa cases is limited to 9% or 11% if an abnormal DRE or
TRUS result is used as a trigger for prostate biopsy (threshold of 3.0 or 4.0 ng/ml,
respectively). In addition, significant shifts in tumour stages and Gleason scores
were observed with the application of the WHO 96/670 tPSA calibration. Missed
PCa cases showed fewer high-stage tumours and fewer tumours with high Gleason
scores than for PCa cases that were detected with the Hybritech calibration at a
biopsy threshold of ≥3.0 ng/ml or ≥4.0 ng/ml. Biopsy and PCa-detection rates were
similar after the linear relationship between the WHO and Hybritech calibrations
was used to correct the biopsy threshold for the WHO 96/670 calibration to 2.4 ng/ml
or 3.2 ng/ml, respectively. One possible limitation of our study is that the second part
is based on in silico calculations of WHO 96/670 tPSA concentrations, instead of on
direct measurements of serum concentrations. This in silico calculation was based
on the linear relationship established in a study of a smaller cohort (n=106) that used
both calibrations for actual serum measurements; however, the 20.3% negative shift
in tPSA values that is introduced by application of the WHO calibration is virtually
identical to the findings of earlier studies by Kort et al. and Roddam et al., who found a
22% and 19% difference, respectively, in tPSA concentrations (mean, 20.5%) between
the WHO 96/670 and Hybritech calibrations119,221. Whereas we used an in silico
experiment to evaluate the clinical effects of applying the WHO standard for tPSA,
the actual relationship between the WHO calibration and the original Hybritech
calibration was established with clinical serum samples. Because tPSA assays are
known to be highly sensitive to the matrix of the sample, the use of clinical samples
avoids biases that arise from the use of artificial samples219. A second limitation is
that a cohort of screen detected PCas in asymptomatic men was used instead of
a cohort of clinically detected PCa cases to assess the clinical impact of the new
WHO calibration. Implications for a cohort of clinically detected PCas will be similar,
more or less, with probably fewer missed PCa cases because of initially higher tPSA
concentrations. We did not investigate the relationships between other tPSA assays
and the new WHO standard in this study. This choice was partly because tPSA
measurements made within the screening program of the ERSPC have always been
based on the Hybritech system. The strategy has been to use the same method
Flip_Jansen.indd 124 30-7-2013 8:43:54
ChApteR 5 125
during the entire study to minimize errors in medical decision making. Such errors
may occur if different assays are used during patient monitoring. Kort et al. recently
concluded that the results of other assays also deviate from expected tPSA values
if the WHO 96/670 reference preparation is applied (regression slopes between 0.99
and 1.08), showing that further efforts are needed to improve the interchangeability
of tPSA assays118,119,221. In addition, we emphasize that although use of a biopsy cut-
off of 3.0 or 4.0 ng/ml is common practice, tPSA is a continuous, not a dichotomous,
biomarker; therefore, the risk of PCa increases as the PSA concentration increases228.
As far as we know, this study is the first to evaluate the clinical effects of the
WHO 96/670 calibration for tPSA in a large screening cohort. Therefore, we have
not been able to compare the number of missed cancers and the shifts in PCa
characteristics with those of previous studies. Significant changes in PCa detection
and PCa characteristics have also been observed in studies that have assessed
the interchangeability of various tPSA assays, although a study by Yurdakul et al. concluded that different tPSA assays detected PCa cases with identical histological
features114,218,229,230. This study and others, however, evaluated the effects of different
tPSA assays, which have different performance characteristics. This approach
contrasts with that of our study, in which the only difference was the reference
standard. For the present study, the difference in cancer characteristics between
the cancers missed by the WHO 96/670 calibration and the cancers detected by
the Hybritech calibration can be explained by the distribution of tumour stages
and Gleason scores in the entire population of the screening cohort. The group of
missed cancers has Hybritech tPSA values of 3.0–3.6 ng/ml or 4.0–4.8 ng/ml and
contains fewer high-stage and high-grade tumours than the cohort of all PCa cases
with Hybritech tPSA concentrations ≥3.0 ng/ml or ≥4.0 ng/ml, respectively. The
finding of a decrease in cancer detection caused by application of the WHO 96/670
calibration may also have positive implications in light of the current discussions
on limiting PCa overdetection and subsequent overtreatment231-234. Because the
group of missed cancers contains significantly fewer tumours with a high stage or
a high Gleason score and more tumours with favourable characteristics (Tables 3
and 4), missing these cancers may not have clinical consequences and so may limit
the overdetection and overtreatment of PCa. Furthermore, we have shown that the
decrease in detected PCa cases caused by application of the WHO 96/670 standard is
less dramatic when abnormal DRE or TRUS results are applied as triggers for prostate
biopsy. Given the limited predictive value of an abnormal DRE or TRUS result in a
screening setting, however, especially in the low tPSA range of approximately 3.0
ng/ml or 4.0 ng/ml, the actual decrease in PCa detection most likely will be closer to
19% or 20%, respectively, than to 9% or 11%235-239. The recalibration is also expected
to affect PCa detection through effects on other PSA threshold values for biopsy.
Flip_Jansen.indd 125 30-7-2013 8:43:55
DisCOveRy AnD vAliDAtiOn Of pROstAte CAnCeR biOMARkeRs126
Adaptation to the WHO 96/670 reference standard will also affect tPSA-derived
variables, such as tPSA velocity, tPSA doubling time, and age-adjusted tPSA values,
with potential consequences for the individual patient. In conclusion, the present
study has shown that a decision to adapt tPSA testing to the WHO 96/670 reference
standard requires both careful assessment of the relationship between the historical
standard and the WHO standard and subsequent establishment of a new threshold
for prostate biopsy. In this study, we found that the threshold for prostate biopsy
shifted from 3.0 ng/ml or 4.0 ng/ml with the historical Hybritech calibration to
2.4 ng/ml or 3.2 ng/ml, respectively, after application of the WHO 96/670 calibration.
If not adjusted, this leads to a 19% or 20% decrease in PCa detection. Hence, if
clinicians are unaware of the replacement of their historical tPSA standard with the
WHO 96/670 reference preparation and do not adapt the threshold concentration
for prostate biopsy, the number of prostate biopsies and subsequent PCa-detection
rates will shift considerably in their clinic.
Grant/funding support: an educational grant for this study was provided by
Beckman Coulter International.
Acknowledgements: the authors are indebted to dr. Axel Semjonow for a critical
review of this manuscript.
Flip_Jansen.indd 126 30-7-2013 8:43:55

cHapter 6
cHap
ter
6
Flip_Jansen.indd 127 30-7-2013 8:43:55

cHapter 6
General Discussion
Flip_Jansen.indd 128 30-7-2013 8:43:55
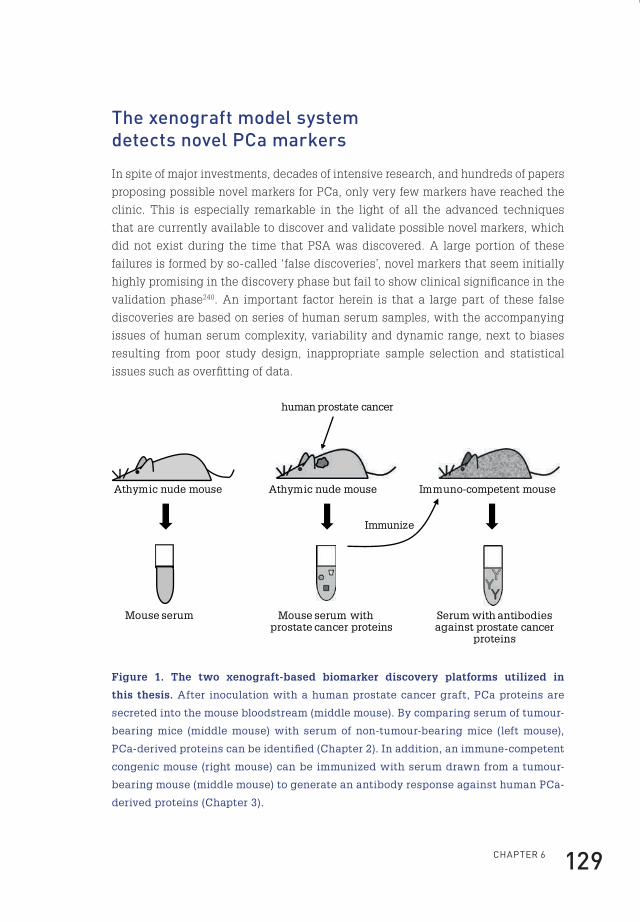
ChApteR 6 129
the xenograft model system detects novel pca markers
In spite of major investments, decades of intensive research, and hundreds of papers
proposing possible novel markers for PCa, only very few markers have reached the
clinic. This is especially remarkable in the light of all the advanced techniques
that are currently available to discover and validate possible novel markers, which
did not exist during the time that PSA was discovered. A large portion of these
failures is formed by so-called ‘false discoveries’, novel markers that seem initially
highly promising in the discovery phase but fail to show clinical significance in the
validation phase240. An important factor herein is that a large part of these false
discoveries are based on series of human serum samples, with the accompanying
issues of human serum complexity, variability and dynamic range, next to biases
resulting from poor study design, inappropriate sample selection and statistical
issues such as overfitting of data.
human prostate cancer
Athymic nude mouse Immuno-competent mouse
Mouse serum with prostate cancer proteins
Immunize
Serum with antibodies against prostate cancer
proteins
Athymic nude mouse
Mouse serum
Figure 1. The two xenograft-based biomarker discovery platforms utilized in
this thesis. After inoculation with a human prostate cancer graft, PCa proteins are
secreted into the mouse bloodstream (middle mouse). By comparing serum of tumour-
bearing mice (middle mouse) with serum of non-tumour-bearing mice (left mouse),
PCa-derived proteins can be identified (Chapter 2). In addition, an immune-competent
congenic mouse (right mouse) can be immunized with serum drawn from a tumour-
bearing mouse (middle mouse) to generate an antibody response against human PCa-
derived proteins (Chapter 3).
Flip_Jansen.indd 129 30-7-2013 8:43:55
Discovery anD valiDation of prostate cancer biomarkers130
To bypass these issues we have chosen the xenograft model system as a platform
for the discovery of new biomarkers for PCa123. In this system, human prostate
tumour fragments are transplanted onto athymic nude mice. We hypothesized that,
once securely grafted, these xenografts will shed tumour proteins into the mouse
circulation. Thus, a normal nude mouse has only mouse proteins in its circulation,
while the serum of a nude mouse bearing a human xenograft contains also human
proteins deriving from the prostate tumour (Figure 1). This means that any protein
identified as human specific is directly derived from the xenograft itself.
This approach evades the issues associated with comparing large series of human
serum samples as described above. There is no detrimental sample variation: a
single recipient mouse carrying a PCa xenograft should in principle suffice for the
identification of PCa-derived proteins from mouse serum. Given the subsequent
limited number of samples needed, a comprehensive and detailed scan of all
high and low abundant PCa-derived proteins from a single serum sample can be
performed by employing the latest MS technologies. The challenge with respect
to the enormous dynamic range of serum protein expression can thus partially be
overcome. As has already been reported, this model system is indeed capable of
identifying human proteins that are shed into the circulation by human PCa cells124.
In Chapter 2, 44 tumour-derived proteins were identified utilizing this xenograft
model. Amongst these were almost all subunits of the proteasome, a proteolytic
protein complex. We hypothesize that their presence reflects the dysregulation of
protein synthesis and degradation in cancer cells in contrast to normal cells in which
the proteasome complex plays a crucial role in controlling essential cellular functions
such as transcription, stress response, cell cycle regulation, cellular differentiation,
and DNA repair143. Several subunits of the proteasome have indeed been linked to
PCa, as well as to other malignancies241-245. However, one should keep in mind that the
transplanted xenograft is relatively large in size compared to the total blood volume
of the nude mouse. Translated to the human situation, this could mean that the
number of circulating proteasomes deriving from PCa cells is undetectable against
the high background levels of naturally circulating proteasomes. This is illustrated
in Chapter 3, which showed no significant differences in concentrations of the
PSMA1 proteasome subunit in men with or without PCa. In contrast, elevated serum
levels of the 20S proteasome have been shown in patients with other solid tumours,
such as breast cancer and renal cell carcinoma241,242. Nevertheless, the possibility
still exists that specific posttranslational processes such as glycosylation created
a more PCa specific proteasome isoform. Recently, the presence of a proteasome β
subunit exclusively present in thymic cortical epithelial cells was discovered and
shown to be useful in differentiating thymic carcinomas245.
Flip_Jansen.indd 130 30-7-2013 8:43:55

ChApteR 6 131
Another question that has to be elucidated is which of the identified PCa-derived
proteins are specifically secreted by cancer cells and not by normal prostate
cells. Most likely, the majority of these proteins are also secreted under normal
circumstances, but in cancer cells the proportion of secreted proteins might differ,
resulting in higher serum levels of specific proteins. However, it might well be that
indeed some of the identified proteins are specifically secreted by PCa cells, and
are not secreted by normal prostate tissue. Also, the disruption of the normal tissue
architecture in PCa may play an important role, such as is the case for the elevated
serum levels of PSA in PCa patients. A first start to elucidate some of these questions
is a control experiment, in which human proteins are identified in the serum of mice
inoculated with normal prostate tissue.
prostate cancer-derived proteins in the xenograft model systems are part of exosomes
Another observation is that about half of the discovered tumour-derived proteins
in Chapter 2 are not formally known as secreted proteins but are annotated as
being cytoplasmatic. This remarkable observation put us on the path of exosomes.
Exosomes are small membrane vesicles, secreted by virtually every cell type,
including tumour cells126. They are formed in multivesicular bodies by inward
budding, thereby encapsulating cytoplasmic components (Figure 2)126,127. The exact
function of exosomes in tumour cells has still to be elucidated, but is expected
to relate to roles in cell-to-cell crosstalk, tumour-stromal interaction, protein
degradation and antigen presentation126,127.
A recently published study reported that exosomes which are secreted by tumour
cells can inhibit the binding of tumour-reactive antibodies to tumour cells. In this
way exosomes might help tumour cells to escape from immune surveillance246.
An in-depth analysis of the PCa-secreted exosomes was performed in Chapter 2.
After isolation of exosomes derived from PCa cells, these were analysed for their
protein content by MS. This showed that indeed a large portion of the proteins
inside exosomes could be annotated as cytoplasmic, next to the presence of cell
membrane-associated proteins. This finding was confirmed in a recent review by
György et al. describing the subcellular localisation of proteins identified in exosomes
from six different studies247. It has been hypothesized that inside exosomes these
cytoplasmic proteins are protected from degradation in human plasma, hereby
enabling these cytoplasmic proteins to act distant from the site of their production.
Another fascinating finding was the presence of almost all proteasome subunits
amongst the identified exosomal proteins. This observation was recently confirmed
Flip_Jansen.indd 131 30-7-2013 8:43:55

Discovery anD valiDation of prostate cancer biomarkers132
in recent report from Lai et al. investigating the protein content in exosomes derived
from mesenchymal stem cells, showing the presence of all seven α and β subunits
of the 20S proteasome inside exosomes248. The presence of proteasomes inside
exosomes might point towards the occurrence of specific proteolytic processes
inside exosomes, which is suggested by the finding of a distinct 30-kDa ENO1 band
specifically present in the exosome fraction as described in Chapter 2. Unfortunately,
our attempts to specifically identify this 30-kDa ENO1 band by MS/MS were not
successful.
Golgi apparatus
PSA
Rough endoplasmatic reticulum
PSA
Exosomes
Multi-vesicular body
Early endosome
Clathrin-coated pit
Consecutive secretory pathway Exosome secretion
Figure 2. In the consecutive secretory pathway proteins such as PSA (prostate-
specific antigen) are formed in the rough endoplasmatic reticulum, a membrane-bound
compartment in the cell. The proteins are then transferred to the many compartments
of the Golgi apparatus and finally end up in a vesicle that fuses with the cell plasma
membrane, releasing the proteins outside of the cell. In contrast to the consecutive
secretory pathway, exosomes are formed in multivesicular bodies by inward budding,
thereby encapsulating cytoplasmic proteins, such as cytoskeletal proteins, kinases,
metabolic enzymes, and also RNA.
In addition to analysing the exosomal protein content, we specifically identified
the TMPRSS2:ERG gene fusion transcript inside exosomes from PCa cell cultures.
Surprisingly, this is also the case in the human situation. In a small pilot study,
Nilsson et al. were able to detect the TMPRSS2:ERG fusion mRNA in exosomes
isolated in urine from men with PCa249. Although the exact function of mRNA inside
exosomes remains speculative, it has been shown that the exosomal RNA is not a
Flip_Jansen.indd 132 30-7-2013 8:43:55

ChApteR 6 133
random sample from the cellular RNA pool, as certain mRNA transcripts are enriched
up to several 100-fold in exosomes, suggesting a specific sorting mechanism250,251.
Additionally, it has been shown that the number of exosomes is elevated in the
circulation of cancer patients compared to normal controls252,253.
In conclusion, exosomes represent a fingerprint of the cancer cell, and as exosome
concentrations are elevated in the circulation of cancer patients, exosomes present
biomarker treasure chests. By specific enrichment for PCa-derived exosomes,
utilizing tissue-specific membrane proteins present on exosomes, also the challenge
of the dynamic range problem associated with the search for novel biomarkers
might be overcome. As it has been proven that exosomes are relatively stable under
multiple cycles of freezing and thawing, large scale purification of PCa-derived
exosomes from biobank samples would be feasible254. Up to date, several studies
have already been performed investigating the clinical usefulness of exosomes in
PCa detection and prognosis. However preliminary, these studies have shown that
it is indeed possible to identify, stage and monitor men with PCa based on their
exosome-associated biosignature255-258.
Regarding future exosome research, a stable high-throughput assay should be
developed to analyse exosomal protein content, allowing for a first large scale
validation of possible exosomal protein markers. Then, a robust and clinical
applicable assay should be developed, to isolate and analyse PCa-derived exosomes
from men without and men with different stages of PCa, in order to facilitate the
entry of a novel biomarker into routine clinical practice.
In addition, investigations regarding the possible functional role of exosomes might
elucidate important mechanisms, such as cancer metastasis. Recently, it was shown
that melanoma-derived exosomes harbour specific messenger proteins, enhancing
metastatic invasion by directing bone marrow-derived cells toward a prometastatic
phenotype, initiating a metastatic niche259. In turn, this might also have important
consequences from a therapeutical point of view, regarding the prevention and
prediction of metastases.
a unique xenograft-based immunization method detects novel prostate cancer biomarkers.
The approach taken in Chapter 2 is far more specific and has less variability than
analysing hundreds of human serum samples. However, its results are still limited by
the protein complexity of mouse serum itself and the resolution and mass accuracy
of current mass spectrometers. In Chapter 3, we utilized the highly sensitive and
specific mouse immune system to discover novel biomarkers for PCa. We developed
Flip_Jansen.indd 133 30-7-2013 8:43:55

Discovery anD valiDation of prostate cancer biomarkers134
a xenograft-based biomarker discovery platform, in which immuno-competent mice
are immunized with serum from PCa xenograft-bearing nude mice (Figure 1). In this
system, the donor and recipient mice are congenic, so only the human PCa-derived
proteins will specifically generate immunoglobulin biomarkers. Subsequently, a
protein microarray-based method was utilized to profile the antibody production
and identify PCa xenograft-derived proteins.
This approach resulted in the identification of 99 proteins to which an antibody
response was observed. Amongst these were proteasome subunit PSMA1,
ACY1, and two members of the TAM receptor family, TYRO3 and MERTK. After
validation of these proteins by ELISA in serum samples from xenografted mice,
a prevalidation was performed on series of human serum samples. Significantly
different concentrations of several of the identified proteins were shown, in men
with or without PCa and in men with PCa metastasis or PCa recurrence, proving that
this unique xenograft-based immunization method is indeed capable of detecting
possible novel PCa biomarkers.
However, as so many possible biomarkers are identified in the discovery phase
by utilizing the approach in Chapters 2 and 3, it is virtually impossible to assess
the value of all discovered proteins in a validation phase. To solve this dilemma, a
selection was made based on imprecise criteria, such as the number of identified
peptides of a specific protein, ProtoArray signal intensities, the presence of a protein
in a specific cellular compartment, or results of previously published data. In this
way, valuable candidates may be overlooked. Thus, high-throughput assays are
needed to validate all identified candidates in a limited amount of time and effort.
Despite these dilemmas and challenges, both xenograft-based biomarker discovery
platforms provide an important addition to existing means of biomarker discovery.
In the future, a high-throughput assay should be developed to analyse the presence
of all possible markers in a first validation series, so the most promising candidates
can be selected. Then, further large scale identification in multi-centre series is
needed to assess if any of the discovered proteins holds its promise as a novel
biomarker. In addition, by investigating the role in PCa tumorigenesis and metastasis
of the proteins identified by the xenograft-based biomarker discovery platforms,
biologically related proteins may be identified, which in turn could represent novel
biomarkers. Last of all, this might also have implications for PCa therapy. For
example, it has been shown that inhibition of MERTK and AXL promotes apoptosis
and inhibits tumour growth260-262.
Flip_Jansen.indd 134 30-7-2013 8:43:56

ChApteR 6 135
validation of isoforms of prostate-specific antigen as diagnostic markers
As mentioned previously, a disappointingly low number of novel biomarkers have
reached the clinic during the last decades. Often, a novel candidate is presented with
great promise, but later on subsequent validation studies show inconsistent or even
contradictionary results. There are multiple possible explanations which can clarify
the discrepancies encountered in validation studies, varying from methodological
differences, poor study design, the use of inappropriate statistical tests, insufficient
sample sizes and the use of unstandardised assays. On the other hand, if subsequent
validation studies do show a consistent but limited improvement in diagnostic or
prognostic value, chances of clinical incorporation are small, in sharp contrast with
small improvements in the therapeutic field, such as an increased survival of several
weeks to months240. A possible explanation for this phenomenon is that clinicians
tend to over-treat patients, rather than incorporating biomarkers with less than
perfect prediction into their clinical decision making.
During the last decades, several initiatives have been launched to improve the quality
of reporting on validation of novel biomarkers. Examples are the STARD initiative
(Standards for Reporting of Diagnostic Accuracy), presenting a checklist of 25 items
to ensure reporting of all relevant information, and the REMARK recommendation
(Reporting recommendations for tumour Marker prognostic studies), a guideline to
encourage transparent and complete reporting263,264.
In Chapter 4, a retrospective multi-centre validation study is described. In this
study, the PSA isoforms p2PSA and BPHA were analysed for their capacity in PCa
detection as well as prognostic power. It was shown that p2PSA and, moreover,
%p2PSA and phi could have additional value with respect to tPSA and %fPSA in
PCa detection within the tPSA range of 2– 10 ng/ml, by significantly increasing the
predictive value and specificity for PCa. In contrast, %p2PSA and phi seemed to
have limited additional value in identifying men with aggressive PCa. Several very
recent reports have confirmed that %p2PSA, and especially phi, are superior over
tPSA and fPSA regarding predictive value in PCa detection. Studies by Stephan,
Lazzeri, Catalona, Guazzoni and Le et al. showed a more than doubled specificity
and significantly greater predictive value of %p2PSA and moreover phi in initial
PCa screening, compared to tPSA and fPSA265-269. Amongst these were several
prospective and multi-centre studies. In addition, the majority of these reports
showed a correlation between higher levels of phi and the presence of PCa with a GS
≥7. A systematic review and meta-analysis by Filella et al., analysing twelve studies,
confirmed these results on the diagnostic performance as well as on the relationship
of phi and %p2PSA with PCa aggressiveness270.
Flip_Jansen.indd 135 30-7-2013 8:43:56

Discovery anD valiDation of prostate cancer biomarkers136
Interestingly, reports investigating the performance of phi compared to PCA3 and
TMPRSS2:ERG in initial PCa screening showed similar or superior results for phi
compared to the latter two271-273.
So, as randomized controlled trials are awaited, preferably performed according to
a biomarker reporting checklist or guideline, there are very strong indications that
%p2PSA and especially phi are significantly better predictors for the presence of PCa
than tPSA alone within a tPSA range of 2-10 ng/ml. As a result, the implementation of
phi in routine clinical practice might result in fewer unnecessary prostate biopsies,
reducing healthcare costs, as has been calculated in a recent report274. Recently,
phi was granted premarket approval by the FDA for men 50 years and older with
a tPSA value between 4 and 10 ng/ml and a digital rectal exam with no suspicion
of cancer (http://www.accessdata.fda.gov/cdrh_docs/pdf9/p090026a.pdf). This is a
first step into the implementation of phi in current clinical practice, however the
most appropriate cut-off levels for phi and %p2PSA should still be established.
total prostate-specific antigen standardisation issues
As mentioned previously, also assay standardisation issues are related to
discrepancies resulting from biomarker validation studies. Ideally, there should
be only one assay platform from one manufacturer which is used worldwide to
measure a certain biomarker. However, as there are huge financial interests in
screening for specific diseases, there are often multiple manufacturers developing
their own commercial assays. The resulting interassay variability can at least partly
be overcome by using a specific calibration standard, and ideally this standard
should be agreed upon before widespread clinical use of a specific assay, however
this is rarely implemented. For example, it has taken more than a decade after its
introduction before a calibration standard was adopted by the WHO for the tPSA
assay, indeed decreasing interassay variabilities. However, by introducing a novel
calibration standard long after widespread clinical use of a specific test, confusion
is created as reported values will shift for certain assay platforms.
In Chapter 5, it is shown that for the Beckman Coulter tPSA assay, the introduction of
the WHO reference standard resulted in a 20% decrease in tPSA concentrations with
a subsequent decrease in the number of prostate biopsies and detected cancers.
However, in the light of PCa overdetection and overtreatment it may be discussed if
this is actually a negative or positive consequence of standardisation, as the great
majority of the missed cancers were low-grade cancers. A more recent study from
Fileé et al. produced nearly identical results275. To conclude, as long as significant
Flip_Jansen.indd 136 30-7-2013 8:43:56

ChApteR 6 137
differences in tPSA values are reported by different assay platforms, physicians
should be aware which assay platform is applied in their local hospital as well as
which calibration method is used, before making possible far-reaching decisions at
a patient level.
Flip_Jansen.indd 137 30-7-2013 8:43:56

Flip_Jansen.indd 138 30-7-2013 8:43:56
epilOGUe 139
epiloGueAlthough results from prostate cancer screening studies are still under debate,
screening for prostate cancer will always be carried out, either in an opportunistic
or more organised way. This results from the reality that a substantial number
of men bear in mind the possibility of being the one patient with an aggressive
form of prostate cancer, which could be cured, but only if discovered in an early
phase. Instead, it is more likely that they belong to the larger group of men with
insignificant disease that will suffer from the consequences of overtreatment of
indolent prostate cancer. The longer it takes before novel markers are introduced
into clinical practice, the more men will suffer from the confusion that has resulted
from the present studies evaluating screening for prostate cancer. A first step in
improving the detection of prostate cancer could be the implementation of phi
into routine clinical practice, integrating phi with existing markers and prostate
cancer risk calculators. With relatively little effort and costs, this would lead to a
significantly better performance in prostate cancer detection. Furthermore, it is
clear that the biggest challenges lie now in the field of biomarker validation, as
this thesis shows that the presented xenograft-based biomarker platforms are able
to circumvent some of the major issues associated with contemporary biomarker
discovery. The first challenge now is to develop novel high throughput methods to
assess and validate the huge number of possible biomarkers in a large population of
patients and controls.
Flip_Jansen.indd 139 30-7-2013 8:43:56

Flip_Jansen.indd 140 30-7-2013 8:43:56
sUMMARy 141
summaryIn the Netherlands, 10,391 new cases of prostate cancer (PCa) were diagnosed in
2010. This makes PCa the most common malignancy in men (source: Dutch Cancer
Registry). To detect PCa in an early stage, prostate-specific antigen (PSA), which
can be detected in blood, is frequently utilized. However, as PSA is not PCa specific,
elevated levels can also be detected in men with benign prostate hyperplasia (BPH).
In addition, a low PSA value does not rule out the presence of PCa. Thus, PSA should
rather be regarded as a risk spectrum of PCa. A definitive diagnosis can only be made
after taking prostate biopsies, an invasive procedure with associated morbidity.
Also, the prognostic value of PSA is limited, as it is not unambiguously correlated to
PCa aggressiveness. Thus, as an indirect consequence of utilizing PSA to identify
men at risk of being diagnosed with PCa, there is a substantial overdiagnosis and
overtreatment of PCa. A novel biomarker for the detection and prognosis of PCa
could limit these significantly. Ideally, this biomarker should be able to differentiate
between men with or without PCa, differentiate between indolent and aggressive
disease, and be suitable for follow-up after treatment. Most likely, not one marker
will possess all these characteristics, but a panel of carefully selected markers
probably will be able to fulfil these criteria. Without doubt, PSA will be one of these,
as physicians are so familiar to making PSA-based clinical decisions.
There are several challenges that should be met and numerous strategies that can
be followed discovering novel markers. A frequently utilized approach is based upon
comparing serum samples of large groups of men with PCa to the normal population.
However, this approach is seriously hampered by the enormous variability of protein
content among men, the often limited sample availability, and the time-consuming
and laborious analyses that would arise from such an approach. In addition, due to the
vast dynamic range in protein concentrations in human serum and the dominance of
a small number of high abundant proteins, the presence of low abundant proteins,
such as possible novel biomarkers, might be masked.
To bypass these issues we based our approach on a xenograft mouse model for PCa.
In this system, human prostate tumour fragments are transplanted onto athymic
nude mice. We hypothesized that once securely grafted, these xenografts will shed
tumour proteins into the mouse circulation. Thus, a normal nude mouse has only
mouse proteins in its circulation, while the serum of a nude mouse bearing a human
xenograft contains also human proteins. Subsequently, these tumour-derived and
human specific proteins can be identified utilizing mass spectrometry (MS). As
Flip_Jansen.indd 141 30-7-2013 8:43:56
Discovery anD valiDation of prostate cancer biomarkers142
there is no detrimental sample variation, a single recipient mouse carrying a PCa
xenograft should in principle suffice for the identification of PCa-derived proteins
from mouse serum. In addition, by mimicking the human situation, the xenograft
model is able to specifically expose tumour-secreted proteins, as is the case for most
tumour markers applied in the clinic today.
In Chapter 2, the utilization of this xenograft mouse model led to the identification
of 44 PCa-derived proteins. As expected, part of these proteins have been annotated
as being actively secreted by cells. However, a large portion of the identified
proteins has not been described as being secreted by cells, but has been annotated
as being cytoplasmic. We hypothesised that the presence of these proteins in
the mouse circulation results from the secretion of exosomes. These are small
membrane vesicles, secreted by virtually every cell type, containing content from
the cytoplasmic compartment. A subsequent in-depth analysis of the proteins
present in exosomes secreted from PCa cell lines resulted in the identification
of almost exclusively cytoplasmic proteins, amongst which were several of the
proteins that had earlier been identified in the circulation of xenografted mice. In
addition, analyses of exosomal RNA resulted in the identification of the PCa specific
TMPRSS2:ERG gene fusion. So, we conclude that PCa-derived exosomes are ideal
candidates for the discovery of novel biomarkers for PCa.
In Chapter 3, this xenograft model was further exploited for the discovery of novel
biomarkers. By injecting immune-competent mice with serum drawn from PCa
xenograft-bearing nude mice, we hypothesized that an immune-response would
be generated against human PCa-derived proteins. A protein microarray based
approach was subsequently utilized to profile the antibody production and thus
indirectly identify PCa xenograft-derived antigens. Amongst 99 other proteins,
this resulted in the identification of TYRO3, AXL, MERTK, ACY1 and PSMA1, of
which the first three were pre-validated in series of human serum samples. This pre-
validation showed significantly different concentrations of the identified proteins
in men with or without PCa, and in men with PCa metastasis or PCa recurrence,
hereby proving that this unique xenograft-based immunization model is indeed
capable of detecting novel PCa biomarkers.
In Chapter 4, we evaluated the additional value of the PSA-isoforms p2PSA and
BPHA, both part of the free PSA (fPSA) fraction, with respect to PCa detection.
In addition, the value of phi (prostate health index, calculated as (p2PSA/fPSA) x
√(tPSA)) was investigated. This multicenter study included 756 serum samples of
men with or without PCa and a total PSA (tPSA) concentration between 2 and 10 ng/
ml, deriving from the European Randomised Study of Screening for Prostate Cancer
(ERSPC) and the Urology Department of Innsbruck Medical University. This study
showed a significant increase in PCa predictive value and specificity of phi (31 versus
Flip_Jansen.indd 142 30-7-2013 8:43:56

sUMMARy 143
10%) compared to tPSA. Also, %p2PSA (p2PSA/fPSA) performed significantly better
than tPSA. A multivariate model predicting the presence of PCa was significantly
improved after the addition of p2PSA. Thus, we conclude that the introduction of
%p2PSA and moreover phi into routine clinical practice will significantly improve
PCa detection, thereby limiting the number of negative prostate biopsies.
Currently, several dozens of different assays are available to measure tPSA
concentrations in human serum. As this has resulted in significant inter-assay
differences, the World Health Organization (WHO) introduced the WHO 96/670
calibration standard. However, it is anticipated that replacement of the original
calibration standard with the WHO 96/670 calibration might lead to significant
changes in tPSA results, with serious consequences for cut-off points for taking
prostate biopsies, and subsequent changes in PCa detection rates.
In Chapter 5, the consequences of the introduction of the WHO 96/670 calibration
for the Beckman Coulter tPSA assay were evaluated. It is shown that as a result
of introducing the WHO 96/670 calibration standard, reported tPSA concentrations
decreased by approximately 20% for the Beckman Coulter tPSA assay. Without
correction of the applied tPSA thresholds for prostate biopsies, this results in a
significant decrease in PCa detection rates. Hence, physicians should be aware
which calibration method is utilized in their local hospital, and carefully assess
which thresholds are used for taking prostate biopsies.
Flip_Jansen.indd 143 30-7-2013 8:43:56

Flip_Jansen.indd 144 30-7-2013 8:43:56
sAMenvAttinG 145
samenvattinGIn 2010 werden in Nederland 10.391 nieuwe gevallen van prostaatkanker vastgesteld.
Hiermee is prostaatkanker de meest voorkomende vorm van kanker bij mannen
(bron: Nederlandse Kankerregistratie). Om prostaatkanker in een vroeg stadium op
te sporen wordt veelvuldig gebruik gemaakt van het prostaat specifiek antigeen
(PSA), dat in het bloed te bepalen is. Nadeel van de PSA test is echter dat deze niet
specifiek is voor prostaatkanker en ook een verhoogde uitslag kan geven indien er
alleen sprake is van een goedaardige prostaatvergroting. Tevens kan bij een lage
PSA waarde de aanwezigheid van prostaatkanker niet worden uitgesloten. De PSA
waarde geeft dus alleen een risico inschatting van de kans op de aanwezigheid
van prostaatkanker weer. Daarnaast is de prognostische waarde van PSA beperkt,
aangezien de hoogte hiervan niet eenduidig is gerelateerd aan de agressiviteit
en bijbehorende prognose van de gevonden prostaattumor. De definitieve aan-
of afwezigheid van prostaatkanker valt alleen vast te stellen middels het nemen
van prostaatbiopten, een invasieve procedure met de bijbehorende morbiditeit.
Als gevolg hiervan is er sprake van een enorme overdiagnose en overbehandeling
van prostaatkanker. Een nieuwe biomerker voor de detectie en prognose van
prostaatkanker zou dit probleem significant kunnen beperken. De ideale merker
zou in een vroeg stadium in staat moeten zijn te differentiëren tussen de aan- of
afwezigheid van prostaatkanker, zou wat over de agressiviteit van de tumor moeten
zeggen en geschikt moeten zijn voor regelmatige follow-up. Waarschijnlijk is er niet
één merker die aan al deze criteria voldoet, maar met een panel van verschillende
merkers is dit mogelijk wel te bereiken. Tevens valt het niet te verwachten dat door
een nieuwe merker het PSA uit de kliniek verdwijnt, gezien de vertrouwdheid en
ervaring van clinici met het nemen van medische beslissingen op basis van PSA
uitslagen.
Bij het zoeken naar nieuwe merkers zijn er een aantal uitdagingen en strategieën. Een
mogelijke aanpak is het vergelijken van grote groepen patiënten met prostaatkanker
met de normale populatie. Lastig hierbij is de enorme variabiliteit binnen patiënten
en controles, de vaak beperkte aantallen samples die beschikbaar zijn en de
langdurige analyses die nodig zijn om nieuwe merkers te detecteren. Verder zijn
er zoveel verschillende eiwitten in serum aanwezig dat die de aanwezigheid van
eiwitten die in zeer lage concentraties voorkomen, zoals waarschijnlijk nieuwe
merkers, verhullen. Om deze problemen te omzeilen kan men ook gebruik maken
van een muismodel. Hierbij wordt gebruik gemaakt van muizen met een niet-
Flip_Jansen.indd 145 30-7-2013 8:43:56
Discovery anD valiDation of prostate cancer biomarkers146
werkend immuunsysteem waarop humane prostaattumoren kunnen groeien. Met
behulp van massa spectrometrie kunnen vervolgens de eiwitten die circuleren in
het bloed van deze muizen worden geanalyseerd. Het bloed van een muis zonder
tumor zal alleen ‘muizen-eiwitten’ bevatten, het bloed van de muis met tumor zal
daarnaast mogelijk ook eiwitten bevatten afkomstig van de prostaattumor. Deze
eiwitten onderscheiden zich van de ‘muizen-eiwitten’ doordat ze als humaan
specifiek kunnen worden herkend. Voordeel van dit muismodel is dat er hierbinnen
nauwelijks variatie is, aangezien alle muizen genetisch identiek zijn en er steeds
gebruikt gemaakt kan worden van dezelfde tumor, waarvan de karakteristieken
bekend zijn. Een ander voordeel van deze aanpak is dat de meeste merkers die in de
kliniek gebruikt worden, direct worden uitgescheiden door de tumor, een situatie
die met het muismodel wordt nagebootst.
In hoofdstuk 2 werden met behulp van dit muismodel 44 eiwitten gevonden die
afkomstig waren van de verschillende prostaattumoren. Deze eiwitten bestaan,
zoals verwacht, voor een deel uit eiwitten waarvan het reeds bekend is dat ze actief
door cellen worden uitgescheiden. Een opmerkelijke bevinding is echter dat er
daarnaast ook een groot aantal eiwitten werd geïdentificeerd die normaal niet door
cellen worden uitgescheiden, zogenaamde cytoplasmatische eiwitten. Mogelijk zijn
deze in het bloed terechtgekomen als gevolg van uitscheiding in exosomen, zeer
kleine blaasjes die door cellen worden uitgescheiden vanuit het cytoplasma. Nadere
analyse van exosomen afkomstig van prostaatkankercellen toonde aan dat vrijwel
alle eiwitten die hierin gevonden werden normaal gesproken alleen in het cytoplasma
aanwezig zijn en niet actief worden uitgescheiden. Verschillende van deze eiwitten
werden eerder teruggevonden in het bloed van muizen met prostaatkanker. Tevens
werd in deze exosomen op RNA niveau het prostaatkanker specifieke fusiegen
TMPRSS2:ERG aangetoond. Al met al lijken exosomen dus ideale kandidaten voor
de ontdekking van nieuwe merkers voor prostaatkanker.
In hoofdstuk 3 wordt op een andere manier gebruik gemaakt van het muismodel.
Door muizen met een intact afweersysteem te immuniseren met bloed afkomstig
van muizen met een humane prostaattumor werd een antilichaam respons
opgewekt tegen eiwitten afkomstig van deze prostaattumor. Deze eiwitten konden
vervolgens worden geïdentificeerd door eiwit microarrays te incuberen met bloed
van geïmmuniseerde muizen. Dit leverde onder andere de identificatie op van de
eiwitten TYRO3, AXL, MERTK, ACY1 en PSMA1, waarvan de eerste drie werden
gevalideerd in humaan serum. Hierbij werden inderdaad significante verschillen
gevonden tussen verschillende groepen van mannen met en zonder prostaatkanker.
Ook deze methode lijkt dus in staat tot het vinden van nieuwe merkers voor
prostaatkanker, hoewel grootschalige validatie van mogelijke merkers nog moet
plaatsvinden.
Flip_Jansen.indd 146 30-7-2013 8:43:56

sAMenvAttinG 147
In hoofdstuk 4 werd de additionele waarde van de PSA isovormen p2PSA en BPHA
naast tPSA (totaal PSA) en fPSA met betrekking tot de detectie van prostaatkanker
onderzocht. Deze PSA isovormen maken onderdeel uit van de vrije PSA fractie
(fPSA). Tevens werd de bruikbaarheid van phi (prostate health index, (p2PSA/
fPSA) x √(tPSA)) onderzocht. In totaal werden 756 serum samples geanalyseerd van
mannen met en zonder prostaatkanker en een tPSA waarde tussen de 2 en 10 ng/
ml. Het betrof hier een multicenter studie met samples afkomstig van de European
Randomised Study of Screening for Prostate Cancer en de Medische Universiteit
van Innsbruck. Uit de resultaten blijkt dat phi de beste voorspeller is voor de
aanwezigheid van prostaatkanker, significant beter dan tPSA. Ook de specificiteit
van phi is significant beter dan die van tPSA (31 versus 10%). Ook %p2PSA (p2PSA/
fPSA) presteerde significant beter dan tPSA. Bij multivariaat analyse zorgde de
toevoeging van p2PSA voor een significante verbetering van het voorspellende
model. De invoering van phi in de dagelijkse klinische praktijk zou dus de detectie
van prostaatkanker kunnen verbeteren en hierdoor tevens het aantal negatieve
prostaatbiopten kunnen beperken.
Wereldwijd worden er tientallen platformen van verschillende fabrikanten gebruikt
om de waarde van tPSA in serum te kunnen bepalen. Aangezien deze elk hun eigen
kalibratie methode gebruiken leidt dit tot substantiële verschillen in tPSA uitslagen.
Om deze verschillen te beperken werd door de World Health Organization (WHO)
een kalibratie standaard in het leven geroepen, de WHO 96/670. Vervanging van
de originele kalibratie door de WHO 96/670 kalibratie standaard zou echter kunnen
leiden tot een verschuiving in tPSA waarden, met gevolgen voor afkappunten voor
het nemen van prostaatbiopten, weer resulterend in mogelijke veranderingen in
prostaatkankerdetectie. In hoofdstuk 5 werden de gevolgen van de introductie van
de WHO 96/670 kalibratie standaard voor de tPSA bepaling van Beckman Coulter
onderzocht. Hieruit blijkt dat bij toepassing van de WHO 96/670 kalibratie de
tPSA waarden 20% lager uitvallen. Wanneer de afkappunten voor het nemen van
prostaatbiopten vervolgens niet adequaat worden aangepast resulteert dit ook
in een vermindering van het aantal gedetecteerde prostaattumoren. Hoewel het
overgrote deel hiervan relatief ‘gunstige’ prostaattumoren betreft is het van groot
belang dat clinici zich ervan bewust zijn welke tPSA bepaling er in hun ziekenhuis
wordt gebruikt en welke kalibratie standaard er wordt toegepast.
Flip_Jansen.indd 147 30-7-2013 8:43:56

Flip_Jansen.indd 148 30-7-2013 8:43:56
CURRiCUlUM vitAe 149
curriculum vitae
personal detailsSurname Jansen
First names Flip (Filippus Hubertus)
Birth date and -place 17-02-1980, Gouda, The Netherlands
Nationality Dutch
E-mail [email protected]
education1992 - 1998 Gymnasium, Zeist, The Netherlands
1998 - 2005 Medical School University of Utrecht, The Netherlands
Work2003 - 2003 Registration assistant for Nivel Foundation, Utrecht,
The Netherlands
2005 - 2008 PhD research ‘Discovery and validation of prostate cancer
biomarkers’. Supervisors: Professor C.H. Bangma and
Professor G. Jenster
2009 - present Resident in Urology (UMC Utrecht)
scientific experience2002 - 2002 Research student at the Department of Haematology,
UMC Utrecht. Supervisors dr. R. Fijnheer and professor
Ph. G. de Groot
2005 - 2008 PhD research ‘Discovery and validation of prostate cancer
biomarkers’. Supervisors: Professor C.H. Bangma and
Professor G. Jenster
2007 - 2009 Member of the Working Party ‘Richtlijn Urineweginfecties
voor Volwassenen’ of the Nederlandse Vereniging voor
Urologie
Flip_Jansen.indd 149 30-7-2013 8:43:56
Discovery anD valiDation of prostate cancer biomarkers150
awards– Scholar-in-Training Award, American Association for Cancer Research,
Innovations in Prostate Cancer Research, San Francisco, 2006– Best poster on ‘New Biomarkers for Prostate Cancer’, 22nd Annual Congress of
the European Association of Urology, Berlin, 2007– Best poster on ‘Improvements on the diagnosis and prognosis of prostate cancer’,
23nd Annual Congress of the European Association of Urology, Milan, 2008
publicationsElevated levels of d-dimer and fragment 1+2 upon central venous catheter insertion and factor V Leiden predict subclavian vein thrombosisF.H. Jansen, H.M. van der Straaten, M. Roest, F. Haas, Ph.G. de Groot, R. FijnheerHaematologia; 2005; 90: 499-504
Risicofactoren bij recidiverende urineweginfectiesF.H. Jansen, E.R. BoevéNederlands Tijdschrift voor Urologie; 2006; 7: 194-99
PSA isovormen verbeteren de prognostische waarde van prostaatkanker biopten, maar kunnen deze niet vervangenF.H. Jansen, R.H.N. van Schaik, J. Kurstjens, M.F. Wildhagen, M. Roobol, C.H. BangmaNederlands Tijdschrift voor Klinische Chemie en Laboratoriumgeneeskunde 2007; 32: 259-261
Recidiverende urineweginfecties bij vrouwen: optimaliseren van het beleid.E.P. van Haarst, F.H. Jansen, T. WiersmaNederlands Tijdschrift voor Urologie; 2008;2:71-76
The clinical impact of the new prostate-specific antigen WHO standardization on prostate biopsy rates and prostate cancer detectionF.H. Jansen, M. Roobol, C.H. Bangma, R.H.N. van SchaikClinical Chemistry; 2008;54: 1999-2006
Prostate specific antigen: an updateC.H. Bangma, F.H.Jansen, M. RoobolInternational Handbook of Prostate Cancer, 2008, 3d edition; Chapter 3b: 73-81
Exosomal secretion of prostate cancer derived proteins: exosomes as biomarker treasure chestsF.H. Jansen, J. Krijgsveld, A. van Rijswijk, R. Willemsen, T.M. Luider, G. JensterMolecular and Cellular Proteomics; 2009; 8: 1192-205
Screening for prostate cancer in 2008 II: the importance of molecular subforms of PSA and tissue kallikreinsFlip.H. Jansen, Monique Roobol, Guido Jenster, Fritz H. Schröder, Chris H. BangmaEuropean Urology; 2009; 55: 563-74
Flip_Jansen.indd 150 30-7-2013 8:43:56
CURRiCUlUM vitAe 151
Niet-antibiotische profylaxe bij recidiverende urineweginfectiesF.H. Jansen, E.P. van HaarstNederlands Tijdschrift voor Urologie; 2009; 5: 125-129
p2PSA in combination with total PSA and free PSA improves diagnostic accuracy in prostate cancer detectionFlip H. Jansen, Ron H.N. van Schaik, Joep Kurstjens, Wolfgang Horninger, Helmut Klocker, Jasmin Bektic, Mark F. Wildhagen, Monique Roobol, Chris H. Bangma, Georg BartschEuropean Urology; 2010; 57: 921-7
Profiling of antibody production against xenograft-released proteins by protein microarrays discovers prostate cancer markersF.H. Jansen, A. van Rijswijk, W. Teubel, W.M. van Weerden, S. Reneman, G.J. van den Bemd, M. Roobol, C.H. Bangma, F.J.T. Staal, G. JensterJournal of Proteome Research; 2012 Feb 3;11(2):728-35
presentationsElevated levels of d-dimer and fragment 1+2 upon central venous catheter insertion and factor V Leiden predict subclavian vein thrombosis; F.H. Jansen, H.M. van der Straaten, M. Roest, F. Haas, Ph.G. de Groot, R. Fijnheer– Nederlandse vereniging voor Haematologie, Lunteren, 2002– International Society on Thrombosis and Haemostasis, Birmingham, 2003
Oncological outcome and treatment related toxicity in patients with localised
prostate cancer following HDR-192IR brachytherapy combined with external beam
radiotherapy. F.H. Jansen, M.F. Wildhagen, W.J. Kirkels, P.P. Jansen, C.H. Bangma,
B.J. Chaplin– Symposium ‘Behandeling lokaal prostaatcarcinoom’, Rotterdam, 2005
DR -192IR brachytherapie in combinatie met uitwendige radiotherapie bij het lokaal beperkt prostaatcarcinoom: toxiciteit en PSA verloop; F.H. Jansen, M.F. Wildhagen, W.J. Kirkels, P.P. Jansen, C.H. Bangma, B.J. Chaplin– Najaarscongres Nederlandse vereniging voor Urologie, Utrecht, 2005
Xenograft-based discovery of biomarkers for prostate cancer; F.H. Jansen, J. Krijgsveld, G.J. van den Bemd, A. van Rijswijk, J. Demmers, G. Jenster– American Association for Cancer Research, Innovations in Prostate Cancer
Research, San Francisco, 2006
Evaluation of the Beckman Coulter Access Immunoassay for prostate-specific antigen isoforms in the prediction of cancer recurrence and aggressiveness; F.H. Jansen, R.H.N. van Schaik, J. Kurstjens, M.F. Wildhagen, M. Roobol, C.H. Bangma– 17th IFCC - FESCC European Congress of Clinical Chemistry and Laboratory
Medicine, Amsterdam, 2007
Flip_Jansen.indd 151 30-7-2013 8:43:56

Discovery anD valiDation of prostate cancer biomarkers152
PCa detection by PSA isoform markers: a cross-validation study; Flip H. Jansen, Ron H.N. van Schaik, Joep Kurstjens, Wolfgang Horninger, Helmut Klocker, Jasmin Bektic, Mark F. Wildhagen, Monique Roobol, Chris H. Bangma, Georg Bartsch– P-Mark meeting, Malmö, 2008
The use of -2proPSA and BPSA in prostate cancer detection: external cross-validation of a predictive model; Flip H. Jansen, Ron H.N. van Schaik, Joep Kurstjens, Wolfgang Horninger, Helmut Klocker, Jasmin Bektic, Mark F. Wildhagen, Monique Roobol, Chris H. Bangma, Georg Bartsch– American Urological Association (AUA) Annual Meeting, Orlando, 2008
De ontdekking van nieuwe prostaatkanker markers door antilichaam productie tegen humaan xenograft-geproduceerde eiwitten; F.H. Jansen, A. van Rijswijk, W. Teubel, W.M. van Weerden, S. Reneman, G.J. van den Bemd, M. Roobol, C.H. Bangma, F.J.T. Staal, G. Jenster– Voorjaarsvergadering Nederlandse vereniging voor Urologie, Nieuwegein, 2009
De prostate health index: van aanvullende waarde in prostaatkankerdiagnostiek?; F.H. Jansen– Symposium ‘Het Toekomstbestendige Laboratorium’ Star-MDC, Rotterdam,
2010
Prostaat zorgstraat; de rol van de prostate health index (phi); F.H. Jansen– Beckman Coulter Symposium, Utrecht, 2011
poster presentationsOncological outcome and treatment related toxicity in patients with localised prostate cancer following HDR-192IR brachytherapy combined with external beam radiotherapy; F.H. Jansen, M.F. Wildhagen, W.J. Kirkels, P.P. Jansen, C.H. Bangma, B.J. Chaplin– 21st Annual Congress of the European Association of Urology, Paris, 2006
Identification of prostate cancer-derived serum proteins in xenograft-bearing mice; F.H. Jansen, G.J. van den Bemd, J. Krijgsveld, A. van Rijswijk, J. Demmers, G. Jenster– Fall meeting Netherlands Proteomics Platform, Leiden, 2006– HUPO 5th Annual World Congress, Long Beach, 2006
Xenograft-based discovery of biomarkers for prostate cancer; F.H. Jansen, J. Krijgsveld, G.J. van den Bemd, A. van Rijswijk, J. Demmers, G. Jenster– American Association for Cancer Research, Innovations in Prostate Cancer
Research, San Francisco, 2006
Search for human prostate cancer markers in serum of xenograft-bearing mice; F.H. Jansen, J. Krijgsveld, G.J. van den Bemd, A. van Rijswijk, J. Demmers, G. Jenster– 22nd Annual Congress of the European Association of Urology, Berlin, 2007– Najaarscongres Nederlandse vereniging voor Urologie, Utrecht, 2005
Flip_Jansen.indd 152 30-7-2013 8:43:56
CURRiCUlUM vitAe 153
Proteins entrapped in PCa-derived exosomes as a source of novel serum markers; F.H. Jansen, J. Krijgsveld, R. Willemsen, A. van Rijswijk, G. Jenster– 7th World Basic Urological Research Congress, Dublin, 2007– Najaarscongres Nederlandse vereniging voor Urologie, Nieuwegein, 2008
Prostate cancer-derived exosomes as novel biomarker treasure chests; F.H. Jansen, J. Krijgsveld, R. Willemsen, T.M. Luider, A. van Rijswijk, G. Jenster– 23thd Annual Congress of the European Association of Urology (EAU), Milaan,
2008
Exosomes as a tool for prostate cancer biomarker discovery; F.H. Jansen, J. Krijgsveld, R. Willemsen, T.M. Luider, A. van Rijswijk, G. Jenster– 12th Molecular Medicine Day, Rotterdam, 2008
The clinical impact of the PSA assay WHO calibration on prostate biopsy rates and prostate cancer detection; F.H. Jansen, M. Roobol, C.H. Bangma, R.H.N. van Schaik– American Urological Association (AUA) Annual Meeting, Orlando, 2008
Function, composition and secretion of prostate cancer derived exosomes; F.H. Jansen, J. Krijgsveld, R. Willemsen, T.M. Luider, M.S. van den Berg, A. van Rijswijk, G. Jenster– 18th Meeting of the European Society for Urological Research, Barcelona, 2008
Percent (-2)proPSA improves diagnostic accuracy in prostate cancer detection; Flip H. Jansen, Ron H.N. van Schaik, Joep Kurstjens, Wolfgang Horninger, Helmut Klocker, Jasmin Bektic, Mark F. Wildhagen, Monique Roobol, Chris H. Bangma, Georg Bartsch– 23th Congress of the European Association of Urology (EAU), Stockholm, 2009
The (-2)proPSA/fPSA ratio (%(-2)proPSA) improves diagnostic accuracy for prostate cancer detection; R.H.N. van Schaik, F.H. Jansen, J. Kurstjens, W. Horninger, H. Klocker, J. Bektic, M.F. Wildhagen, M. Roobol, C.H. Bangma, G. Bartsch– 18th IFCC - EFCC European Congress of Clinical Chemistry and Laboratory
Medicine, Innsbruck, 2009
p2PSA in combination with total PSA and free PSA improves diagnostic accuracy in prostate cancer detection; Flip H. Jansen, Ron H.N. van Schaik, Joep Kurstjens, Wolfgang Horninger, Helmut Klocker, Jasmin Bektic, Mark F. Wildhagen, Monique Roobol, Chris H. Bangma, Georg Bartsch– American Urological Association (AUA) Annual Meeting, San Francisco, 2010
Flip_Jansen.indd 153 30-7-2013 8:43:56

Flip_Jansen.indd 154 30-7-2013 8:43:56
DAnkWOORD 155
DankWoorDAlhoewel ik me ’s avonds en ’s nachts soms niet geheel aan de indruk kon onttrekken,
een proefschrift schrijf je natuurlijk nooit alleen. Zonder de hulp van velen was dit
boekje er nooit gekomen. Bij dezen wil ik dan ook iedereen bedanken die iets aan het
ontstaan van dit proefschrift heeft bijgedragen.
Dit proefschrift was er zonder u zeker niet gekomen: Professor Bangma, beste
Chris, dank voor het vertrouwen dat je me vanaf het begin hebt gegeven om mijn
promotieonderzoek onder jouw leiding uit te kunnen voeren. Toen het gentherapie
project uiteindelijk geen doorgang kon vinden heb je mij tijdig van het zinkende
schip gehaald. Gelukkig vaart het weer! Op onze wekelijkse besprekingen hield je
altijd de grote lijnen in de gaten en de klinische toepasbaarheid van onze meest
recente ontdekkingen.
Onderzoeker pur sang: beste Guido, en inmiddels zelfs professor Jenster. Ik heb er
even op moeten wachten (en jij ook), maar ik ben er trots op dat ik nu als eerste onder
jouw leiding mag promoveren. Ik ken niemand die ondanks chronisch slaapgebrek
altijd met zulke scherpzinnige en creatieve oplossingen aankwam als ik ergens op
was vastgelopen. Je zei altijd dat het erbij hoorde dat negen van de tien experimenten
in het lab op niks uitdraaide, maar ik kan me niet aan de indruk onttrekken dat het
bij ons iets lager lag. Have fun!
Abracadabra was het af en toe voor mij, die statistiek. Dr. Roobol, beste Monique,
bedankt voor je geduld en uitleg en daarnaast voor de begeleiding van het meer
klinische gedeelte van mijn proefschrift en het zitting nemen in de leescommissie.
Professor Schröder, ik ben u dankbaar voor de mogelijkheid die u mij bood om een
review artikel te schrijven over de PSA isovormen en het ter beschikking stellen van
de serumsamples uit de biobank van de ERSPC.
Professor Looijenga en professor Sillevis Smitt, dank voor het beoordelen van mijn
manuscript en het zitting nemen in de leescommissie van mijn proefschrift.
Alle medeauteurs wil ik bedanken voor hun bijdragen aan de verschillende
hoofdstukken van dit proefschrift. Professor Staal, dank voor uw hulp en expertise
bij de ProtoArray experimenten. Dr. Willemsen, beste Rob, bedankt voor de mooie
Flip_Jansen.indd 155 30-7-2013 8:43:56
Discovery anD valiDation of prostate cancer biomarkers156
plaatjes van de exosomen met de elektronenmicroscoop. Dr. van Schaik, beste
Ron, dank voor al je adviezen en hulp bij de artikelen over PSA calibratie en PSA
isovormen. Dr. Luider en dr. Dekker, beste Theo en Lennard, bedankt voor jullie
hulp bij het uitvoeren en analyseren van de massaspectometrie experimenten. Beste
Gert-Jan, dr. Van den Bemd, dankzij jou lag er voldoende materiaal klaar om direct
aan de slag te kunnen gaan en hier het eerste artikel op te baseren. Dank voor al je
adviezen en hulp hierbij. Dr. Krijgsveld, beste Jeroen, dank voor je expertise en het
ter beschikking stellen van je lab voor het uitvoeren van de massaspectrometrie
experimenten. Dr. Wildhagen, beste Mark, bedankt voor je bijdrage op het gebied
van de statistiek. Dr. Van Weerden, beste Wytske, dank voor je hulp en uitleg bij
het opzetten van de muisexperimenten. En als laatste, maar zeker niet de minsten;
Angelique en Mirella, ‘mijn’ analisten. Jullie hulp bij het uitvoeren van de talloze
experimenten op het lab en het helpen zoeken als ik weer eens iets niet kon vinden
in de vriezer was onmisbaar. Zonder jullie was dit boekje er zeker niet gekomen.
Dr. Fijnheer, beste Rob. Het is al weer wat langer geleden, maar jij bent degene
geweest onder wiens leiding ik voor het eerst kennis maakte met het doen van
basaal wetenschappelijk onderzoek. Ik weet nog goed dat je zei dat jij de ELISA
eigenlijk had uitgevonden, ik geloofde het toch zeker vijf seconden.
Iedereen van het urologie lab in het JNI: Ellen en Wytske, mijn eerste kamergenoten,
bedankt voor al de adviezen, jullie hebben me niet aan de thee gekregen! Wilma,
Sigrid, Natasja en Robert, dank voor al jullie hulp op het lab. Susan en Corina, de
‘muizendames’, dank voor het uitvoeren van alle experimenten met de muizen. Ik had
al moeite om er eentje zonder kleerscheuren uit een kooi te halen. Mijn kamergenoten
Rogier, Dennis, Leonie, Rute, Karin, Delshad en Jan Matthijs. Dank voor jullie hulp
en vooral voor de minder wetenschappelijke gesprekken (en geluiden).
Graag wil ik mijn familie, in het bijzonder mijn ouders en zusjes, vrienden (Caligula!)
en collega’s bedanken voor alle ontspannende en inspannende momenten (Anti-
Lopen) tijdens dit promotietraject. Deze zijn minstens zo belangrijk geweest.
Mam, bedankt voor het gebruik van je bureau en de onbeperkte cappuccino!
Sander en Roderick, mijn paranimfen, ik ben vereerd dat jullie mij op deze dag
terzijde zullen staan!
Hanneke, dankjewel voor de twee allerleukste monstertjes van de hele wereld!
Philip en Willemijn, jullie zijn schatjes (bijna altijd)!
Flip_Jansen.indd 156 30-7-2013 8:43:56

AbbReviAtiOns 157
abbreviationsACY1 aminoacylase 1
AUC area under the curve
AXL AXL receptor tyrosine kinase
BPH benign prostatic hyperplasia
BPHA (or BPSA) benign prostatic hyperplasia–associated PSA (or ‘benign’PSA)
CD9 tetraspanin 29
DRE digital rectal examination
ELISA enzyme-linked immunosorbent assay
ENO1 alpha enolase
ERSPC European Randomized Study of Screening for Prostate Cancer
fPSA free PSA
GAPDH glyceraldehyde-3-phosphate dehydrogenase
GS Gleason score
hK2 human kallikrein 2
MERTK c-mer proto-oncogene tyrosine kinase
MS mass spectroscopy
PCa prostate cancer
PC339 androgen insensitive PCa cell line
PC346 androgen sensitive PCa cell line
phi Prostate Health Index ( = (p2PSA/fPSA) x √(tPSA))
pPSA proPSA
PSA prostate-specific antigen
PSMA1 proteasome subunit, alpha type, 1
p2PSA (-2)proPSA
tPSA total PSA
TRUS transrectal ultrasound
TYRO3 TYRO3 protein tyrosine kinase
WHO World Health Organization
%fPSA fPSA/tPSA
Flip_Jansen.indd 157 30-7-2013 8:43:56

Flip_Jansen.indd 158 30-7-2013 8:43:56
RefeRenCes 159
references1. Lee, C. H., Akin-Olugbade, O., and Kirschenbaum, A., Overview of prostate anatomy,
histology, and pathology. Endocrinol Metab Clin North Am 40 (3), 565 (2011).
2. Lilja, H., A kallikrein-like serine protease in prostatic fluid cleaves the predominant
seminal vesicle protein. J Clin Invest 76 (5), 1899 (1985).
3. Hara, M., Koyanagi, Y., Inoue, T., and Fukuyama, T., [Some physico-chemical
characteristics of “ -seminoprotein”, an antigenic component specific for human
seminal plasma. Forensic immunological study of body fluids and secretion. VII].
Nihon Hoigaku Zasshi 25 (4), 322 (1971).
4. Armbruster, D. A., Prostate-specific antigen: biochemistry, analytical methods, and
clinical application. Clin Chem 39 (2), 181 (1993).
5. Rittenhouse, H. G., Finlay, J. A., Mikolajczyk, S. D., and Partin, A. W., Human
Kallikrein 2 (hK2) and prostate-specific antigen (PSA): two closely related, but
distinct, kallikreins in the prostate. Crit Rev Clin Lab Sci 35 (4), 275 (1998).
6. Wang, M. C., Valenzuela, L. A., Murphy, G. P., and Chu, T. M., Purification of a human
prostate specific antigen. Invest Urol 17 (2), 159 (1979).
7. Kuriyama, M., Wang, M. C., Papsidero, L. D. et al., Quantitation of prostate-specific
antigen in serum by a sensitive enzyme immunoassay. Cancer Res 40 (12), 4658 (1980).
8. Papsidero, L. D., Wang, M. C., Valenzuela, L. A. et al., A prostate antigen in sera of
prostatic cancer patients. Cancer Res 40 (7), 2428 (1980).
9. Papsidero, L. D., Wojcieszyn, J. W., Horoszewicz, J. S. et al., Isolation of prostatic acid
phosphatase-binding immunoglobulin G from human sera and its potential for use as a
tumor-localizing reagent. Cancer Res 40 (8 Pt 2), 3032 (1980).
10. Balk, S. P., Ko, Y. J., and Bubley, G. J., Biology of prostate-specific antigen. J Clin Oncol
21 (2), 383 (2003).
11. Magklara, A., Scorilas, A., Stephan, C. et al., Decreased concentrations of prostate-
specific antigen and human glandular kallikrein 2 in malignant versus nonmalignant
prostatic tissue. Urology 56 (3), 527 (2000).
12. Andriole, G. L., Levin, D. L., Crawford, E. D. et al., Prostate Cancer Screening in the
Prostate, Lung, Colorectal and Ovarian (PLCO) Cancer Screening Trial: findings from
the initial screening round of a randomized trial. J Natl Cancer Inst 97 (6), 433 (2005).
13. Stamey, T. A., Yang, N., Hay, A. R. et al., Prostate-specific antigen as a serum marker
for adenocarcinoma of the prostate. N Engl J Med 317 (15), 909 (1987).
14. Mikolajczyk, S. D., Marks, L. S., Partin, A. W., and Rittenhouse, H. G., Free prostate-
specific antigen in serum is becoming more complex. Urology 59 (6), 797 (2002).
Flip_Jansen.indd 159 30-7-2013 8:43:56
Discovery anD valiDation of prostate cancer biomarkers160
15. Society, American Cancer, What are the key statistics of prostate cancer?, Available
at http://www.cancer.org/cancer/prostatecancer/detailedguide/prostate-cancer-key-
statistics, (2010).
16. Gronberg, H., Prostate cancer epidemiology. Lancet 361 (9360), 859 (2003).
17. Sakr, W. A., Haas, G. P., Cassin, B. F. et al., The frequency of carcinoma and
intraepithelial neoplasia of the prostate in young male patients. J Urol 150 (2 Pt 1),
379 (1993).
18. Mariotto, A. B., Robin Yabroff, K., Shao, Y. et al., Projections of the cost of cancer care
in the United States: 2010-2020. J Natl Cancer Inst 103 (2), 117 (2011).
19. Slobbe, LCJ, Smit, JM, Groen, J et al., Cost of Illness in the Netherlands 2007. (RIVM)
(2011).
20. McDavid, K., Lee, J., Fulton, J. P. et al., Prostate cancer incidence and mortality rates
and trends in the United States and Canada. Public Health Rep 119 (2), 174 (2004).
21. Farkas, A., Schneider, D., Perrotti, M. et al., National trends in the epidemiology of
prostate cancer, 1973 to 1994: evidence for the effectiveness of prostate-specific
antigen screening. Urology 52 (3), 444 (1998).
22. Jacobsen, S. J., Katusic, S. K., Bergstralh, E. J. et al., Incidence of prostate cancer
diagnosis in the eras before and after serum prostate-specific antigen testing. JAMA
274 (18), 1445 (1995).
23. Cremers, R. G., Karim-Kos, H. E., Houterman, S. et al., Prostate cancer: trends in
incidence, survival and mortality in the Netherlands, 1989-2006. Eur J Cancer 46 (11),
2077 (2010).
24. Catalona, W. J., Smith, D. S., Ratliff, T. L., and Basler, J. W., Detection of organ-
confined prostate cancer is increased through prostate-specific antigen-based
screening. JAMA 270 (8), 948 (1993).
25. Smith, D. S. and Catalona, W. J., The nature of prostate cancer detected through
prostate specific antigen based screening. J Urol 152 (5 Pt 2), 1732 (1994).
26. Thompson, I. M., Pauler, D. K., Goodman, P. J. et al., Prevalence of prostate cancer
among men with a prostate-specific antigen level < or =4.0 ng per milliliter.
N Engl J Med 350 (22), 2239 (2004).
27. Nam, R. K., Toi, A., Klotz, L. H. et al., Assessing individual risk for prostate cancer.
J Clin Oncol 25 (24), 3582 (2007).
28. van Vugt, H. A., Kranse, R., Steyerberg, E. W. et al., Prospective validation of a
risk calculator which calculates the probability of a positive prostate biopsy in a
contemporary clinical cohort. Eur J Cancer 48 (12), 1809 (2012).
29. Loeb, S. and Catalona, W. J., Prostate-specific antigen in clinical practice. Cancer Lett
249 (1), 30 (2007).
Flip_Jansen.indd 160 30-7-2013 8:43:56
RefeRenCes 161
30. Djulbegovic, M., Beyth, R. J., Neuberger, M. M. et al., Screening for prostate cancer:
systematic review and meta-analysis of randomised controlled trials. BMJ 341, c4543
(2010).
31. Scales, C. D., Jr., Curtis, L. H., Norris, R. D. et al., Prostate specific antigen testing in
men older than 75 years in the United States. J Urol 176 (2), 511 (2006).
32. Andriole, G. L., Crawford, E. D., Grubb, R. L., 3rd et al., Prostate cancer screening
in the randomized Prostate, Lung, Colorectal, and Ovarian Cancer Screening Trial:
mortality results after 13 years of follow-up. J Natl Cancer Inst 104 (2), 125 (2012).
33. Heijnsdijk, E. A., der Kinderen, A., Wever, E. M. et al., Overdetection, overtreatment
and costs in prostate-specific antigen screening for prostate cancer. Br J Cancer 101
(11), 1833 (2009).
34. Schroder, F. H., Hugosson, J., Roobol, M. J. et al., Prostate-cancer mortality at 11 years
of follow-up. N Engl J Med 366 (11), 981 (2012).
35. Schroder, F. H. and Roobol, M. J., ERSPC and PLCO prostate cancer screening studies:
what are the differences? Eur Urol 58 (1), 46 (2010).
36. Shteynshlyuger, A. and Andriole, G. L., Cost-effectiveness of prostate specific antigen
screening in the United States: extrapolating from the European study of screening for
prostate cancer. J Urol 185 (3), 828 (2011).
37. Heijnsdijk, EA; Wever, EM; Auvinen, A; Hugosson, J; Ciatto, S; Nelen, V;
Kwiatkowski, M;, Villers, A; Páez, A; Moss, SM; Zappa, M; Tammela, TL; Mäkinen, T;
Carlsson, S; Korfage,, IJ; Essink-Bot, ML; Otto, SJ; Draisma, G; Bangma, CH;
Roobol, MJ; Schröder, FH; de, and Koning, HJ., Quality-of-life effects of prostate-
specific antigen screening. New England Journal of Medicine 367 (7), 595 (2012).
38. Biomarkers and surrogate endpoints: preferred definitions and conceptual framework.
Clin Pharmacol Ther 69 (3), 89 (2001).
39. Shariat, S. F., Semjonow, A., Lilja, H. et al., Tumor markers in prostate cancer I: blood-
based markers. Acta Oncol 50 Suppl 1, 61 (2011).
40. Langeberg, W. J., Isaacs, W. B., and Stanford, J. L., Genetic etiology of hereditary
prostate cancer. Front Biosci 12, 4101 (2007).
41. Martin, D. N., Starks, A. M., and Ambs, S., Biological determinants of health
disparities in prostate cancer. Curr Opin Oncol 25 (3), 235 (2013).
42. Williams, H. and Powell, I. J., Epidemiology, pathology, and genetics of prostate cancer
among African Americans compared with other ethnicities. Methods Mol Biol 472,
439 (2009).
43. Hemminki, K. and Czene, K., Age specific and attributable risks of familial prostate
carcinoma from the family-cancer database. Cancer 95 (6), 1346 (2002).
44. Ahn, J., Moslehi, R., Weinstein, S. J. et al., Family history of prostate cancer and
prostate cancer risk in the Alpha-Tocopherol, Beta-Carotene Cancer Prevention
(ATBC) Study. Int J Cancer 123 (5), 1154 (2008).
Flip_Jansen.indd 161 30-7-2013 8:43:57
Discovery anD valiDation of prostate cancer biomarkers162
45. Kalish, L. A., McDougal, W. S., and McKinlay, J. B., Family history and the risk of
prostate cancer. Urology 56 (5), 803 (2000).
46. Cerhan, J. R., Parker, A. S., Putnam, S. D. et al., Family history and prostate cancer
risk in a population-based cohort of Iowa men. Cancer Epidemiol Biomarkers Prev 8 (1),
53 (1999).
47. Colloca, G. and Venturino, A., The evolving role of familial history for prostate cancer.
Acta Oncol 50 (1), 14 (2011).
48. Nakagawa, H., Akamatsu, S., Takata, R. et al., Prostate cancer genomics, biology, and
risk assessment through genome-wide association studies. Cancer Sci 103 (4), 607
(2012).
49. Lundwall, A. and Lilja, H., Molecular cloning of human prostate specific antigen
cDNA. FEBS Lett 214 (2), 317 (1987).
50. Darson, M. F., Pacelli, A., Roche, P. et al., Human glandular kallikrein 2 (hK2)
expression in prostatic intraepithelial neoplasia and adenocarcinoma: a novel prostate
cancer marker. Urology 49 (6), 857 (1997).
51. Kumar, A., Mikolajczyk, S. D., Goel, A. S. et al., Expression of pro form of prostate-
specific antigen by mammalian cells and its conversion to mature, active form by
human kallikrein 2. Cancer Res 57 (15), 3111 (1997).
52. Mikolajczyk, S. D., Marker, K. M., Millar, L. S. et al., A truncated precursor form of
prostate-specific antigen is a more specific serum marker of prostate cancer. Cancer
Res 61 (18), 6958 (2001).
53. Peter, J., Unverzagt, C., Krogh, T. N. et al., Identification of precursor forms of free
prostate-specific antigen in serum of prostate cancer patients by immunosorption and
mass spectrometry. Cancer Res 61 (3), 957 (2001).
54. Mikolajczyk, S. D., Millar, L. S., Wang, T. J. et al., A precursor form of prostate-specific
antigen is more highly elevated in prostate cancer compared with benign transition
zone prostate tissue. Cancer Res 60 (3), 756 (2000).
55. Hilz, H., Noldus, J., Hammerer, P. et al., Molecular heterogeneity of free PSA in sera of
patients with benign and malignant prostate tumors. Eur Urol 36 (4), 286 (1999).
56. Noldus, J., Chen, Z., and Stamey, T. A., Isolation and characterization of free form
prostate specific antigen (f-PSA) in sera of men with prostate cancer. J Urol 158 (4),
1606 (1997).
57. Mikolajczyk, S. D. and Rittenhouse, H. G., Pro PSA: a more cancer specific form of
prostate specific antigen for the early detection of prostate cancer. Keio J Med 52 (2),
86 (2003).
58. Mikolajczyk, S. D., Millar, L. S., Wang, T. J. et al., “BPSA,” a specific molecular form of
free prostate-specific antigen, is found predominantly in the transition zone of patients
with nodular benign prostatic hyperplasia. Urology 55 (1), 41 (2000).
Flip_Jansen.indd 162 30-7-2013 8:43:57

RefeRenCes 163
59. Linton, H. J., Marks, L. S., Millar, L. S. et al., Benign prostate-specific antigen (BPSA)
in serum is increased in benign prostate disease. Clin Chem 49 (2), 253 (2003).
60. Canto, E. I., Singh, H., Shariat, S. F. et al., Serum BPSA outperforms both total PSA
and free PSA as a predictor of prostatic enlargement in men without prostate cancer.
Urology 63 (5), 905 (2004).
61. Catalona, W. J., Bartsch, G., Rittenhouse, H. G. et al., Serum pro prostate specific
antigen improves cancer detection compared to free and complexed prostate specific
antigen in men with prostate specific antigen 2 to 4 ng/ml. J Urol 170 (6 Pt 1), 2181
(2003).
62. Mikolajczyk, S. D., Catalona, W. J., Evans, C. L. et al., Proenzyme forms of prostate-
specific antigen in serum improve the detection of prostate cancer. Clin Chem 50 (6),
1017 (2004).
63. Naya, Y., Fritsche, H. A., Bhadkamkar, V. A. et al., Volume-based evaluation of serum
assays for new prostate-specific antigen isoforms in the detection of prostate cancer.
Urology 63 (3), 492 (2004).
64. Naya, Y., Fritsche, H. A., Bhadkamkar, V. A. et al., Evaluation of precursor prostate-
specific antigen isoform ratios in the detection of prostate cancer. Urol Oncol 23 (1),
16 (2005).
65. Groskopf, J., Aubin, S. M., Deras, I. L. et al., APTIMA PCA3 molecular urine test:
development of a method to aid in the diagnosis of prostate cancer. Clin Chem 52 (6),
1089 (2006).
66. Haese, A., de la Taille, A., van Poppel, H. et al., Clinical utility of the PCA3 urine assay
in European men scheduled for repeat biopsy. Eur Urol 54 (5), 1081 (2008).
67. Marks, L. S., Fradet, Y., Deras, I. L. et al., PCA3 molecular urine assay for prostate
cancer in men undergoing repeat biopsy. Urology 69 (3), 532 (2007).
68. Tinzl, M., Marberger, M., Horvath, S., and Chypre, C., DD3PCA3 RNA analysis in
urine--a new perspective for detecting prostate cancer. Eur Urol 46 (2), 182 (2004).
69. Roobol, M. J., Schroder, F. H., van Leeuwen, P. et al., Performance of the prostate
cancer antigen 3 (PCA3) gene and prostate-specific antigen in prescreened men:
exploring the value of PCA3 for a first-line diagnostic test. Eur Urol 58 (4), 475 (2010).
70. Tomlins, S. A., Rhodes, D. R., Perner, S. et al., Recurrent fusion of TMPRSS2 and ETS
transcription factor genes in prostate cancer. Science 310 (5748), 644 (2005).
71. Hessels, D., Smit, F. P., Verhaegh, G. W. et al., Detection of TMPRSS2-ERG fusion
transcripts and prostate cancer antigen 3 in urinary sediments may improve diagnosis
of prostate cancer. Clin Cancer Res 13 (17), 5103 (2007).
72. Aubin SM, Miick S, Williamsen S, Hodge P, Meinke J, Blase A, Hessels D, Schalken
J, Rittenhouse H, Groskopf J, Improved prediction of prostate biopsy outcome using
PCA3, TMPRSS2:ERG gene fusion and serum PSA. Journal of Urology Supplement 179,
725 (2008).
Flip_Jansen.indd 163 30-7-2013 8:43:57

Discovery anD valiDation of prostate cancer biomarkers164
73. Freedland, S. J., Hotaling, J. M., Fitzsimons, N. J. et al., PSA in the new millennium:
a powerful predictor of prostate cancer prognosis and radical prostatectomy
outcomes--results from the SEARCH database. Eur Urol 53 (4), 758 (2008).
74. Chun, F. K., Briganti, A., Gallina, A. et al., Prostate-specific antigen improves the
ability of clinical stage and biopsy Gleason sum to predict the pathologic stage at
radical prostatectomy in the new millennium. Eur Urol 52 (4), 1067 (2007).
75. Gleason, D. F. and Mellinger, G. T., Prediction of prognosis for prostatic
adenocarcinoma by combined histological grading and clinical staging. J Urol 111 (1),
58 (1974).
76. Albertsen, P. C., Hanley, J. A., Gleason, D. F., and Barry, M. J., Competing risk analysis
of men aged 55 to 74 years at diagnosis managed conservatively for clinically localized
prostate cancer. JAMA 280 (11), 975 (1998).
77. Allsbrook, W. C., Jr., Mangold, K. A., Johnson, M. H. et al., Interobserver
reproducibility of Gleason grading of prostatic carcinoma: general pathologist. Hum
Pathol 32 (1), 81 (2001).
78. Melia, J., Moseley, R., Ball, R. Y. et al., A UK-based investigation of inter- and intra-
observer reproducibility of Gleason grading of prostatic biopsies. Histopathology 48 (6),
644 (2006).
79. Orozco, R., O’Dowd, G., Kunnel, B. et al., Observations on pathology trends in 62,537
prostate biopsies obtained from urology private practices in the United States. Urology
51 (2), 186 (1998).
80. Sakr, W. A., Tefilli, M. V., Grignon, D. J. et al., Gleason score 7 prostate cancer:
a heterogeneous entity? Correlation with pathologic parameters and disease-free
survival. Urology 56 (5), 730 (2000).
81. Catalona, W. J., Bartsch, G., Rittenhouse, H. G. et al., Serum pro-prostate specific
antigen preferentially detects aggressive prostate cancers in men with 2 to 4 ng/ml
prostate specific antigen. J Urol 171 (6 Pt 1), 2239 (2004).
82. de Vries, S. H., Raaijmakers, R., Blijenberg, B. G. et al., Additional use of [-2] precursor
prostate-specific antigen and “benign” PSA at diagnosis in screen-detected prostate
cancer. Urology 65 (5), 926 (2005).
83. Auprich, M., Bjartell, A., Chun, F. K. et al., Contemporary role of prostate cancer
antigen 3 in the management of prostate cancer. Eur Urol 60 (5), 1045 (2011).
84. Rice, K. R., Chen, Y., Ali, A. et al., Evaluation of the ETS-related gene mRNA in urine
for the detection of prostate cancer. Clin Cancer Res 16 (5), 1572 (2010).
85. Salagierski, M. and Schalken, J. A., Molecular diagnosis of prostate cancer: PCA3 and
TMPRSS2:ERG gene fusion. J Urol 187 (3), 795 (2012).
86. Mikolajczyk, S. D. and Rittenhouse, H. G., Tumor-associated forms of prostate specific
antigen improve the discrimination of prostate cancer from benign disease. Rinsho
Byori 52 (3), 223 (2004).
Flip_Jansen.indd 164 30-7-2013 8:43:57
RefeRenCes 165
87. Paul, B., Dhir, R., Landsittel, D. et al., Detection of prostate cancer with a blood-based
assay for early prostate cancer antigen. Cancer Res 65 (10), 4097 (2005).
88. Reiter, R. E., Gu, Z., Watabe, T. et al., Prostate stem cell antigen: a cell surface marker
overexpressed in prostate cancer. Proc Natl Acad Sci U S A 95 (4), 1735 (1998).
89. Rubin, M. A., Zhou, M., Dhanasekaran, S. M. et al., alpha-Methylacyl coenzyme
A racemase as a tissue biomarker for prostate cancer. Jama 287 (13), 1662 (2002).
90. Stephan, C., Jung, K., Lein, M. et al., Molecular forms of prostate-specific antigen
and human kallikrein 2 as promising tools for early diagnosis of prostate cancer.
Cancer Epidemiol Biomarkers Prev 9 (11), 1133 (2000).
91. Ravery, V., The significance of recurrent PSA after radical prostatectomy: benign
versus malignant sources. Semin Urol Oncol 17 (3), 127 (1999).
92. Cookson, M. S., Aus, G., Burnett, A. L. et al., Variation in the definition of biochemical
recurrence in patients treated for localized prostate cancer: the American Urological
Association Prostate Guidelines for Localized Prostate Cancer Update Panel report
and recommendations for a standard in the reporting of surgical outcomes. J Urol
177 (2), 540 (2007).
93. Partin, A. W., Pearson, J. D., Landis, P. K. et al., Evaluation of serum prostate-specific
antigen velocity after radical prostatectomy to distinguish local recurrence from
distant metastases. Urology 43 (5), 649 (1994).
94. Pound, C. R., Partin, A. W., Epstein, J. I., and Walsh, P. C., Prostate-specific antigen
after anatomic radical retropubic prostatectomy. Patterns of recurrence and cancer
control. Urol Clin North Am 24 (2), 395 (1997).
95. Pound, C. R., Partin, A. W., Eisenberger, M. A. et al., Natural history of progression
after PSA elevation following radical prostatectomy. JAMA 281 (17), 1591 (1999).
96. Crook, J. M., Choan, E., Perry, G. A. et al., Serum prostate-specific antigen profile
following radiotherapy for prostate cancer: implications for patterns of failure and
definition of cure. Urology 51 (4), 566 (1998).
97. Critz, F. A., Levinson, A. K., Williams, W. H. et al., The PSA nadir that indicates
potential cure after radiotherapy for prostate cancer. Urology 49 (3), 322 (1997).
98. Hanlon, A. L., Diratzouian, H., and Hanks, G. E., Posttreatment prostate-specific
antigen nadir highly predictive of distant failure and death from prostate cancer.
Int J Radiat Oncol Biol Phys 53 (2), 297 (2002).
99. Ray, M. E., Thames, H. D., Levy, L. B. et al., PSA nadir predicts biochemical and
distant failures after external beam radiotherapy for prostate cancer: a multi-
institutional analysis. Int J Radiat Oncol Biol Phys 64 (4), 1140 (2006).
100. Roach, M., 3rd, Hanks, G., Thames, H., Jr. et al., Defining biochemical failure
following radiotherapy with or without hormonal therapy in men with clinically
localized prostate cancer: recommendations of the RTOG-ASTRO Phoenix Consensus
Conference. Int J Radiat Oncol Biol Phys 65 (4), 965 (2006).
Flip_Jansen.indd 165 30-7-2013 8:43:57
Discovery anD valiDation of prostate cancer biomarkers166
101. Satoh, T., Ishiyama, H., Matsumoto, K. et al., Prostate-specific antigen ‘bounce’ after
permanent 125I-implant brachytherapy in Japanese men: a multi-institutional pooled
analysis. BJU Int 103 (8), 1064 (2009).
102. Collette, L., Burzykowski, T., and Schroder, F. H., Prostate-specific antigen (PSA) alone
is not an appropriate surrogate marker of long-term therapeutic benefit in prostate
cancer trials. Eur J Cancer 42 (10), 1344 (2006).
103. Verbel, D. A., Heller, G., Kelly, W. K., and Scher, H. I., Quantifying the amount of
variation in survival explained by prostate-specific antigen. Clin Cancer Res 8 (8),
2576 (2002).
104. Olmos, D., Brewer, D., Clark, J. et al., Prognostic value of blood mRNA expression
signatures in castration-resistant prostate cancer: a prospective, two-stage study.
Lancet Oncol (2012).
105. Ross, R. W., Galsky, M. D., Scher, H. I. et al., A whole-blood RNA transcript-based
prognostic model in men with castration-resistant prostate cancer: a prospective
study. Lancet Oncol (2012).
106. Addona, T. A., Abbatiello, S. E., Schilling, B. et al., Multi-site assessment of the
precision and reproducibility of multiple reaction monitoring-based measurements of
proteins in plasma. Nat Biotechnol 27 (7), 633 (2009).
107. Hortin, G. L., Sviridov, D., and Anderson, N. L., High-abundance polypeptides of the
human plasma proteome comprising the top 4 logs of polypeptide abundance. Clin
Chem 54 (10), 1608 (2008).
108. Ransohoff, D. F., Lessons from controversy: ovarian cancer screening and serum
proteomics. J Natl Cancer Inst 97 (4), 315 (2005).
109. Kulasingam, V. and Diamandis, E. P., Strategies for discovering novel cancer
biomarkers through utilization of emerging technologies. Nat Clin Pract Oncol 5 (10),
588 (2008).
110. (CBS), Centraal Bureau voor de Statistiek, Gezondheid, leefsteil, gebruik van zorg,
Available at http://statline.cbs.nl/StatWeb/publication/?DM=SLNL&PA=03799&D1=2
91&D2=0-17&D3=0&D4=a&HDR=G2,T,G3&STB=G1&CHARTTYPE=1&VW=T, (2011).
111. Ishibashi, M., Standardization of prostate-specific antigen (PSA) assays: can
interchangeability of PSA measurements be improved? Clin Chem 52 (1), 1 (2006).
112. Patel, D., White, P. A., and Milford Ward, A., A comparison of six commercial assays
for total and free prostate specific antigen (PSA): the predictive value of the ratio of
free to total PSA. BJU Int 85 (6), 686 (2000).
113. Semjonow, A., Brandt, B., Oberpenning, F. et al., Discordance of assay methods creates
pitfalls for the interpretation of prostate-specific antigen values. Prostate Suppl 7, 3
(1996).
Flip_Jansen.indd 166 30-7-2013 8:43:57

RefeRenCes 167
114. Yurdakul, G., Bangma, C. H., Blijenberg, B. G. et al., Different PSA assays lead to
detection of prostate cancers with identical histological features. Eur Urol 42 (2), 154
(2002).
115. Zhou, A. M., Tewari, P. C., Bluestein, B. I. et al., Multiple forms of prostate-specific
antigen in serum: differences in immunorecognition by monoclonal and polyclonal
assays. Clin Chem 39 (12), 2483 (1993).
116. Rafferty, B., Rigsby, P., Rose, M. et al., Reference reagents for prostate-specific antigen
(PSA): establishment of the first international standards for free PSA and PSA (90:10).
Clin Chem 46 (9), 1310 (2000).
117. WHO, WHO Expert Committee on Biological Standardisation. WHO Report 1999
(1999).
118. Blijenberg, B. G., Yurdakul, G., Van Zelst, B. D. et al., Discordant performance of assays
for free and total prostate-specific antigen in relation to the early detection of prostate
cancer. BJU Int 88 (6), 545 (2001).
119. Kort, S. A., Martens, F., Vanpoucke, H. et al., Comparison of 6 automated assays for
total and free prostate-specific antigen with special reference to their reactivity
toward the WHO 96/670 reference preparation. Clin Chem 52 (8), 1568 (2006).
120. Stamey, T. A., Chen, Z., and Prestigiacomo, A. F., Reference material for PSA: the IFCC
standardization study. International Federation of Clinical Chemistry. Clin Biochem
31 (6), 475 (1998).
121. de Kok, J. B., Verhaegh, G. W., Roelofs, R. W. et al., DD3(PCA3), a very sensitive and
specific marker to detect prostate tumors. Cancer Res 62 (9), 2695 (2002).
122. Kumar-Sinha, C., Tomlins, S. A., and Chinnaiyan, A. M., Recurrent gene fusions in
prostate cancer. Nat Rev Cancer 8 (7), 497 (2008).
123. van Weerden, W. M., de Ridder, C. M., Verdaasdonk, C. L. et al., Development of
seven new human prostate tumor xenograft models and their histopathological
characterization. Am J Pathol 149 (3), 1055 (1996).
124. van den Bemd, G. J., Krijgsveld, J., Luider, T. M. et al., Mass spectrometric
identification of human prostate cancer-derived proteins in serum of xenograft-bearing
mice. Mol Cell Proteomics (2006).
125. Omenn, G. S., States, D. J., Adamski, M. et al., Overview of the HUPO Plasma
Proteome Project: results from the pilot phase with 35 collaborating laboratories and
multiple analytical groups, generating a core dataset of 3020 proteins and a publicly-
available database. Proteomics 5 (13), 3226 (2005).
126. Thery, C., Zitvogel, L., and Amigorena, S., Exosomes: composition, biogenesis and
function. Nat Rev Immunol 2 (8), 569 (2002).
127. Valenti, R., Huber, V., Iero, M. et al., Tumor-released microvesicles as vehicles of
immunosuppression. Cancer Res 67 (7), 2912 (2007).
Flip_Jansen.indd 167 30-7-2013 8:43:57
Discovery anD valiDation of prostate cancer biomarkers168
128. Valadi, H., Ekstrom, K., Bossios, A. et al., Exosome-mediated transfer of mRNAs and
microRNAs is a novel mechanism of genetic exchange between cells. Nat Cell Biol 9
(6), 654 (2007).
129. Marques, R. B., van Weerden, W. M., Erkens-Schulze, S. et al., The human PC346
xenograft and cell line panel: a model system for prostate cancer progression. Eur Urol
49 (2), 245 (2006).
130. Keller, A., Nesvizhskii, A. I., Kolker, E., and Aebersold, R., Empirical statistical model
to estimate the accuracy of peptide identifications made by MS/MS and database
search. Anal Chem 74 (20), 5383 (2002).
131. Nesvizhskii, A. I., Keller, A., Kolker, E., and Aebersold, R., A statistical model for
identifying proteins by tandem mass spectrometry. Anal Chem 75 (17), 4646 (2003).
132. Baumeister, W., Walz, J., Zuhl, F., and Seemuller, E., The proteasome: paradigm of a
self-compartmentalizing protease. Cell 92 (3), 367 (1998).
133. Elsasser, S., Schmidt, M., and Finley, D., Characterization of the proteasome using
native gel electrophoresis. Methods Enzymol 398, 353 (2005).
134. Dutaud, D., Aubry, L., Henry, L. et al., Development and evaluation of a sandwich
ELISA for quantification of the 20S proteasome in human plasma. J Immunol Methods
260 (1-2), 183 (2002).
135. Hegmans, J. P., Bard, M. P., Hemmes, A. et al., Proteomic analysis of exosomes
secreted by human mesothelioma cells. Am J Pathol 164 (5), 1807 (2004).
136. Mortz, E., Krogh, T. N., Vorum, H., and Gorg, A., Improved silver staining protocols
for high sensitivity protein identification using matrix-assisted laser desorption/
ionization-time of flight analysis. Proteomics 1 (11), 1359 (2001).
137. Claverol, S., Burlet-Schiltz, O., Girbal-Neuhauser, E. et al., Mapping and structural
dissection of human 20 S proteasome using proteomic approaches. Mol Cell Proteomics
1 (8), 567 (2002).
138. Hermans, K. G., van Marion, R., van Dekken, H. et al., TMPRSS2:ERG fusion by
translocation or interstitial deletion is highly relevant in androgen-dependent prostate
cancer, but is bypassed in late-stage androgen receptor-negative prostate cancer.
Cancer Res 66 (22), 10658 (2006).
139. Kumatori, A., Tanaka, K., Inamura, N. et al., Abnormally high expression of
proteasomes in human leukemic cells. Proc Natl Acad Sci U S A 87 (18), 7071 (1990).
140. Milano, A., Iaffaioli, R. V., and Caponigro, F., The proteasome: a worthwhile target for
the treatment of solid tumours? Eur J Cancer 43 (7), 1125 (2007).
141. Byrne, J. C., Downes, M. R., O’Donoghue, N. et al., 2D-DIGE as a strategy to identify
serum markers for the progression of prostate cancer. J Proteome Res 8 (2), 942 (2009).
142. Kanayama, H., Tanaka, K., Aki, M. et al., Changes in expressions of proteasome and
ubiquitin genes in human renal cancer cells. Cancer Res 51 (24), 6677 (1991).
Flip_Jansen.indd 168 30-7-2013 8:43:57

RefeRenCes 169
143. Voorhees, P. M., Dees, E. C., O’Neil, B., and Orlowski, R. Z., The proteasome as a target
for cancer therapy. Clin Cancer Res 9 (17), 6316 (2003).
144. Wada, M., Kosaka, M., Saito, S. et al., Serum concentration and localization in
tumor cells of proteasomes in patients with hematologic malignancy and their
pathophysiologic significance. J Lab Clin Med 121 (2), 215 (1993).
145. Ma, W., Kantarjian, H., O’Brien, S. et al., Enzymatic activity of circulating proteasomes
correlates with clinical behavior in patients with chronic lymphocytic leukemia.
Cancer (2008).
146. Zoeger, A., Blau, M., Egerer, K. et al., Circulating proteasomes are functional and have
a subtype pattern distinct from 20S proteasomes in major blood cells. Clin Chem 52
(11), 2079 (2006).
147. Almeida, C. G., Takahashi, R. H., and Gouras, G. K., Beta-amyloid accumulation
impairs multivesicular body sorting by inhibiting the ubiquitin-proteasome system.
J Neurosci 26 (16), 4277 (2006).
148. Dong, J., Chen, W., Welford, A., and Wandinger-Ness, A., The proteasome alpha-
subunit XAPC7 interacts specifically with Rab7 and late endosomes. J Biol Chem 279
(20), 21334 (2004).
149. Utleg, A. G., Yi, E. C., Xie, T. et al., Proteomic analysis of human prostasomes. Prostate
56 (2), 150 (2003).
150. Caby, M. P., Lankar, D., Vincendeau-Scherrer, C. et al., Exosomal-like vesicles are
present in human blood plasma. Int Immunol 17 (7), 879 (2005).
151. Stoeck, A., Keller, S., Riedle, S. et al., A role for exosomes in the constitutive and
stimulus-induced ectodomain cleavage of L1 and CD44. Biochem J 393 (Pt 3), 609
(2006).
152. Hao, S., Ye, Z., Li, F. et al., Epigenetic transfer of metastatic activity by uptake of highly
metastatic B16 melanoma cell-released exosomes. Exp Oncol 28 (2), 126 (2006).
153. Ginestra, A., La Placa, M. D., Saladino, F. et al., The amount and proteolytic content
of vesicles shed by human cancer cell lines correlates with their in vitro invasiveness.
Anticancer Res 18 (5A), 3433 (1998).
154. Hashida, H., Takabayashi, A., Tokuhara, T. et al., Clinical significance of
transmembrane 4 superfamily in colon cancer. Br J Cancer 89 (1), 158 (2003).
155. Kuefer, R., Day, K. C., Kleer, C. G. et al., ADAM15 disintegrin is associated with
aggressive prostate and breast cancer disease. Neoplasia 8 (4), 319 (2006).
156. Le, L., Chi, K., Tyldesley, S. et al., Identification of serum amyloid A as a biomarker to
distinguish prostate cancer patients with bone lesions. Clin Chem 51 (4), 695 (2005).
157. Malik, G., Ward, M. D., Gupta, S. K. et al., Serum levels of an isoform of apolipoprotein
A-II as a potential marker for prostate cancer. Clin Cancer Res 11 (3), 1073 (2005).
158. Villanueva, J., Shaffer, D. R., Philip, J. et al., Differential exoprotease activities confer
tumor-specific serum peptidome patterns. J Clin Invest 116 (1), 271 (2006).
Flip_Jansen.indd 169 30-7-2013 8:43:57

Discovery anD valiDation of prostate cancer biomarkers170
159. Lam, Y. W., Mobley, J. A., Evans, J. E. et al., Mass profiling-directed isolation and
identification of a stage-specific serologic protein biomarker of advanced prostate
cancer. Proteomics 5 (11), 2927 (2005).
160. Orazine, C. I., Hincapie, M., Hancock, W. S. et al., A proteomic analysis of the plasma
glycoproteins of a MCF-7 mouse xenograft: a model system for the detection of tumor
markers. J Proteome Res 7 (4), 1542 (2008).
161. Faca, V. M., Song, K. S., Wang, H. et al., A mouse to human search for plasma proteome
changes associated with pancreatic tumor development. PLoS Med 5 (6), e123 (2008).
162. Grant, A. G. and Duke, D., Production of antibodies against antigens released from
human pancreatic tumour xenografts. Br J Cancer 44 (3), 388 (1981).
163. Horoszewicz, J. S., Leong, S. S., Kawinski, E. et al., LNCaP model of human prostatic
carcinoma. Cancer Res 43 (4), 1809 (1983).
164. Schroder, F. H. and Bangma, C. H., The European Randomized Study of Screening for
Prostate Cancer (ERSPC). Br J Urol 79 Suppl 1, 68 (1997).
165. Lin, J. F., Xu, J., Tian, H. Y. et al., Identification of candidate prostate cancer
biomarkers in prostate needle biopsy specimens using proteomic analysis. Int J Cancer
121 (12), 2596 (2007).
166. Ben Aicha, S., Lessard, J., Pelletier, M. et al., Transcriptional profiling of genes that are
regulated by the endoplasmic reticulum-bound transcription factor AIbZIP/CREB3L4
in prostate cells. Physiol Genomics 31 (2), 295 (2007).
167. Ricote, M., Garcia-Tunon, I., Bethencourt, F. et al., The p38 transduction pathway in
prostatic neoplasia. J Pathol 208 (3), 401 (2006).
168. Cho-Vega, J. H., Tsavachidis, S., Do, K. A. et al., Dicarbonyl/L-xylulose reductase:
a potential biomarker identified by laser-capture microdissection-micro serial analysis
of gene expression of human prostate adenocarcinoma. Cancer Epidemiol Biomarkers
Prev 16 (12), 2615 (2007).
169. Mavis, C. K., Morey Kinney, S. R., Foster, B. A., and Karpf, A. R., Expression level and
DNA methylation status of glutathione-S-transferase genes in normal murine prostate
and TRAMP tumors. Prostate 69 (12), 1312 (2009).
170. Meyer-Siegler, K. L., Iczkowski, K. A., Leng, L. et al., Inhibition of macrophage
migration inhibitory factor or its receptor (CD74) attenuates growth and invasion of
DU-145 prostate cancer cells. J Immunol 177 (12), 8730 (2006).
171. Wu, Y. M., Robinson, D. R., and Kung, H. J., Signal pathways in up-regulation of
chemokines by tyrosine kinase MER/NYK in prostate cancer cells. Cancer Res 64 (20),
7311 (2004).
172. Stewart, J. R. and O’Brian, C. A., Protein kinase C-{alpha} mediates epidermal growth
factor receptor transactivation in human prostate cancer cells. Mol Cancer Ther 4 (5),
726 (2005).
Flip_Jansen.indd 170 30-7-2013 8:43:57
RefeRenCes 171
173. O’Kane, H. F., Watson, C. J., Johnston, S. R. et al., Targeting death receptors in bladder,
prostate and renal cancer. J Urol 175 (2), 432 (2006).
174. Kwon, E. M., Salinas, C. A., Kolb, S. et al., Genetic polymorphisms in inflammation
pathway genes and prostate cancer risk. Cancer Epidemiol Biomarkers Prev 20 (5), 923
(2011).
175. Matarasso, N., Bar-Shira, A., Rozovski, U. et al., Functional analysis of the Aurora
Kinase A Ile31 allelic variant in human prostate. Neoplasia 9 (9), 707 (2007).
176. Wang, J., Krill, D., Torbenson, M. et al., Expression of cadherins and catenins in paired
tumor and non-neoplastic primary prostate cultures and corresponding prostatectomy
specimens. Urol Res 28 (5), 308 (2000).
177. Aaltomaa, S., Lipponen, P., Viitanen, J. et al., Prognostic value of CD44 standard,
variant isoforms 3 and 6 and -catenin expression in local prostate cancer treated by
radical prostatectomy. Eur Urol 38 (5), 555 (2000).
178. Dong, J. T., Prevalent mutations in prostate cancer. J Cell Biochem 97 (3), 433 (2006).
179. Weichert, W., Schmidt, M., Gekeler, V. et al., Polo-like kinase 1 is overexpressed in
prostate cancer and linked to higher tumor grades. Prostate 60 (3), 240 (2004).
180. Wells, C. M., Whale, A. D., Parsons, M. et al., PAK4: a pluripotent kinase that regulates
prostate cancer cell adhesion. J Cell Sci 123 (Pt 10), 1663 (2010).
181. Untergasser, G., Gander, R., Lilg, C. et al., Profiling molecular targets of TGF-beta1 in
prostate fibroblast-to-myofibroblast transdifferentiation. Mech Ageing Dev 126 (1), 59
(2005).
182. Joshi, B. H., Leland, P., Calvo, A. et al., Human adrenomedullin up-regulates
interleukin-13 receptor alpha2 chain in prostate cancer in vitro and in vivo: a novel
approach to sensitize prostate cancer to anticancer therapy. Cancer Res 68 (22), 9311
(2008).
183. Wang, Y., Shao, C., Shi, C. H. et al., Change of the cell cycle after flutamide treatment
in prostate cancer cells and its molecular mechanism. Asian J Androl 7 (4), 375 (2005).
184. Bull, J. H., Ellison, G., Patel, A. et al., Identification of potential diagnostic markers
of prostate cancer and prostatic intraepithelial neoplasia using cDNA microarray.
Br J Cancer 84 (11), 1512 (2001).
185. Oudes, A. J., Roach, J. C., Walashek, L. S. et al., Application of Affymetrix array and
Massively Parallel Signature Sequencing for identification of genes involved in prostate
cancer progression. BMC Cancer 5, 86 (2005).
186. Lutchman, M., Pack, S., Kim, A. C. et al., Loss of heterozygosity on 8p in prostate
cancer implicates a role for dematin in tumor progression. Cancer Genet Cytogenet
115 (1), 65 (1999).
187. Kniazev Iu, P., Cheburkin Iu, V., Spikermann, K. et al., [Gene expression profiles of
protein kinases and phosphatases obtained by hybridization with cDNA arrays:
molecular portrait of human prostate carcinoma]. Mol Biol (Mosk) 37 (1), 97 (2003).
Flip_Jansen.indd 171 30-7-2013 8:43:57
Discovery anD valiDation of prostate cancer biomarkers172
188. Simak, R., Capodieci, P., Cohen, D. W. et al., Expression of c-kit and kit-ligand in
benign and malignant prostatic tissues. Histol Histopathol 15 (2), 365 (2000).
189. Di Lorenzo, G., Autorino, R., D’Armiento, F. P. et al., Expression of proto-oncogene c-kit
in high risk prostate cancer. Eur J Surg Oncol 30 (9), 987 (2004).
190. Tycko, B., Li, C. M., and Buttyan, R., The Wnt/beta-catenin pathway in Wilms tumors
and prostate cancers. Curr Mol Med 7 (5), 479 (2007).
191. Bartholow, T. L., Chandran, U. R., Becich, M. J., and Parwani, A. V.,
Immunohistochemical staining of radixin and moesin in prostatic adenocarcinoma.
BMC Clin Pathol 11, 1 (2011).
192. Adams, J., The proteasome: structure, function, and role in the cell. Cancer Treat Rev
29 Suppl 1, 3 (2003).
193. Danilova, N. P., Mertts, M. V., Sorokolit, T. P., and Vasilov, R. G., [Individual variation of
immune response to thyroid hormones in BALB/c mice]. Biull Eksp Biol Med 119 (1), 80
(1995).
194. McKean, D., Huppi, K., Bell, M. et al., Generation of antibody diversity in the immune
response of BALB/c mice to influenza virus hemagglutinin. Proc Natl Acad Sci U S A 81
(10), 3180 (1984).
195. Harper, R. G., Workman, S. R., Schuetzner, S. et al., Low-molecular-weight human
serum proteome using ultrafiltration, isoelectric focusing, and mass spectrometry.
Electrophoresis 25 (9), 1299 (2004).
196. Tirumalai, R. S., Chan, K. C., Prieto, D. A. et al., Characterization of the low molecular
weight human serum proteome. Mol Cell Proteomics 2 (10), 1096 (2003).
197. Jacob, A. N., Kalapurakal, J., Davidson, W. R. et al., A receptor tyrosine kinase, UFO/
Axl, and other genes isolated by a modified differential display PCR are overexpressed
in metastatic prostatic carcinoma cell line DU145. Cancer Detect Prev 23 (4), 325
(1999).
198. Mahajan, N. P., Whang, Y. E., Mohler, J. L., and Earp, H. S., Activated tyrosine kinase
Ack1 promotes prostate tumorigenesis: role of Ack1 in polyubiquitination of tumor
suppressor Wwox. Cancer Res 65 (22), 10514 (2005).
199. Sainaghi, P. P., Castello, L., Bergamasco, L. et al., Gas6 induces proliferation in
prostate carcinoma cell lines expressing the Axl receptor. J Cell Physiol 204 (1),
36 (2005).
200. Rhodes, D. R., Yu, J., Shanker, K. et al., ONCOMINE: a cancer microarray database and
integrated data-mining platform. Neoplasia 6 (1), 1 (2004).
201. Mikolajczyk, S. D., Millar, L. S., Marker, K. M. et al., Seminal plasma contains “BPSA,”
a molecular form of prostate-specific antigen that is associated with benign prostatic
hyperplasia. Prostate 45 (3), 271 (2000).
Flip_Jansen.indd 172 30-7-2013 8:43:57

RefeRenCes 173
202. Sokoll, L. J., Wang, Y., Feng, Z. et al., [-2]proenzyme prostate specific antigen for
prostate cancer detection: a national cancer institute early detection research network
validation study. J Urol 180 (2), 539 (2008).
203. Stephan, C., Kahrs, A. M., Cammann, H. et al., A [-2]proPSA-based artificial neural
network significantly improves differentiation between prostate cancer and benign
prostatic diseases. Prostate 69 (2), 198 (2009).
204. Stephan, C., Cammann, H., Deger, S. et al., Benign prostatic hyperplasia-associated
free prostate-specific antigen improves detection of prostate cancer in an artificial
neural network. Urology 74 (4), 873 (2009).
205. Schroder, F. H., Hugosson, J., Roobol, M. J. et al., Screening and prostate-cancer
mortality in a randomized European study. N Engl J Med 360 (13), 1320 (2009).
206. Berger, A. P., Deibl, M., Steiner, H. et al., Longitudinal PSA changes in men with and
without prostate cancer: assessment of prostate cancer risk. Prostate 64 (3), 240 (2005).
207. DeLong, E. R., DeLong, D. M., and Clarke-Pearson, D. L., Comparing the areas under
two or more correlated receiver operating characteristic curves: a nonparametric
approach. Biometrics 44 (3), 837 (1988).
208. Hugosson, J., Aus, G., Lilja, H. et al., Results of a randomized, population-based study
of biennial screening using serum prostate-specific antigen measurement to detect
prostate carcinoma. Cancer 100 (7), 1397 (2004).
209. Postma, R., Schroder, F. H., van Leenders, G. J. et al., Cancer detection and cancer
characteristics in the European Randomized Study of Screening for Prostate Cancer
(ERSPC)--Section Rotterdam. A comparison of two rounds of screening. Eur Urol 52 (1),
89 (2007).
210. van der Cruijsen-Koeter, I. W., Roobol, M. J., Wildhagen, M. F. et al., Tumor
characteristics and prognostic factors in two subsequent screening rounds with four-
year interval within prostate cancer screening trial, ERSPC Rotterdam. Urology 68 (3),
615 (2006).
211. Oberpenning, F., Weining, C., Brandt, B. et al., A new modification of the Chiron ACS
assay for total prostate-specific antigen achieves equimolar response characteristics
and improves the detection of prostate cancer. Clin Chem Lab Med 41 (1), 90 (2003).
212. Semjonow, A., Oberpenning, F., Weining, C. et al., Do modifications of nonequimolar
assays for total prostate-specific antigen improve detection of prostate cancer?
Clin Chem 47 (8), 1472 (2001).
213. D’Amico, A. V., Chen, M. H., Roehl, K. A., and Catalona, W. J., Preoperative PSA
velocity and the risk of death from prostate cancer after radical prostatectomy. N Engl
J Med 351 (2), 125 (2004).
214. D’Amico, A. V., Kantoff, P., Loffredo, M. et al., Predictors of mortality after prostate-
specific antigen failure. Int J Radiat Oncol Biol Phys 65 (3), 656 (2006).
Flip_Jansen.indd 173 30-7-2013 8:43:57
Discovery anD valiDation of prostate cancer biomarkers174
215. D’Amico, A. V., Renshaw, A. A., Sussman, B., and Chen, M. H., Pretreatment PSA
velocity and risk of death from prostate cancer following external beam radiation
therapy. Jama 294 (4), 440 (2005).
216. Link, R. E., Shariat, S. F., Nguyen, C. V. et al., Variation in prostate specific antigen
results from 2 different assay platforms: clinical impact on 2304 patients undergoing
prostate cancer screening. J Urol 171 (6 Pt 1), 2234 (2004).
217. Sengupta, S., Myers, R. P., Slezak, J. M. et al., Preoperative prostate specific antigen
doubling time and velocity are strong and independent predictors of outcomes
following radical prostatectomy. J Urol 174 (6), 2191 (2005).
218. Stephan, C., Klaas, M., Muller, C. et al., Interchangeability of measurements of
total and free prostate-specific antigen in serum with 5 frequently used assay
combinations: an update. Clin Chem 52 (1), 59 (2006).
219. Stephan, C. and Semjonow, A., Accuracy assessment of PSA methods must be based
on clinical instead of artificial samples--a response to AW Roddam et al., Ann Clin
Biochem 2006; 43: 35-48. Ann Clin Biochem 43 (Pt 5), 421 (2006).
220. Zelst, BD and Blijenberg, BG, PSA-comparability: standardization or harmonization?
Ned Tijdschr Klin Chem 27, 25 (2002).
221. Roddam, A. W., Rimmer, J., Nickerson, C., and Ward, A. M., Prostate-specific antigen:
bias and molarity of commercial assays for PSA in use in England. Ann Clin Biochem
43 (Pt 1), 35 (2006).
222. Catalona, W. J., Richie, J. P., Ahmann, F. R. et al., Comparison of digital rectal
examination and serum prostate specific antigen in the early detection of prostate
cancer: results of a multicenter clinical trial of 6,630 men. J Urol 151 (5), 1283 (1994).
223. Roobol, M. J., Kirkels, W. J., and Schroder, F. H., Features and preliminary results of the
Dutch centre of the ERSPC (Rotterdam, the Netherlands). BJU Int 92 Suppl 2, 48 (2003).
224. Roobol, M. J. and Schroder, F. H., European Randomized Study of Screening for
Prostate Cancer: achievements and presentation. BJU Int 92 Suppl 2, 117 (2003).
225. Rowlands, R. J., Griffiths, K., Kemp, K. W. et al., Application of Cusum techniques to
the routine monitoring of analytical performance in clinical laboratories. Stat Med 2
(2), 141 (1983).
226. Raaijmakers, R., Blijenberg, B. G., Finlay, J. A. et al., Prostate cancer detection in
the prostate specific antigen range of 2.0 to 3.9 ng/ml: value of percent free prostate
specific antigen on tumor detection and tumor aggressiveness. J Urol 171 (6 Pt 1),
2245 (2004).
227. Roobol, M. J., Kranse, R., de Koning, H. J., and Schroder, F. H., Prostate-specific
antigen velocity at low prostate-specific antigen levels as screening tool for prostate
cancer: results of second screening round of ERSPC (ROTTERDAM). Urology 63 (2),
309 (2004).
Flip_Jansen.indd 174 30-7-2013 8:43:57
RefeRenCes 175
228. Thompson, I. M., Ankerst, D. P., Chi, C. et al., Assessing prostate cancer risk: results
from the Prostate Cancer Prevention Trial. J Natl Cancer Inst 98 (8), 529 (2006).
229. Roddam, A. W., Price, C. P., Allen, N. E., and Ward, A. M., Assessing the clinical
impact of prostate-specific antigen assay variability and nonequimolarity: a
simulation study based on the population of the United Kingdom. Clin Chem 50 (6),
1012 (2004).
230. Sotelo, R. J., Mora, K. E., Perez, L. H. et al., Assay standardization bias: different
prostate cancer detection rates and clinical outcomes resulting from different assays
for free and total prostate-specific antigen. Urology 69 (6), 1143 (2007).
231. Draisma, G., Boer, R., Otto, S. J. et al., Lead times and overdetection due to prostate-
specific antigen screening: estimates from the European Randomized Study of
Screening for Prostate Cancer. J Natl Cancer Inst 95 (12), 868 (2003).
232. Schroder, F. H., Bangma, C. H., and Roobol, M. J., Is It Necessary to Detect All Prostate
Cancers in Men with Serum PSA Levels <3.0ng/ml? A Comparison of Biopsy Results of
PCPT and Outcome-Related Information from ERSPC. Eur Urol (2008).
233. Schroder, F. H., Carter, H. B., Wolters, T. et al., Early Detection of Prostate Cancer in
2007 Part 1: PSA and PSA Kinetics. Eur Urol 53 (3), 468 (2008).
234. Steyerberg, E. W., Roobol, M. J., Kattan, M. W. et al., Prediction of indolent prostate
cancer: validation and updating of a prognostic nomogram. J Urol 177 (1), 107 (2007).
235. Candas, B., Cusan, L., Gomez, J. L. et al., Evaluation of prostatic specific antigen
and digital rectal examination as screening tests for prostate cancer. Prostate 45 (1),
19 (2000).
236. Gosselaar, C., Roobol, M. J., Roemeling, S. et al., Screening for prostate cancer without
digital rectal examination and transrectal ultrasound: results after four years in the
European Randomized Study of Screening for Prostate Cancer (ERSPC), Rotterdam.
Prostate 66 (6), 625 (2006).
237. Gosselaar, C., Roobol, M. J., Roemeling, S. et al., Screening for prostate cancer at low
PSA range: the impact of digital rectal examination on tumor incidence and tumor
characteristics. Prostate 67 (2), 154 (2007).
238. Schroder, F. H., Roobol-Bouts, M., Vis, A. N. et al., Prostate-specific antigen-based
early detection of prostate cancer--validation of screening without rectal examination.
Urology 57 (1), 83 (2001).
239. Schroder, F. H., van der Maas, P., Beemsterboer, P. et al., Evaluation of the digital
rectal examination as a screening test for prostate cancer. Rotterdam section of the
European Randomized Study of Screening for Prostate Cancer. J Natl Cancer Inst 90
(23), 1817 (1998).
240. Diamandis, E. P., The failure of protein cancer biomarkers to reach the clinic: why, and
what can be done to address the problem? BMC Med 10, 87 (2012).
Flip_Jansen.indd 175 30-7-2013 8:43:57

Discovery anD valiDation of prostate cancer biomarkers176
241. de Martino, M., Hoetzenecker, K., Ankersmit, H. J. et al., Serum 20S proteasome is
elevated in patients with renal cell carcinoma and associated with poor prognosis.
Br J Cancer 106 (5), 904 (2012).
242. Hoffmann, O., Heubner, M., Anlasik, T. et al., Circulating 20S proteasome in patients
with non-metastasized breast cancer. Anticancer Res 31 (6), 2197 (2012).
243. O’Hurley, G., O’Grady, A., Smyth, P. et al., Evaluation of Zinc-alpha-2-Glycoprotein
and Proteasome Subunit beta-Type 6 Expression in Prostate Cancer Using Tissue
Microarray Technology. Appl Immunohistochem Mol Morphol (2010).
244. Romanuik, T. L., Ueda, T., Le, N. et al., Novel biomarkers for prostate cancer including
noncoding transcripts. Am J Pathol 175 (6), 2264 (2009).
245. Yamada, Y., Tomaru, U., Ishizu, A. et al., Expression of proteasome subunit beta5t in
thymic epithelial tumors. Am J Surg Pathol 35 (9), 1296 (2011).
246. Battke, C., Ruiss, R., Welsch, U. et al., Tumour exosomes inhibit binding of tumour-
reactive antibodies to tumour cells and reduce ADCC. Cancer Immunol Immunother
(2011).
247. Gyorgy, B., Szabo, T. G., Pasztoi, M. et al., Membrane vesicles, current state-of-the-art:
emerging role of extracellular vesicles. Cell Mol Life Sci 68 (16), 2667 (2011).
248. Lai, R. C., Tan, S. S., Teh, B. J. et al., Proteolytic Potential of the MSC Exosome
Proteome: Implications for an Exosome-Mediated Delivery of Therapeutic Proteasome.
Int J Proteomics 2012, 971907 (2012).
249. Nilsson, J., Skog, J., Nordstrand, A. et al., Prostate cancer-derived urine exosomes: a
novel approach to biomarkers for prostate cancer. Br J Cancer 100 (10), 1603 (2009).
250. Ekström, K; Valadi, H; Sjöstrand, M; Malmhäll, C; Bossios, A; Eldh, M; Lötvall, J,
Characterization of mRNA and microRNA in human mast cell-derived exosomes
and their transfer to other mast cells and blood CD34 progenitor cells. Journal of
Extracellular Vesicles 2012 1, http://dx.doi.org/10.3402/jev.v1i0.18389 (2012).
251. Skog, J., Wurdinger, T., van Rijn, S. et al., Glioblastoma microvesicles transport RNA
and proteins that promote tumour growth and provide diagnostic biomarkers. Nat Cell
Biol 10 (12), 1470 (2008).
252. Logozzi, M., De Milito, A., Lugini, L. et al., High levels of exosomes expressing CD63
and caveolin-1 in plasma of melanoma patients. PLoS One 4 (4), e5219 (2009).
253. Silva, J., Garcia, V., Rodriguez, M. et al., Analysis of exosome release and its
prognostic value in human colorectal cancer. Genes Chromosomes Cancer 51 (4), 409
(2012).
254. Zhou, H., Yuen, P. S., Pisitkun, T. et al., Collection, storage, preservation, and
normalization of human urinary exosomes for biomarker discovery. Kidney Int 69 (8),
1471 (2006).
255. Bryant, R. J., Pawlowski, T., Catto, J. W. et al., Changes in circulating microRNA levels
associated with prostate cancer. Br J Cancer 106 (4), 768 (2012).
Flip_Jansen.indd 176 30-7-2013 8:43:57
RefeRenCes 177
256. Khan, S., Jutzy, J. M., Valenzuela, M. M. et al., Plasma-derived exosomal survivin,
a plausible biomarker for early detection of prostate cancer. PLoS One 7 (10), e46737
(2012).
257. Kuslich, C; Pawlowski, T.L.; Deng, T; Tinder, T; Kim, J; Kimbrough, J; Spetzler, D;,
A sensitive exosome-based biosignature for the diagnosis of prostate cancer. Journal
of Clinical Oncology 28 (15s), 2010 (2010).
258. Mitchell, P. J., Welton, J., Staffurth, J. et al., Can urinary exosomes act as treatment
response markers in prostate cancer? J Transl Med 7, 4 (2009).
259. Somasundaram, R; Meenhard, H, Melanoma exosomes: messengers of metastasis.
Nature Medicine 18 (6), 853 (2012).
260. Linger, R. M., Cohen, R. A., Cummings, C. T. et al., Mer or Axl receptor tyrosine kinase
inhibition promotes apoptosis, blocks growth and enhances chemosensitivity of
human non-small cell lung cancer. Oncogene (2012).
261. Paccez, J. D., Vasques, G. J., Correa, R. G. et al., The receptor tyrosine kinase Axl is an
essential regulator of prostate cancer proliferation and tumor growth and represents a
new therapeutic target. Oncogene (2012).
262. Shapiro, G. I., McCallum, S., Adams, L. M. et al., A Phase 1 dose-escalation study of
the safety and pharmacokinetics of once-daily oral foretinib, a multi-kinase inhibitor,
in patients with solid tumors. Invest New Drugs (2012).
263. Bossuyt, P. M., Reitsma, J. B., Bruns, D. E. et al., The STARD statement for reporting
studies of diagnostic accuracy: explanation and elaboration. Clin Chem 49 (1), 7 (2003).
264. McShane, L. M., Altman, D. G., Sauerbrei, W. et al., REporting recommendations for
tumor MARKer prognostic studies (REMARK). Breast Cancer Res Treat 100 (2), 229
(2006).
265. Catalona, W. J., Partin, A. W., Sanda, M. G. et al., A multicenter study of [-2]pro-
prostate specific antigen combined with prostate specific antigen and free prostate
specific antigen for prostate cancer detection in the 2.0 to 10.0 ng/ml prostate specific
antigen range. J Urol 185 (5), 1650 (2011).
266. Guazzoni, G., Nava, L., Lazzeri, M. et al., Prostate-specific antigen (PSA) isoform
p2PSA significantly improves the prediction of prostate cancer at initial extended
prostate biopsies in patients with total PSA between 2.0 and 10 ng/ml: results of a
prospective study in a clinical setting. Eur Urol 60 (2), 214 (2011).
267. Lazzeri, M., Haese, A., de la Taille, A. et al., Serum isoform [-2]proPSA derivatives
significantly improve prediction of prostate cancer at initial biopsy in a total PSA
range of 2-10 ng/ml: a multicentric European study. Eur Urol 63 (6), 986 (2013).
268. Le, B. V., Griffin, C. R., Loeb, S. et al., [-2]Proenzyme prostate specific antigen is more
accurate than total and free prostate specific antigen in differentiating prostate cancer
from benign disease in a prospective prostate cancer screening study. J Urol 183 (4),
1355 (2010).
Flip_Jansen.indd 177 30-7-2013 8:43:57
Discovery anD valiDation of prostate cancer biomarkers178
269. Stephan, C., Vincendeau, S., Houlgatte, A. et al., Multicenter evaluation of [-2]
proprostate-specific antigen and the prostate health index for detecting prostate
cancer. Clin Chem 59 (1), 306 (2013).
270. Filella, X. and Gimenez, N., Evaluation of [-2] proPSA and Prostate Health Index
(phi) for the detection of prostate cancer: a systematic review and meta-analysis.
Clin Chem Lab Med 51 (4), 729 (2013).
271. Perdona, S., Bruzzese, D., Ferro, M. et al., Prostate health index (phi) and prostate
cancer antigen 3 (PCA3) significantly improve diagnostic accuracy in patients
undergoing prostate biopsy. Prostate 73 (3), 227 (2013).
272. Scattoni, V., Lazzeri, M., Lughezzani, G. et al., Head-to-Head Comparison of Prostate
Health Index and Urinary PCA3 for Predicting Cancer at Initial or Repeat Biopsy.
J Urol (2013).
273. Stephan, C., Jung, K., Semjonow, A. et al., Comparative assessment of urinary prostate
cancer antigen 3 and TMPRSS2:ERG gene fusion with the serum [-2]proprostate-
specific antigen-based prostate health index for detection of prostate cancer.
Clin Chem 59 (1), 280 (2013).
274. Nichol, M. B., Wu, J., An, J. J. et al., Budget impact analysis of a new prostate cancer
risk index for prostate cancer detection. Prostate Cancer Prostatic Dis 14 (3), 253 (2011).
275. Fillee, C., Tombal, B., and Philippe, M., Prostate cancer screening: clinical impact
of WHO calibration of Beckman Coulter Access prostate-specific antigen assays.
Clin Chem Lab Med 48 (2), 285 (2010).
Flip_Jansen.indd 178 30-7-2013 8:43:58
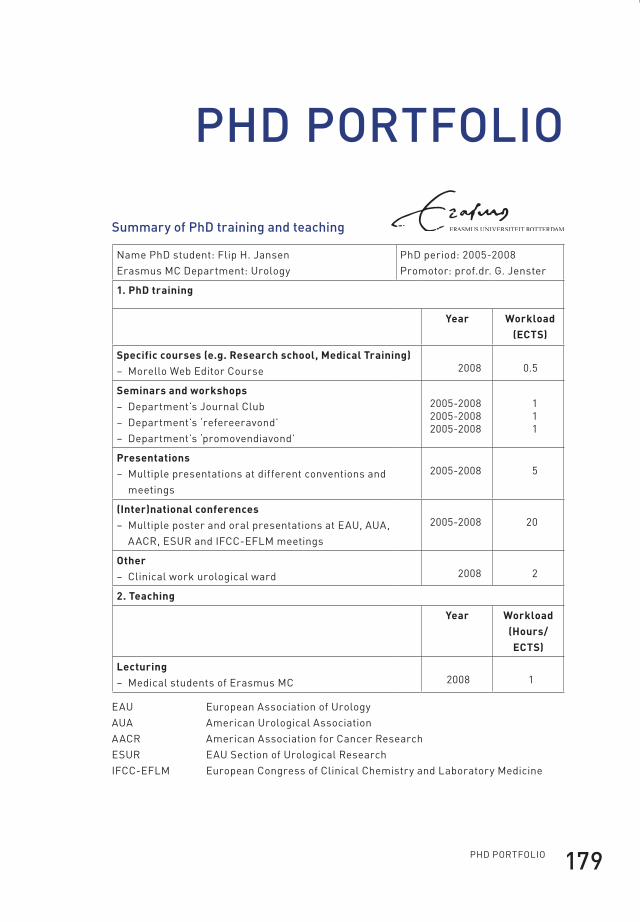
phD pORtfOliO 179
pHD portfolio
summary of phD training and teaching
name phD student: flip h. Jansenerasmus MC Department: Urology
phD period: 2005-2008promotor: prof.dr. G. Jenster
1. PhD training
year Workload(ects)
specific courses (e.g. research school, medical training)– Morello Web editor Course 2008 0.5
seminars and workshops– Department’s Journal Club– Department’s ‘refereeravond’– Department’s ‘promovendiavond’
2005-20082005-20082005-2008
111
Presentations– Multiple presentations at different conventions and
meetings
2005-2008 5
(inter)national conferences– Multiple poster and oral presentations at eAU, AUA,
AACR, esUR and ifCC-eflM meetings
2005-2008 20
other– Clinical work urological ward 2008 2
2. teaching
year Workload (Hours/ects)
lecturing– Medical students of erasmus MC 2008 1
eAU european Association of UrologyAUA American Urological AssociationAACR American Association for Cancer ResearchesUR eAU section of Urological ResearchifCC-eflM european Congress of Clinical Chemistry and laboratory Medicine
Flip_Jansen.indd 179 30-7-2013 8:43:58

Flip_Jansen.indd 180 30-7-2013 8:43:58
AbOUt the AUthOR 181
about tHe autHorFlip Jansen was born on February 17th 1980 in Gouda. He soon moved to Zeist
where he followed primary and secondary education. After graduating from the
gymnasium in 1998 he moved to Utrecht and started his medical education at Utrecht
University. During his surgical internship at St. Jansdal Hospital in Harderwijk he
became enthusiastic about the field of Urology. His interest in medical research
started during a research internship at the department of Haematology under the
supervision of dr. R. Fijnheer and professor Ph.G. de Groot. After his graduation in
June 2005 he started his PhD research on prostate cancer biomarkers at the Erasmus
MC under the guidance of professor Chris Bangma and professor Guido Jenster.
In 2008 he applied for the Urological traineeship and in January 2009 he started
his two-year residency in Surgery at the Diakonessen Hospital in Utrecht, under
supervision of dr. G.J. Clevers. He then performed the first part of his residency in
Urology at the Jeroen Bosch Hospital in ’s-Hertogenbosch under the supervision
of dr. H.P. Beerlage. From January 2013 he is following the last two years of his
residency at the University Medical Center in Utrecht under supervision of professor
J.L.H.R. Bosch.
Flip_Jansen.indd 181 30-7-2013 8:43:58

Flip_Jansen.indd 182 30-7-2013 8:43:58