Embed Size (px)
Citation preview
DISCOVERY OF DISCRIMINATIVE LC-MS AND 1H NMR METABOLOMICS MARKERS
A Thesis
Submitted to the Faculty
of
Drexel University
by
Geoffrey T. Gipson
in partial fulfillment of the
requirements for the degree
of
Doctor of Philosophy
February 2008


ii
ACKNOWLEDGMENTS
I would like to thank everyone who provided me with assistance and support throughout my PhD studies (that's a long list!).
Special thanks to my Drexel advisor, Bahrad Sokhansanj, and my supervisors and mentors at GlaxoSmithKline, Kay Tatsuoka and Susan Connor, for your willingness to work in unconventional ways. Your flexibility, creativeness, and scientific insight provided me with an exceptional environment in which to grow and continues to inspire me to achieve your level of excellence.
During the preparation of this work, I had the good fortune to work with many talented scientists from both Drexel University and GlaxoSmithKline. Thank you to Peter Lelkes, Tony Hu, and Andres Kreite for your time and helpful suggestions throughout the preparation of this work. Thanks also to Rachel Ball, Brian Sweatman, and Mark Hodson. I found our interactions both personally and professionally rewarding.
I would also like to thank my family and friends for their continuous support and encouragement.
Thank you to my wife, Adrianna, for everything.

iii
TABLE OF CONTENTS
LIST OF TABLES ..................................................................................................................................... vii
LIST OF FIGURES .................................................................................................................................. viii
ABSTRACT ...................................................................................................................................................x
CHAPTER 1: Introduction ..........................................................................................................................1
1.1 Motivation ......................................................................................................................................1
1.2 Nuclear Magnetic Resonance Spectroscopy................................................................................5
1.3 Mass Spectrometry........................................................................................................................8
1.4 Metabolic Study of Murine Diabetes .........................................................................................12
1.5 Cross-platform Metabolomic Analyses......................................................................................12
1.6 Approach......................................................................................................................................13
1.6.1 Nuclear Magnetic Resonance Spectroscopy .................................................................13
1.6.2 Mass Spectrometry .........................................................................................................15
1.6.3 Cross-platform Metabolic Study of Murine Diabetes .................................................16
CHAPTER 2: Weighted least-squares deconvolution method for discovery of group differences between complex biofluid 1H NMR spectra ..............................................................................................18
2.1 Summary ......................................................................................................................................18
2.2 Introduction .................................................................................................................................19
2.3 Experimental................................................................................................................................22
2.3.1 Spectral Decomposition and Metabolite Detection......................................................22
2.3.2 Constrained Least-Squares estimates ...........................................................................25
2.3.3 Simulations......................................................................................................................25
2.3.4 Spectral regions with a single metabolite resonance (clear spectral regions)............27
2.3.5 General simulation .........................................................................................................28
2.3.6 Diabetes Dataset..............................................................................................................29
2.4 Results ..........................................................................................................................................30
2.4.1 Spectral regions with a single metabolite resonance (clear spectral regions)............30
2.4.2 General simulation .........................................................................................................32

iv
2.4.3 Diabetes Dataset..............................................................................................................33
2.5 Discussion.....................................................................................................................................39
CHAPTER 3: Evaluation of NMR Deconvolution Algorithm for Individual Sample Estimates.........43
3.1 Summary ......................................................................................................................................43
3.2 Introduction .................................................................................................................................43
3.3 Methods ........................................................................................................................................44
3.4 Results/Discussion .......................................................................................................................45
CHAPTER 4: Assignment of MS-based metabolomics datasets via compound interaction pair mapping........................................................................................................................................................48
4.1 Summary ......................................................................................................................................48
4.2 Introduction .................................................................................................................................49
4.3 Materials and Methods ...............................................................................................................52
4.3.1 Experimental Data..........................................................................................................52
4.3.2 Instrumentation ..............................................................................................................52
4.3.3 KEGG Database .............................................................................................................53
4.3.4 Instrumental Clustering/Interaction Pair Identification.............................................55
4.3.5 Optimization Algorithm.................................................................................................57
4.4 Results and Discussion ................................................................................................................58
4.4.1 Instrumental Clustering.................................................................................................58
4.4.2 Interaction Pair Identification.......................................................................................62
4.4.3 Optimization Algorithm.................................................................................................63
4.5 Concluding Remarks...................................................................................................................72
4.6 Supplementary Material .............................................................................................................73
4.6.1 Diabetes Dataset..............................................................................................................73
4.6.2 UPLC -MS and -MS/MS ................................................................................................74
4.6.3 Peak Picking and Preprocessing....................................................................................75
4.6.4 Peak Assignment.............................................................................................................76
CHAPTER 5: Metabolomics of a Murine Model of Type 2 Diabetes.....................................................80

v
5.1 Summary ......................................................................................................................................80
5.2 Introduction .................................................................................................................................81
5.3 Methods ........................................................................................................................................83
5.3.1 Experimental Data..........................................................................................................83
5.3.2 NMR data........................................................................................................................83
5.3.3 LC-MS data.....................................................................................................................84
5.3.4 Microarray Data.............................................................................................................85
5.3.5 Statistical Analyses .........................................................................................................87
5.3.6 Enrichment Analysis ......................................................................................................87
5.4 Results ..........................................................................................................................................88
5.4.1 NMR/LC-MS Platform Comparison ............................................................................88
5.4.2 Validated LC-MS Peaks.................................................................................................95
5.4.3 Enrichment Analysis ......................................................................................................95
5.5 Discussion...................................................................................................................................100
5.6 Conclusions ................................................................................................................................109
CHAPTER 6: Summary & Conclusions .................................................................................................110
6.1 Summary ....................................................................................................................................110
6.2 Biological relevance of multi-platform metabolic markers ...................................................112
6.2.1 Fatty acid metabolism ..................................................................................................113
6.2.2 TCA cycle ......................................................................................................................114
6.2.3 Steroid metabolism.......................................................................................................114
6.2.4 Pathway connectivity....................................................................................................115
6.3 Conclusions ................................................................................................................................115
6.4 Future Directions.......................................................................................................................117
6.4.1 Estimation of NMR Metabolite Level Confidence Intervals.....................................117
6.4.2 Bayesian Formalization of MS-based Metabolomics Assignment............................118
6.4.3 Knowledgebase Development ......................................................................................119

vi
LIST OF REFERENCES .........................................................................................................................121
VITA...........................................................................................................................................................130

vii
LIST OF TABLES
Table 2.1. Confirmed Discriminative Markers of Diabetes and Prediction via CLS Methods. ..........34
Table 2.2. Discriminative Marker Prediction Performance ...................................................................36
Table 4.1. Assignments produced for the instrumental clusters associated with the 9 validation metabolites. ..................................................................................................................................................69
Table 4.2. Performance of the search algorithm using different weighting schemes. Metabolite-metabolite interaction pairs are scored by the sum of the weights of each type of interaction found. 70
Table 5.1. Enumeration of significant NMR bins and LC-MS peaks. Results from ANOVA with disease, age, and interaction term as independent variables. ..................................................................93
Table 5.2. Validated LC-MS peaks and results from ANOVA...............................................................96
Table 5.3. GO processes enriched with gene transcripts significantly altered by disease....................97
Table 5.4. KEGG pathways highlighted through sample type specific analyses. .................................99

viii
LIST OF FIGURES
Figure 1.1. NMR instrument from which data in these studies was collected.........................................3
Figure 1.2. LC-MS instrument from which data in these studies was collected. ....................................4
Figure 1.3. Complex biofluid NMR spectra. ..............................................................................................7
Figure 1.4. LC-MS data from global metabolic profiling of urine from mice of 2 different genotypes..........................................................................................................................................................................9
Figure 2.1. ROC curves comparing the performance of the nwCLS, mCLS, and vCLS methods and univariate analysis on Minit when at least one bin associated with the altered metabolite is uniquely occupied........................................................................................................................................................31
Figure 2.2. Binned spectra (blue), fitted vCLS intensities (red), and residual intensities (black) for a representative control (db/+) subject from the first time point...............................................................38
Figure 2.3. Diabetic (top) and control (bottom) spectral manually fit with reference spectra. Relative intensity values (y-axis) have been scaled to allow for comparisons between the two individuals. ......38
Figure 3.1. Cumulative fraction metabolites within absolute fold change (estimated/observed) in x-axis. ...............................................................................................................................................................46
Figure 3.2. Relationship between inverse bin variance and the number of metabolite resonances in a given spectral region (bin). .........................................................................................................................47
Figure 4.1. Reaction diagrams from KEGG (Kanehisa, et al., 2006). Primary reaction pairs are any two compounds in a common reaction (e.g. C00019 and C00388 in subgraph a). Primary enzyme pairs are any two compounds with a common enzyme (e.g. C00388 and C00141 in subgraphs b and c, respectively). Note that primary enzyme interactions often overlap with primary reactions (e.g. C00019 and C000388 are linked by both a primary reaction and an enzyme interaction in subgraph a). Secondary reaction pairs are two compounds which share a reaction with a common third compound (e.g. C00019 and C00024 linked by reactions with C00388 in subgraphs a and b, respectively). Secondary enzyme pairs are two compounds which share an enzyme with a common third compound (e.g. C00019 and C000141 linked by a shared enzyme with C00388, all subgraphs necessary to create link). Primary pathway pairs are any two compounds found in an individual KEGG pathway (e.g. C00141 and C00024 in the Valine, Leucine and Isoleucine Degradation pathway – see Figure 4.5)............................................................................................................................54
Figure 4.2. Plot of the temporal profile of peaks (from an individual subject) assigned to the instrumental cluster associated with PAGn. Peaks identified through visual inspection are labeled (m/z values)...................................................................................................................................................61
Figure 4.3. Connectivity plot of sub-network associated with Trimethylamine-N-oxide (cluster 9). left. Multiple assignments per cluster allow for maximal connectivity. middle. Random initialization with unique assignments does a poor job of explaining peak interactions. right. Assignment with cluster specific, top-ranked metabolites yields a highly connected sub-network...................................65
Figure 4.4. Lift curve comparison of validated peak assignment with unfiltered KEGG mass search (null), KEGG mass search following interaction intersection (filtered), ranked assignments through stochastic local search algorithm (alternative)..........................................................................................67
ix
Figure 4.5. KEGG Valine, Leucine and Isoleucine Degradation pathway chart (Kanehisa, et al., 2006). Any two metabolites found in this pathway (or other pathway) are designated as having a primary pathway biochemical interaction. ...............................................................................................77
Figure 4.6. Flow diagram representation of the stochastic local search network optimization algorithm. Initialization – All peak clusters are randomly attributed unique metabolite assignments, creating a network of assignments (nodes) and interactions (edges). Cluster optimization – each cluster is individually evaluated (random order) and the assignment that maximizes the network score is selected. An individual network optimization ends once each cluster has been evaluated 3 times. Network optimization is repeated 100 times. ................................................................................78
Figure 4.7. Average score (100 runs) +/- 2 standard deviations of interaction networks as the local search algorithm progresses. Arrows indicates the regions on the curve at which point all 521 clusters have been evaluated (random order). The algorithm was terminated after 3 post-initialization evaluations due to reduced improvements in score............................................................79
Figure 5.1. Fraction of NMR bins significant in both experiments, yet with opposite directional changes. ........................................................................................................................................................89
Figure 5.2. First principal components of the NMR and LC-MS datasets following standard normal transformation.............................................................................................................................................91
Figure 5.3. Mean centered, standard deviation normalized profile of hippurate stratified by disease status and age...............................................................................................................................................94
Figure 5.4. Putative KEGG assignments associated with an LC-MS peak interaction pair which fit biochemical interaction criteria. This peak pair was algorithmically identified as belonging to a common instrumental cluster. Follow-up analytical chemistry validated the cortisol assignment of the C21H30O5 peak and confirmed that the C21H28O5 peak was a fragment of cortisol. ...............102
Figure 5.5. NMR and LC-MS peaks of representative samples (2 closest to median value) associated with Carnitine at a.) 8 weeks of age and b.) 20 weeks of age. ................................................................106

x
ABSTRACT Discovery of Discriminative LC-MS and 1H NMR Metabolomics Markers
Geoffrey T. Gipson Bahrad A. Sokhansanj, Ph.D.
There is a growing trend to look for novel markers of altered phenotype that are
not associated with existing biological knowledge. This exploratory approach has led to
greater emphasis on generating and analyzing large amounts of data simultaneously.
Discovery of metabolic markers through analysis of non-targeted, high-throughput data is
a challenging, time-consuming process. Two of the most popular analytical techniques in
metabolic profiling are 1H Nuclear Magnetic Resonance (NMR) spectroscopy and Liquid
Chromatography (LC) -Mass Spectrometry (MS). There are many challenges associated
with the interpretation of these complex metabolomic datasets and automated methods
are critical for extracting biologically meaningful information from them.
This work describes the development and application of several novel approaches
for the analysis and interpretation of NMR and LC-MS data. A weighted, constrained
least-squares algorithm which uses a linear mixture of reference standard data to model
complex urine NMR spectra is discussed. This method was evaluated through
applications on simulated and experimental datasets. The evaluation of this method
suggests that the weighted least-squares approach is effective for identifying biochemical
discriminators of varying physiological states. Next, a method for clustering MS
instrumental artifacts and a stochastic local search algorithm for the automated
assignment of large, complex MS-based metabolomic datasets is presented. Instrumental
xi
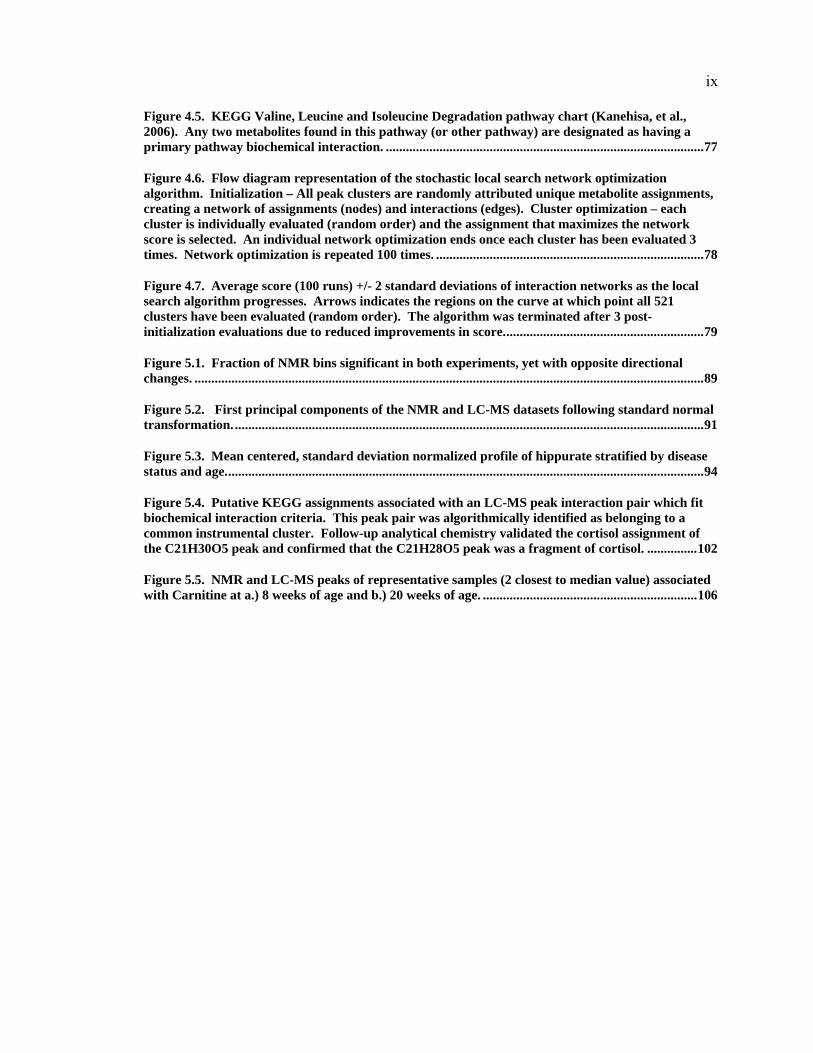
clusters, peaks grouped together by shared peak shape in the temporal domain, serve as a
guide for the number of assignments necessary to completely explain a given dataset.
Mass only assignments are then refined through the intersection of peak correlation pairs
with a database of biochemically relevant interaction pairs. Further refinement is
achieved through a stochastic local search optimization algorithm that selects individual
assignments for each instrumental cluster. The algorithm works by choosing the peak
assignment that maximally explains the connectivity of a given cluster. The findings
indicate that this methodology provides a significant advantage over standard methods
for the assignment of metabolites in an LC-MS dataset.
Finally, a multi-platform (NMR, LC-MS, microarray) investigation of metabolic
disturbances associated with the leptin receptor defective (db/db) mouse model of type 2
diabetes using the developed methodologies is described. Several urinary metabolites
were found to be associated with diabetes and/or diabetes progression and confirmed in
both NMR and LC-MS datasets. The confirmed metabolites were trimethylamine-n-
oxide (TMAO), creatine, carnitine, and phenylalanine. Additionally, many metabolic
markers were found by either NMR or LC-MS, but could not be found in both, due to
instrumental limitations. This indicates that the combined use of NMR and LC-MS
instrumentation provides complementary information that would be otherwise
unattainable. Pathway analyses of urinary metabolites and liver, muscle, and adipose
tissue transcripts from the db/db model were also performed. Metabolite and liver
transcript levels associated with the TCA cycle and steroid processes were altered in
db/db mice, as was gene expression in muscle and liver associated with fatty acid
processing. The findings implicate a number of processes known to be associated with

xii
diabetes and reveal tissue specific responses to the condition. When studying metabolic
disorders such as diabetes, platform integrated profiling of metabolite alterations in
biofluids can provide important insight into the processes underlying the disease.


1
CHAPTER 1: Introduction
1.1 Motivation
There is a growing trend to look for experimental effects (e.g. disease status, toxic
response, etc.) that are not pre-selected based on a hypothesis derived from knowledge of
the underlying disease state (Buetow et al., 2001; Chatterjee et al., 2006). In the pursuit
of this aim, more emphasis is placed on generating and interpreting large datasets of an
unspecified mix of chemical classes and biological origins, attempting to capture the
whole of the metabolome in only a few broadly-detecting analytical technologies.
Metabolomics has been described as the “comprehensive and quantitative analysis of all
metabolites” (Fiehn, 2001) and the comparison of many tissue- or biofluid- derived
biochemical variables between test and control subjects (Lindon et al., 2004).
Metabolomics data can be used in a number of ways, one of which is for the discovery of
biomarkers. This has the potential advantage of assisting in novel biomarker discovery
for disease areas that are not well characterized or understood.
Biomarkers are compounds (transcripts, proteins, metabolites, etc.) that indicate a
specific change in the physiological state of an organism. Biomarkers can be used to
indicate either the presence of a disease or the efficacy or toxicity of a drug (Lindon et
al., 2004; Witkamp, 2005). However, typically a marker is not immediately evaluated
across a sufficient number of conditions to establish the specificity requirement of a
biomarker. As such, the term discriminative marker will be used here to describe a
marker that is indicative of an experimental change, but not necessarily unique to this
particular group change. Discriminative markers are typically sought through
2
investigations utilizing high throughput methodologies such as transcriptomics,
proteomics, and metabolomics. Following biomarker discovery, independent
applications with more simple detection assays can be utilized (Witkamp, 2005). Since
metabolomics provides direct biochemical information, and potentially biomarkers that
can be easily tracked over time in human studies, it is likely that it will have a greater
impact on drug discovery than transcriptomics or proteomics (Lindon et al., 2004).
Metabolomics is an area of increasing scientific interest and promise. To date, the
most widely utilized data generation technologies for mammalian metabolomics
investigations have been either 1H nuclear magnetic resonance spectroscopy (NMR) or
mass-spectrometry (MS) -based (Dunn and Ellis, 2005). Due to the nature of
spectroscopic techniques, both of these platforms are associated with output signal
complexity and subsequent interpretation difficulties. As such, metabolomics
investigators and spectroscopists spend a great deal of time and effort extracting
meaningful information from such datasets (Robertson, 2005).
There are significant challenges associated with signal processing with new
methods needed to ensure that the metabolite information can be extracted from these
complex datasets free of experimental confounding factors. Substantial informatics
method development is also needed to extract biologically meaningful information from
these complex datasets for statistical evaluation, interpretation of confounding factors,
and chemical identification.

3
Figure 1.1. NMR instrument from which data in these studies was collected.

4
Figure 1.2. LC-MS instrument from which data in these studies was collected.

5
1.2 Nuclear Magnetic Resonance Spectroscopy
NMR is an important “omics” platform because of its ability to readily and
reproducibly assay accessible samples from blood, urine, other fluids, or tissue extracts
and it is relatively inexpensive (Griffin and Bollard, 2004). This makes it an amenable
platform to identify and validate key discriminative markers of disease, drug efficacy,
toxicity, or other physiological parameters (e.g. gender, age, metabolic status).
Commonly, NMR datasets are analyzed by applying univariate and multivariate
statistical approaches to discrete spectral regions in an attempt to identify regions that are
altered by a perturbation (e.g. a group difference arising from genetic modification or
xenobiotic treatment). Following identification of regions of interest, metabolites with
resonances associated with these regions are investigated more closely via manual visual
inspection of spectra and additional analytical assays. The chemical shift position and
intensity of all NMR resonances for a particular metabolite, which could be termed its
‘NMR signature,’ are essential for definitive metabolite identification. Based on the
NMR signature, a metabolite assignment can often be confirmed unambiguously by
comparison with database information, using standard one and two dimensional NMR
experiments. However, this process can be very time consuming to do manually, even
for known, well characterized entities. Additionally, peak overlap can make this
straightforward NMR identification impossible for some metabolites without partial or
complete purification prior to NMR. This is particularly the case for some sugars that
contain no clear anomeric proton signal, overlapping fatty acid signals, and certain amino
acids.
6
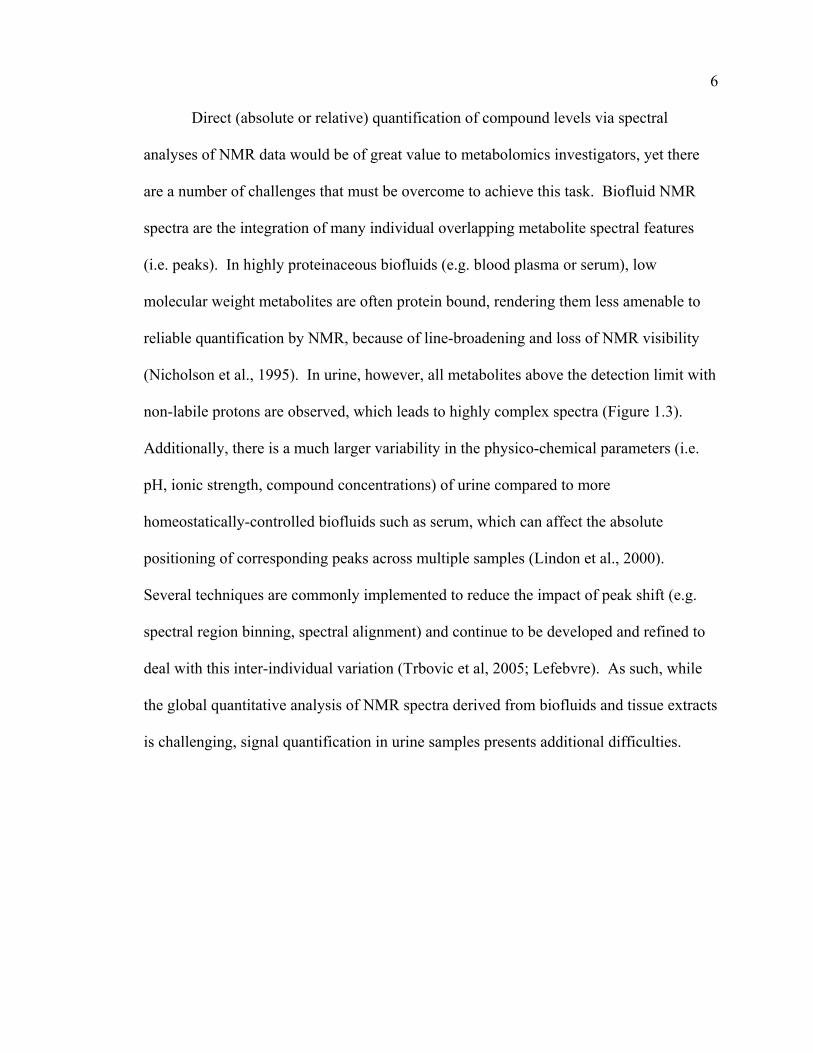
Direct (absolute or relative) quantification of compound levels via spectral
analyses of NMR data would be of great value to metabolomics investigators, yet there
are a number of challenges that must be overcome to achieve this task. Biofluid NMR
spectra are the integration of many individual overlapping metabolite spectral features
(i.e. peaks). In highly proteinaceous biofluids (e.g. blood plasma or serum), low
molecular weight metabolites are often protein bound, rendering them less amenable to
reliable quantification by NMR, because of line-broadening and loss of NMR visibility
(Nicholson et al., 1995). In urine, however, all metabolites above the detection limit with
non-labile protons are observed, which leads to highly complex spectra (Figure 1.3).
Additionally, there is a much larger variability in the physico-chemical parameters (i.e.
pH, ionic strength, compound concentrations) of urine compared to more
homeostatically-controlled biofluids such as serum, which can affect the absolute
positioning of corresponding peaks across multiple samples (Lindon et al., 2000).
Several techniques are commonly implemented to reduce the impact of peak shift (e.g.
spectral region binning, spectral alignment) and continue to be developed and refined to
deal with this inter-individual variation (Trbovic et al, 2005; Lefebvre). As such, while
the global quantitative analysis of NMR spectra derived from biofluids and tissue extracts
is challenging, signal quantification in urine samples presents additional difficulties.

7
Figure 1.3. Complex biofluid NMR spectra.
8
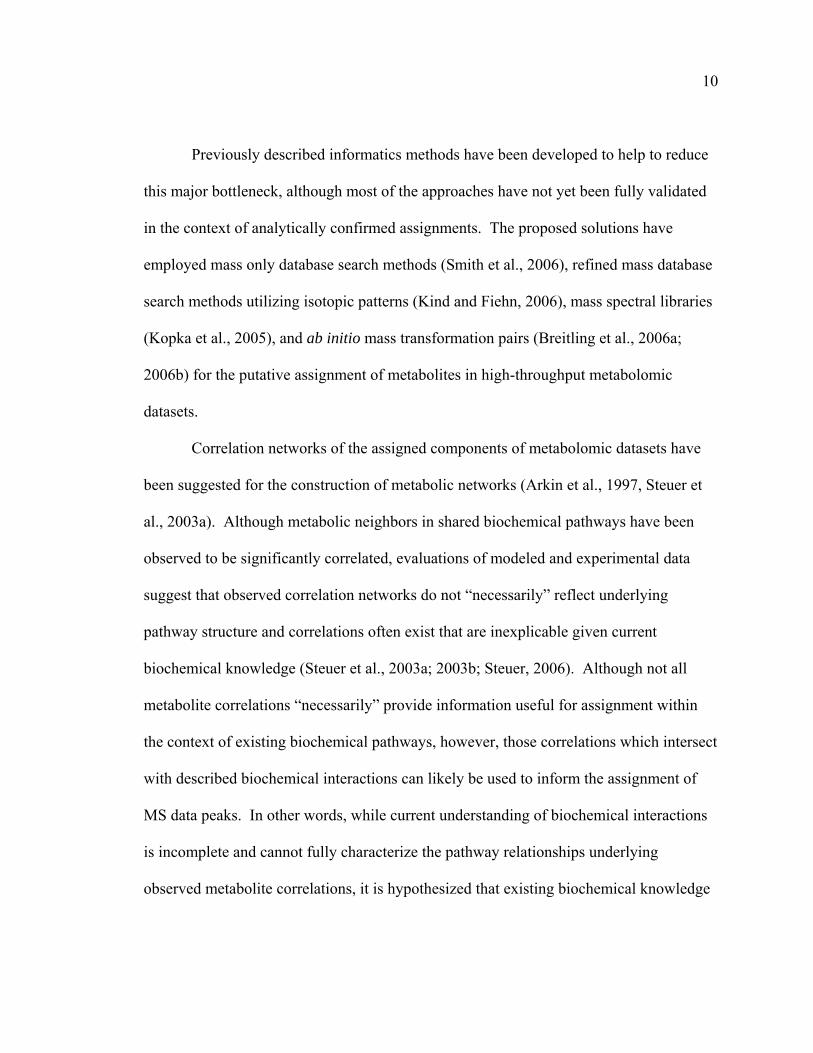
1.3 Mass Spectrometry
MS methods are useful data platforms for metabolomics investigators (Want et
al., 2005) and can be used for either targeted or non-targeted analyses (Halket et al.,
2005). A particular challenge of metabolite profiling, whether using MS or nuclear
magnetic resonance (NMR), is assignment of spectral peaks of interest (Kell, 2004).
Targeted MS analyses, in which a small number of predefined analytes of related
chemical class are examined, are commonly used as a more accurate follow-up on
putative metabolites proposed by a high-throughput method (e.g. NMR, non-targeted LC-
MS). Non-targeted MS analyses are global investigations of compounds found within an
analytical sample (Figure 1.4).

9
Figure 1.4. LC-MS data from global metabolic profiling of urine from mice of 2 different genotypes.
10
Previously described informatics methods have been developed to help to reduce
this major bottleneck, although most of the approaches have not yet been fully validated
in the context of analytically confirmed assignments. The proposed solutions have
employed mass only database search methods (Smith et al., 2006), refined mass database
search methods utilizing isotopic patterns (Kind and Fiehn, 2006), mass spectral libraries
(Kopka et al., 2005), and ab initio mass transformation pairs (Breitling et al., 2006a;
2006b) for the putative assignment of metabolites in high-throughput metabolomic
datasets.
Correlation networks of the assigned components of metabolomic datasets have
been suggested for the construction of metabolic networks (Arkin et al., 1997, Steuer et
al., 2003a). Although metabolic neighbors in shared biochemical pathways have been
observed to be significantly correlated, evaluations of modeled and experimental data
suggest that observed correlation networks do not “necessarily” reflect underlying
pathway structure and correlations often exist that are inexplicable given current
biochemical knowledge (Steuer et al., 2003a; 2003b; Steuer, 2006). Although not all
metabolite correlations “necessarily” provide information useful for assignment within
the context of existing biochemical pathways, however, those correlations which intersect
with described biochemical interactions can likely be used to inform the assignment of
MS data peaks. In other words, while current understanding of biochemical interactions
is incomplete and cannot fully characterize the pathway relationships underlying
observed metabolite correlations, it is hypothesized that existing biochemical knowledge

11
provides useful information for the assignment of unknown compounds in large
metabolomic datasets.
In a recently described method for ab initio metabolic network prediction,
investigators present a method for assignment of putative metabolite transformation pairs
using ultra high mass accuracy MS methods coupled with mass searches focused on
metabolic transformations (Breitling et al., 2006a). The method identifies a series of
putative ion reaction pairs by mapping peak mass differences to biochemical
transformation reactions. According to the authors, one of the benefits of this analysis is
that their network links are directly associated with known chemical reactions, exceeding
the level of descriptive connectivity of metabolite correlation networks. Here, a method
is presented that provides explicit biological meaning to observed data relationships
which can provide insight into the assignment of features in MS-based datasets. The
method is intended to be a useful assignment tool, even for lower mass accuracy
instruments that are in common use. However, improving the mass accuracy will likely
improve obtained results.
A recent review of MS-based metabolomics describes the current usage of
biochemical databases as a means to infer biological function of previously identified
metabolites (Dettmer et al., 2007). Applications utilizing existing biochemical pathways
include visualization (Mendes, 2002) and metabolic flux analysis (Forster et al., 2002).
However, a global, systematic intersection of metabolite correlation pairs with a database
of biochemical interaction pairs has not yet been described.

12
1.4 Metabolic Study of Murine Diabetes
In both the United States and worldwide, the prevalence of diabetes is increasing.
In 2003, there were approximately 194 million affected adults (5.1% global population),
and by 2025, it is projected that the incidence of diabetes will reach 333 million adults
(6.3% global population). Type 2 diabetes accounts for approximately 90% of all
diabetes cases and is projected to be the primary cause of the increasing incidence rate
(International Diabetes Federation, 2005).
Of all the animal models available for the investigation of type 2 diabetes, rodent
models have been the most popular due to short generation time, heritable traits, and cost.
The most studied spontaneously diabetic mouse model is the db/db mouse, which, due to
an autosomal recessive defect in the leptin receptor gene, displays several phenotypic
traits associated with type 2 diabetes (Chen and Wang, 2005) including drastically altered
metabolic processes. The widespread metabolic changes associated with diabetes make
metabolic profiling a particularly important contribution to the discussion of disease
progression and prevention.
1.5 Cross-platform Metabolomic Analyses
The use of NMR and LC-MS methods in conjunction for metabolomics studies is
relatively new, though some examples can be found in the literature (Lenz et al., 2004a;
2004b; Williams et al., 2005a; Crockford et al., 2006). Methods proposed for the co-
analysis of multiple types of spectroscopic metabolomics data include statistical
heterospectroscopy (Crockford et al., 2006) and data fusion (Smilde et al., 2005). Data
fusion can and has been applied in many areas of scientific inquiry due to the generic

13
nature of the data integration. Recently, it has been used in another field of high
throughput biology, genomics (Lanckriet et al., 2004).
The integrated analysis of metabolomics data from multiple data platforms is an
active area of research (Smilde et al. 2005; Crockford et al. 2005). Data fusion attempts
to integrate multiple datasets, each with a different “view”, into a comprehensive
description of the test subject. Such integrated analyses are not unique to metabolomics,
and have been applied in many scientific fields, including genomics (Lanckriet et al.
2004). Data fusion can be implemented at many different levels of inquiry. At some
point, the fusion always consists of combining features from the various platforms into an
individual feature vector. The data integration can be performed: early in the analysis
process, meaning that all measured variables from an individual are fused prior to any
data processing; late in the process, following high level feature selection on the
individual platforms; or anytime in between. In the study of the leptin defective murine
model of diabetes described here, comparisons are made at the level of data features with
confirmed metabolite assignments.
1.6 Approach
1.6.1 Nuclear Magnetic Resonance Spectroscopy
A number of attempts have been made to decompose NMR spectra into individual
components (e.g. independent component analysis, molecular factor analysis) without
any prior knowledge of the underlying data structure (Ladroue et al., 2003; Eads et al.,
2004; Scholz et al., 2004; Stoyanova et al., 2004a). The primary disadvantage of these
methods continues to be the difficulty in interpreting the results within a biochemical

14
context. In other words, since there is no underlying metabolite data structure built into
these methods, the components rarely match known metabolite profiles.
Several fitting methods utilizing combinations of empirically derived or modeled
reference spectra exist (Provencher, 1993; Crockford et al., 2005; Chenomx, Inc.). A
previous study examining a longitudinal NMR dataset suggested the use of weighted
principal components analysis (PCA) to provide an alternative view of the data versus
unweighted PCA (Jansen et al., 2004). However, differentially weighting spectral
regions in the process of deconvolving NMR spectra into individual metabolite levels has
not previously been described.
Here, a weighted, constrained least-squares algorithm is used for the estimation
and comparison of relative metabolite levels (referenced to control values of the same
metabolite) across groups of divergent physiological states. The aim of this work is to
demonstrate that deconvolving complex spectra with the incorporation of a non-uniform
weighting scheme, will lead to the identification of metabolites of biological interest that
would be missed otherwise. In order to efficiently deconvolve the spectra into individual
component spectra, it is often necessary to account for heterogeneous interference. In
other words, the signal of certain metabolites of interest may be deeply buried in certain
spectral regions, but easily distinguished in others. Additionally, incorporating statistical
information about the signal of interest into the deconvolution algorithm can be useful.
Previous methods of linear deconvolution (i.e. LCModel) place equal weight on all
spectral regions when fitting additive models (Provencher, 1993; 2001). The novelty of
this approach for deconvolving complex NMR spectra lies in the application of a
weighted, constrained least-squares method for identifying metabolites that may be

15
discriminative markers of biological effect based on the relative quantitative estimate in
context of scaled, control intensities.
1.6.2 Mass Spectrometry
Here, a method is presented that selects likely metabolite candidates and increases
confidence in metabolite assignment. Specifically, the method will identify metabolites
in an ultra performance liquid chromatography (UPLC)-MS dataset by mapping peak
interaction pairs (significantly correlated peak pairs) onto interaction pairs from the
Kyoto Encyclopedia of Genes and Genomes (KEGG) (Kanehisa et al., 2006) using mass
matching. Anticipated benefits of this methodology include robustness to varying
instrumental mass accuracy and immediate placement of annotated metabolites into an
explicit biological context.
An additional challenge of MS-based metabolomics assignment is the
differentiation between mass differences associated with in vivo transformation and those
which are artifacts of MS instrumentation. To address this, artifactual peaks (e.g.
fragments, oligomers) should be identified to avoid assigning biological meaning to
highly correlated peak pairs which are measurements of the same metabolite. To avoid
annotation of instrumental artifacts, peaks appearing to share the same compound source
are grouped into “instrumental clusters.” This has previously been performed manually
through visual inspection of data peaks. In this study, instrumental clustering was
automated and integrated into the assignment algorithm.
A previous study (Breitling et al., 2006a) attempted to minimize the assignment of
instrumental artifacts using a refined, a priori set of biochemically meaningful mass
differences. Here, peaks with shared temporal peak shapes are clustered in order to
16
distinguish between instrumental and biological peak relationships. To this end, and to
aid the development of the automated assignment tool, both (i) an artificial biofluid
matrix consisting of metabolite standards, and (ii) urine from diabetic and healthy mice
were evaluated. These findings were validated by analytical confirmation of the
metabolite identity.
1.6.3 Cross-platform Metabolic Study of Murine Diabetes
1H nuclear magnetic resonance (NMR) spectroscopy and mass spectrometry-
(MS) based technologies are the most commonly used for mammalian metabolomics
(Dunn and Ellis, 2005). Both approaches allow for the simultaneous measurement of a
large number of individual metabolites, allowing investigators to identify and validate
key discriminative markers of disease, drug efficacy, toxicity, or other physiological
parameters. Consistency and reproducibility are considered a distinct advantage for the
use of NMR in metabolic profiling studies (Keun et al., 2002). MS-based methods are
also important data platforms and have the specific advantage of a lower detection limit
(Want et al., 2005). However, MS data are not as reproducible as NMR due to a non-
linear detector response and ionization. A recent review of metabolic profiling
techniques (Wilson et al., 2005) discussed several comparison studies of MS-based and
NMR metabolomics and highlighted the “complementary nature” of the two
technologies, concluding that both techniques should be used in conjunction whenever
reasonable.
The goal of this study was to provide biological insight into metabolic alterations
associated with diabetes and diabetic progression. A number of metabolic profiling
studies of diabetes have been conducted evaluating rodent models (Williams et al., 2006),

17
humans (van Doorn et al., 2006), and cross-species comparisons (Salek et al., 2007). In
contrast to these studies, an evaluation of cross -experimental and -platform results for
consistency within the context of the biological analysis were performed in this study.
To accomplish this, standard and novel methodologies (Gipson et al., 2006; 2008) were
applied to extract information of biological importance from NMR and LC-MS profiles
of urine from db/db and control (db/+) mice. These metabolite data, collected over two
independent experiments, are put into context with a gene expression dataset that was
collected during one of the experimental periods. Additionally, technical issues
concerning the use of NMR and LC-MS data in metabolomics investigations are
discussed.

18
CHAPTER 2: Weighted least-squares deconvolution method for discovery of group differences between complex biofluid 1H NMR spectra
2.1 Summary
This chapter discusses a novel approach for estimating metabolite levels from 1H NMR
metabolomics data and has been modified from an article published in the Journal of
Magnetic Resonance (Gipson et al., 2006) with permission from Elsevier. This work was
done in collaboration with Dr. Kay Tatsuoka, Dr. Brian Sweatman, and Dr. Susan
Connor. The majority of the introductory material from this chapter is also located in
Chapter 1, but has been reproduced here to provide the information in the original
context. Biomarker discovery through analysis of high-throughput NMR data is a
challenging, time-consuming process due to the requirement of sophisticated, dataset
specific pre-processing techniques and the inherent complexity of the data. Here, the use
of weighted, constrained least-squares for fitting a linear mixture of reference standard
data to complex urine NMR spectra as an automated way of utilizing current assignment
knowledge and the ability to deconvolve confounded spectral regions is described.
Following the least-squares fit, univariate statistics were used to identify metabolites
associated with group differences. This method was evaluated through applications on
simulated datasets and a murine diabetes dataset. Furthermore, the differential ability of
various weighting metrics to correctly identify discriminative markers is explored. The
study findings suggest that the weighted least-squares approach is effective for
identifying biochemical discriminators of varying physiological states. Additionally, the
superiority of specific weighting metrics is demonstrated in particular datasets. An

19
additional strength of this methodology is the ability for individual investigators to couple
this analysis with laboratory specific pre-processing techniques.
2.2 Introduction
Metabolomics is an area of increasing scientific interest and promise. To date, the
most widely utilized data generation technologies for mammalian metabolomics
investigations have been either 1H NMR- (NMR) or MS-based (Dunn and Ellis, 2005).
NMR is an important “omics” platform because of its ability to readily and reproducibly
assay accessible samples from blood, urine, other fluids, or tissue extracts. This makes it
an amenable platform to identify and validate key discriminative markers of disease, drug
efficacy, toxicity, or other physiological parameters (e.g. gender, age, metabolic status).
Commonly, NMR datasets are analyzed by applying univariate and multivariate
statistical approaches to discrete spectral regions in an attempt to identify regions that are
altered by a perturbation (e.g. a group difference arising from genetic modification or
xenobiotic treatment). Following identification of regions of interest, metabolites with
resonances associated with these regions are investigated more closely via manual visual
inspection of spectra and additional analytical assays. The chemical shift position and
intensity of all NMR resonances for a particular metabolite, which could be termed its
‘NMR signature,’ are essential for definitive metabolite identification. Based on the
NMR signature, a metabolite assignment can often be confirmed unambiguously by
comparison with database information, using standard one and two dimensional NMR
experiments. However, this process can be very time consuming to do manually, even
for known, well characterized entities. Additionally, peak overlap can make this
straightforward NMR identification impossible for some metabolites without partial or
20
complete purification prior to NMR analysis. This is particularly the case for some
sugars that contain no clear anomeric proton signal, overlapping fatty acid signals, and
amino acids.
Direct (absolute or relative) quantification of compound levels via spectral
analysis of NMR data would be of great value to metabolomics investigators, yet there
are a number of challenges that must be overcome to achieve this task. Biofluid NMR
spectra are the integration of many individual overlapping metabolite spectral features
(i.e. peaks). In highly proteinaceous biofluids (e.g. blood plasma or serum), low
molecular weight metabolites are often protein bound, rendering them less amenable to
reliable quantification by NMR, because of line-broadening and loss of NMR visibility
(Nicholson et al., 1995). In urine, however, all metabolites above the detection limit with
non-labile protons are observed, which leads to highly complex spectra. Additionally,
there is a much larger variability in the physico-chemical parameters (i.e. pH, ionic
strength, compound concentrations) of urine compared to more homeostatically-
controlled biofluids such as serum, which can affect the absolute positioning of
corresponding peaks across multiple samples (Lindon et al., 2000). Several techniques
are commonly implemented to reduce the impact of peak shift (e.g. spectral region
binning, spectral alignment) and continue to be developed and refined to deal with this
inter-individual variation (Trbovic et al, 2005; Lefebvre). As such, while the global
quantitative analysis of NMR spectra derived from biofluids and tissue extracts is
challenging, signal quantification in urine samples presents additional difficulties.
A number of attempts have been made to decompose NMR spectra into individual
components (e.g. independent component analysis, molecular factor analysis) without
21
any prior knowledge of the underlying data structure (Ladroue et al., 2003; Eads et al.,
2004; Scholz et al., 2004; Stoyanova et al., 2004a). The primary disadvantage of these
methods continues to be the difficulty in interpreting the results within a biochemical
context. In other words, since there is no underlying metabolite data structure built into
these methods, the components rarely match known metabolite profiles.
Several fitting methods utilizing combinations of empirically derived or modeled
reference spectra exist (Provencher, 1993; Crockford et al., 2005; Chenomx, Inc.). A
previous study examining a longitudinal NMR dataset suggested the use of weighted
principal components analysis (PCA) to provide an alternative view of the data versus
unweighted PCA (Jansen et al., 2004). However, differentially weighting spectral
regions in the process of deconvolving NMR spectra into individual metabolite levels has
not previously been described.
Here, the use of a weighted, constrained least-squares algorithm for the estimation
and comparison of relative metabolite levels (referenced to control values of the same
metabolite) across groups of divergent physiological states is proposed. The aim is to
demonstrate that deconvolving complex spectra with the incorporation of a non-uniform
weighting scheme, will lead to the identification of metabolites of biological interest that
would be missed otherwise. In order to efficiently deconvolve the spectra into individual
component spectra, it is often necessary to account for heterogeneous interference. In
other words, the signal of certain metabolites of interest may be deeply buried in certain
spectral regions, but easily distinguished in others. Additionally, incorporating statistical
information about the signal of interest into the deconvolution algorithm can be useful.
Previous methods of linear deconvolution (i.e. LCModel) place equal weight on all

22
spectral regions when fitting additive models (Provencher, 1993; 2001). The novelty of
the approach discussed here for deconvolving complex NMR spectra lies in the
application of a weighted, constrained least-squares method for identifying metabolites
that may be discriminative markers of biological effect based on the relative quantitative
estimate in context of scaled, control intensities.
2.3 Experimental
2.3.1 Spectral Decomposition and Metabolite Detection
The digitization of NMR spectral data is the fine-scale discretization of a
continuous phenomenon. Often, investigators find it useful to analyze NMR data at a
coarser resolution due to inter-individual peak alignment issues. The process of
integrating a spectral region into larger discrete representations is commonly referred to
as bucketing or binning. Here, all discrete spectral representations will be referred to as
“bins.” However, it should be noted that the algorithm described here can be applied to
discrete spectral data of any resolution, including raw digitized spectra.
An NMR spectrum is the summation of the intensities of multiple, individual
metabolite spectra. Though it is unreasonable to assume that an investigator will have a
complete (i.e. all compounds present in a given biofluid) set of reference standards, all
available, characterized metabolites should be incorporated into the analysis. Eq. [2.1]
expresses the relationship between the observed intensity at bin l of subject j (djl), the
unknown intensity of metabolite k of subject j (mjk), and the relative intensity of known
metabolite k in bin l (ikl).

23
(Eq. 2.1)
Since many metabolites are simultaneously detected during a single NMR data
acquisition, and the intensity level of individual bins may be a result of contributions
from several metabolites, the identification and quantification of individual metabolites
measured via NMR is a challenging task. In order to attribute the NMR spectra to
individual metabolites, a linear model (Eq. [2.2]) was used to describe the system and
allow for the decomposition of the NMR signal into a series of metabolite signals. An
important inherent property of NMR that makes this a reasonable approach is the linear
relationship between concentration and signal intensity and hence the additivity of
spectral intensities.
D = MI (Eq. 2.2)
Eq. [2] represents the linear relationship between the matrix of intensity vectors
across all individuals (D), the matrix of metabolite intensities across all individuals (M),
and the matrix of bin-specific relative intensities across all metabolites (I). Since actual
metabolite levels can only have non-negative values, it makes sense to solve this linear
system subject to the constraint that all elements in matrix M are greater than or equal to
zero. In order to solve the linear system subject to the inequality constraints, the
Penalized Constrained Least Squares Fitting (pcls) function within the mgcv library

24
(version 1.3-1) of R (Wood, 1994; 2000; 2004; R Development Core Team) is used. The
pcls algorithm finds the minimum sum of squares, subject to the non-negativity criteria
(Eq. [2.3]) through quadratic programming. Although this function has the capability of
fitting non-linear, penalized regression splines, it is used here to calculate the weighted,
constrained linear fit. As such, the use of penalties is unnecessary. The pcls function is
executed iteratively to estimate the M matrix piecewise (Mcalc) by minimizing a function
of the weighting vector (w), individual metabolite vectors (mj), and individual data
vectors (dj), for each individual in the dataset.
min || w (mjI –dj) ||2 subject to mjI > 0v
(Eq. 2.3)
The pcls method requires that the I matrix be of full column rank. Prior to
implementing the pcls function, the rank of the I matrix is verified via QR decomposition,
and all rank deficiencies are eliminated. Since the I matrix is strictly non-negative, the
estimated metabolite intensity levels are constrained from taking negative values. Mcalc
contains information regarding the relative quantities of the characterized metabolites
across the individuals in the dataset.
In addition to providing inter-metabolite relative quantities for an individual, Mcalc
can also provide insight into metabolite production between individuals or groups of
individuals. For example, the fold change of an individual metabolite k between two
groups or the correlation between two metabolites can be calculated using the estimated
metabolite levels.

25
2.3.2 Constrained Least-Squares estimates
Although there are an enormous number of possible weighting vectors to utilize in
the least-squares analysis, the focus here is placed on two non-uniform vectors and a
uniform weighting vector. In order to demonstrate the utility of “clear” spectral regions,
an examination of a relatively low intensity metabolite, found in areas of both high and
low interference and altered between two groups, will be instructive. Incorporation of
information regarding the relative interference of the different spectral regions was
achieved through using the inverse of the number of observed metabolites in a given
spectral region as the weighting vector. Constrained least-squares (CLS) will be used to
estimate the underlying metabolite intensity levels both with the inverse metabolite count
weighting vector (mCLS) and with a uniform, or non-weighted, vector (nwCLS).
Additionally, a weighting vector was used that incorporated the binwise group
variance to extract the underlying metabolites of interest (vCLS). More specifically, the
weight of each bin was calculated as the inverse of the square-root of the product of the
variances (1/ 21σσ ) of the bin intensities of the 2 groups of interest. The mCLS and
vCLS weighting factors were implemented with the specific aim of algorithmically
placing more emphasis on fitting bins that were less confounded and more consistent
across biological replicates, respectively.
2.3.3 Simulations
The generated datasets were simulated in such a way as to closely approximate
real NMR spectra, integrated to create sequential bins of width 0.02 ppm. A typical
range of NMR data spans about 10 ppm, which reduces to 500 bins, 60% of which are
assumed to contain metabolite peaks. Additionally, though there are thousands of
26
metabolites that could potentially be measured in biofluids, it is likely that much fewer
make up the vast majority of the NMR signal. Here, the data is simulated so that the
majority of the signal is produced by no more than 300 metabolites and any other
metabolites are at or below the limits of NMR detection. While it is likely that these
assumptions fairly represent a real dataset, the actual number of metabolites making up
an NMR signal will be dependent on the sensitivity of the instrumentation being used
(e.g. cryo versus non-cryo probe, field strength).
All simulations consisted of 300 metabolites (150 of which were randomly
assigned as known, i.e. contained information in the intensity matrix), 300 spectral bins,
and 10 subjects (5 from each group). An intensity matrix (I matrix) was randomly
generated for all 300 metabolites (300 metabolites x 300 bins) with relative intensity
values (U[0,1]) for an average of approximately 5 bins per metabolite (drawn from the
empirical distribution of the reference standard assignment database) and distributed
amongst the bins with probability according to a function of the geometric distribution
(G[p = 0.2] +1), yielding an average of approximately 5 metabolites per bin. The data
matrix (D) was then calculated as the matrix product of the simulated underlying
metabolite intensity level matrix (Minit) and the relative intensity matrix (I), followed by
the addition of a baseline (shared across individuals) and simulated instrumental
variability (specific to individuals), with intensity values ranging from 0% to 40% and
0% to 10% of the mean metabolite intensity level, respectively. Biological variation was
simulated via sampling individual metabolite levels from a normal distribution when
generating Minit. Once the D matrix was generated (10 individuals x 300 bins), 150 of the

27
metabolites were randomly withheld from the I matrix in order to simulate the reality of
incomplete metabolite information in metabolomics studies.
2.3.4 Spectral regions with a single metabolite resonance (clear spectral regions)
Non-weighted linear deconvolution methods may miss biologically important
compounds when there is a high level of interference in spectral regions and the
compound of interest is present in relatively low quantities. To demonstrate this point, an
NMR metabolomics dataset was simulated in which the concentrations of an individual
metabolite, with peaks in areas of both high and low interference, were significantly
different between two groups of subjects (10 individuals per group). Minit (20 individuals
x 300 metabolites) for this investigation contains 1 metabolite that is altered in one of the
two groups and 299 that have no group difference. The unaltered metabolite intensity
levels were sampled from normal distributions with means ranging from 1 to 10
(U[1,10]) and standard deviations equal to half the mean intensity value. Altered group
intensity levels were sampled from normal distributions with means deviating by a
random factor (U[1.2,5]) from their baseline counterparts and the same standard
deviations. The direction of change of altered group intensity levels could be either
positive or negative. Since this method of metabolite level simulation does not strictly
preclude the generation of negative values, and negative metabolite levels have no
biological meaning in this context, all generated negative values were replaced by zeros.
The I matrix was generated as described previously, with the exception that the
number of randomly populated bins was restricted to 299. Following the random
generation of the 299 bin I matrix, an additional bin was added in which only the
significant metabolite was present.

28
Univariate statistics (α = 0.05) were performed on the metabolite intensity levels
estimated via nwCLS, mCLS and vCLS, and Minit values for the significantly altered
metabolite. Following classification of metabolites as having group differences or not, a
receiver operating characteristics (ROC) analysis was performed to compare the
sensitivity-specificity profiles of the various weighting methods. The area under the
curve (AUC) of the ROC curves was calculated via Somers’ rank correlation. Pairwise
comparisons (Bonferroni adjusted, paired t-test) were made on 200 simulations to
determine if the various methods differed in their ability to successfully identify the
simulated metabolite level difference.
2.3.5 General simulation
In order to evaluate the relative sensitivity/specificity, and to identify any
discriminating features of the metabolites identified by different weighting factors, a
number of simulations were performed and concurrently analyzed with and without
weighting factors. In this investigation 5% (15 of 300) of the initial metabolites in Minit
(20 individuals x 300 metabolites) were generated to have group specific differences in
intensity level.
The metabolites intensity levels were generated in the same way as in the clear
spectral region analysis. Since 50% of the metabolite profiles were removed from the I
matrix prior to analysis, on average 7-8 metabolites with simulated alterations were
available for discovery. Through the use of the CLS methods coupled with univariate
statistics, true and false positives were identified. These simulations were replicated 200
times and the sensitivity and specificity of the CLS methods were then compared both to

29
each other as well as univariate statistics on Minit, which represents the maximum
possible information content.
2.3.6 Diabetes Dataset
A large dataset of Carr-Purcell-Meiboom-Gill (CPMG) NMR spectra from urine
samples across diabetic (db/db) and non-diabetic (db/+) mice was analyzed via CLS
methods. Male diabetic and control mice (8 weeks of age) were obtained from The
Jackson Laboratory (Bar Harbor, ME). Urine samples of 0.5% methylcellulose treated
animals were collected over ice twice, one week apart, from mice individually housed in
metabolism cages. In urine samples, where there may be a wide range of ‘normal’
sample ionic strengths and pHs, it may be expected that differences in shift and shape
may also occur for resonances experiencing second order coupling (e.g. lysine,
ornithine). This issue was addressed through the use of buffered samples, including an
excess of phosphate buffer. NMR spectral processing consisted of automated adjustment
of the chemical shift of TSP to δH= 0 ppm, application of a semi-automated phase
correction, automated baseline adjustment using an automated 0-2nd order polynomial
and reduction to histogram representations by binning using the method by Forshed et al.
(2002). A bin width of 0.02 ppm was chosen with a 50% tolerance either side of the bin
boundary. Data were scaled using median-difference scaling of the binned data. Further
details concerning the experimental protocol and discriminative marker validation can be
found in Connor et al. (in preparation).
The nwCLS and vCLS methods were each used to deconvolve the NMR spectra
into constituent compound intensity levels and followed by univariate statistical analyses.
Putative discriminative markers for disease were identified through a series of Student’s

30
t-tests (α = 0.05) comparing diseased and control mice. Specifically, a metabolite was
considered a putative discriminative marker if an estimated metabolite level was
significant in at least 1 of the 2 days of data. Putative discriminative markers were
proposed based on uncorrected and Bonferroni corrected p-values in order to verify that
differences between the CLS methods ability to accurately identify discriminative
markers were robust to varying thresholds of discriminative marker inclusion. The
results of the CLS method analyses were then compared to results from a previous study
in which univariate and multivariate binwise analyses were utilized to identify spectral
regions of interest, with subsequent metabolite assignment and independent validation via
partial fractionation, LC-MS, 2D NMR, and addition of standard to confirm peak
identity. Direct comparisons were made between the validated discriminative marker
assignments from the traditional analysis and the putative discriminative markers
suggested via CLS methods.
2.4 Results
2.4.1 Spectral regions with a single metabolite resonance (clear spectral regions)
In order to evaluate the different linear deconvolution methods, 200 simulations
were performed in which one metabolite was altered and clear regions were strictly
provided for the significantly altered metabolites. The average ROC AUC for nwCLS,
mCLS, vCLS, and univariate analysis of Minit were 0.92, 0.95, 0.97, and 0.97,
respectively (Figure 2.1). Note that univariate analysis of Minit yielded an AUC that was
less than 1.0 due to the simulated biological variability. Pairwise paired t-tests
(Bonferroni corrected) were performed on the AUC estimates of each of the CLS
methods and univariate statistics on Minit. The results of these analyses indicate that all

31
pairwise differences except for vCLS vs. Minit were significant (nwCLS vs. mCLS,
p<0.05; all other pairs, p<0.005). The non-significant difference between the vCLS
method and univariate statistics on the true underlying metabolite levels indicates that the
variance weighting factor has achieved maximal performance in this scenario.
Figure 2.1. ROC curves comparing the performance of the nwCLS, mCLS, and vCLS methods and univariate analysis on Minit when at least one bin associated with the altered metabolite is uniquely occupied.

32
2.4.2 General simulation
In order to further evaluate the capacities of the linear deconvolution methods,
200 simulations were performed in which 5% of the total number of metabolites were
altered and clear regions were not strictly provided for the significantly altered
metabolites. The average AUC for nwCLS, mCLS, vCLS, and univariate analysis of
Minit were 0.74, 0.75, 0.80, and 0.97, respectively. Pairwise paired t-tests (Bonferroni
corrected) were performed on the AUC estimates of each of the CLS methods and
univariate statistics on Minit. The results of these analyses indicate that all pairwise
differences were highly significant (p<0.005), with the exception of nwCLS versus
mCLS. These results indicate that each of the CLS methods performed well in accurately
discovering group differences, however, the variance weighting factor performed best.
It is not surprising that the significant difference observed in the clear spectral
region analysis between nwCLS and mCLS was not also observed in the general
simulation analysis. The mCLS method is highly dependent on the quality of the
reference spectra (i.e. I matrix). Real spectral libraries produced by laboratories are
likely to have prior experience implicitly incorporated through the inclusion of
“expected” metabolites. In the general simulation, the random nature of the metabolite
spectral properties (peak location, intensity, coincidence with other metabolites) and the
random population of the I matrix leads to a situation in which any concept of prior
experience is not modeled. The advantage of the mCLS method in the clear spectral
region simulation was that significantly altered metabolites were exclusively associated
with a minimum of 1 clear bin (maximum weight), thereby providing the least-squares fit
with a priori information concerning the quality of clear bins. In other words, the prior

33
probability distribution that significant metabolites are associated with clear bins is not
uninformed. However, the prior distribution of the general simulation is uninformed, and
therefore the specific advantage of the mCLS method is lost. Through evaluating the
variance of the bins, the vCLS method captures information concerning the clarity of the
individual bins, yet is independent of specific prior knowledge. Although the two
weights are similar in that spectral regions with fewer observed metabolites have lower
variance, vCLS has the added value of giving additional weight to regions with fewer
observed and unobserved metabolites. For this reason, and the superior performance of
vCLS compared to mCLS in both simulation analyses, the vCLS method was chosen for
the analysis of the diabetes dataset.
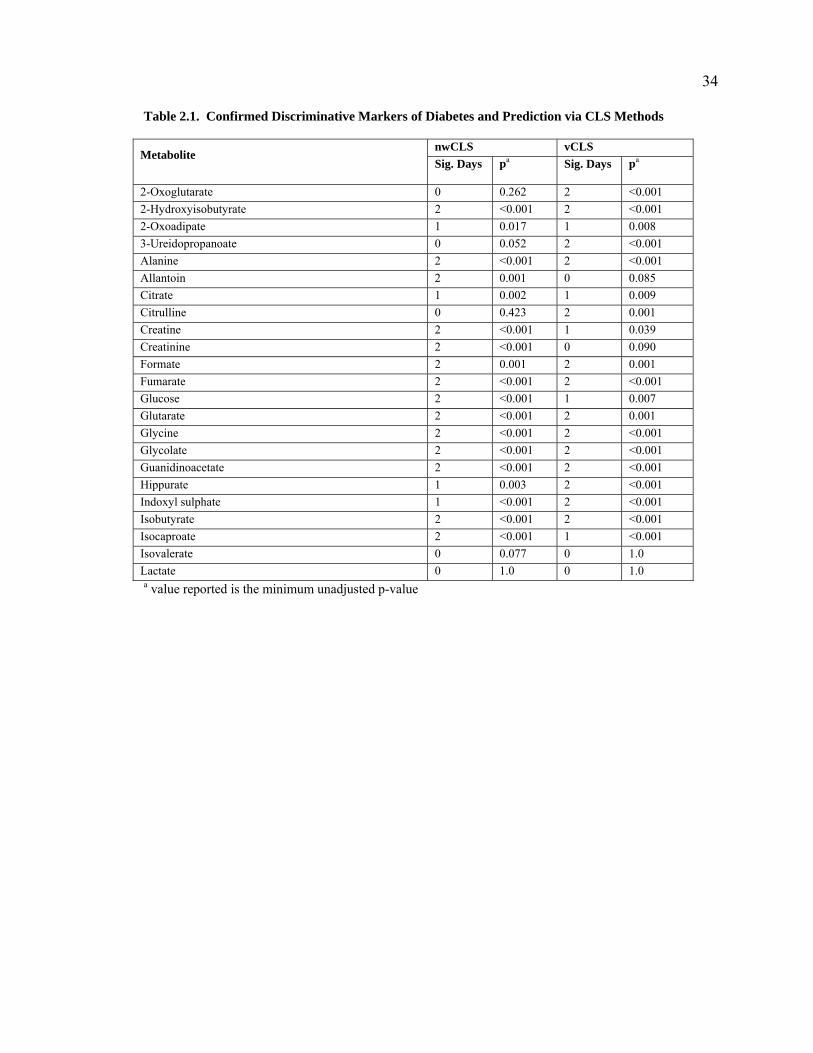
2.4.3 Diabetes Dataset
An investigation of the ability of the nwCLS and vCLS methods to identify the 46
previously identified and independently validated (LC-MS, 2D-NMR, etc.)
discriminative markers [Connor et al. (in preparation)] further demonstrates the utility of
using weighting factors when deconvolving metabolomics datasets. Analysis of the
diabetes dataset with nwCLS and vCLS followed by univariate statistics (α = 0.05, p-
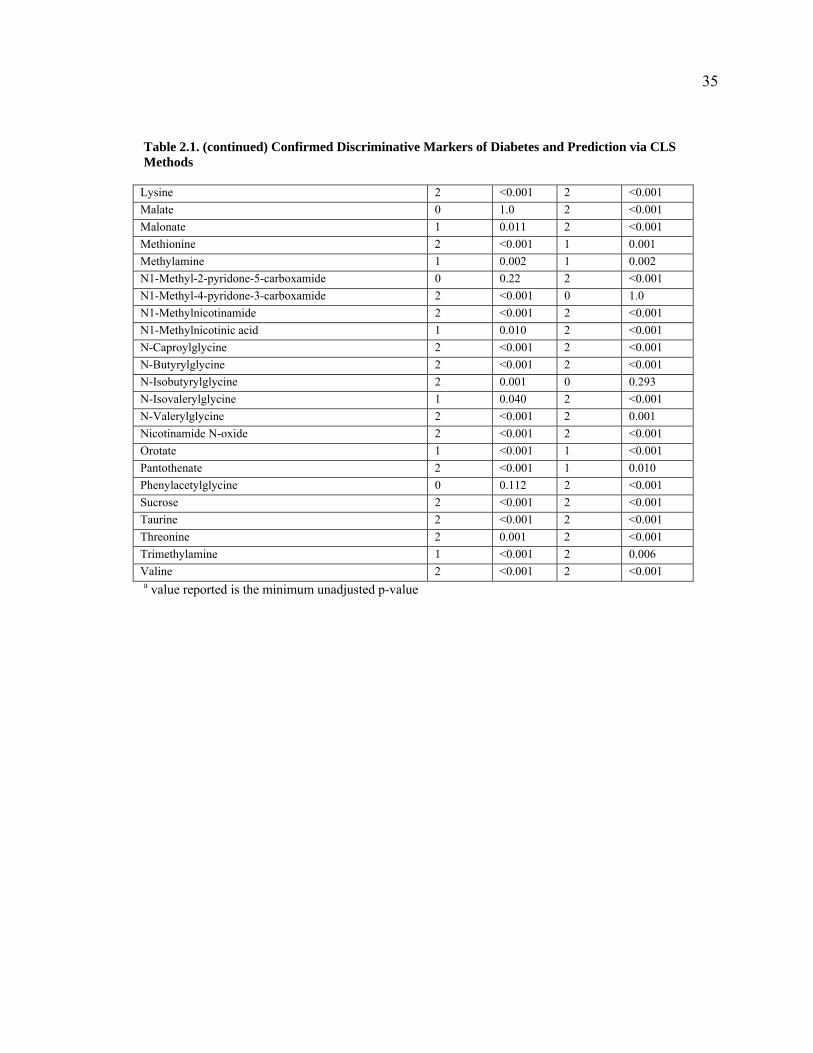
values unadjusted) recovered 38 and 40 of the 46 metabolites, respectively (Table 2.1).
Adjusting the p-values for multiple comparisons led to the discovery of 35 and 38 of the
46 metabolites via nwCLS, mCLS, and vCLS, respectively.
34
Table 2.1. Confirmed Discriminative Markers of Diabetes and Prediction via CLS Methods
nwCLS vCLS Metabolite
Sig. Days pa Sig. Days pa
2-Oxoglutarate 0 0.262 2 <0.001 2-Hydroxyisobutyrate 2 <0.001 2 <0.001 2-Oxoadipate 1 0.017 1 0.008 3-Ureidopropanoate 0 0.052 2 <0.001 Alanine 2 <0.001 2 <0.001 Allantoin 2 0.001 0 0.085 Citrate 1 0.002 1 0.009 Citrulline 0 0.423 2 0.001 Creatine 2 <0.001 1 0.039 Creatinine 2 <0.001 0 0.090 Formate 2 0.001 2 0.001 Fumarate 2 <0.001 2 <0.001 Glucose 2 <0.001 1 0.007 Glutarate 2 <0.001 2 0.001 Glycine 2 <0.001 2 <0.001 Glycolate 2 <0.001 2 <0.001 Guanidinoacetate 2 <0.001 2 <0.001 Hippurate 1 0.003 2 <0.001 Indoxyl sulphate 1 <0.001 2 <0.001 Isobutyrate 2 <0.001 2 <0.001 Isocaproate 2 <0.001 1 <0.001 Isovalerate 0 0.077 0 1.0 Lactate 0 1.0 0 1.0 a value reported is the minimum unadjusted p-value
35
Table 2.1. (continued) Confirmed Discriminative Markers of Diabetes and Prediction via CLS Methods
Lysine 2 <0.001 2 <0.001 Malate 0 1.0 2 <0.001 Malonate 1 0.011 2 <0.001 Methionine 2 <0.001 1 0.001 Methylamine 1 0.002 1 0.002 N1-Methyl-2-pyridone-5-carboxamide 0 0.22 2 <0.001 N1-Methyl-4-pyridone-3-carboxamide 2 <0.001 0 1.0 N1-Methylnicotinamide 2 <0.001 2 <0.001 N1-Methylnicotinic acid 1 0.010 2 <0.001 N-Caproylglycine 2 <0.001 2 <0.001 N-Butyrylglycine 2 <0.001 2 <0.001 N-Isobutyrylglycine 2 0.001 0 0.293 N-Isovalerylglycine 1 0.040 2 <0.001 N-Valerylglycine 2 <0.001 2 0.001 Nicotinamide N-oxide 2 <0.001 2 <0.001 Orotate 1 <0.001 1 <0.001 Pantothenate 2 <0.001 1 0.010 Phenylacetylglycine 0 0.112 2 <0.001 Sucrose 2 <0.001 2 <0.001 Taurine 2 <0.001 2 <0.001 Threonine 2 0.001 2 <0.001 Trimethylamine 1 <0.001 2 0.006 Valine 2 <0.001 2 <0.001 a value reported is the minimum unadjusted p-value

36
In addition to the 46 previously confirmed discriminative markers, all methods
predicted “significant” metabolites from the reference standard database (137
metabolites) that have not been validated (Table 2.2). Additional putative metabolites
beyond the validated 46 may be confirmed as discriminative markers in the future, but
were not followed up during the original confirmation process. Since it is not appropriate
to designate these putative discriminative markers as false positives, it is not possible to
conduct a formal sensitivity/specificity analysis. Instead, an investigation of the
performance of randomly selecting a number of “significant” metabolites, equal to the
number of putative discriminative markers proposed by each method, from the reference
standard database was conducted. After calculating how many of the putative markers
intersect with the confirmed list of 46, it was then possible to calculate the probability
that the performance observed by the CLS methods could be matched or surpassed
through such a random process (Table 2.2). This analysis (α = 0.05) revealed that
nwCLS was not significantly different from random selection, but vCLS was
significantly different. This evidence further supports the idea that using weighting
factors can increase the quality of information gained through least-squares analysis of
NMR spectra.
Table 2.2. Discriminative Marker Prediction Performance
Non-adjusted threshold Adjusted threshold Method
Confirmed/Predicted p Confirmed/Predicted p
nwCLS 38/105 0.168 26/73 0.360 vCLS 40/106 0.042* 27/59 0.007*

37
Figure 2.2 depicts the binned spectral intensities, fitted intensities (vCLS), and the
residual intensities for a representative control (db/+) subject. A calculation of the
positive (under-explained) and negative (over-explained) residuals reveals that for this
individual, 19% of the spectrum remains unexplained and the over-explained area is 7%
of the original spectrum. This same individual, and a representative diabetic (db/db)
subject, were evaluated at a higher level of detail to illustrate the capacity of the CLS
methods to identify altered metabolites in crowded spectral regions (Figure 2.3). Note
that both the spectral regions and the underlying metabolite levels are decreased in the
db/db spectra. These changes are reflected in the accurate identification of significant
decreases in N-caproylglycine, N-butyrylglycine, and N-valerylglycine via both the
nwCLS and vCLS methods.

38
Figure 2.2. Binned spectra (blue), fitted vCLS intensities (red), and residual intensities (black) for a representative control (db/+) subject from the first time point.
Figure 2.3. Diabetic (top) and control (bottom) spectral manually fit with reference spectra. Relative intensity values (y-axis) have been scaled to allow for comparisons between the two individuals.
39
2.5 Discussion
The results from the simulation analyses demonstrate the utility of incorporating
specific domain knowledge into the biomarker discovery process. The ability of CLS
methods to accurately identify metabolites associated with group differences is evidenced
by the fact that AUC values for all three CLS methods evaluated in this study were
significantly increased above the null model. Additionally, the significant increase in the
AUC values attained via incorporation of weighting factors indicates that weighted
methods can provide a significant improvement in discriminative marker discovery
versus non-weighted least-squares.
Weighting factors that maximize the importance of “clear” spectral regions will
be increasingly useful as spectral alignment algorithms improve and bin sizes decrease or
become altogether unnecessary. While binning spectral regions is a useful tool in dealing
with inter-individual alignment variability, it also masks spectral features that can serve
to discriminate between metabolites in a given region (Stoyanova et al.., 2004b).
Furthermore, since the algorithm described here is flexible and can deal with
heterogeneous bin sizes, regions less affected by alignment problems can be evaluated at
a high resolution, while more problematic regions can be grouped in arbitrary bin sizes,
thereby maximizing the information gained.
Experimentation with various parameter settings of the simulated datasets (data
not shown) revealed the importance of the specific dataset in quantitatively evaluating the
various weighting factors. Therefore, an individual weighting factor will have varying
strengths and weaknesses depending on the particular dataset in question. Despite the
40
fact that no two NMR datasets are alike, an attempt was made to simulate what could be
considered a typical NMR dataset. It should be mentioned, however, that in the analysis
of data from real samples different underlying biological processes will produce different
data configurations and therefore are likely to require attention to different details in the
data structure. This fact further supports the concept that the use of specific weighted
factors can help investigators to analyze their data more effectively.
Furthermore, since there continues to be a great deal of active research in the field
of data preprocessing, the described approach was implemented within a framework that
accommodates such inquiries. This model performs the least-squares fitting at a user
defined level of spectral precision that need not be homogeneous within an individual
subject. Reference spectra data input is extremely flexible and can be derived from
modeled data, spike-in analyses, or literature sources. This can be an important
consideration for metabolites that show strong pH dependence to peak shape and
position. Though the model has been seen to be robust in the absence of baseline
estimates, if desired (e.g. when estimating the protein contribution to the baseline of male
mouse urine NMR data [Connor et al. (in preparation)], externally derived estimates of
baseline can also easily be integrated into the reference spectra.
In addition to the default non-negativity constraint, users can also choose to
constrain the model to the upper limit of the data matrix (i.e. the model is prevented from
over-explaining the data). Typically in NMR datasets, there will be an unequal
assignment confidence throughout the spectra, depending on prior knowledge, peak
overlap and the degree of analytical confirmation of each component (2D homonuclear
and heteronuclear NMR, fractionation, LC/MS confirmation, addition of standard). The

41
described method allows users to experiment with the weighting factor used in the least-
squares fit. Here, weighting factors that were a function of the number of compounds
populating a particular spectral region or a function of the group variances were
evaluated. However, there are likely many other weighting factors that will prove useful.
For example, it has been seen (data not shown) that a function of binwise correlations can
also serve as an effective weighting factor. Binwise correlations are of increasing interest
in the field of metabolomics (Cloarec et al., 2005; Sandusky et al., 2005). Furthermore,
model fits can be restricted to subsets of the spectra either through manipulation of the
input dataset or the spectral weighting.
This work attempts to provide tools for the detection and assignment of group
differences within a flexible, robust framework for metabolomics investigators to explore
and analyze NMR data. While traditional methods of NMR spectral analysis are
extremely time-consuming, using the method described here, an investigator can perform
a complete analysis in a matter of minutes. Additionally, a successful analytical
technique should provide investigators a broad scope of inference. Since different
datasets will have different structures, investigators are not limited to a predefined suite
of weighting parameters. The sole data input for LCModel is time-domain in vivo data
and there is no user interaction in the data processing. While there is a need for inter-
laboratory comparability, NMR data preprocessing is still an active area of research and it
is advantageous for investigators to work within a well-defined, yet less stringent,
framework of inquiry. Furthermore, in agreement with the conclusions of Jansen et al.
(2004), though in a different context, it has been demonstrated that the use of a weighting
factor can provide an additional, more focused view of the data. In addition, it is clear

42
that when working with some datasets, it may make the difference between successfully
identifying a discriminative marker and missing it altogether. The above described
method provides a robust, flexible framework for compound level estimation.

43
CHAPTER 3: Evaluation of NMR Deconvolution Algorithm for Individual Sample Estimates
3.1 Summary
This chapter is an extension of the work presented in Chapter 2. This work was done in
collaboration with Susan Connor, Jack Newton, Pascal Mercier, and David Chang.
3.2 Introduction
The process of manually validating the change in a particular metabolite across
treatment groups typically begins by investigating a region of the spectra that contains an
isolated resonance from that metabolite. Since the resonance is isolated, the biological
signal is clear of obstruction and interpretation is straightforward. The remainder of the
metabolite signature is then investigated to provide further evidence for an accurate
assignment. The concept that information about metabolite levels is heterogeneously
distributed through the spectra led to the hypothesis that weighted fitting would be of use
(Chapter 2). Specifically, that weighting spectral deconvolution based on metrics of how
“crowded” spectral regions were, would improve estimated metabolite levels.
The work of the previous chapter describes the performance of a weighted
deconvolution method for the discovery of differences (metabolites with different
concentrations) between groups of complex NMR spectra. It is also of interest to
evaluate the ability of the algorithm to estimate metabolite levels at the individual sample
level instead of identification of group differences. Having metabolite estimates for
individual samples allows investigators to evaluate the data with additional resolution and
creates opportunities for exploration of covariation metrics (e.g. correlation coefficient).

44
3.3 Methods
To compare the performance of unweighted and bin-variance weighted
deconvolution algorithms in estimating metabolite levels underlying complex NMR
spectra, a number of simulation analyses were conducted Using the Chenomx urine
reference spectra library (184 metabolites) with a fixed bin width of 0.04 ppm, pseudo-
spectra were generated and individual metabolite levels were estimated.
Complex spectra were generated by multiplying normalized reference spectra
(most intense peak = 1.0) from 92 of the library metabolites by a random variable drawn
from the uniform distribution (U[0,1]). Next, a certain proportion of metabolites were
withheld from (0%, 5%, 10%, 15%, 20%) or added to (+100%) the reference library for
use by the algorithm. The metabolites in the reference library used by the algorithm, or
the “known” metabolites, were thus 200%, 100%, 95%, 90%, 85%, and 80% of the
underlying spectra. The pseudo-spectra were then analyzed 10 at a time by both
unweighted and variance weighted least-squares deconvolution and individual metabolite
levels were estimated for individual samples (variance calculated across the 10 samples).
This process was repeated 100 times for each percentage profile of “known” metabolites.
In Chapter 2, the relationship between bin variance and the “crowdedness” of a
spectral bin is speculated. In order to explore this relationship, the inverse of the bin
variance of 10 pseudo-spectra (using the method described above, but with all 184
metabolites) is investigated and compared to the number of metabolites with resonances
found in that bin.

45
3.4 Results/Discussion
The difference in performance between the weighted and unweighted method is
visualized in a plot of the cumulative fraction of metabolites having a given absolute
deviation of, or below, a particular value (Figure 3.1). This figure shows that with a
known reference library coverage of 95%, the unweighted algorithm estimated 80% of
metabolites from 0.5 to 2.0 times the true underlying value (1.0x being exact estimation).
Note that even with 100% and 200% reference library coverage only 10%
(approximately) of metabolites had near exact estimates.
The relationship between the number of metabolites with a resonance in a
particular bin and the inverse of the variance of that bin (Figure 3.2) suggests that there is
a tendency for fewer metabolites in a bin to be indicative of a lower bin variance. This
leads to an increased weight (1/variance) for less crowded bins with no dependency on
external databases. This independence from external databases removes weighting
metric bias potentially caused by the user selection (or availability) of metabolites in the
reference spectral library. The effect of this bias can be seen in Chapter 2 by the
disappearance of the effectiveness of the 1/m weighting vector in the general simulation
analysis.
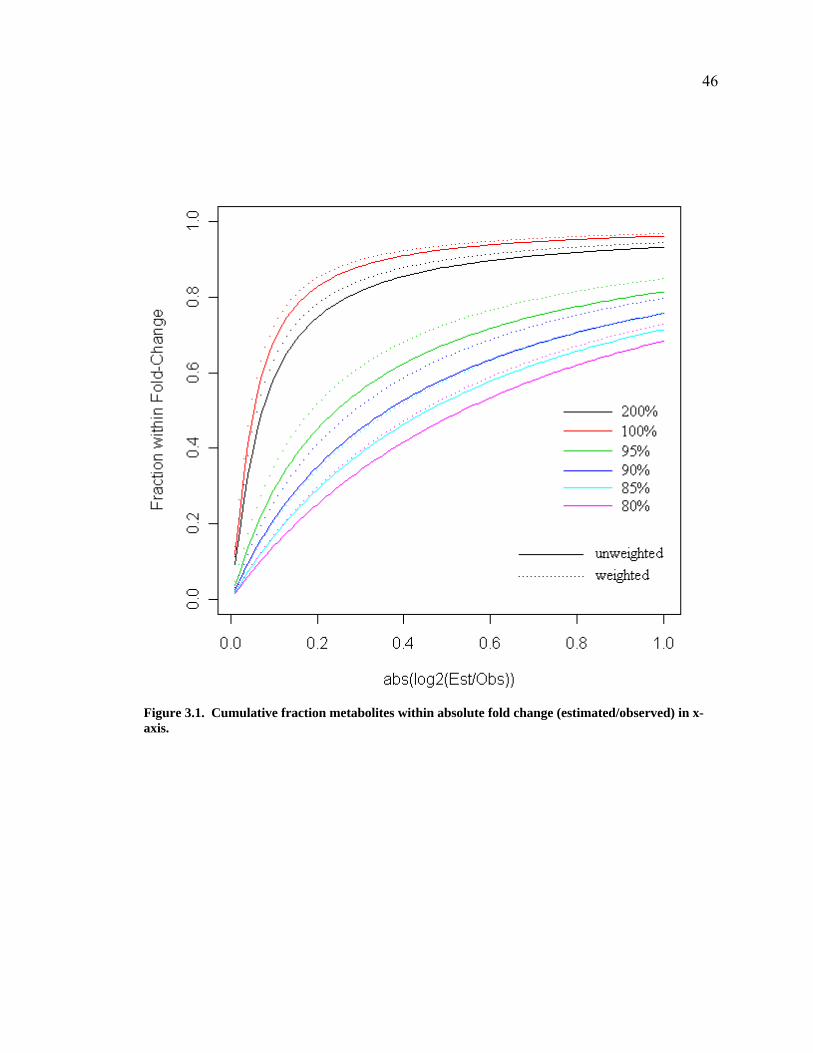
46
Figure 3.1. Cumulative fraction metabolites within absolute fold change (estimated/observed) in x-axis.

47
Figure 3.2. Relationship between inverse bin variance and the number of metabolite resonances in a given spectral region (bin).

48
CHAPTER 4: Assignment of MS-based metabolomics datasets via compound interaction pair mapping
4.1 Summary
This chapter discusses a novel approach for assignment of MS-based metabolomics peaks
and has been modified from an article accepted by the journal Metabolomics (Gipson et
al., 2008) with permission from Springer Science and Business Media. This work was
done in collaboration with Dr. Kay Tatsuoka, Dr. Bahrad Sokhansanj, Dr. Rachel Ball,
and Dr. Susan Connor. The majority of the introductory material from this chapter is also
located in Chapter 1, but has been reproduced here to provide the information in the
original context. Assignment of physical meaning to mass spectrometry (MS) data peaks
is an important scientific challenge for metabolomics investigators. Improvements in
instrumental mass accuracy reduce the number of spurious database matches, however,
alone this is insufficient for accurate, unique high-throughput assignment. A method for
clustering MS instrumental artifacts and a stochastic local search algorithm for the
automated assignment of large, complex MS-based metabolomic datasets is presented.
Artifact peaks and their associated source peaks are grouped into “instrumental clusters.”
Instrumental clusters, peaks grouped together by shared peak shape in the temporal
domain, serve as a guide for the number of assignments necessary to completely explain
a given dataset. Mass only assignments are refined through the intersection of peak
correlation pairs with a database of biochemically relevant interaction pairs. Further
refinement is achieved through a stochastic local search optimization algorithm that
selects individual assignments for each instrumental cluster. The algorithm works by
choosing the peak assignment that maximally explains the connectivity of a given cluster.

49
This methodology is demonstrated to provide a significant advantage over standard
methods for the assignment of metabolites in a UPLC-MS diabetes dataset.
4.2 Introduction
Mass spectrometry (MS) methods are important data platforms for metabolomics
investigators (Want et al., 2005). A particular challenge of global metabolite profiling,
whether using MS or nuclear magnetic resonance (NMR), is assignment of spectral peaks
of interest (Kell, 2004). Previously described informatics methods have been developed
to help to reduce this major bottleneck, although most of the approaches have not yet
been fully validated in the context of analytically confirmed assignments. The proposed
solutions have employed mass only database search methods (Smith et al., 2006), refined
mass database search methods utilizing isotopic patterns (Kind and Fiehn, 2006), mass
spectral libraries (Kopka et al., 2005), and ab initio mass transformation pairs (Breitling
et al., 2006a; 2006b) for the putative assignment of metabolites in high-throughput
metabolomic datasets.
Correlation networks of the assigned components of metabolomic datasets have
been suggested for the construction of metabolic networks (Arkin et al., 1997, Steuer et
al., 2003a). Although metabolic neighbors in shared biochemical pathways have been
observed to be significantly correlated, evaluations of modeled and experimental data
suggest that observed correlation networks do not “necessarily” reflect underlying
pathway structure and correlations often exist that are inexplicable given current
biochemical knowledge (Steuer et al., 2003a; 2003b; Steuer, 2006). Although, it is
recognized that not all metabolite correlations “necessarily” provide information useful
for assignment within the context of existing biochemical pathways, those correlations

50
which intersect with described biochemical interactions can likely be used to inform the
assignment of MS data peaks. In other words, while current understanding of
biochemical interactions is incomplete and cannot fully characterize the pathway
relationships underlying observed metabolite correlations, it is hypothesized that existing
biochemical knowledge provides useful information for the assignment of unknown
compounds in large metabolomic datasets.
In a recently described method for ab initio metabolic network prediction,
investigators present a method for assignment of putative metabolite transformation pairs
using ultra high mass accuracy MS methods coupled with mass searches focused on
metabolic transformations (Breitling et al., 2006a). The method identifies a series of
putative ion reaction pairs by mapping peak mass differences to biochemical
transformation reactions. According to the authors, one of the benefits of this analysis is
that their network links are directly associated with known chemical reactions, exceeding
the level of descriptive connectivity of metabolite correlation networks. Here, a method
is presented that provides explicit biological meaning to observed data relationships
which can provide insight into the assignment of features in MS-based datasets. The
method is intended to be a useful assignment tool, even for lower mass accuracy
instruments that are in common use. However, improving the mass accuracy will likely
improve obtained results.
A recent review of MS-based metabolomics describes the current usage of
biochemical databases as a means to infer biological function of previously identified
metabolites (Dettmer et al., 2007). Applications utilizing existing biochemical pathways
include visualization (Mendes, 2002) and metabolic flux analysis (Forster et al., 2002).

51
However, a global, systematic intersection of metabolite correlation pairs with a database
of biochemical interaction pairs has not yet been described. Here, a method is presented
which can select likely metabolite candidates and increase confidence in metabolite
assignment. Specifically, the aim is to identify metabolites in an ultra performance liquid
chromatography (UPLC)-MS dataset by mapping peak interaction pairs (significantly
correlated peak pairs) onto interaction pairs from the Kyoto Encyclopedia of Genes and
Genomes (KEGG) (Kanehisa et al., 2006) using mass matching. Anticipated benefits of
this methodology include robustness to varying instrumental mass accuracy and
immediate placement of annotated metabolites into an explicit biological context.
An additional challenge of MS-based metabolomics assignment is the
differentiation between mass differences associated with in vivo transformation and those
which are artifacts of MS instrumentation. It is necessary to identify artifactual peaks
(e.g. fragments, oligomers) to avoid assigning biological meaning to highly correlated
peak pairs which are measurements of the same metabolite. To avoid annotation of
instrumental artifacts, peaks are grouped which appear to share the same compound
source into “instrumental clusters.” This has previously been performed manually
through visual inspection of data peaks. In this study, the instrumental clustering process
is automated and integrated it into the assignment algorithm.
A previous study (Breitling et al., 2006a) attempted to minimize the assignment of
instrumental artifacts using a refined, a priori set of biochemically meaningful mass
differences. Here, peaks with shared temporal peak shapes are clustered to distinguish
between instrumental and biological peak relationships. To this end, and to aid the
development of the automated assignment tool, an evaluation of both (i) an artificial

52
biofluid matrix consisting of metabolite standards, and (ii) urine from diabetic and
healthy mice was undertaken. Findings are validated by analytical confirmation of the
metabolite identity.
4.3 Materials and Methods
4.3.1 Experimental Data
A mixture of 21 metabolite standards with mixed adduct, oligomer, and fragment
formation profiles was used to evaluate the automated instrumental clustering technique.
A dilution series (1:1, 1:2, 1:10, 1:100) of the mixture was analyzed with UPLC-MS (5
technical replicates for each dilution), and select metabolites were further profiled with
MS/MS experiments.
Urine samples were collected from adult, male db/db and db/+ mice from The
Jackson Laboratory (Bar Harbor, Maine) at 8, 12 and 20 weeks of age (10 db/db and 10
db/+ mice per collection event). A 50 µL aliquot of urine supernatant was diluted to 200
µL with HPLC-grade water prior to infusion in the chromatographic column. For more
detail about the analyzed datasets, see Section 4.6.
4.3.2 Instrumentation
The data used in this study were positive polarity UPLC-MS datasets.
Chromatographic separations were achieved using an ACQUITYTM C18 (100x2.1mm
i.d., 1.7µm particle size) column (Waters Corporation, Milford, USA) on an
ACQUITYTM UPLC system (Waters). Mass spectrometry was performed on a Waters
LCT PremierTM (Waters MS Technologies, Manchester, UK) orthogonal acceleration
time-of-flight (oa-TOF) mass spectrometer operating in W optics mode.
53
To assess the ability of the algorithm to accurately assign UPLC-MS data peaks, it
was necessary to confirm the resulting assignments using standard analytical chemistry
procedures. These included UPLC-MS/MS and spiking experiments of authentic
metabolites. These experiments were performed on diluted urine and standard solutions
using a Waters Q-Tof PremierTM (Waters MS Technologies, Manchester, UK)
quadrupole, orthogonal acceleration time-of-flight tandem mass spectrometer operating
in V optics mode. Section 4.6 contains more detail regarding the instrumentation.
4.3.3 KEGG Database
Here, “biochemical interactions” is defined as either primary or secondary KEGG
reactions, enzymes, or pathways. Primary interaction pairs are those in which both
metabolites participate in a particular reaction, share an enzyme, or are part of the same
pathway. Secondary reactions are those in which both metabolites share a common
reactant. Secondary enzyme interactions are those in which two compounds can be
linked by way of a third compound with which they each share associations with a
common enzyme. Figure 4.1 provides graphical examples of these relationships.

54
Figure 4.1. Reaction diagrams from KEGG (Kanehisa, et al., 2006). Primary reaction pairs are any two compounds in a common reaction (e.g. C00019 and C00388 in subgraph a). Primary enzyme pairs are any two compounds with a common enzyme (e.g. C00388 and C00141 in subgraphs b and c, respectively). Note that primary enzyme interactions often overlap with primary reactions (e.g. C00019 and C000388 are linked by both a primary reaction and an enzyme interaction in subgraph a). Secondary reaction pairs are two compounds which share a reaction with a common third compound (e.g. C00019 and C00024 linked by reactions with C00388 in subgraphs a and b, respectively). Secondary enzyme pairs are two compounds which share an enzyme with a common third compound (e.g. C00019 and C000141 linked by a shared enzyme with C00388, all subgraphs necessary to create link). Primary pathway pairs are any two compounds found in an individual KEGG pathway (e.g. C00141 and C00024 in the Valine, Leucine and Isoleucine Degradation pathway – see Figure 4.5).

55
The COMPOUND section (Goto et al., 1998) of the KEGG LIGAND database
(release 29.0) was used to define the reaction and enzymatic interaction pairs.
Ubiquitous compounds with highly promiscuous interaction profiles (i.e. H+, H20, O2,
CO2, NH3, A(M,D,T)P, NAD(+,H,P,PH), FAD, UDP) were removed to limit the number
of spurious secondary interactions. KEGG metabolites with either coenzyme-A (CoA)
conjugates or acyl carrier protein (acp) conjugates were modified by substitution with
OH, glycine, and glycine+O to account for biotransformation prior to excretion in urine.
These substitutions were made based on prior experimental findings (data not shown).
4.3.4 Instrumental Clustering/Interaction Pair Identification
Following peak-picking with xcms (Smith et al., 2006) and intensity
normalization, a series of correlation analyses were conducted with the aim of identifying
interaction pairs. A preliminary list of peak interaction pairs is populated through
significance thresholding of a modified correlation analysis (Pearson’s) of the log
transformed total peak intensity across all individuals. Peak interaction pairs were
defined as those peaks with significant correlation coefficients (Benjamini and Hochberg
correction, FDR = 0.001). To eliminate the masking effect of a large group difference,
prior to this correlation analysis, the mean groupwise intensity value was subtracted from
the values of individual group members.
In datasets in which the experimental variable leads to dramatic biological
alterations, within-group variation is often small in comparison to group differences (e.g.
db/db versus db/+). A calculated correlation coefficient between two independent
variables displaying a large group difference is essentially an indicator of shared

56
directional change and provides no information concerning more discrete co-regulatory
relationships.
Peaks are grouped into the same instrumental cluster if they were previously
identified as a peak interaction pair and they have similarly shaped temporally
overlapping peaks. Peak shape similarity was measured with a second correlation
analysis and restricted to peak pairs with a minimal number (5) of overlapping scans.
The correlation coefficient (Pearson’s) is calculated for these peak pairs (across all
individuals and time points) as a measure of peak shape similarity. Peaks are grouped
into the same instrumental cluster if they were previously identified as a peak interaction
pair and they have a peak shape correlation exceeding a threshold value. The peak shape
correlations were calculated across all scans and all samples. This presents the problem
of treating auto-correlated temporal data as independent replicates. To avoid this, a
correlation significance threshold (Bonferroni adjusted) was employed based strictly on
the number of true replicates. In order to account for the possibility that a defined peak is
actually a composite of multiple peaks, an individual peak can belong to multiple
instrumental clusters. Each cluster is characterized by every member meeting correlation
significance criteria with every other member.
Instrumental pairs are filtered from the peak interaction pair list to remove peak
relationships caused by instrumentation to be interpreted biologically. Finally, the
intersection between peak interactions and biochemical interactions is delineated through
mass mapping (assuming a mass accuracy of 25 ppm for m/z > 200 and 0.005 Da for m/z
≤ 200).
57
4.3.5 Optimization Algorithm
The process of identifying the intersection of peak interaction pairs and
biochemical interaction pairs leads to a list of putative assignments in which multiple
peaks can have the same assignment and individual peaks can have multiple assignments.
In order to provide further refinement of the list of putative assignments, a stochastic
local search algorithm is performed to assign unique assignments to peaks associated
with instrumental clusters through maximizing the total strength of peak interaction pairs
explained. Here, the strength of an individual peak interaction is a function of the
specific biochemical interaction(s) employed to explain it. The strength of each
biochemical interaction type was quantified with a weight based on the probability [-
log(P)] of occurrence in the modified (accounting for biological transformation) KEGG
database. In cases where given interaction has multiple biochemical interaction types, the
strength of that interaction would be the sum of the weights for all interaction types.
Following an extensive analysis of the –log(P) weighting method, additional
optimizations were performed in which: 1.) All interaction types were included and
metabolite-metabolite interactions were scored as the sum of equally weighted interaction
types; 2.) All interaction types were included and all metabolite-metabolite interactions
were scored equally, regardless of interaction type contribution; 3.) Only 2o interactions
were included and all metabolite-metabolite interactions were scored equally, regardless
of interaction type contribution; and 4.) Only 1o interactions were included and all
metabolite-metabolite interactions were scored equally, regardless of interaction type
contribution.

58
The search algorithm is initialized with each instrumental cluster being randomly
associated with either a putative assignment or no assignment. Each cluster is then
iteratively evaluated in a random order, and cluster assignments are made based on which
putative identification maximizes the overall connection strength within the context of all
other current assignments. The algorithm is terminated following three evaluations of
each cluster (Figures 4.6 & 4.7).
The KEGG database is an incomplete characterization of biochemical
interactions. It was of interest to identify consensus assignments through successive
perturbations of the KEGG database prior to optimization and evaluate the frequency of
individual assignments. This will provide investigators with a distribution of assignments
for each cluster, and therefore provide an estimate of confidence in a particular
assignment. In order to achieve this, the interaction weighting matrix was sampled (80%
of total interactions) prior to executing the search algorithm.
Since the optimization algorithm is stochastic, it is run several times and putative
assignments can be ranked based on occurrence frequency. Output from the assignment
optimization algorithm is structured as a list with the same number of elements as there
are instrumental clusters. Each list element is comprised of a list of putative assignments,
for a particular instrumental cluster, ranked by frequency of occurrence. Section 4.6
contains more detail about the optimization algorithm.
4.4 Results and Discussion
4.4.1 Instrumental Clustering
There are two types of peak relationships that are of interest in this study: peaks
originating from different parent compounds that are biochemically related in vivo and
59
instrumental artifacts that are related to a common parent compound. The importance of
characterizing the second type of peak relationship is that this knowledge can be used to
restrict assignment to one explanatory peak per cluster and hence act as a filter for
biologically meaningless mass-mass pair interactions.
Comparison of instrumental clusters generated through the automated technique
and traditional visual inspection reveals a large overlap between the two methods. The
clustering software typically identifies additional cluster members not discovered through
visual inspection. To demonstrate the functionality of the clustering algorithm, the mass
spectra of 5-hydroxytryptophan (5-HTP) and phenylacetylglutamine (PAGn) were
extracted from the dataset and examined in closer detail. In-source adducts, oligomers,
and fragments were assigned using a 25 ppm mass error for all ions above 5% intensity of
the base peak. Fragmentation was subsequently confirmed by MS/MS.
Visual inspection of the extracted mass spectra for 5-HTP and PAGn from the
LC-MS dataset of the standard mix identified 3 mass peaks associated with 5-HTP (m/z=
162.0555, 204.0661, 221.0926 [M+H] +) and 9 mass peaks associated with PAGn (m/z=
84.0442, 130.0504, 248.0923, 265.1192 [M+H]+, 287.0999, 288.1029, 551.2028,
567.1771, 568.1815). The automated technique identified individual instrumental
clusters for both the 5-HTP and PAGn peaks ([M+H]+). The 5-HTP cluster contained 2
of the 3 mass peaks identified by visual inspection but lacked the 162.055 m/z fragment.
The omission of the 162.055 m/z fragment from the 5-HTP cluster was due to non-
optimal peak picking conditions for this peak. Since it was absent from the peak-picked
dataset, this peak will not be found in the 5-HTP cluster. There was also an additional
peak in the 5-HTP cluster that was not observed initially in the visual analysis. The PAGn

60
cluster contained all 9 mass peaks identified by visual inspection, plus 12 additional
peaks. Follow-up evaluations of the 5-HTP and PAGn clusters revealed that all peaks
clustered together by the automated method did indeed share a common parent
metabolite.
Revisiting the visual inspection revealed that each of the additional peaks which
clustered with 5-HTP (m/z= 243.0748) and PAGn (m/z= 83.0611, 129.0657, 136.0760,
247.1076, 266.1254, 552.2057, 553.1923, 554.1958, 569.1833, 583.1511, 591.1582,
592.1619) were real adducts, oligomers, or fragments. However, they were either outside
of the 25 ppm mass window or below 5% base peak intensity. A graphical representation
of the time evolution of the peaks associated with the PAGn cluster (Figure 4.2)
demonstrates the ability of the method to identify overlapping peaks with similar
temporal profiles.

61
Figure 4.2. Plot of the temporal profile of peaks (from an individual subject) assigned to the instrumental cluster associated with PAGn. Peaks identified through visual inspection are labeled (m/z values).

62
This method is completely independent of assumptions regarding acceptable and
non-acceptable transformations, whether biochemical or instrumental. This is important
given that within the mass domain, biochemical and instrumental changes can appear
identical. The fact that the alteration of physiochemical properties due to biological
rather than instrumental transformations will typically lead to alterations in column
retention characteristics is helpful. As such, any transformations existing prior to entry
into the ion source and MS would be expected to have different temporal profiles.
4.4.2 Interaction Pair Identification
The KEGG database yields 8,438 primary reactions, 28,104 primary enzyme
interactions, 73,182 primary pathway interactions, 393,325 secondary reactions, and
697,338 secondary enzyme interactions describing the relationships between 4,016
metabolites. Following preliminary assignment of the data with the KEGG database, the
output is organized into 6 data files with linked identifiers. These data files can be
imported into a database and easily queried for either mass only assignment predictions,
or for peak/biochemical interaction intersection assignment predictions. Additionally,
these data files serve as the input for the stochastic local search optimization algorithm.
The data analysis resulted in the extraction of 2,767 data peaks, 1,262
instrumental clusters, 218,895 peak interaction pairs (212,573 excluding pairs in same
instrumental cluster), 3,164 putative mass only assignments, and 17,349 putative
peak/biochemical interaction intersection assignments (11,649 unique intersection
assignments).

63
Through various stages of this methodology, the KEGG database is either
modified or filtered to meet specific needs. Each time the KEGG database is altered, the
possibility exists that the distribution of the various interaction types will change. The
characteristics of the initial KEGG database, compared to the first (substitution of
biotransformation products) and second (filtration via mass matching) alterations the
database vary little (1o Reaction=0.69-0.71%, 1o Enzyme=2.3-2.9%, 1o Pathway=5.5-
6.1%, 2o Reaction =31.9-32.8%, 2o Enzyme=57.8-58.9%). This indicates that the
database alterations have not affected the underlying database characteristics. However,
the third alteration (filtration via correlation pair intersection) leads values of 1.7% (1o
Reaction), 5.4% (1o Enzyme), 7.5% (1o Pathway), 29.3% (2o Reaction), and 56.1% (2o
Enzyme). The increase of the primary interactions (1.34-2.40 fold) and decrease of
secondary interactions (0.92-0.95 fold) indicates that the primary interactions have an
increased prevalence in the correlation filtered database and therefore, primary
interactions are likely more predictive of significant correlations.
4.4.3 Optimization Algorithm
Network connection strength, based on the biochemical interaction types acting as
network edges, is calculated using the modified (including transformations) KEGG
database. Shared pathways were more common (5.8%) than shared enzymes (2.9%),
which in turn, were more common than shared reactions (0.7%), and secondary
interactions (reaction chain 32.8%; enzyme chain, 57.8%) were far more common than
primary interactions. Assignment alterations performed by the algorithm strictly increase
the overall connection strength of the network (Figure 4.7), and the impact that this has
on the interaction sub-network associated with Trimethylamine N-oxide can be seen in

64
Figure 4.3. The edges in this figure represent the existence of a significant correlation
between members of different clusters concurrent with assignments within a shared
biochemical interaction pair. Prior to unique assignment, the sub-network is highly
connected due to the inclusion of all putative assignments per cluster. Once unique
assignments are made for each cluster, edges associated with discounted assignments will
be lost. The goal of the stochastic local search algorithm is to maximize not just the
number of connections in the global network, but the strength of the connections as well.

65
Figure 4.3. Connectivity plot of sub-network associated with Trimethylamine-N-oxide (cluster 9). left. Multiple assignments per cluster allow for maximal connectivity. middle. Random initialization with unique assignments does a poor job of explaining peak interactions. right. Assignment with cluster specific, top-ranked metabolites yields a highly connected sub-network.

66
The ability of the algorithm (denoted “alternative model”) to outperform a mass
only search of the KEGG database (“null model”), and an interaction intersection search
of the KEGG database (“filtered model”) was assessed. To do so, lift curves (Witten and
Frank, 2000) were constructed representing the expected number of correctly assigned
validation peaks versus the total number of assignments examined (Figure 4.4). Putative
assignments from the algorithm, employing –log(P) weighted scoring, were first sorted in
descending order with respect to the number of times an assignment was proposed (over
100 iterations of the search algorithm) irrespective of cluster representation. For this
reason an individual assignment may occur more than 100 times. Following the sorting
procedure, the assignments were iteratively checked for accuracy and a cumulative total
of correct hits was enumerated. The performance of both the filtered and null models
was computed with a random selection model of the correct hits from the pool of putative
assignments. The non-linearity of the performance of the filtered and null models (Figure
4.4) occurs because there are multiple (3) KEGG entries (glutamate, L-glutamate, or D-
glutamate) that can explain the glutamate clusters.
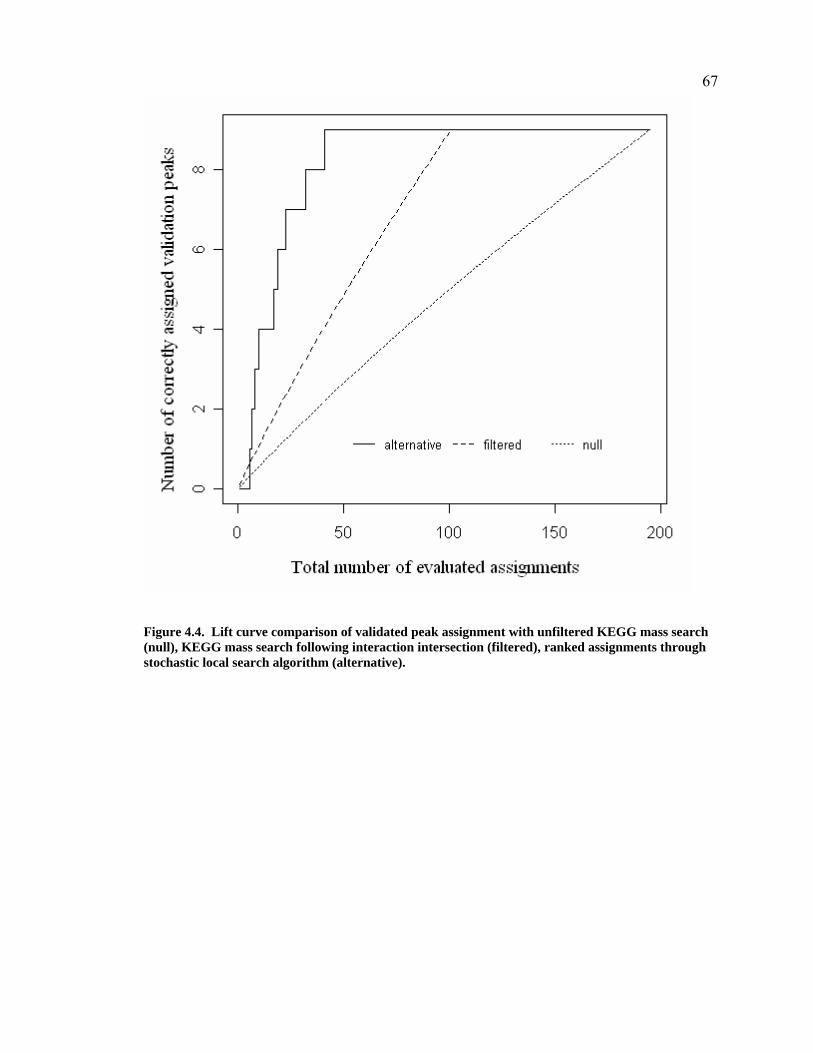
67
Figure 4.4. Lift curve comparison of validated peak assignment with unfiltered KEGG mass search (null), KEGG mass search following interaction intersection (filtered), ranked assignments through stochastic local search algorithm (alternative).

68
The lift curve (Figure 4.4) demonstrates both the utility of restricting mass only
searches to highly validated biochemical interaction pairs (filtered model), as well as the
improved performance achieved through ranking filtered assignments with the stochastic
local search algorithm. The comparison reveals that, to identify the correct assignment
for the clusters associated with the 9 validation compounds, an investigator would need to
evaluate 195, 101, and 41 putative assignments using a mass only search, an interaction
filtered search, and an optimized search, respectively. Thus, using this approach provides
a nearly 2- and 5-fold reduction in the number of putative assignments necessary to
evaluate using an interaction filtered search and an optimized search, respectively. Table
4.1 summarizes the assignment results from the optimization algorithm, as well as the
number of putative hits (filtered and null model), for the clusters associated with 9
validated metabolites. A comparison to alternative scoring procedures indicates that the
–log(P) weighted scoring performs favorably well (Table 4.2).
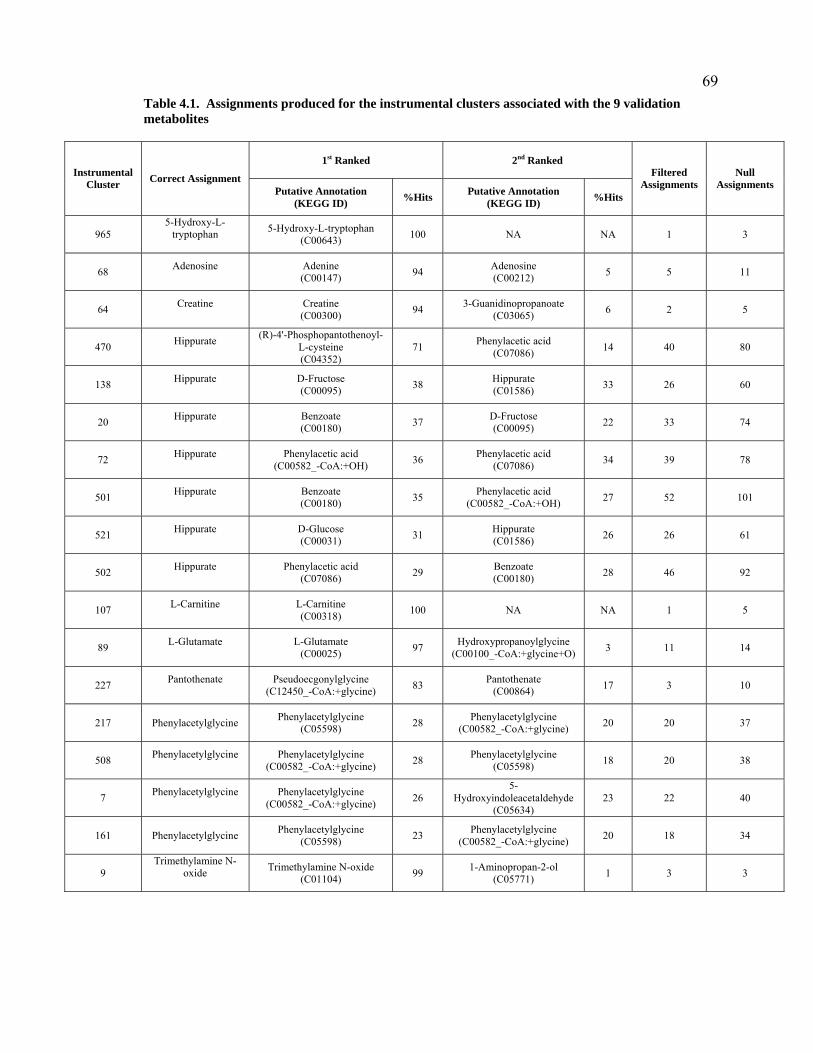
69
Table 4.1. Assignments produced for the instrumental clusters associated with the 9 validation metabolites
1st Ranked 2nd Ranked Instrumental
Cluster Correct Assignment Putative Annotation
(KEGG ID) %Hits Putative Annotation (KEGG ID) %Hits
Filtered Assignments
Null Assignments
965 5-Hydroxy-L-
tryptophan
5-Hydroxy-L-tryptophan (C00643) 100 NA NA 1 3
68 Adenosine
Adenine (C00147) 94 Adenosine
(C00212) 5 5 11
64 Creatine
Creatine (C00300) 94 3-Guanidinopropanoate
(C03065) 6 2 5
470 Hippurate
(R)-4'-Phosphopantothenoyl-L-cysteine (C04352)
71 Phenylacetic acid (C07086) 14 40 80
138 Hippurate
D-Fructose (C00095) 38 Hippurate
(C01586) 33 26 60
20 Hippurate
Benzoate (C00180) 37 D-Fructose
(C00095) 22 33 74
72 Hippurate
Phenylacetic acid (C00582_-CoA:+OH) 36 Phenylacetic acid
(C07086) 34 39 78
501 Hippurate
Benzoate (C00180) 35 Phenylacetic acid
(C00582_-CoA:+OH) 27 52 101
521 Hippurate
D-Glucose (C00031) 31 Hippurate
(C01586) 26 26 61
502 Hippurate
Phenylacetic acid (C07086) 29 Benzoate
(C00180) 28 46 92
107 L-Carnitine
L-Carnitine (C00318) 100 NA NA 1 5
89 L-Glutamate
L-Glutamate (C00025) 97 Hydroxypropanoylglycine
(C00100_-CoA:+glycine+O) 3 11 14
227 Pantothenate
Pseudoecgonylglycine (C12450_-CoA:+glycine) 83 Pantothenate
(C00864) 17 3 10
217 Phenylacetylglycine Phenylacetylglycine (C05598) 28 Phenylacetylglycine
(C00582_-CoA:+glycine) 20 20 37
508 Phenylacetylglycine
Phenylacetylglycine (C00582_-CoA:+glycine) 28 Phenylacetylglycine
(C05598) 18 20 38
7 Phenylacetylglycine
Phenylacetylglycine (C00582_-CoA:+glycine) 26
5-Hydroxyindoleacetaldehyde
(C05634) 23 22 40
161 Phenylacetylglycine Phenylacetylglycine (C05598) 23 Phenylacetylglycine
(C00582_-CoA:+glycine) 20 18 34
9 Trimethylamine N-
oxide
Trimethylamine N-oxide (C01104) 99 1-Aminopropan-2-ol
(C05771) 1 3 3

70
Table 4.2. Performance of the search algorithm using different weighting schemes. Metabolite-metabolite interaction pairs are scored by the sum of the weights of each type of interaction found.
Weighting Performance
1o Reaction 1o Enzyme 1o Pathway 2o Reaction 2o Enzyme Fraction Correct
# Putative assignments
1 1 1 1 1 8/9 46 1* 8/9 51
0 0 0 1* 8/9 48 1* 0 0 9/9 69
4.96 3.54 2.85 1.11 0.55 9/9 41 *an individual weight is attributed if any of the interaction types are found
71
It should be noted that there are various features within the framework presented
here that an individual investigator may want to explore. For instance, the association of
peaks into interaction pairs can be manipulated through various means, including:
changes in data normalization techniques; significance thresholding; or other significance
criteria. As an example, an analysis was performed in which peak correlations were
calculated in a group-specific manner (i.e. a coefficient for db/db and a separate
coefficient for db/+), and interaction pairs were defined by a significant relationship in
either group. By altering the definition of interaction pairs in this way, the number of
significant peak correlations is reduced from 218,895 to 155,760, with 115,972 common
pairs. Furthermore, for this dataset, it was found that the group-specific interaction pair
criteria improved the performance of the method. To identify the correct assignment for
the clusters associated with the 9 validation compounds, an investigator would need to
evaluate 184, 87, and 24 putative assignments using a mass only search, an interaction
filtered search, and an optimized search, respectively. Investigators using this assignment
method should be aware that there is a trade-off between statistical power (allowing for
biologically altered metabolic relationships via independent correlation calculation will
reduce the degrees of freedom) and inferential scope (requiring different biological states
to retain a particular relationship will necessarily narrow the data interpretation).
A recent study evaluated content differences between several popular chemical
databases (Kind and Fiehn, 2006) and came to two conclusions with respect to KEGG:
(1) restricting automated mass spectra assignments to KEGG database searches is
insufficient due to representation of only a limited number of potentially measured
metabolites and (2) KEGG assignments may be more informative (when available),
72
specifically because of the focus on common biochemical pathways. Given these
findings, the use of the interaction pair mapping assignment is suggested only within the
context of the quality of existing biochemical interaction databases. Since current
pathway databases are far from comprehensive, the proposed method should not be
considered in isolation. Rather, this method provides high quality assignments for a
subset of the whole metabolome. Additionally, by implementing a separation technique
(LC) prior to MS analysis the capacity for the identification of instrumental fragments,
adducts, and oligomers has been improved. As biochemical interaction databases
increase in size and quality, the integration of empirical peak relationships (e.g. data
correlates), database mass searches, and validated biochemical interactions, will play a
greater role in the assignment and interpretation of high-throughput MS-based
metabolomic studies.
4.5 Concluding Remarks
The need for techniques to complement mass only database assignment is driven
by both the limited mass accuracy of instruments currently in use as well as the analytical
constraint that mass alone is insufficient for assignment verification. Here, the utility of
accurately clustering instrumental artifacts and using a priori biochemical interaction
data is demonstrated. The ability to quantitatively segregate the quality of assignments
(within the context of available biochemical pathway data) allows for the successful
interpretation of large scale metabolomic datasets, and it is a valuable, time-saving tool
for guided analytical verification of metabolite assignments.
There is currently no standard instrumental setup used in MS-based
metabolomics. Since there are a wide variety of instruments and hyphenated techniques
73
used in MS-based metabolomics, the characteristics of the output should be taken into
consideration when evaluating the utility of the described methods. For example,
investigators not using a separation technique prior to MS analysis will be unable to use
the clustering algorithm described here, since it is dependent upon temporally resolved
data and a well defined peak shape. Nevertheless, assignment of all MS-based
metabolomics datasets should be aided by the incorporation of interaction pair mapping.
The integration of dataset independent biochemical information increases the
accuracy of metabolite assignment, even at low mass accuracy (25 ppm). Furthermore,
biochemical pathway information will increase in value as biochemical databases grow
and the quantity of validation data increases. Additionally, an investigator can combine
this automated assignment method with other data types (e.g. NMR metabolic profiling
data, microarray) to improve and expand the current capabilities. Although presented in
isolation, this method can easily be integrated with other methods (e.g. isotopic pattern
matching, mass spectral library queries, ab initio mass transformation pair matching)
within a comprehensive assignment framework.
4.6 Supplementary Material
4.6.1 Diabetes Dataset
All in-life experiments were conducted using adult, male db/db and db/+ mice
from The Jackson Laboratory (Bar Harbor, Maine). All animals arrived at 4 weeks of age
and were quarantined for 1 week. They were housed in groups of five on a 12:12-hour
light-dark cycle and at 23 ± 2°C and had access to standard chow pelleted diet (Purina
5001; TestDiet, Richmond, IN) and water ad libitum. Urine was collected at 8, 12 and 20
weeks of age from 10 db/db and 10 db/+ mice. For the 6 hour period of sample
74
collection, animals were transferred to metabolism cages (designed specifically for the
separate collection of urine and feces) and given free access to water.
Urine samples were collected over ice into collection pots that contained 1%
azide. The frozen mouse urine samples were allowed to thaw at room temperature prior
to analysis. A 50 µL aliquot of urine supernatant was diluted to 200 µL with HPLC-grade
water.
4.6.2 UPLC -MS and -MS/MS
HPLC-grade water and acetonitrile was purchased from Fisher Scientific
(Loughborough, UK). Spectroscopic-grade formic acid and leucine enkephalin was
purchased from Sigma–Aldrich (Poole, UK), and analytical-grade formic acid was
purchased from BDH (Poole, UK).
The ACQUITYTM C18 column was maintained at 40°C and eluted using a 10 min
gradient (A=0.1% aqueous formic acid and B=acetonitrile 0.1% formic acid) at a flow
rate of 500 µL/min. The gradient steps were: 0.0–0.5 min = 99.5% A; 0.5–7.5 min =
99.5–80.0% A; 7.5-8.5 min = 80.0–0.5% A; 8.5–8.8 min = 0.5% A; 8.8–9.0 min = 0.5-
99.5% A; 9.0–10.0 min = 99.5% A. A 20 µL aliquot of sample (i.e. diluted mouse urine,
standard mixture) was injected directly on to the column and the column eluent was
introduced directly in to the MS source.
The LCT PremierTM (MS) desolvation gas was set to 800 L/h at a temperature of
400°C, the cone gas set to 50 L/h, and the source temperature set to 120°C. The capillary
voltage and cone voltage were set to 3000 and 50V respectively. The data acquisition rate
was set to 150 ms, with a 50 ms inter-scan delay using dynamic range enhancement
(DRE). All analyses were acquired using lock spray. Leucine enkephalin was used as the
75
lock mass (m/z 556.2771) at a concentration of 50 ng/mL and flow rate of 50 µL/min.
Data were collected in centroid mode from m/z 50–1000 with a lock spray measurements
every 5 s, and data averaging over 10 scans.
The Q-Tof PremierTM (MS/MS) desolvation gas was set to 800 L/h at a
temperature of 400°C, the cone gas set to 50 L/h, and the source temperature set to
150°C. The capillary voltage and cone voltage were set to 3500 and 25V respectively.
The data acquisition rate was set to 250 ms, with a 100 ms inter-scan delay using
dynamic range enhancement (DRE). Where appropriate, MS/MS data were generated
using collision induced dissociation (CID), with argon as the collision gas (0.35 mL/min)
using a collision energy ramp of 10-30eV. A lock mass of leucine enkephalin at a
concentration of 250 ng/mL, in 50:50 methanol:water, was employed with an infusion
rate of 50 µL/min via the lock spray interface. Data were collected in centroid mode from
m/z 50-1000 with a lock spray as above. All UPLC conditions were as described above.
4.6.3 Peak Picking and Preprocessing
Peaks were extracted from the UPLC-MS data using xcms (Smith et al., 2006).
For this analysis, no retention time correction was employed, and the default initialization
parameters were used with the exception of the full width at half maximum (fwhm),
bandwidth (bw), and signal to noise threshold (snthresh). Based on empirical
observations, both fwhm and bw were changed to 5 scans. The snthresh parameter was
left as default (10) for the diabetes dataset analysis, but changed to 80 for the standard
mixture analysis. The resultant output from xcms was 2 data matrices (intensities x
samples), describing the total peak intensities (1 intensity value per peak-sample) and the
peak shape (1 intensity value per scan-peak-sample).

76
In order to normalize the data, first, the peaks were ranked with respect to the
total intensity level (all individuals summed). Next, the normalization factor was
calculated as the inverse of the sums of the individual sample intensities of the middle
80% of the ranked peaks. The intensity levels for each sample were normalized through
multiplication with the individual normalization factor.
4.6.4 Peak Assignment
The local search algorithm is initialized with each instrumental cluster being
assigned either a random assignment or no assignment, with probability equal to the
inverse of the number possible assignments plus 1. Assignment is strictly performed for
one peak per cluster. During optimization, if a particular instrumental cluster has no
assignments which can contribute to an increased score, the same random selection used
for initialization will be employed. Commonly, assignments are encountered which can
increase the score, but have been previously assigned to another peak. In these instances,
the score will be recalculated after the previously assigned peak is randomly reassigned.
If the score remains improved, the reassignment holds and the current instrumental
cluster is permitted to take the assignment. If the score is not improved, the previous
assignment holds and the assignment is disallowed for the current instrumental cluster.
The search algorithm completed 100 iterations of 3-fold cluster optimizations for >500
clusters in approximately 8 hours on a PC running Windows XP with a 2.80 GHz
Pentium 4 processor and 1 GB of RAM.
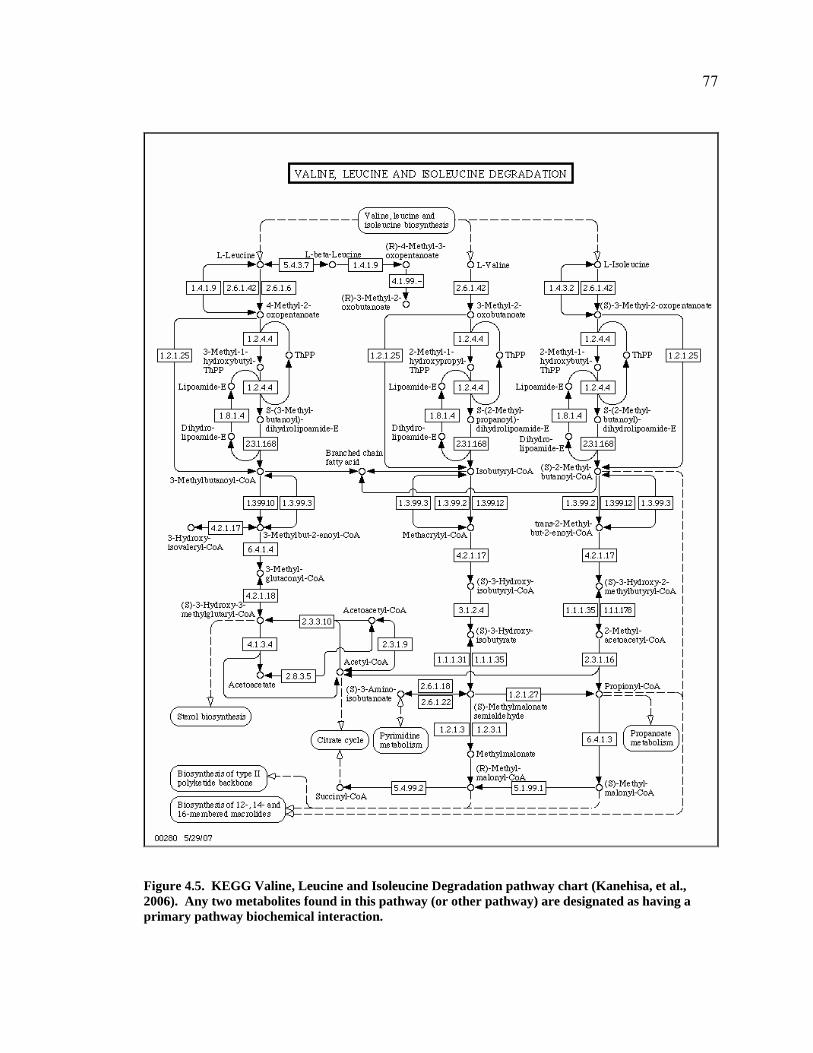
77
Figure 4.5. KEGG Valine, Leucine and Isoleucine Degradation pathway chart (Kanehisa, et al., 2006). Any two metabolites found in this pathway (or other pathway) are designated as having a primary pathway biochemical interaction.

78
Figure 4.6. Flow diagram representation of the stochastic local search network optimization algorithm. Initialization – All peak clusters are randomly attributed unique metabolite assignments, creating a network of assignments (nodes) and interactions (edges). Cluster optimization – each cluster is individually evaluated (random order) and the assignment that maximizes the network score is selected. An individual network optimization ends once each cluster has been evaluated 3 times. Network optimization is repeated 100 times.

79
Figure 4.7. Average score (100 runs) +/- 2 standard deviations of interaction networks as the local search algorithm progresses. Arrows indicates the regions on the curve at which point all 521 clusters have been evaluated (random order). The algorithm was terminated after 3 post-initialization evaluations due to reduced improvements in score.

80
CHAPTER 5: Metabolomics of a Murine Model of Type 2 Diabetes
5.1 Summary
This chapter discusses the technical and biological findings from a series of
metabolomics datasets collected from a diabetic mouse model and has been modified
from an article in preparation (Gipson et al., in preparation). This work was done in
collaboration with Dr. Kay Tatsuoka, Dr. Rachel Ball, Dr. Bahrad Sokhansanj, Dr.
Michael Hansen, Dr. Terrence Ryan, Mark Hodson, Dr. Brian Sweatman, and Dr. Susan
Connor. The majority of the introductory material from this chapter is also located in
Chapter 1, but has been reproduced here to provide the information in the original
context. Here, a multi-platform (1H NMR, LC-MS, microarray) investigation of
metabolic disturbances associated with the leptin receptor defective (db/db) mouse model
of type 2 diabetes using novel assignment methodologies is described. For the first time,
several urinary metabolites were found to be associated with diabetes and/or diabetes
progression and confirmed in both NMR and LC-MS datasets. The confirmed
metabolites were trimethylamine-n-oxide (TMAO), creatine, carnitine, and
phenylalanine. TMAO and phenylalanine were both elevated in db/db mice and
decreased in these mice with age. Levels of both creatine and carnitine increase in
diabetic mice with age and creatine was also significantly decreased in db/db mice.
Additionally, many metabolic markers were found by either NMR or LC-MS, but could
not be found in both, due to instrumental limitations. This indicates that the combined
use of NMR and LC-MS instrumentation provides complementary information that
would be otherwise unattainable. Pathway analyses of urinary metabolites and liver,
muscle, and adipose tissue transcripts from the db/db model were also performed to
81
identify altered biochemical processes in the diabetic mice. Metabolite and liver
transcript levels associated with the TCA cycle and steroid processes were altered in
db/db mice. In addition, gene expression in muscle and liver associated with fatty acid
processing was altered in the diabetic mice and similar evidence was observed in the LC-
MS data. The findings highlight the importance of a number of processes known to be
associated with diabetes and reveal tissue specific responses to the condition. When
studying metabolic disorders such as diabetes, platform integrated profiling of metabolite
alterations in biofluids can provide important insight into the processes underlying the
disease.
5.2 Introduction
In both the United States and worldwide, the prevalence of diabetes is increasing.
In 2003, there were approximately 194 million affected adults (5.1% global population),
and by 2025, it is projected that the incidence of diabetes will reach 333 million adults
(6.3% global population). Type 2 diabetes accounts for approximately 90% of all
diabetes cases and is projected to be the primary cause of the increasing incidence rate
(International Diabetes Federation, 2005).
Of all the animal models available for the investigation of type 2 diabetes, rodent
models have been the most popular due to short generation time, heritable traits, and cost.
The most studied spontaneously diabetic mouse model is the db/db mouse, which, due to
an autosomal recessive defect in the leptin receptor gene, displays several phenotypic
traits associated with type 2 diabetes (Chen and Wang, 2005) including drastically altered
metabolic processes. The widespread metabolic changes associated with diabetes make
metabolic profiling a particularly important contribution to the discussion of disease

82
progression and prevention. Although the metabolome is considered to be more closely
related to phenotype than the transcriptome (Hollywood et al., 2006), any attempt at a
systems biology approach requires multiple data modalities (e.g. metabolomics,
transcriptomics) and metabolomics platforms (van der Greef et al., 2007).
1H nuclear magnetic resonance (NMR) spectroscopy and mass spectrometry-
(MS) based technologies are the most commonly used for mammalian metabolomics
(Dunn and Ellis, 2005). Both approaches allow for the simultaneous measurement of a
large number of individual metabolites, allowing investigators to identify and validate
key discriminative markers of disease, drug efficacy, toxicity, or other physiological
parameters. Consistency and reproducibility are considered a distinct advantage for the
use of NMR in metabolic profiling studies (Keun et al., 2002). MS-based methods are
also important data platforms and have the specific advantage of a lower detection limit
(Want et al., 2005). However, MS data are not as reproducible as NMR due to a non-
linear detector response and ionization.
The goal of this study was to provide biological insight into metabolic alterations
associated with diabetes and diabetic progression. A number of metabolic profiling
studies of diabetes have been conducted evaluating rodent models (Williams et al., 2006),
humans (van Doorn et al., 2006), and cross-species comparisons (Salek et al., 2007). In
contrast to these studies, this study is an evaluation of cross -experimental and -platform
results for consistency within the context of biological analysis. To accomplish this,
standard and novel methodologies (Gipson et al., 2006; 2008) were used to extract
information of biological importance from NMR and LC-MS profiles of urine from db/db
and control (db/+) mice. This metabolite data, collected over two independent

83
experiments, is put into context with a gene expression dataset that was collected during
one of the experimental periods. Additionally, technical issues concerning the use of
NMR and LC-MS data in metabolomics investigations are discussed.
5.3 Methods
5.3.1 Experimental Data
Two independent experiments investigating db/db versus db/+ mice were
evaluated in this study. In Experiment 1, urine was collected from 8 week old, male mice
from The Jackson Laboratory (Bar Harbor, Maine) [30 db/+, 31 db/db] and adipose
tissue, liver, and muscle were collected from the animals 2 weeks later. Urine samples
were analyzed by NMR and adipose tissue, liver, and muscle were used for microarray
analysis (Affymetrix MOE430a). In Experiment 2, urine samples were collected from
male db/db and db/+ mice at 8, 12, and 20 weeks of age (10 db/db and 10 db/+ mice per
collection event). One of the week 12 control animals was removed from the analysis
due to fecal contamination of the sample. The urine samples from the second experiment
were analyzed both by NMR and LC-MS.
5.3.2 NMR data
Datasets from 2 experiments of Carr-Purcell-Meiboom-Gill (CPMG) NMR
spectra from urine samples across db/db and db/+ mice were collected on a 700 MHz
Bruker DRX700 (Bruker BioSpin, GmbH) . Urine samples were stored at -80°C prior to
analysis. Thawed samples were aliquoted into phosphate buffer in D2O (deuterium
oxide, heavy water) and a solution containing internal NMR reference standard, 3-
trimethylsilyl-(2,2,3,3-2H4)-1-propionate, sodium salt (TSP) δH= 0 ppm, with sodium
azide was added. Urine volumes were 400µl where possible, or the total sample volume

84
if less. Buffered samples were used to minimize differences in shift and shape due to
second order coupling. NMR data was preprocessed beginning with automated
adjustment of the chemical shift of TSP to δH = 0 ppm, application of a semi-automated
phase correction, and automated baseline adjustment using an automated 0-2nd order
polynomial and reduction to histogram representations by binning using the method by
Forshed et al. (2002).
A bin width of 0.02 ppm was chosen with a 50% tolerance either side of the bin
boundary. NMR spectral regions associated with water (4.7-5.0 ppm), urea (5.5-6.1
ppm), TSP (-0.6-0.6 ppm), and baseline (9.3-10.0 ppm) were removed prior to data
processing. To normalize the data, bins were first ranked with respect to the total
intensity level (summation across individuals) and a normalization factor was calculated
(1 / ∑ central 50% sample intensities). The normalized intensity levels for each sample
were calculated through the multiplication of raw intensity values and normalization
factors. Bins associated with glucose (3.20-3.30, 3.37-3.57, 3.69-3.92, 4.63-4.7, 5.20-
5.30 ppm) were removed from the normalization factor calculation, but reintroduced for
statistical analysis.
5.3.3 LC-MS data
The data used in this study were positive polarity UPLC-MS datasets.
Chromatographic separations were achieved using an ACQUITYTM C18 (100x2.1mm
i.d., 1.7µm particle size) column (Waters Corporation, Milford, USA) on an
ACQUITYTM UPLC system (Waters). Mass spectrometry was performed on a Waters
LCT PremierTM (Waters MS Technologies, Manchester, UK) orthogonal acceleration
time-of-flight (oa-TOF) mass spectrometer operating in W optics mode. Peaks were

85
extracted from the LC-MS data using xcms (Smith et al., 2006). For this analysis, no
retention time correction was employed, and the default initialization parameters were
used with the exception of the full width at half maximum (fwhm) and bandwidth (bw),
which were each set to 5 scans. LC-MS peaks were normalized using the same technique
implemented for the NMR bins with the central 80% of peaks used to calculate the
normalization factor.
To confirm the putative assignments based on the method proposed by Gipson et
al. (2008), UPLC-MS/MS and spiking experiments of authentic metabolites were
performed. These experiments were performed on diluted urine and standard solutions
using a Waters Q-Tof PremierTM (Waters MS Technologies, Manchester, UK)
quadrupole, orthogonal acceleration time-of-flight tandem mass spectrometer operating
in V optics mode. See Chapter 4 or Gipson et al. (2008) for more details regarding MS
and MS/MS methods.
5.3.4 Microarray Data
Liver, adipose tissue, and gastrocnemius muscle were collected in 10-wk old
db/db and db/+ mice in Experiment 1 of this study. At the time of dissection, liver (100
to 200 mg), subcutaneous adipose tissue (100 to 350 mg) and gastrocnemius muscle (100
to 200 mg) were harvested, minced finely (1 to 3 mm) and placed into 5 to 10 volumes of
RNAlater™ (Ambion, Inc., Austin, TX). RNAlater™, an ammonium sulfate solution,
was used to prevent degradation of RNA during the experimental procedures. Samples
were stored on dry ice and transferred to a -80°C freezer until further processing.
Tissue from RNAlater™ stocks was weighed, transferred to Trizol reagent
(Invitrogen, Carlsbad, CA), and homogenized using the MixAMil system (Retsch, Haan,
86
Germany). RNAse-free water, chloroform, and the Trizol-tissue homogenate was spun in
a Phase Lock Gel (PLG) tube (VWR International, West Chester, PA). Clear aqueous
supernatant was recovered from the top layer of the PLG, transferred to RNAeasy Mini
columns (Qiagen Inc., Valencia, CA) and processed according to manufacturer’s
instructions. RNA samples were DNAse I treated as recommended. RNA integrity was
assessed by Optical Density (OD) ratios (Spectramax, Molecular Devices Corp.,
Sunnyvale, CA) and ribosomal quality as measured by the Agilent BioAnalyzer RNA
chips and software (Agilent Technologies Inc., Palo Alto, CA).
Five micrograms of mRNA was used for each sample. cDNA synthesis
(Invitrogen Carlsbad, CA) and in vitro transcription incorporating biotinylated
nucleotides (Enzo Biochem Inc. Farmingdale, NY) was carried out according to standard
operating procedures recommended by Affymetrix. Labeling quality was assessed by
cRNA yields and integrity as monitored by Agilent BioAnalyzer RNA chips and
software.
Hybridization cocktails containing 10 µg of representative sample cRNA were
loaded onto GeneChip® Mouse Genome 430A Array and hybridized overnight.
Genechips® were washed and scanned using Affymetrix fluidic stations and scanners.
Intensity data were captured by Genechip Computer Operating System (GCOS) using the
algorithm, MAS 5.0. An initial visual inspection of each chip was completed that
checked for uniform color, unexpected spots or scratches, and proper grid alignment.
Technical quality control (QC) of all microarray data was performed using the MAS 5.0
analysis software.
87
5.3.5 Statistical Analyses
All multiplicity correction in this study was performed by controlling for the false
discovery rate (FDR) as described by Benjamini and Hochberg (1995). Comparable
NMR data (8 week old mice) from Experiments 1 and 2 were evaluated for experimental
consistency. A Student’s t-test was used to identify significantly altered NMR bins for
each experiment independently and an ANOVA was performed using both disease status
and experiment date as independent variables.
Univariate and multivariate statistical methods were employed to compare data
across the metabolomic platforms. Principal components analysis (PCA) was used to
visualize the primary separations between individuals based on both the NMR bins and
LC-MS peaks. To determine the effect of disease, age, and their interaction on bins and
peaks, an ANOVA was performed with an FDR of 0.01.
5.3.6 Enrichment Analysis
Data from the Affymetrix MOE430a chip (22,690 gene probes) were normalized
using the MAS5 procedure prior to use in analyses. Genes with significantly altered
expression between db/db and db/+ mice were determined with univariate statistics (t-
test) followed by multiplicity correction. A FDR of 0.00002 was used that should result
in less than one false positive. An enrichment analysis of significantly altered genes was
performed using the Gene Ontology (GO) and Kyoto Encyclopedia of Genes and
Genomes (KEGG) databases (The Gene Ontology Consortium, 2000; Kanehisa et al.,
2006). Enrichment significance was calculated using the hypergeometric distribution
followed by multiple test correction with an FDR of 0.01.

88
LC-MS derived metabolite enrichment was performed based on a previous
finding that correlation supported assignments are of higher quality than mass only peak
assignments (Gipson et al., 2008). Pathway enrichment was calculated for each of the 27
(independent variableobserved change = 33) possible significance profiles from the ANOVA
(independent variable = disease, age, interaction; observed change = up, down,
unchanged) performed on the metabolomics data. Here, an enriched pathway is defined
as one with a statistically significant proportion of high quality assignments in a given
significance profile.
5.4 Results
5.4.1 NMR/LC-MS Platform Comparison
The datasets used in this analysis contain a large number of variables, making
multiple testing correction necessary for statistical interpretation. The binned NMR
datasets consisted of 169 discrete spectral regions of which 129 and 91 were significantly
altered (FDR = 0.001) in experiment 1 and 2, respectively. Of 70 bins that were
significantly altered in both experiments, 67 of the bins were statistically significant with
the same direction of change in both experiments. The ratio of bins with conflicting
directional change to significant bins for both experiments decreases with increasing
stringency of the significance threshold (Figure 5.1). An evaluation of the data at the
significance threshold (Figure 5.1) at which no discrepancies between significant bins
was seen (p = 10E-11) yields 55 bins altered in the same direction when the experiments
are analyzed independently. An ANOVA (FDR = 0.001), using both experiment and
disease status as independent variables, found that 50 bins were significantly influenced
by the experiment and 133 were significantly different based on receptor status.

89
Figure 5.1. Fraction of NMR bins significant in both experiments, yet with opposite directional changes.

90
Results from the NMR data and the LC-MS data collected during Experiment 2
were compared for platform consistency. Prior to inclusion in the analysis, technical
replicates of the LC-MS peaks were compared and peaks were used in the analysis only if
the difference between the 2 replicates was less than 10% of the higher intensity peak for
all samples. These inclusion criteria led to the retention of 1045 of 2723 peaks,
indicating that on average, over 98% of the peak technical replicates had a quantitative
error less than 10%.
PCA of the NMR and LC-MS datasets reveals that both platforms achieve
separation between db/db and db/+ mice in the first 2 components (Figure 5.2).
However, there are differences between the two platforms that lead to differential
separation of the db/db mice with respect to age. Specifically, while the LC-MS data
shows no separation at all in the first 2 principal components with respect to age, the
NMR data indicates a clear difference between the week 8 and older db/db mice.
Additionally, there appears to be a separation of week 20 db/db mice into two subgroups.

91
Figure 5.2. First principal components of the NMR and LC-MS datasets following standard normal transformation. black: db/db mice; grey: db/+ mice; square: 8 week old mice; circle: 12 week old mice; triangle: 20 week old mice.
92
The ANOVA results, using disease, age, and an interaction term as independent
variables and individual NMR bins or LC-MS peaks as dependent variables, indicates
that the two data platforms provide markedly different information (Table 5.1). This
analysis reveals that, while 38.4% of the data from the NMR platform and 32.6% of the
data from the LC-MS platform have a significant disease alteration, 56.1% of the NMR
bins and 13.2% of the LC-MS peaks have either a significant age or interaction term
component.
Investigation of the NMR PCA loadings reveals that the bins most responsible for
the separation of 20 week old db/db mice are associated with hippurate and m-
hydroxyphenylpropionic acid (m-HPPA). A plot of the intensity of hippurate as
quantified by the confirmed LC-MS peak and the NMR spectra (Figure 5.3) provides a
visual representation of the subpopulations present in the week 20, db/db mice.
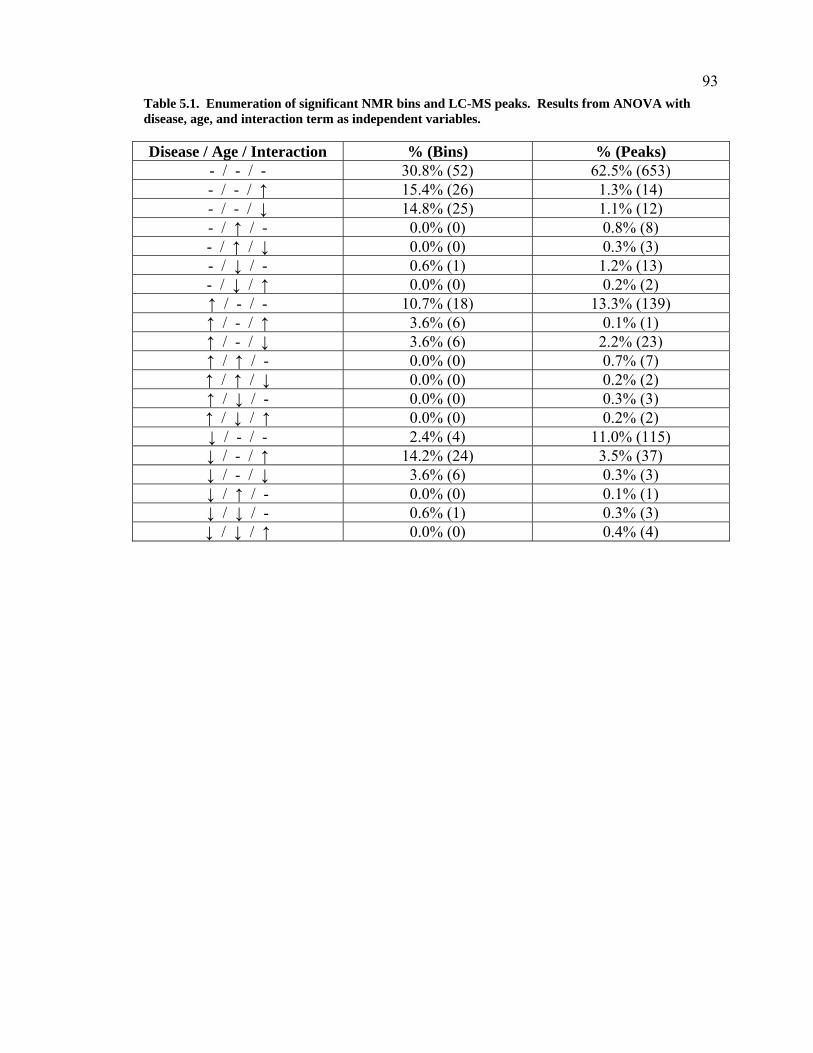
93
Table 5.1. Enumeration of significant NMR bins and LC-MS peaks. Results from ANOVA with disease, age, and interaction term as independent variables. Disease / Age / Interaction % (Bins) % (Peaks)
- / - / - 30.8% (52) 62.5% (653) - / - / ↑ 15.4% (26) 1.3% (14) - / - / ↓ 14.8% (25) 1.1% (12) - / ↑ / - 0.0% (0) 0.8% (8) - / ↑ / ↓ 0.0% (0) 0.3% (3) - / ↓ / - 0.6% (1) 1.2% (13) - / ↓ / ↑ 0.0% (0) 0.2% (2) ↑ / - / - 10.7% (18) 13.3% (139) ↑ / - / ↑ 3.6% (6) 0.1% (1) ↑ / - / ↓ 3.6% (6) 2.2% (23) ↑ / ↑ / - 0.0% (0) 0.7% (7) ↑ / ↑ / ↓ 0.0% (0) 0.2% (2) ↑ / ↓ / - 0.0% (0) 0.3% (3) ↑ / ↓ / ↑ 0.0% (0) 0.2% (2) ↓ / - / - 2.4% (4) 11.0% (115) ↓ / - / ↑ 14.2% (24) 3.5% (37) ↓ / - / ↓ 3.6% (6) 0.3% (3) ↓ / ↑ / - 0.0% (0) 0.1% (1) ↓ / ↓ / - 0.6% (1) 0.3% (3) ↓ / ↓ / ↑ 0.0% (0) 0.4% (4)

94
Figure 5.3. Mean centered, standard deviation normalized profile of hippurate stratified by disease status and age. black: db/db mice; grey: db/+ mice; square: 8 week old mice; circle: 12 week old mice; triangle: 20 week old mice; solid: LC-MS peak; open: deconvoluted NMR spectra (Gipson et al., 2006).

95
5.4.2 Validated LC-MS Peaks
Targeted analytical follow-up of the LC-MS peaks lead to the validation of 11
peak assignments exhibiting a variety of responses to the experimental conditions (Table
5.2). Of the validated peak assignments, glutamate is the only peak that did not meet the
technical reproducibility criteria. Visual inspection of the NMR resonances associated
with validated LC-MS peaks showed that the metabolite profiles were shared by both
platforms for trimethylamine-n-oxide (TMAO), creatine, carnitine, phenylalanine, and
phenylacetylglycine (PAG). The NMR profile of the other metabolites could not be
assessed due to resonance locations in an overly crowded spectral region (pantothenate)
or intensity levels below the limit of detection (pipecolate, glutamate, tryptophan, 5-
hydroxytryptophan (5HTP), adenosine, and cortisol).
5.4.3 Enrichment Analysis
The transcriptomics data indicates a tissue-specific impact of disease effects.
Muscle was least impacted with 1378 disease affected probes. Liver had twice as many
disease affected (2963) gene probes than muscle. Adipose tissue was the most
dramatically impacted, with respect to the number of altered gene probes, with 3700
disease affected probes. The GO process enrichment analysis of genes found with
significant differences between db/+ and db/db mice revealed 13 processes enriched in
liver, 9 processes enriched in adipose tissue, and 8 processes enriched in muscle (Table
5.3).

96
Table 5.2. Validated LC-MS peaks and results from ANOVA
m/z rt (min) Findings Validated ID 76.07629 0.59 db/db ↑, db/db ↓ with age TMAO 130.0859 0.77 ns Pipecolate 132.0773 0.62 db/db ↓, db/db ↑ with age Creatine 148.0611 0.87 db/db ↑ Glutamate 162.1127 0.60 db/db ↑ with age Carnitine 166.082 2.43 db/db ↑, db/db ↓ with age Phenylalanine 180.0662 4.38 complex Hippurate 194.0822 5.16 ns PAG 205.0981 3.49 db/db ↑ Tryptophan 220.1185 2.93 ns Pantothenate 221.093 1.87 db/db ↑, db/+ ↑ with age 5HTP 268.1065 1.86 db/db ↓ Adenosine 363.2163 8.55 db/db ↑ Cortisol
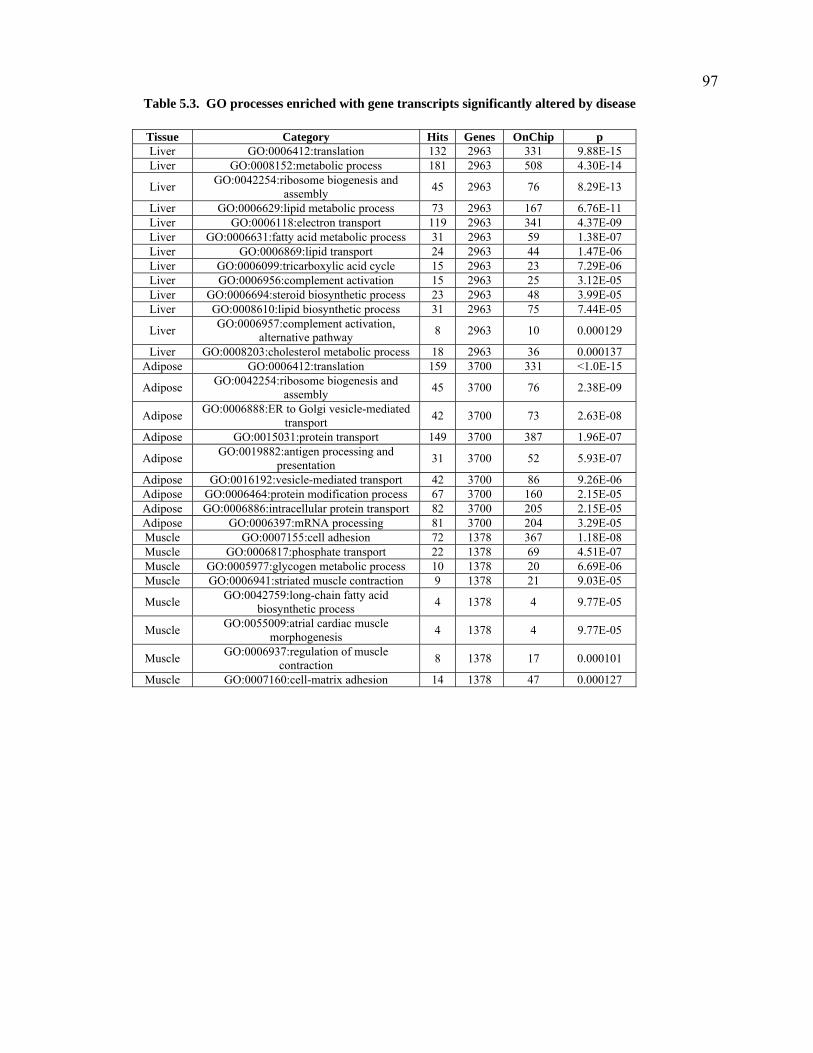
97
Table 5.3. GO processes enriched with gene transcripts significantly altered by disease Tissue Category Hits Genes OnChip p Liver GO:0006412:translation 132 2963 331 9.88E-15 Liver GO:0008152:metabolic process 181 2963 508 4.30E-14
Liver GO:0042254:ribosome biogenesis and assembly 45 2963 76 8.29E-13
Liver GO:0006629:lipid metabolic process 73 2963 167 6.76E-11 Liver GO:0006118:electron transport 119 2963 341 4.37E-09 Liver GO:0006631:fatty acid metabolic process 31 2963 59 1.38E-07 Liver GO:0006869:lipid transport 24 2963 44 1.47E-06 Liver GO:0006099:tricarboxylic acid cycle 15 2963 23 7.29E-06 Liver GO:0006956:complement activation 15 2963 25 3.12E-05 Liver GO:0006694:steroid biosynthetic process 23 2963 48 3.99E-05 Liver GO:0008610:lipid biosynthetic process 31 2963 75 7.44E-05
Liver GO:0006957:complement activation, alternative pathway 8 2963 10 0.000129
Liver GO:0008203:cholesterol metabolic process 18 2963 36 0.000137 Adipose GO:0006412:translation 159 3700 331 <1.0E-15
Adipose GO:0042254:ribosome biogenesis and assembly 45 3700 76 2.38E-09
Adipose GO:0006888:ER to Golgi vesicle-mediated transport 42 3700 73 2.63E-08
Adipose GO:0015031:protein transport 149 3700 387 1.96E-07
Adipose GO:0019882:antigen processing and presentation 31 3700 52 5.93E-07
Adipose GO:0016192:vesicle-mediated transport 42 3700 86 9.26E-06 Adipose GO:0006464:protein modification process 67 3700 160 2.15E-05 Adipose GO:0006886:intracellular protein transport 82 3700 205 2.15E-05 Adipose GO:0006397:mRNA processing 81 3700 204 3.29E-05 Muscle GO:0007155:cell adhesion 72 1378 367 1.18E-08 Muscle GO:0006817:phosphate transport 22 1378 69 4.51E-07 Muscle GO:0005977:glycogen metabolic process 10 1378 20 6.69E-06 Muscle GO:0006941:striated muscle contraction 9 1378 21 9.03E-05
Muscle GO:0042759:long-chain fatty acid biosynthetic process 4 1378 4 9.77E-05
Muscle GO:0055009:atrial cardiac muscle morphogenesis 4 1378 4 9.77E-05
Muscle GO:0006937:regulation of muscle contraction 8 1378 17 0.000101
Muscle GO:0007160:cell-matrix adhesion 14 1378 47 0.000127
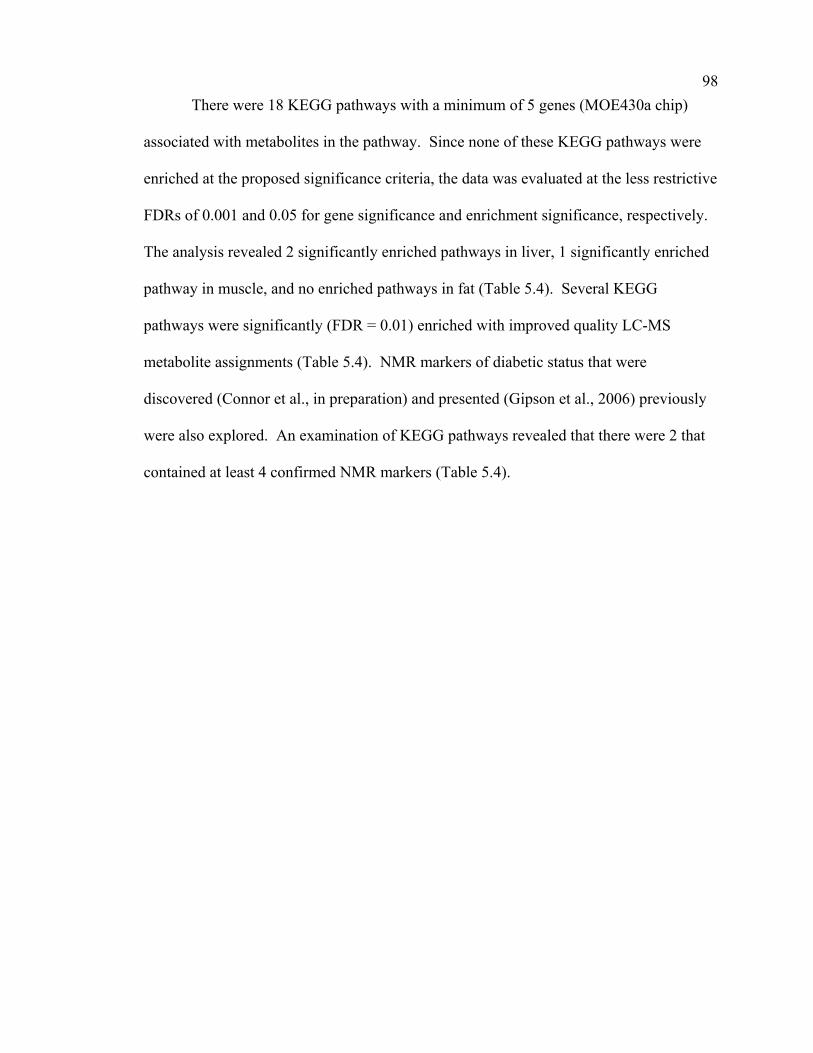
98
There were 18 KEGG pathways with a minimum of 5 genes (MOE430a chip)
associated with metabolites in the pathway. Since none of these KEGG pathways were
enriched at the proposed significance criteria, the data was evaluated at the less restrictive
FDRs of 0.001 and 0.05 for gene significance and enrichment significance, respectively.
The analysis revealed 2 significantly enriched pathways in liver, 1 significantly enriched
pathway in muscle, and no enriched pathways in fat (Table 5.4). Several KEGG
pathways were significantly (FDR = 0.01) enriched with improved quality LC-MS
metabolite assignments (Table 5.4). NMR markers of diabetic status that were
discovered (Connor et al., in preparation) and presented (Gipson et al., 2006) previously
were also explored. An examination of KEGG pathways revealed that there were 2 that
contained at least 4 confirmed NMR markers (Table 5.4).
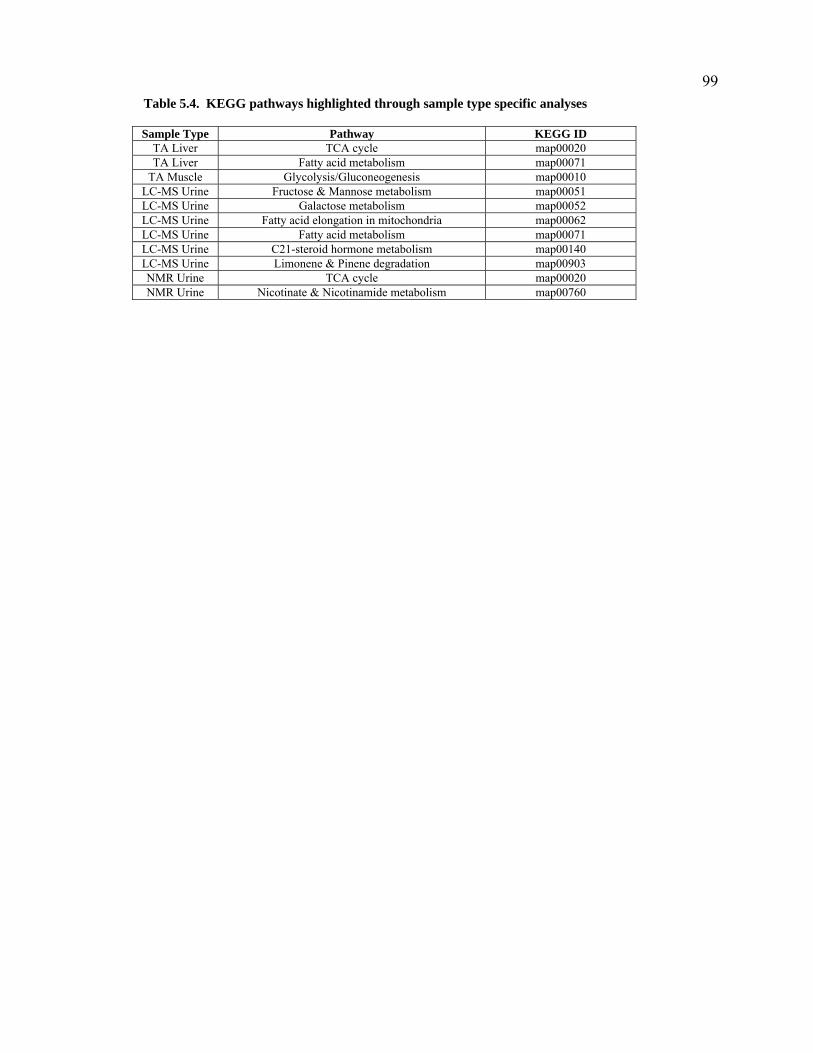
99
Table 5.4. KEGG pathways highlighted through sample type specific analyses Sample Type Pathway KEGG ID
TA Liver TCA cycle map00020 TA Liver Fatty acid metabolism map00071
TA Muscle Glycolysis/Gluconeogenesis map00010 LC-MS Urine Fructose & Mannose metabolism map00051 LC-MS Urine Galactose metabolism map00052 LC-MS Urine Fatty acid elongation in mitochondria map00062 LC-MS Urine Fatty acid metabolism map00071 LC-MS Urine C21-steroid hormone metabolism map00140 LC-MS Urine Limonene & Pinene degradation map00903 NMR Urine TCA cycle map00020 NMR Urine Nicotinate & Nicotinamide metabolism map00760
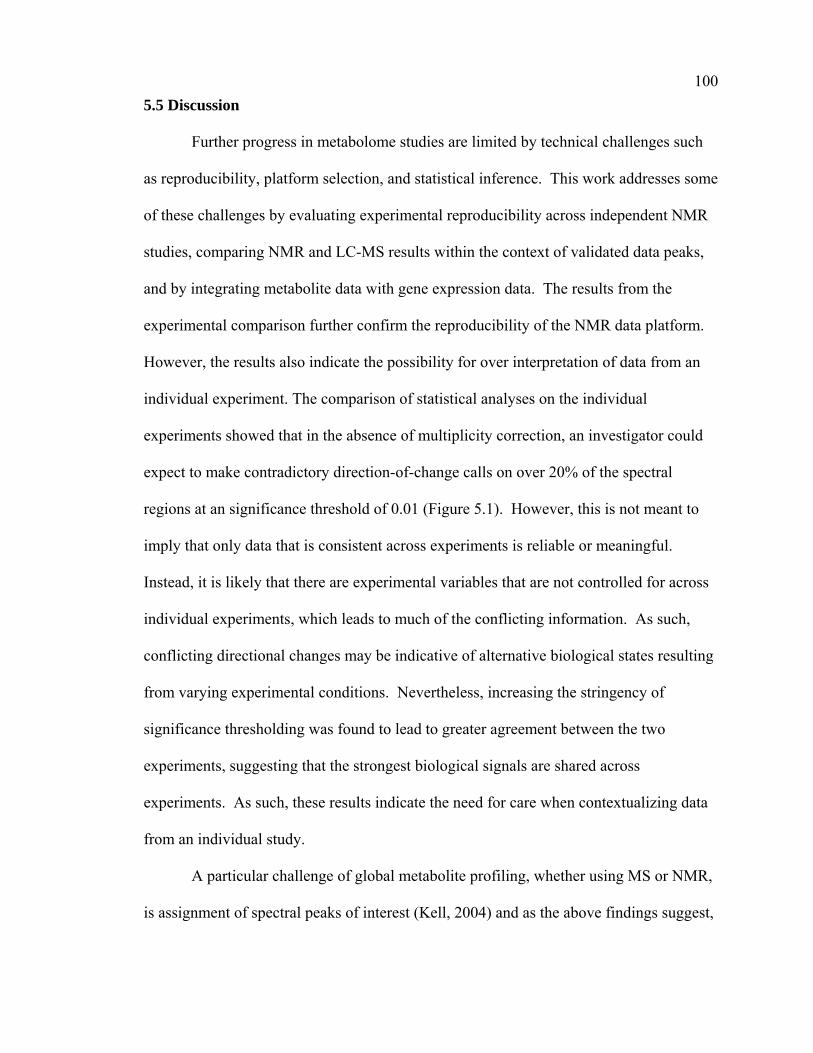
100
5.5 Discussion
Further progress in metabolome studies are limited by technical challenges such
as reproducibility, platform selection, and statistical inference. This work addresses some
of these challenges by evaluating experimental reproducibility across independent NMR
studies, comparing NMR and LC-MS results within the context of validated data peaks,
and by integrating metabolite data with gene expression data. The results from the
experimental comparison further confirm the reproducibility of the NMR data platform.
However, the results also indicate the possibility for over interpretation of data from an
individual experiment. The comparison of statistical analyses on the individual
experiments showed that in the absence of multiplicity correction, an investigator could
expect to make contradictory direction-of-change calls on over 20% of the spectral
regions at an significance threshold of 0.01 (Figure 5.1). However, this is not meant to
imply that only data that is consistent across experiments is reliable or meaningful.
Instead, it is likely that there are experimental variables that are not controlled for across
individual experiments, which leads to much of the conflicting information. As such,
conflicting directional changes may be indicative of alternative biological states resulting
from varying experimental conditions. Nevertheless, increasing the stringency of
significance thresholding was found to lead to greater agreement between the two
experiments, suggesting that the strongest biological signals are shared across
experiments. As such, these results indicate the need for care when contextualizing data
from an individual study.
A particular challenge of global metabolite profiling, whether using MS or NMR,
is assignment of spectral peaks of interest (Kell, 2004) and as the above findings suggest,
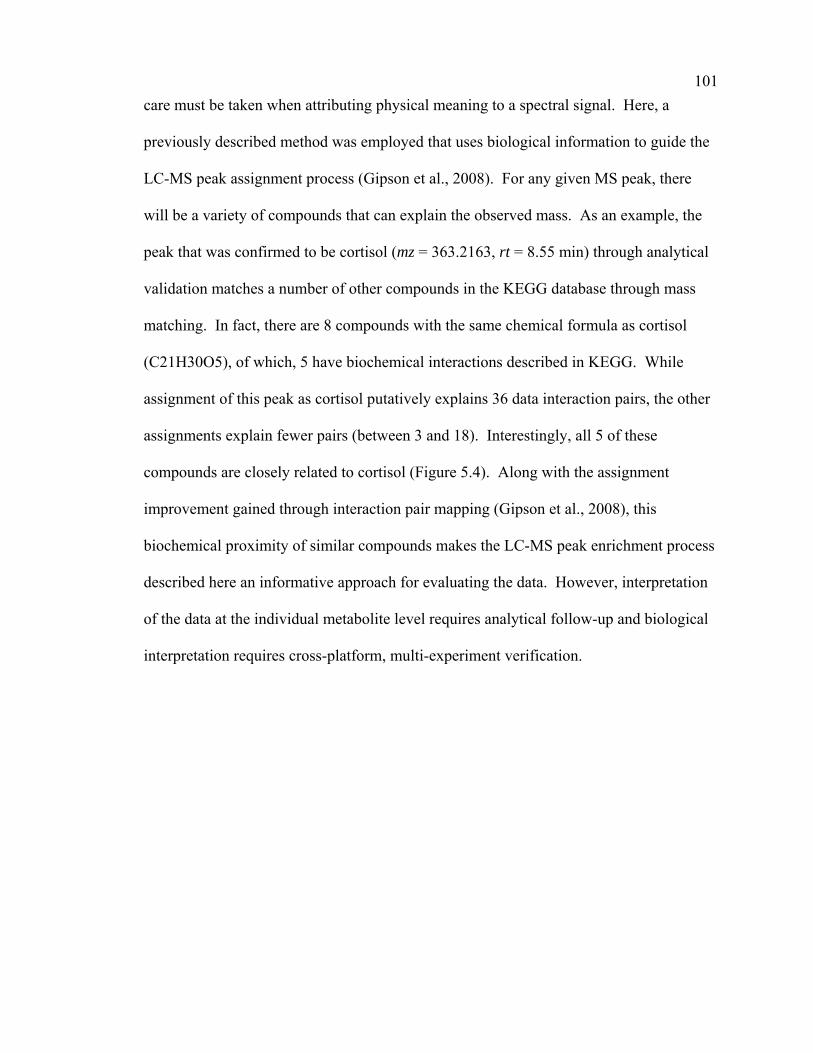
101
care must be taken when attributing physical meaning to a spectral signal. Here, a
previously described method was employed that uses biological information to guide the
LC-MS peak assignment process (Gipson et al., 2008). For any given MS peak, there
will be a variety of compounds that can explain the observed mass. As an example, the
peak that was confirmed to be cortisol (mz = 363.2163, rt = 8.55 min) through analytical
validation matches a number of other compounds in the KEGG database through mass
matching. In fact, there are 8 compounds with the same chemical formula as cortisol
(C21H30O5), of which, 5 have biochemical interactions described in KEGG. While
assignment of this peak as cortisol putatively explains 36 data interaction pairs, the other
assignments explain fewer pairs (between 3 and 18). Interestingly, all 5 of these
compounds are closely related to cortisol (Figure 5.4). Along with the assignment
improvement gained through interaction pair mapping (Gipson et al., 2008), this
biochemical proximity of similar compounds makes the LC-MS peak enrichment process
described here an informative approach for evaluating the data. However, interpretation
of the data at the individual metabolite level requires analytical follow-up and biological
interpretation requires cross-platform, multi-experiment verification.

102
Figure 5.4. Putative KEGG assignments associated with an LC-MS peak interaction pair which fit biochemical interaction criteria. This peak pair was algorithmically identified as belonging to a common instrumental cluster. Follow-up analytical chemistry validated the cortisol assignment of the C21H30O5 peak and confirmed that the C21H28O5 peak was a fragment of cortisol.

103
It is generally accepted that no one analytical technique provides a comprehensive
metabolic profile (Lenz and Wilson, 2006). Inspection of peak-bin correlation pairs for
the LC-MS peaks with validated assignments (data not shown) revealed that, with the
exception of hippurate, the highest correlation coefficients are not associated with bins
containing resonances from the metabolite of interest. This finding could be due to MS
detector response peculiarities (e.g. linear over a limited dynamic range) or the non-
specificity (i.e. contribution of resonances from multiple metabolites) of NMR bins with
a fixed width of 0.02 ppm. The fact that hippurate, which has a very strong signal in the
NMR data, showed a strong correlation between the validated peak and associated NMR
bins suggests that the non-specificity of the NMR bins is likely more culpable. This is
further supported by the fact that, when not precluded by the detection limit or crowded
spectral regions, visual inspection of the metabolite signals in NMR coincided well with
the LC-MS findings. The use of more exhaustive methods of spectral alignment and
intelligent binning would likely have led to a better correlation between NMR bins and
LC-MS peaks associated with common metabolites. However, manual data
preprocessing is prohibitively time consuming and even sophisticated automated methods
(Zhao et al., 2006) require some amount of spectral binning.
While cross-platform verification is a powerful approach for confirmation that the
interpretation of metabolomics data is accurate, as expected, it was found that the NMR
profile of several metabolites could not be assessed due to crowded spectral regions or
detection limit constraints. In highly proteinaceous biofluids (e.g. blood plasma or
serum), low molecular weight metabolites are often bound to protein, creating an NMR
analysis problem due to line-broadening and loss of visibility (Nicholson et al., 1995). In
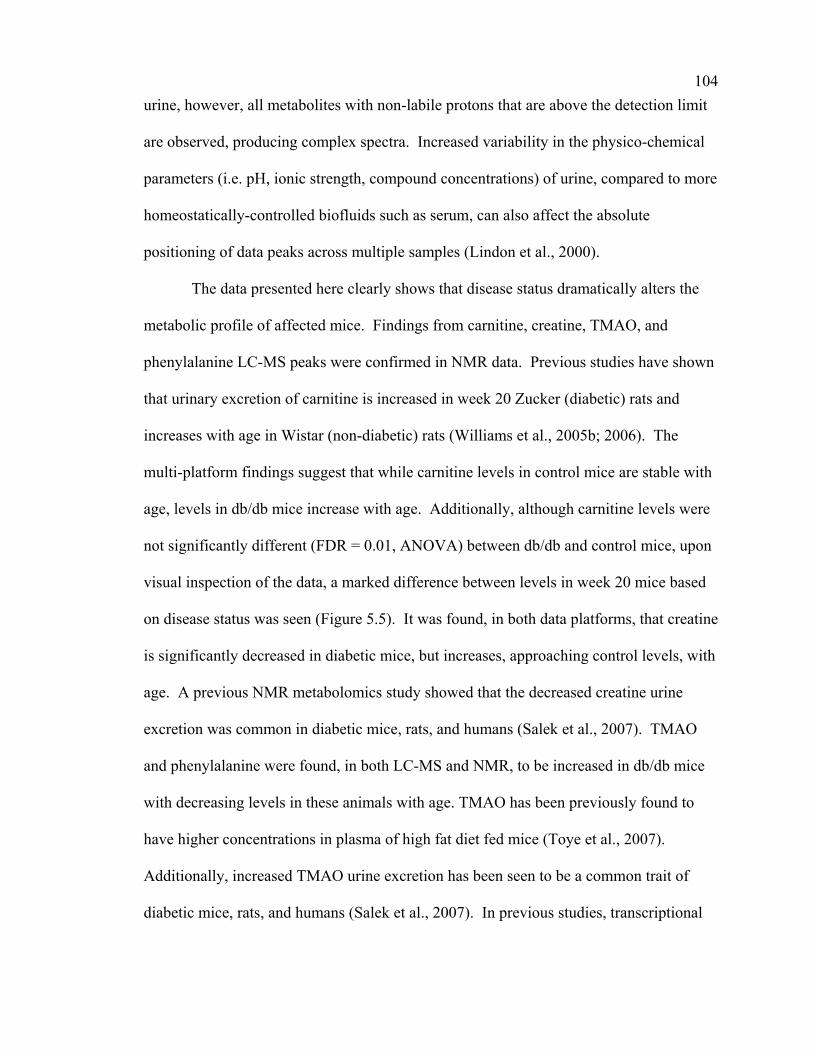
104
urine, however, all metabolites with non-labile protons that are above the detection limit
are observed, producing complex spectra. Increased variability in the physico-chemical
parameters (i.e. pH, ionic strength, compound concentrations) of urine, compared to more
homeostatically-controlled biofluids such as serum, can also affect the absolute
positioning of data peaks across multiple samples (Lindon et al., 2000).
The data presented here clearly shows that disease status dramatically alters the
metabolic profile of affected mice. Findings from carnitine, creatine, TMAO, and
phenylalanine LC-MS peaks were confirmed in NMR data. Previous studies have shown
that urinary excretion of carnitine is increased in week 20 Zucker (diabetic) rats and
increases with age in Wistar (non-diabetic) rats (Williams et al., 2005b; 2006). The
multi-platform findings suggest that while carnitine levels in control mice are stable with
age, levels in db/db mice increase with age. Additionally, although carnitine levels were
not significantly different (FDR = 0.01, ANOVA) between db/db and control mice, upon
visual inspection of the data, a marked difference between levels in week 20 mice based
on disease status was seen (Figure 5.5). It was found, in both data platforms, that creatine
is significantly decreased in diabetic mice, but increases, approaching control levels, with
age. A previous NMR metabolomics study showed that the decreased creatine urine
excretion was common in diabetic mice, rats, and humans (Salek et al., 2007). TMAO
and phenylalanine were found, in both LC-MS and NMR, to be increased in db/db mice
with decreasing levels in these animals with age. TMAO has been previously found to
have higher concentrations in plasma of high fat diet fed mice (Toye et al., 2007).
Additionally, increased TMAO urine excretion has been seen to be a common trait of
diabetic mice, rats, and humans (Salek et al., 2007). In previous studies, transcriptional
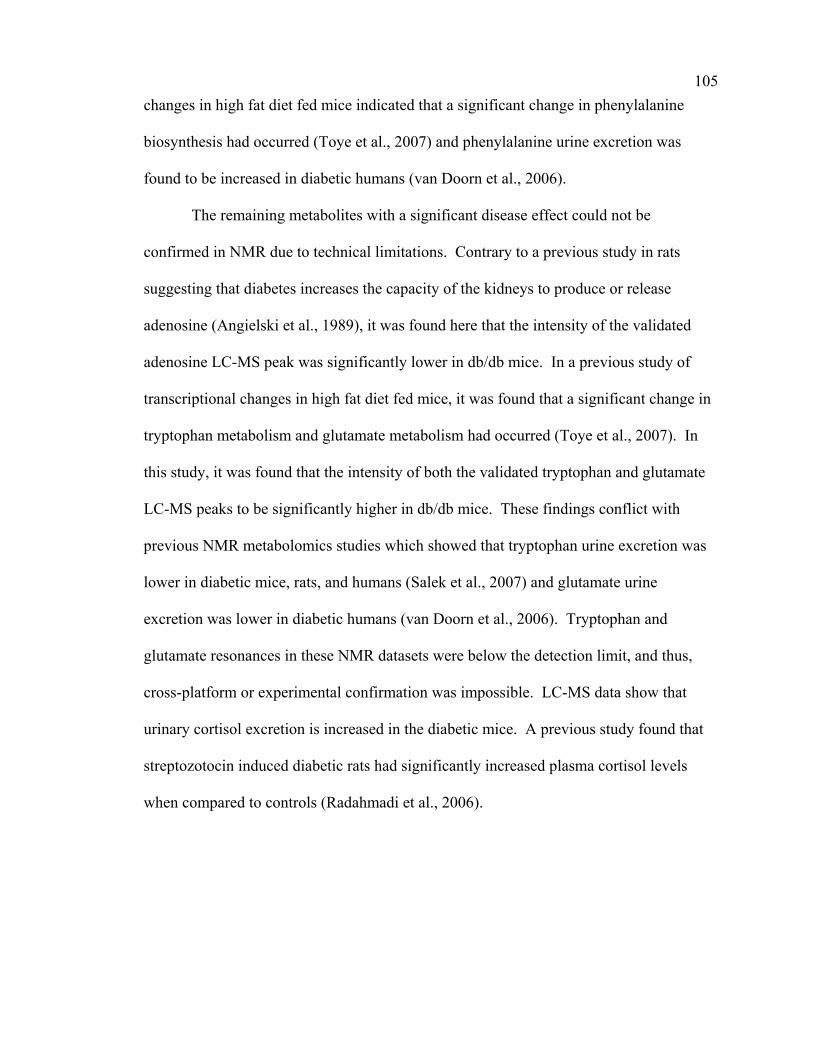
105
changes in high fat diet fed mice indicated that a significant change in phenylalanine
biosynthesis had occurred (Toye et al., 2007) and phenylalanine urine excretion was
found to be increased in diabetic humans (van Doorn et al., 2006).
The remaining metabolites with a significant disease effect could not be
confirmed in NMR due to technical limitations. Contrary to a previous study in rats
suggesting that diabetes increases the capacity of the kidneys to produce or release
adenosine (Angielski et al., 1989), it was found here that the intensity of the validated
adenosine LC-MS peak was significantly lower in db/db mice. In a previous study of
transcriptional changes in high fat diet fed mice, it was found that a significant change in
tryptophan metabolism and glutamate metabolism had occurred (Toye et al., 2007). In
this study, it was found that the intensity of both the validated tryptophan and glutamate
LC-MS peaks to be significantly higher in db/db mice. These findings conflict with
previous NMR metabolomics studies which showed that tryptophan urine excretion was
lower in diabetic mice, rats, and humans (Salek et al., 2007) and glutamate urine
excretion was lower in diabetic humans (van Doorn et al., 2006). Tryptophan and
glutamate resonances in these NMR datasets were below the detection limit, and thus,
cross-platform or experimental confirmation was impossible. LC-MS data show that
urinary cortisol excretion is increased in the diabetic mice. A previous study found that
streptozotocin induced diabetic rats had significantly increased plasma cortisol levels
when compared to controls (Radahmadi et al., 2006).
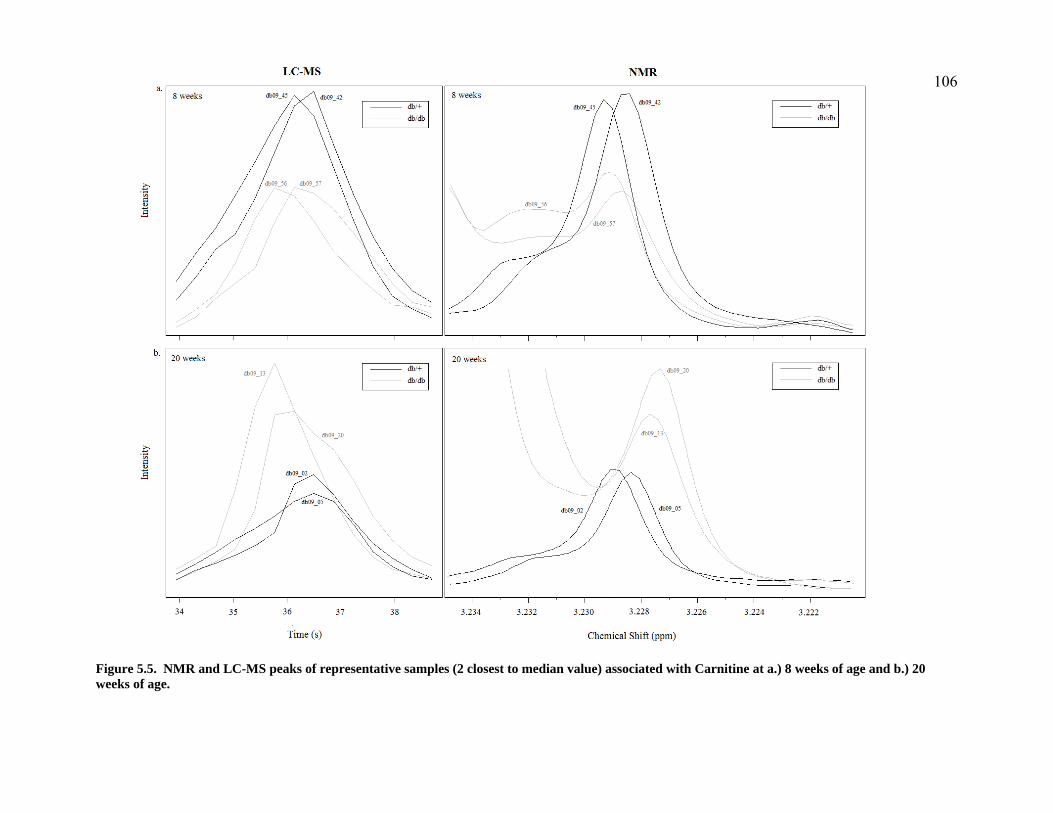
106
Figure 5.5. NMR and LC-MS peaks of representative samples (2 closest to median value) associated with Carnitine at a.) 8 weeks of age and b.) 20 weeks of age.

107
Hippurate was shown in this study to have complex behavior based on disease
status, age, and gut microflora. The impact that gut microflora can have on hippurate has
been previously demonstrated (Phipps et al., 1998; Williams et al., 2002) and may
explain the differences in metabolite excretion of the db/db mice at 20 weeks of age.
Hippurate urine excretion has been previously found to be both increased (van Doorn et
al., 2006) and decreased (Salek et al., 2007) in diabetic humans.
The current study examined urine metabolite profiles of diabetic db/db and
control db/+ mice over time. It is important to note that young db/db mice are
characterized by high levels of glucose and insulin, whereas older db/db mice have low
insulin levels likely due to β-cell exhaustion, and also eventually develop renal failure
(Sharma et al., 2003). These changes over time in the diabetes phenotype, as well as
changes in renal function, likely contribute significantly to the metabolite profiles
observed in the current study. For example, although not specifically assessed in the
current study, changes in renal function could account for the differences in metabolite
profiles within the db/db mice at 20 weeks of age. In addition, this difference in disease
phenotype with age in db/db mice may also account for various discrepancies in
individual metabolites between different studies.
In this study, PAG and pantothenate LC-MS peaks were found to be unaltered
over age and disease status. This finding was confirmed for PAG in NMR, but the
location of pantothenate resonances in crowded regions of spectra made confirmation
impossible. Both of these metabolites have been previously found to be decreased in the
urine of diabetic rats (Reibel et al., 1981; Salek et al., 2007).

108
Results from the analysis of biological processes from both the KEGG and GO
databases are consistent with prior information concerning diabetes and the db/db mouse
model. The pathways highlighted in this analysis via evaluation of significant genes,
improved assignment of LC-MS peaks or NMR derived markers exhibited both the
complementary and supportive nature of the different methods of inquiry. Similar to
previous findings in streptozotocin-induced diabetic rats (Lecker et al., 2004), glycolysis
was implicated in muscle through querying the KEGG database for significantly altered
transcripts. The nicotinate and nicotinamide metabolism KEGG pathway was found to
contain many confirmed NMR markers. Findings of increased or decreased metabolite
levels in this pathway appear to vary in the literature. The results of this study suggesting
the increase of urinary NMA are in disagreement with a recent cross-species NMR study
(Salek et al., 2007), yet the findings of increased 2PY and NMN are supported in this
same study. Elsewhere, NMN renal clearance (Thomas et al., 2003) and urinary
excretion (Sanada and Miyazaki, 1980) have been shown to be decreased in diabetic rat
models. Metabolite and liver enzyme levels associated with the TCA cycle and steroid
processes were found to be altered in db/db mice. The TCA cycle (Garland et al., 1968;
Harano et al., 1969; Large and Beylot, 1999) and steroid pathways (Djursing et al., 1982;
Semple et al., 1988; Atanasov and Odermatt, 2007) association with diabetes are well
known. Enzyme transcription in muscle and liver associated with fatty acid processing
was found to be altered in the diabetic mice, and the signal was also seen in the urinary
LC-MS peaks. The dysregulation of fatty acid metabolism is known to be influenced by
leptin and has been implicated with the development of insulin resistance in both the liver
and skeletal muscle (Shimabukuro et al., 1997; Delarue and Magnan, 2007).
109
5.6 Conclusions
In this study, both consistency and complementarity were found across multiple
experiments and analytical platforms in the pursuit of a better understanding of the
metabolic changes associated with the db/db mouse model of diabetes. At the data
feature level, agreement between 2 separate experiments increased with increasing
statistical stringency. At the individual metabolite level, carnitine, creatine, TMAO,
phenylalanine, and PAG were found to have temporal and disease status profiles in
agreement across the 2 metabolomic platforms. At the pathway level, it was found that
the TCA cycle, fatty acid metabolism, and steroidal processes to be highlighted by
multiple lines of evidence. Specifically, each of these pathways was implicated through
liver transcriptomics and either NMR or LC-MS metabolomics. Additionally, it was
found that at each level of investigation, there were findings specific to each experiment
and data platform. As such, multiple lines of evidence provide both a confirmatory and
complementary role in metabolic investigations.
110
CHAPTER 6: Summary & Conclusions 6.1 Summary
LC-MS and NMR are two of the most used data generation technologies for
mammalian metabolomics investigations (Dunn and Ellis, 2005). Both are associated
with signal complexity and interpretation difficulties, leading to a time consuming data
analysis process (Robertson, 2005). This work presents several novel approaches to
automated metabolomics data analyses, as well as a metabolic marker discovery study
aided by the described methods. The experiments conducted to find metabolites and
metabolic pathways altered in the db/db mouse are the first in which cross-platform
validation of exploratory biomarkers in this diabetic model are described. This work
contains a number of novel contributions to the field of metabolomics and diabetes
research.
Chapters 2 & 3 describe the novel approach and validation of using weighted
spectral features to improve the automated quantification and prediction of exploratory
biomarkers in NMR data from biofluid samples. To accomplish this goal, I created a
flexible interface in R for an existing R function that performs constrained, least-squares
fitting (Wood, 1994; 2000; 2004). The interface simplifies the import/export of NMR
metabolomics data for analysis with the pcls function. I then evaluated the performance
of the weighted approach against the unweighted approach using both simulated and
experimental datasets. I created the simulated datasets to approximate real biological
data output from NMR with input from an NMR expert from GlaxoSmithKline. The
experimental data was collected and validated by scientists at GlaxoSmithKline. I re-
analyzed the data using the described automated approach and compared the results to the
111
original validated results. The automated approach presented in this work, although
improved through the use of weighting, is not ideal for a number of reasons. The method
provides point estimates for individual metabolite level estimates. It would be useful if,
instead, a distribution of likely metabolite level estimates were provided. Additionally,
the absence of metabolites from the reference spectra database makes accurate estimation
extremely challenging. These shortcomings of the described approach could be
addressed through a Bayesian approach as more a priori information is made available.
Chapter 4 describes a novel approach for the assignment of MS-based
metabolomics data peaks. I developed the entire assignment algorithm. The current
implementation uses peak-picked output from the xcms R library as input, but the
algorithm can handle formatted peak data from any source. Validation of the method
required knowledge of the true identity of a number of data peaks. In order to
accomplish this, additional analytical chemistry (e.g. spiking experiments) was performed
to determine the identity of several data peaks. An LC-MS expert from GlaxoSmithKline
performed both the LC-MS data generation and the follow-up analytical chemistry
studies. The major drawbacks of this assignment approach are the incompleteness of
existing biochemical interaction databases and the scarcity of disease specific
experimental datasets. Together, these limitations prevent investigators from assigning
physical meaning to a large fraction of MS-based datasets and providing statistical
estimates of assignment reliability. With the improvement of biochemical interaction
databases and increased availability of metabolomics datasets, Bayesian methods can
provide the framework for addressing these challenges.

112
Chapter 5 describes the first metabolomics study on the db/db mouse model of
diabetes to provide cross-platform validated markers of disease and disease progression
for which few metabolomics studies are currently published. Additionally, the
experimental design of this study provided the opportunity for an important cross -
experiment and –platform coherence analysis, which is lacking in the literature.
Experimental protocol, animal handling, and data collection were performed by scientists
at GlaxoSmithKline. My contribution to this work, as first author on a manuscript in
preparation, was primarily in the design of statistical comparisons, data analysis, and
interpretation of biological relevancy. Chapter 5 describes multiple lines of evidence
converging to implicate alterations in the metabolic profile of the db/db mouse.
Specifically, cross-platform alterations at the pathway level were observed in the TCA
cycle, fatty acid metabolism, and steroidal processes. Each of these pathways were
implicated through liver transcriptomics and either NMR or LC-MS metabolomics.
6.2 Biological relevance of multi-platform metabolic markers
The strong signal of dysregulation in these pathways in the db/db diabetic mouse
model, as evidenced by multi-platform discovery, is not surprising. The TCA cycle
(Garland et al., 1968; Harano et al., 1969; Large and Beylot, 1999), fatty acid metabolism
(Delarue and Magnan, 2007), and steroid pathways (Djursing et al., 1982; Semple et al.,
1988; Atanasov and Odermatt, 2007) are widely known to be associated with diabetes.
Furthermore, the dysregulation of the TCA cycle (Wlodek and Gonzalez, 2003), fatty
acid metabolism (Shimabukuro et al., 1997), and glucocorticoid metabolism (Liu et al.,
2003; Masuzaki and Flier, 2003) are known to be influenced by leptin. The db/db mouse
model exhibits phenotypic traits associated with type 2 diabetes due to an autosomal

113
recessive defect in the leptin receptor gene (Chen and Wang, 2005). An examination of
the data at the molecular level reveals evidence of the interplay between metabolites and
the enzymes that mediate their reactions. In this section, I describe the biological
relevance of metabolic biomarkers discovered in the db/db dataset using the methods I
developed for LC-MS and NMR analysis. The biological relevance of these markers
supports their validity as indicators of diabetes and diabetes progression.
6.2.1 Fatty acid metabolism
As presented in Chapter 5 (Table 5.3), fatty acid metabolism was found to be
enriched with liver gene transcripts that were statistically altered (in either direction).
Additionally, fatty acid metabolism was enriched with high-quality putative assignments
of LC-MS peaks which were statistically significantly increased in db/db mice (Table
5.4). Examining the individual genes responsible for the pathway enrichment revealed a
statistically significant increase in the transcript levels of fatty acid metabolism
associated carnitine palmitoyltransferase (Cpt) in the liver of db/db mice. Cpt
enzymatically controls the reaction containing palmitoylcarnitine and carnitine (Kanehisa
et al., 2006). As described in Chapter 4 (Table 4.1), the assignment of the LC-MS data
peak associated with carnitine was analytically validated (Gipson et al., 2008) and it was
identified as a marker of disease progression in db/db mice (Table 5.2). Carnitine was
found to be lower than control levels at 8 weeks of age and above control levels at 20
weeks of age (Figure 5.5). Carnitine is responsible for the transport of long-chain fatty
acids from the cytosol into mitochondria and their subsequent oxidation and has been
previously associated with diabetes in humans (De Palo et al. 1981).

114
6.2.2 TCA cycle
As presented in Chapter 5 (Table 5.3), the TCA cycle was found to be enriched
with liver gene transcripts that were statistically altered (either direction). Additionally,
the TCA cycle was one of two pathways (Table 5.4) with 4 or more metabolite markers
validated from the investigated NMR dataset (Connor et al., in preparation; Gipson et al.,
2006). One of the enzymes in the TCA cycle (Kanehisa et al., 2006) which was
statistically significantly increased in db/db mice and contributed to the pathway
enrichment was fumarate hydratase (Fh1). Fh1 is the enzyme that controls the
conversion between malate and fumarate (Kanehisa et al., 2006). Malate and fumarate
are two of the four TCA cycle associated NMR validated metabolic markers and were
both found to be statistically significantly increased in db/db mice.
6.2.3 Steroid metabolism
As presented in Chapter 5 (Table 5.3), steroid and cholesterol processes were
found to be enriched with liver gene transcripts that were statistically altered (either
direction). Additionally, steroid metabolism was enriched with high-quality putative
assignments of LC-MS peaks which were statistically significantly decreased in db/db
mice (Table 5.4). Hydroxysteriod dehydrogenase 3B (HSD3B) transcript levels were
statistically significantly decreased in the liver of the db/db mice. HSD3B was associated
with the significant enrichment of the steroid biosynthetic process described in Chapter 5
and is the enzyme responsible for the conversion of 11β, 17α, 21-Trihydroxy-
pregnenolone to cortisol (Kanehisa et al., 2006). As described in Chapter 5 (Table 5.2),

115
the validated LC-MS peak associated with cortisol was found to be significantly
increased in db/db mice.
6.2.4 Pathway connectivity
A description of a series of reactions found in the glucose-stimulated insulin
secretion (GSIS) process provides a good starting point for conceptually linking all of the
metabolic, enzymatic, and pathway information presented above. Cpt activity leads to an
increase in fatty acid β-oxidation and the production of acetyl-CoA. Next, a portion of
the produced acetyl-CoA is converted into citrate and follows the TCA cycle, including
the conversion of fumarate to malate (with the help of Fh1) (Muoio and Newgard, 2006).
Another portion of the produced acetyl-CoA follows a different path to produce
cholesterol and then cortisol (Marks et al., 1996). A recent study describing a
thiazolidinedione (TZD) drug used for treatment of type 2 diabetes indicates that
enzymes in all three of the pathways highlighted here are affected by the peroxisome
proliferator-activated receptor-γ agonist (Wang et al., 2007) which is further evidence
that the pathway and metabolic markers we found are likely of diagnostic and/or
therapeutic importance. The authors also report that the observed down-regulation of
hydroxysteriod 11-β dehydrogenase has been previously reported as a treatment benefit
insofar as it leads to a subsequent decrease in cortisol (Berger et al., 2001).
6.3 Conclusions
Metabolomics is an important field of scientific inquiry which allows
investigators to characterize the metabolic profile of alternative phenotypic states in a
high-throughput manner. It is important, however, to understand that follow-up
analytical chemistry experiments are always required for the validation of the findings of

116
these studies. Furthermore, although metabolomics datasets can readily provide
discriminative markers, care must be taken to restrict the interpretation of the results
within the context of the experimental design. In order to prove the utility of a given
metabolite as a biomarker, the specificity of the marker to a particular phenotypic state
must be demonstrated through examination of data from many alternative phenotypes and
temporal profiles. Additionally, in order to extend our understanding of the biological
mechanisms leading to a particular metabolic profile, a series of focused, hypothesis
driven studies would be required. As such, the importance of metabolomics is that it
provides us with high-quality information to guide metabolic inquiries. This work has
outlined the development of informatics methods to explore and analyze NMR and LC-
MS metabolomics data and presented the results from a cross-platform study of the
metabolic changes associated with diabetes.
Each of the studies described here demonstrate that metabolic profiling datasets
only makes sense when interpreted alongside external, a priori information. This is due
to both the complexity of the biological processes under investigation and the open
profiling technologies used for data generation. Automated methods of interpretation are
critical for the systematic and efficient quantification and assignment of metabolite levels
in complex samples measured by both NMR and MS-based technologies. Both
automated methods described here are an example of the utilization of data specific
information (NMR – bin variance, LC-MS – peak correlations) within the context of
external information (NMR – reference spectra, LC-MS – biochemical interaction
database). Further, the integrated diabetes study indicates the need to contextualize
biological findings with findings from prior studies.

117
Due to the interplay between prior information and data specific information in
the field of metabolic profiling, there is a strong case to be made for the formalization of
external data inclusion into metabolomics data analysis procedures through Bayesian
statistics. In this way, external information can be standardized and treated as a priori
data which is to be conditioned by the experimental dataset under examination.
6.4 Future Directions
6.4.1 Estimation of NMR Metabolite Level Confidence Intervals
The preceding study in which differential weighting of NMR spectral regions
provided an improvement in point estimates of underlying metabolites is valuable as
more than just an incremental improvement upon previous approaches. It is also a
quantitative affirmation of the fact that information content is not uniformly distributed
throughout the frequency domain of the NMR spectra. This knowledge, as well as the
understanding that point estimates are insufficient descriptors of inferred metabolite
estimates, leads one to believe that a Bayesian framework is the appropriate means for
exploring NMR metabolomics data. A Bayesian model of metabolite levels responsible
for complex NMR spectra would allow for the incorporation of prior distributions of
metabolite levels and spectral location of signal contributing resonances. Due to the
complexity of the biological processes under investigation and the technical and physico-
chemical influences on NMR resonance location, at the present time, both of the prior
distributions would be speculative. However, as empirical evidence accumulates and
predictive models of biological and technical behavior improve, a priori knowledge will
also improve. Within this context, methodologies can be developed which will provide
118
quantitative information about the accuracy of the estimates of metabolite levels while
incorporating and explicitly tracking prior assumptions.
6.4.2 Bayesian Formalization of MS-based Metabolomics Assignment
Likewise, MS-based metabolomics would benefit through the application of
Bayesian methods. The work presented here demonstrates the improved assignment of
MS-based metabolomics peaks using information that is both internal (correlation
analyses) and external (previously described biochemical relationships) to a given
collected dataset. This work could be extended into a formal Bayesian statistical
framework that would make use of an ever growing knowledgebase of information, as
well as provide probabilistic information about assignment quality. An example of the
ability of a Bayesian framework to organize and incorporate prior information for the
assignment of MS-based metabolomics can be seen through examining the weights used
to score the various types of biochemical interactions.
Taking a Bayesian view of the use of a function of the probability of occurrence
for the biochemical interaction weights, as was done in Chapter 3, reveals that the
weighting scheme is both sensible and extensible upon gathering further information.
From this perspective, the goal is to know the probability of observing a significant
correlation (COR), given a particular biochemical relationship (LINKi). This conditional
probability can be represented mathematically with its Bayesian equivalent in the
following Equation:
p(COR | LINKi) = p(LINKi | COR) x p(COR) / p(LINKi) (Eq. 6.1)
In Chapter 3, significance thresholding of the correlation coefficients means that p(COR)
is reduced to an indicator variable of value 0 or 1. However, it should be noted that this

119
need not be the case within a Bayesian context. If p(COR)=0, then the both sides of Eq.
[6.1] reduce to 0. If p(COR)=1 then one is left with:
p(COR | LINKi) = p(LINKi | COR) / p(LINKi) (Eq. 6.2)
Next, if we take an uninformed view of p(LINKi | COR) and assume a uniform
distribution, then our conditional probability is a function of 1/ p(LINKi), where
p(LINKi) is equal to the probability of a particular biochemical relationship in the KEGG
database. By looking at the information in this way, we see that the sum of the negative
log(p) across all interaction types (assumes that multiple lines of evidence are
independent) and uniquely assigned nodes within the network (shown to be the best
performing weighting scheme in Chapter 3) is equivalent to calculating the probability
that the correlation matrix is generated by a particular biochemical network.
Additionally, validated assignments of MS-based metabolomics peaks provide a
priori knowledge that is an extremely strong basis to incorporate into metabolite
assignment software. Not only will these validated peaks provide strong assignments for
peaks in subsequent studies occupying the same spectral region, but they will also lead to
properly informed Bayesian priors for the p(LINKi | COR) term in Eq. [6.2].
6.4.3 Knowledgebase Development
It can be inferred from both the technical need for external information to guide
the assignment of metabolomics data and the cross -experimental and -platform analyses
presented in Chapter 4, that investigations utilizing metabolomics data cannot exist in
isolation from other studies. As such, the creation of databases for the storage and
handling of metabolomics data, such as the Human Metabolome Database (Wishart et al.,
2007), is a critical endeavor for the metabolomics community. In addition to providing

120
important information for the assignment, and therefore physical interpretation, of the
data, these databases will also provide the means to compare experimentally induced
metabolic reconfigurations across diseases and xenobiotic stressors.

121
LIST OF REFERENCES Angielski, S., Jakubowski, Z., Pawelczyk, T., Piec, G., and Redlak, M. (1989) Renal
handling and metabolism of adenosine in diabetic rats. Contrib. Nephrol., 73, 52-58.
Arkin, A., Shen, P., Ross, R. (1997) A test Case of Correlation Metric Construction of a
Reaction Pathway from Measurements. Science, 277, 1275-1279. Atanasov, A.G. and Odermatt, A. (2007) Readjusting the glucocorticoid balance: an
opportunity for modulators of 11beta-hydroxysteroid dehydrogenase type 1 activity? Endocr Metab Immune Disord Drug Targets, 7, 125-40.
Benjamini, Y. and Hochberg, Y. (1995) Controlling the False Discovery Rate: A
practical and Powerful Approach to Multiple Testing. J. R. Statist. Soc. B., 57, 289-300.
Berger, J., Tanen, M., Elbrecht, A. et al. (2001) Peroxisome proliferator-activated
receptor-gamma ligands inhibit adipocyte 11beta-hydroxysteroid dehydrogenase type 1 expression and activity. J. Biol. Chem., 276, 12629-12635.
Breitling, R., Ritchie, S., Goodenowe, D., Stewart, M.L., and Barrett, M.P. (2006a) Ab
initio prediction of metabolic networks using Fourier transform mass spectrometry data. Metabolomics, 2, 155-164.
Breitling, R., Pitt, A.R., and Barrett, M.P. (2006b) Precision mapping of the metabolome.
Trends Biotechnol., 24, 543-548. Buetow, K.H., Edmonson, M., MacDonald, R., Clifford, R., Yip, P., Kelley, J., Little,
D.P., Strausberg, R., Koester, H., Cantor, C.R., and Braun, A. (2001) High-throughput development and characterization of a genomewide collection of gene-based single nucleotide polymorphism markers by chip-based matrix-assisted laser desorption/ionization time-of-flight mass spectrometry. PNAS, 98, 581-584.
Chatterjee, M., Mohapatra, S., Ionan, A., Bawa, G., Ali-Fehmi, R., Wang, X., Nowak, J.,
Ye, B., Nahhas, A., Lu, K., Witkin, SS., Fishman, D., Munkarah, A., Morris, R., Levin, N.K., Shirley, N.N., Tromp, G., Abrams, J., Draghici, S., and Tainsky, M.A. (2006) Diagnostic Markers of Ovarian Cancer by High-Throughput Antigen Cloning and Detection on Arrays. Cancer Research, 66, 1181-1190.
Chen, D., and Wang, M. (2005) Development and application of rodent models for type
2 diabetes. Diabetes, Obesity, and Metabolism, 7, 307-317.

122
Chenomx, Inc. http://www.chenomx.com Cloarec, O., Dumas, M., Craig, A., Barton, R.H., Trygg, J., Hudson, J., Blancher, C.,
Gauguier, D., Lindon, J.C., Holmes, E., and Nicholson, J. (2005) Statistical Total Correlation Spectroscopy: An Exploratory Approach for Latent Biomarker Identification from Metabolic 1H NMR Data Sets. Anal. Chem., 77, 1282-1289.
Connor, S.C., et al. (in preparation). Crockford, D.J., Keun, H.C., Smith, L.M., Holmes, E., and Nicholson, J.K. (2005)
Curve-Fitting Method for Direct Quantitation of Compounds in Complex Biological Mixtures Using 1H NMR: Application in Metabonomic Toxicology Studies. Anal. Chem., 77, 4556-4562.
Crockford, D.J., Holmes, E., Lindon, J.C., Plumb, R.S., Zirah, S., Bruce, S.J., Rainville,
P., Stumpf, C.L., and Nicholson, J.K. (2006) Statistical Heterospectroscopy, an Approach to the Integrated Analysis of NMR and UPLC-MS Data Sets: Application in Metabonomic Toxicology Studies. Anal. Chem., 78, 363-371.
De Palo, E., Gatti, R., Sicolo, N., Padovan, D., Vettor, R., and Federspil, G. (1981)
Plasma and urine free L-Carnitine in human diabetes mellitus. Acta Diabetologica., 18, 91-95.
Delarue, J., and Magnan, C. (2007) Free fatty acids and insulin resistance. Curr. Opin.
Clin. Nutr. Metab. Care, 10, 142-1488. Dettmer, K., Aronov, P.A., and Hammock, B.D. (2007) Mass Spectrometry-Based
Metabolomics. Mass Spectrom. Rev., 26, 51-78. Djursing H., Nyholm, H.C., Hagen, C., Carstensen, L., and Pedersen, L.M. (1982)
Clinical and hormonal characteristics in women with anovulation and insulin-treated diabetes mellitus. American Journal of Obstetrics and Gynecology, 143, 876–882.
Dunn, W.B. and Ellis, D.E. (2005) Metabolomics: Current analytical platforms and
methodologies, Trend. Anal. Chem., 24, 285-294. Eads, C.D., Furnish, C.M., Noda, I., Juhlin, K.D., Cooper, D.A., and Morrall, S.W.
(2004) Molecular Factor Analysis Applied to Collections of NMR Spectra. Anal. Chem., 76, 1982-1990.
Fiehn, O. (2001) Combining genomics, metabolome analysis, and biochemical modeling
to understand metabolic networks. Comp. Func. Genom., 2, 155–168.

123
Forshed, J., Andersson, F.O., and Jacobsson, S.P. (2002) NMR and Bayesian regularized neural network regression for impurity determination of 4-aminophenol, J. Pharmaceut. Biomed., 29, 495-505.
Forster, J., Gomber, A.K., Nielsen, J. (2002) A Functional Genomics Approach Using
Metabolomics and In Silico Pathway Analysis. Biotechnol. Bioeng., 79, 703-712. Garland, P.B., Shepherd, D., Nicholls, D.G., and Ontko, J. (1968) Energy-dependent
control of the tricarboxylic acid cycle by fatty acid oxidation in rat liver mitochondria. Adv. Enzyme Regul., 6, 3-30.
Gipson, G.T., Tatsuoka, K.S., Sweatman, B.C., and Connor, S.C. (2006) Weighted
least-squares deconvolution method for discovery of group differences between complex biofluid 1H NMR spectra. Journal of Magnetic Resonance, 183, 269-277.
Gipson, G.T., Tatsuoka, K.S., Sokhansanj, B.A., Ball, R.J., and Connor, S.C. (2008)
Assignment of MS-based metabolomics datasets via compound interaction pair mapping. Metabolomics. 4:94-103.
Gipson, G.T., Tatsuoka, K.S., Ball, R.J., Sokhansanj, B.A., Hansen, M.K., Ryan, T.E.,
Hodson, M.P., Sweatman, B.C., and Connor, S.C. Multi-platform Investigation of the Metabolome in a Leptin Receptor Defective Murine Model of Type 2 Diabetes. (in preparation)
Goto, S., Nishioka, T., and Kanehisa, M. (1998) "LIGAND: Chemical Database for
Enzyme Reactions", Bioinformatics, 14, 591-599. Griffin, J.L. and Bollard, M.E. (2004) Metabolomics: Its Potential as a Tool in
Toxicology for Safety Assessment and Data Integration. Current Drug Metabolism, 5, 389-398.
Halket, J.M., Waterman, D., Przyborowska, A.M., Patel, R.K.P., Fraser, P.D., and
Bramely, P.M. (2005) Chemical derivatization and mass spectral libraries in metabolic profiling by GC/MS and LC/MS/MS. Journal of Experimental Botany, 56, 219-243
Harano, Y., DePalma, R.G., and Miller, M. (1969) Fatty acid oxidation, citric acid cycle
activity, and morphology of mitochondria in diabetic rat liver. Proc. Soc. Exp. Biol. Med., 131, 913-917.
Hollywood, K., Brison, D.R., and Goodacre, R. (2006) Metabolomics: Current
technologies and future trends. Proteomics, 6, 4716-4723. International Diabetes Federation. (2005) Diabetes Atlas. http://www.eatlas.idf.org/

124
Jansen, J.J., Hoefsloot, H.C.J., Boelens, H.F.M., van der Greef, J., and Smilde, A.K. (2004) Analysis of longitudinal metabolomics data. Bioinformatics, 20, 2438-2446.
Kanehisa, M., Goto, S., Hattori, M., Aoki-Kinoshita, K.F., Itoh, M., Kawashima, S.,
Katayama, T., Araki, M., and Hirakawa, M. (2006) From genomics to chemical genomics: new developments in KEGG. Nucleic Acids Res., 34, D354-357
Kell, D.B. (2004) Metabolomics and systems biology: making sense of the soup. Curr.
Opin. Microbiol., 7, 296-307. Keun, H.C., Ebbels, T.M.D, Antti, H., Bollard, M.E., Beckonert, O., Schlotterbeck, G.,
Senn, H., Niederhauser, U., Holmes, E., Lindon, J.C., and Nicholson, J.K. (2002) Analytical Reproducibility in 1H NMR-Based Metabonomic Urinalysis. Chem. Res. Toxicol., 15, 1380-1386.
Kind, T., and Fiehn, O. (2006) Metabolomic database annotations via query of elemental
compositions: Mass accuracy is insufficient even at less than 1 ppm. BMC Bioinformatics, 7, 234.
Kopka, J., Schauer, N., Krueger, S., Birkemeyer, C., Usadel, B., Bergmuller, E.,
Dormann, P., Weckwerth, W, Gibon, Y., Stitt, M., Willmitzer, L., Fernie, A.R., and Steinhauser, D. (2005). [email protected]: the Golm Metabolome Database. Bioinformatics, 21, 1635-1638.
Ladroue, C., Howe, F.A., Griffiths, J.R., and Tate, A.R. (2003) Independent Component
Analysis for Automated Decomposition of In Vivo Magnetic Resonance Spectra. Magn. Reson. Med., 50, 697-703.
Large, V. and Beylot, M. (1999) Modifications of citric acid cycle activity and
gluconeogenesis in streptozotocin-induced diabetes and effects of metformin. Diabetes, 48, 1251-7.
Lanckriet, G.R.G., Bie, T.D., Cristianini, N., Jordan, M.I., and Noble, W.S. (2004) A
statistical framework for genomic data fusion. Bioinformatics, 20, 2626-2635. Lecker, S.H., Jagoe, R.T., Gilbert, A., Gomes, M., Baracos, V., Bailey, J., Price, S.R.,
Mitch, W.E., Goldberg, A.L. (2004) Multiple types of skeletal muscle atrophy involve a common program of changes in gene expression. FASEB J., 18, 39-51.
Lefebvre, B. Technical Note: Intelligent Bucketing for Metabonomics.
http://www.acdlabs.com/download/technotes/80/nmr/intelli_bucket.pdf

125
Lenz, E.M., Bright, J., Knight, R., Wilson, I.D., and Major, H. (2004a) A metabonomic investigation of the biochemical effects of mercuric chloride in the rat using 1H NMR and HPLC-TOF/MS: time dependant changes in the urinary profile of endogenous metabolites as a result of nephrotoxicity. The Analyst, 129, 535-541.
Lenz, E.M., Bright, J., Knight, R., Wilson, I.D., and Major, H. (2004b) Cyclosporin A-
induced changes in endogenous metabolites in rat urine: a metabonomic investigation using high field 1H NMR spectroscopy, HPLC-TOF/MS and chemometrics. J. Pharm. Biomed. Anal., 35, 599-608.
Lenz, E.M. and Wilson, I.D. (2006) Analytical Strategies in Metabonomics. Journal of
Proteome Research, 6, 443-458. Lindon, J.C., Nicholson, J.K., Holmes, E., and Everett, J.R. (2000) Metabonomics:
Metabolic Processes Studied by NMR Spectroscopy of Biofluids. Concepts Magn. Reson. 12, 289-320.
Lindon, J.C., Holmes, E., Bollard, M.E., Stanley, E.G., and Nicholson, J.K. (2004)
Metabolomics technologies and their applications in physiological monitoring, drug safety assessment and disease diagnosis. Biomarkers, 9, 1-31.
Liu, Y., Nakagawa, Y., Wang, Y., Li, R., Li, X., Ohzeki, T., and Friedman, T.C. (2003)
Leptin Activation of Corticosterone Production in Hepatocytes May Contribute to the Reversal of Obesity and Hyperglycemia in Leptin-Deficient ob/ob Mice. Diabetes, 52, 1409-1416.
Marks, D.B., Marks, A.D., and Smith, C.M. (1996) Basic Medical Biochemistry: A
Clinical Approach. Lippincott, Williams, and Wilkins. Baltimore, MD, USA. Masuzaki, H. and Flier, J.S. (2003) Tissue-Specific Glucocorticoid Reactivating
Enzyme, 11β-Hydroxysteoid Dehydrogenase Type 1 (11β-HSD1) – A Promising Drug Target for the Treatment of Metabolic Syndrome. Curr. Drug Targets Immune Endocr. Metabol. Disord., 3, 255-62.
Mendes, P. (2002) Emerging bioinformatics for the metabolome. Brief. Bioinform., 3,
134-145. Muoio, D.M., and Newgard, C.B. (2006) Obesity-Related Derangements in Metabolic
Regulation. Annu. Rev. Biochem., 75, 367-401. Nicholson, J.K., Foxall, P.J.D., Spraul, M., Farrant, R.D., and Lindon, J.C. (1995) 750
MHz 1H and 1H-13C NMR Spectroscopy of Human Blood Plasma. Anal. Chem., 67, 793-811.
126
Phipps, A.N., Stewart, J., Wright, B., and Wilson, I.D. (1998) Effect of diet on the urinary excretion of hippuric acid and other dietary-derived aromatics in rat. A complex interaction between diet, gut microflora and substrate specificity. Xenobiotica, 28, 527-537.
Provencher, S.W. (1993) Estimation of Metabolite Concentrations from Localized in
Vivo Proton NMR Spectra. Magn. Reson. Med., 30, 672-679. Provencher, S.W. (2001) Automatic quantitation of localized in vivo 1H spectra with
LCModel. NMR Biomed., 14, 260-264. R Development Core Team. R Foundation for Statistical Computing, Vienna, Austria,
2005. Radahmadi, M., Shadan, F., Karimian, S.M., Sadr, S.S., and Nasimi, A. (2006) Effects
of stress on exacerbation of diabetes mellitus, serum glucose and cortisol levels and body weight in rats. Pathophysiology, 13, 51-55.
Reibel, D.K., Wyse, B.W., Berkich, D.A., Palko, W.M., and Neely, J.R. (1981) Effects
of diabetes and fasting on pantothenic acid metabolism in rats. Am. J. Physiol. Endocrinol. Metab., 240, 597-601.
Robertson, D.G. (2005) Metabolomics in Toxicology: A review. Toxicological
Sciences, 85, 809-822. Salek, R.M., Maguire, M.L., Bentley, E., Rubtsov, D.V., Hough, T., Cheeseman, M.,
Nunez, D., Sweatman, B.C., Haselden, J.N., Cox, R.D., Connor, S.C., and Griffin, J.L. (2007) A metabolomics comparison of urinary changes in type 2 diabetes in mouse, rat, and human. Physiol. Genomics, 29, 99-108.
Sanada H, and Miyazaki M. (1980) Regulation of tryptophan-niacin metabolism by
hormones. J. Nutr. Sci. Vitaminol. (Tokyo), 26, 617-27. Sandusky, P. and Raftery, D. (2005) Use of Semiselective TOCSY and the Pearson
Correlation for the Metabonomic Analysis of Biofluid Mixtures: Application to Urine. Anal. Chem., 77, 7717-7723.
Scholz, M., Gatzek, S., Sterling, A., Fiehn, O., and Selbig, J. (2004) Metabolite
fingerprinting: detecting biological features by independent component analysis. Bioinformatics, 20, 2447-2454.
Semple, C.G., Gray, C.E., and Beastall, G.H. (1988) Androgen levels in men with
diabetes mellitus. Diabetic Medicine, 5, 122–125. Sharma, K., McCue, P., and Dunn, S.R. (2003) Diabetic kidney disease in the db/db
mouse. Am. J. Phisiol. Renal Physiol., 284, 1138-1144.
127
Shimabukuro, M., Koyama, K., Chen, G., Wang, M.Y., Trieu, F., Lee, Y., Newgard,
C.B., and Unger, R.H. (1997) Direct antidiabetic effect of leptin through triglyceride depletion of tissues. Proc. Natl. Acad. Sci., 94, 4637-4641.
Smilde, A.K., van der Werf, M.J., Bijlsma, S., van der Werff-van der Vat, B.J.C., and
Jellema, R.H. (2005) Fusion of Mass Spectrometry-Based Metabolomics Data. Anal. Chem., 77, 6729-6736.
Smith, C.A., Want, E.J., O’Maille, G., Abagyan, R., and Siuzdak, G. (2006) XCMS:
Processing Mass Spectrometry Data for Metabolite Profiling Using Nonlinear Peak Alignment, Matching, and Identification. Anal. Chem., 78, 779-787.
Steuer, R., Kurths, J., Fiehn, O., and Weckwerth, W. (2003a) Observing and interpreting
correlations in metabolomic networks. Bioinformatics, 19, 1019-1026. Steuer, R., Kurths, J., Fiehn, O., and Weckwerth, W. (2003b) Interpreting correlations in
metabolomic networks. Biochem. Soc. Trans., 31, 1476-1478. Steuer, R. (2006) On the analysis and interpretation of correlations in metabolomic data.
Brief. Bioinform., 7, 151-158. Stoyanova, R., Nicholls, A.W., Nicholson, J.K., Lindon, J.C., Brown, T.R. (2004a)
Automatic alignment of individual peaks in large high-resolution spectral data sets. J. Magn. Res., 170, 329-335.
Stoyanova, R., Nicholson, J.K., Lindon, J.C., and Brown, T.R. (2004b) Sample
Classification Based on Bayesian Spectral Decomposition of Metabonomic NMR Data Sets. Anal. Chem., 76, 3666-3674.
The Gene Ontology Consortium. (2000) Gene Ontology: tool for the unification of
biology. Nature Genet., 25, 25-29. Thomas, M.C., Tikellis, C., Burns, W.C., Thallas, V., Forbes, J.M., Cao, Z., Osicka,
T.M., Russo, L.M., Jerums, G., Ghabrial, H., Cooper, M.E., and Kantharidis, P. (2003) Reduced tubular cation transport in diabetes: prevented by ACE inhibition. Kidney Int., 63, 2152-61.
Toye, A.A., Dumas, M.E., Blancher, C., Rothwell, A.R., Fearnside, J.F., Wilder, S.P.,
Bihoreau, M.T., Cloarec, O., Azzouzi, I., Young, S., Barton, R.H., Holmes, E., McCarthy, M.I., Tatoud, R., Nicholson, J.K., Scott, J., and Gauguier, D. (2007) Subtle metabolic and liver gene transcriptional changes underlie diet-induced fatty liver susceptibility in insulin-resistant mice. Diabetologia, 50, 1867-1879.
Trbovic, N., Dancea, F., Langer, T., and Gunther, U. (2005) Using wavelet de-noised
spectra in NMR screening. J. Magn. Reson., 173, 280-287.
128
van der Greef, J., Martin, S., Juhasz, P., Adourian, A., Plasterer, T., Verheij, E.R., and
McBurney, R.N. (2007) The Art and Practice of Systems Biology in Medicine: Mapping Patterns of Relationships. J. Proteome Res., 6, 1540-1559.
van Doorn, M., Vogels, J., Tas, A., van Hoogdalem, E.J., Burggraaf, J., Cohen, A., and
van der Greef, J. (2006) Evaluation of metabolite profiles as biomarkers for the pharmacological effects of thiazolidinediones in Type 2 diabetes mellitus patients and healthy volunteers. British Journal of Clinical Pharmacology, 63, 562-574.
Wang, P., Renes, J., Bouwman, F., Bunschoten, A., Mariman, E., and Keijer, J. (2007)
Absence of an adipogenic effect of rosiglitazone on mature 3T3-L1 adipocytes: increase of lipid catabolism and reduction of adipokine expression. Diabetologia, 50, 654-665.
Want, E.J., Cravatt, B.F., and Siuzdak, G. (2005) The Expanding Role of Mass
Spectrometry in Metabolite Profiling and Characterization. ChemBioChem, 6, 1941-1951.
Williams, R.E., Eyton-Jones, H.W., Farnworth, M.J., Gallagher, R., and Provan, W.M.
(2002) Effect of intestinal microflora on the urinary metabolic profile of rats: a 1H-nuclear magnetic resonance spectroscopy study. Xenobiotica, 9, 783-794.
Williams, R.E., Lenz, E.M., Evans, J.A., Wilson, I.D., Granger, J.H., Plumb, R.S., and
Stumpf, C.L. (2005a) A combined 1H NMR and HPLC-MS-based metabonomic study of urine from obese (fa/fa) Zucker and normal Wistar-derived rats. J. Pharm. Biomed. Anal., 38, 465-471.
Williams, R.E., Lenz, E.M., Lowden, J.S., Rantalainen, M., and Wilson, I.D. (2005b)
The metabonomics of aging and development in the rat: and investigation into the effect of age on the profile of endogenous metabolites in the urine of male rats using 1H NMR and HPLC-TOF MS. Mol. BioSyst., 1, 166-175.
Williams, R.E., Lenz, E.M., Rantalainen, M., and Wilson, I.D. (2006) The comparative
metabonomics of age-related changes in the urinary composition of male Wistar-derived and Zucker (fa/fa) obese rats. Mol. BioSyst., 2, 193-202.
Wilson, I.D., Plumb, R., Granger, J., Major, H., Williams, R., and Lenz, E.M. (2005)
HPLC-MS-based methods for the study of metabolomics. Journal of Chromatography B, 817, 67-76.
Wishart, D.S., et al. (2007) HMDB: the Human Metabolome Database. Nucleic Acids
Research. 35, 521-526.
129
Witkamp, R.F. (2005) Genomics and systems biology – how relevant are the developments to veterinary pharmacology, toxicology and therapeutics? J. Vet. Pharmacol. Therap., 28, 235-245.
Witten, I. and Frank, E. (2000) Data mining: Practical machine learning tools and
techniques with Java implementations. Morgan Kaufmann Publishers, San Francisco, California.
Wlodek, D. and Gonzales, M. (2003) Decreased energy levels can cause and sustain
obesity. Journal of Theoretical Biology. 225, 33-44. Wood, S.N. (1994) Monotonic smoothing splines fitted by cross validation. SIAM
Journal on Scientific Computing, 15, 1126-1133. Wood, S.N. (2000) Modelling and smoothing parameter estimation with multiple
quadratic penalties. J.R. Statist. Soc. B, 62, 413-428. Wood, S.N. (2004) Stable and efficient multiple smoothing parameter estimation for
generalized additive models. Journal of the American Statistical Society, 99, 673-686.
Zhao, Q., Stoyanova, R., Du, S., Sajda, P., and Brown, P.R. (2006) HiRes - A tool for
comprehensive assessment and interpretation of metabolomic data. Bioinformatics, 22, 2562-2564.

130
VITA
GEOFFREY GIPSON email: [email protected] EDUCATION PhD in Biomedical Science, Drexel University, Philadelphia, PA MS in Toxicology, University of Maryland, Baltimore, MD BS in Environmental Science, University of Delaware, Newark, DE EXPERIENCE
R&D Data Analyst, GlaxoSmithKline, Collegeville, PA Research Assistant & Teaching Assistant, Drexel University, Philadelphia, PA Staff Scientist, Entrix, Inc., Wilmington, DE Research Assistant & Laboratory Instructor, University of Maryland, Baltimore,
MD JOURNAL ARTICLES Gipson, G.T., Tatsuoka, K.S., Sweatman, B.C., and Connor, S.C. 2006. Weighted Least-
Squares Deconvolution Method for Discovery of Group Differences between Complex Biofluid 1H NMR Spectra. Journal of Magnetic Resonance. 183:269-277.
Gipson, G.T., Tatsuoka, K.S., Sokhansanj, B.A., Ball, R.J., and Connor, S.C. 2008.
Assignment of MS-based Metabolomic Datasets via Compound Interaction Pair Mapping. Metabolomics. 4:94-103.
Gipson, G.T., Tatsuoka, K.S., Ball, R.J., Sokhansanj, B.A., Hansen, M.K., Ryan, T.E.,
Hodson, M.P., Sweatman, B.C., and Connor, S.C. Multi-platform Investigation of the Metabolome in a Leptin Receptor Defective Murine Model of Type 2 Diabetes. (in preparation)
Kane, A.S., Salierno, J.D., Gipson, G.T., Molteno, T., and Hunter, C. 2004. A video-
based movement analysis system to quantify behavioral stress responses of fish. Water Research. 38:3993-4001.
Schreuders, P.D., Nagoda, C., Lomander, A., Gipson, G., Rebar, J., and Cheng X. 2004.
Creation of a Virtual Aquatic Mesocosm Using STELLA Software. Transactions of the ASAE. 47(6): 2123-2135.
Salierno, J.D, Gipson, G.T., and Kane, A.S. 2008. Quantitative movement analysis of
social behavior in mummichog, Fundulus heteroclitus. Journal of Ethology. 26:35-42.