Embed Size (px)
Citation preview

C H A R A C T E R I S A T I O N O F T H E
N I T R I L E B I O C A T A L Y T I C A C T I V I T Y O F
R H O D O C O C C U S R H O D O C H R O U S
A T C C B A A - 8 7 0
Joni Frederick
A dissertation submitted to the Faculty of Science, University of the Witwatersrand,
Johannesburg, in fulfilment of the requirements for the degree of Master of
Science.
Johannesburg, 2006


Declaration
I declare that this dissertation is my own, unaided work. It is being submitted for
the Degree of Master of Science at the University of the Witwatersrand,
Johannesburg. It has not been submitted before for any degree or examination in
any other University.
___________________
___________________ day of ___________________ 2006
Declaration i

Abstract
A versatile nitrile-degrading bacterium was isolated through enrichment culturing of soil
samples from Johannesburg, South Africa. It was identified as Rhodococcus rhodochrous
and submitted to the ATCC culture collection as strain BAA-870. This organism was
determined to be a potential biocatalyst in that it contains a two enzyme system with strong
nitrile-converting activity comprising nitrile hydratase and amidase. The development of a
suitable assay for measuring the activity of the enzymes of interest was explored. A pH-
sensitive indicator-based assay was found to be suitable only for colorimetrically
identifying highly concentrated enzymes with acid-forming activity. An o-
phthaldialdehyde-based fluorimetric assay was found to be applicable to conversions of
select compounds, but the assay could not be used to measure the activity of Rhodoccocus
rhodochrous ATCC BAA-870. High performance liquid chromatography was the most
suitable method for reliable and quantitative measurement of nitrile hydrolysis, and is
applicable to monitoring activities of whole-cell and cell-free extracts. Initial analysis of
six compounds, benzonitrile, benzamide, benzoic acid, hydrocinnamonitrile, 3-hydroxy-3-
phenylpropionitrile and 3-hydroxy-3-phenylpropionic acid, was performed by HPLC to
measure linearly the average retention area, amount and absorbance of the compounds up
to 10 mM concentrations. The conversion of the substrates benzonitrile, benzamide and 3-
hydroxy-3-phenylpropionitrile were further analysed with respect to time and enzyme
concentration. Conversion of benzonitrile to benzamide by the nitrile hydratase was rapid
and could be measured in 10 minutes. Conversion of benzamide to benzoic acid by the
amidase was considered the rate-limiting step and could be followed for 90 minutes of the
reaction at the concentrations tested. Conversion of 3-hydroxy-3-phenylpropionitrile was
linearly measured over 20 minutes. Mass spectral analysis was used to confirm, at a
structural level, relatively less volatile reactant compounds with a higher thermal stability,
including benzamide, 3-hydroxy-3-phenylpropionitrile and 3-hydroxy-3-phenylpropionic
acid. Protein concentration studies indicated that activity against benzonitrile was probably
due to a nitrile hydratase with potent activity rather than a concentrated enzyme, since
formation of benzamide from benzonitrile showed first order reaction kinetics at protein
concentrations less than 0.2 mg/ml. Formation of benzoic acid from benzamide was linear
up to 1.3 mg total protein and product formation from 3-hydroxy-3-phenylpropionitrile
Abstract ii
was linear up to 1.4 mg total protein. Overlapping activities against benzonitrile and 3-
hydroxy-3-phenylpropionitrile indicate that the nitrile hydratase has differing substrate
specificity for the two compounds, with higher activity toward the small aromatic
mononitrile, benzonitrile, than the arylaliphatic β-hydroxy nitrile, 3-hydroxy-3-
phenylpropionitrile. The nitrile-converting activity of Rhodococcus rhodochrous ATCC
BAA-870 would be suitable for biocatalysis as the conversions take place under a wide pH
range, require low concentrations of enzyme and reactions are fast. Separation of nitrile-
converting activities in Rhodococcus rhodochrous ATCC BAA-870 was undertaken using
various chromatography methods to establish a simple, one-step protocol for biocatalytic
enzyme preparations. HPLC was not suited to assaying nitrile-converting activity in
chromatofocusing fractions, and chromatofocusing Ampholyte buffers were found to
interfere with activity measurements. Gel exclusion chromatography of the soluble protein
extract from Rhodococcus rhodochrous ATCC BAA-870 indicated the enzyme/s
responsible for nitrile hydratase activity are high molecular weight proteins ranging from
40 to 700 kDa in size, while the amidase native enzyme is proposed to be roughly 17 to 25
kDa. SDS-PAGE analysis of gel exclusion and ion exchange chromatography fractions
indicated nitrile converting activity in Rhodococcus rhodochrous ATCC BAA-870 is likely
due to multimer-forming enzymes made up of 84, 56, 48 and 21 kDa subunits. It is
postulated that nitrile hydratase is made up of αβ and α2β2 tetramers that may form larger
enzyme aggregates. Ion exchange chromatography was used to separate nitrile hydratase
with high activity against benzonitrile and 3-hydroxy-3-phenylpropionitrile from amidase
activity, and showed that an additional, substrate specific nitrile hydratase may exist in the
organism.
Abstract iii

Acknowledgements
I wish to thank the Council For Scientific and Industrial Research, BioSciences unit,
Modderfontein, for the opportunity to make use of their laboratories and other facilities, as
well as for the financial assistance provided during the project. In particular I want to thank
Dr Dean Brady for his supervision, constant support and encouragement throughout the
project. I thank the National Research Foundation and the University of the Witwatersrand
for the financial assistance and post-graduate merit award, respectively. I also thank
Professor Heini Dirr for his supervision and magnetic passion for Biochemistry.
Since thanking “all who were involved” means nothing to anyone, I wish to thank the
following people for influencing me, supporting me, encouraging me, assisting me, or
simply giving me a laugh, and in some cases, all of the above during this trying time: Dad,
Mom, Bonnie, John, Macky, Varsha, Nosisa, Mamosa, Henry, Fritha, Neeresh, Clinton,
Thandeka, Mapitso, Justin, Nasreen, Dan, Nichole and Carlo, Sheryl, Chien-Teng, Kelly,
Loren, Stoyan, Harris, Kgama, Stephen, Paul, 5fm and Highveld stereo, The Pig, 33 High
Street, Boland, Boland Bank, and most of all, myself.
Acknowledgements iv

Table of Contents
Declaration.............................................................................................................................i
Abstract.................................................................................................................................ii
Acknowledgements..............................................................................................................iv
Table of Contents...................................................................................................................v
List of Figures....................................................................................................................viii
List of Tables.......................................................................................................................xii
List of Abbreviations..........................................................................................................xiii
1 Introduction.....................................................................................................................1
1.1 Nitrile Hydrolysing Enzymes: Comparison of General Structure and Enzymology. . .2
1.1.1 Nitrilase.................................................................................................................2
1.1.2 Nitrile Hydratase...................................................................................................4
1.2 Nitrilase (EC 3.5.5.1)...................................................................................................5
1.3 Nitrile Hydratase (EC 4.2.1.84)....................................................................................6
1.4 Amidase (EC 3.5.1.4)...................................................................................................9
1.5 Nitrile biotransformation, biosynthesis and bioremediation......................................10
1.6 Nitrile Hydrolysis Activity Assays.............................................................................14
1.6.1 The Ninhydrin Assay...........................................................................................14
1.6.2 Nesslerization......................................................................................................14
1.6.3 The Berthelot Method.........................................................................................15
1.6.4 A Fourier Transform Infrared Method.................................................................15
1.6.5 A Colorimetric pH Method..................................................................................15
1.6.6 Fluorimetric Methods..........................................................................................16
1.7 Rhodococcus rhodochrous as the chosen biocatalyst.................................................16
1.8 Objectives and potential applications of the research................................................20
2 Materials and Methods......................................................................................................22
2.1 Materials.....................................................................................................................22
2.1.1 Chemicals............................................................................................................22
2.1.2 Nitrile Stocks.......................................................................................................22
2.1.3 Commercial Nitrilases.........................................................................................22
Table of Contents v

2.1.4 Organism and Media...........................................................................................22
2.1.5 Column Chromatography....................................................................................23
2.2 Methods......................................................................................................................24
2.2.1 Rhodococcus rhodochrous ATCC BAA-870.......................................................24
2.2.2 Assays for Measuring Nitrilase/ Nitrile Hydratase Activity................................26
2.2.3 Assay Development: High Performance Liquid Chromatography......................29
2.2.4 Column Chromatography....................................................................................35
2.2.5 Polyacrylamide Gel Electrophoresis...................................................................36
3 Results...............................................................................................................................38
3.1 Rhodococcus rhodochrous ATCC BAA-870 Characteristics.....................................38
3.1.1 Rhodococcus rhodochrous Growth Curves in Different Media..........................38
3.1.2 Dry Cell Weight Determination...........................................................................40
3.1.3 Observations of Rhodococcus rhodochrous growth patterns..............................40
3.1.4 Microscope Observations of the life cycle of Rhodococcus rhodochrous..........41
3.1.5 Rhodococcus rhodochrous Cell Disruption Study..............................................42
3.2 Towards Establishing an Activity Assay for Nitrilase and/or Nitrile Hydratase........44
3.2.1 Colorimetric Method...........................................................................................44
3.2.2 Fluorescence-based OPA Assay and Comparison to HPLC Method..................44
3.2.3 High Performance Liquid Chromatography........................................................45
3.3 HPLC Assay Method Development...........................................................................46
3.3.1 Standard Curves..................................................................................................49
3.3.2 LC-Mass Spectral Analysis of the Standards Used in This Study......................53
3.3.3 Different Buffer Types.........................................................................................58
3.3.4 pH Activity Profiles.............................................................................................61
3.3.5 Time Course Activity Study................................................................................62
3.3.6 Protein Concentration Effects.............................................................................68
3.4 Column Chromatography...........................................................................................73
3.4.1 Chromatofocusing...............................................................................................74
3.4.2 Gel Exclusion Chromatography..........................................................................75
3.4.3 Ion Exchange.......................................................................................................85
4 Discussion.........................................................................................................................93
4.1 Characteristics of the chosen biocatalyst, Rhodococcus rhodochrous.......................93
4.2 Towards Establishing an Activity Assay for Nitrile Hydratase..................................94
4.3 High Performance Liquid Chromatography and Mass Spectrometry........................97
Table of Contents vi

4.3.1 Different Buffer Types.........................................................................................99
4.3.2 pH Profiles.........................................................................................................100
4.3.3 Time Course Activity Study..............................................................................102
4.3.4 Protein Concentration Effects...........................................................................103
4.4 Column Chromatography.........................................................................................105
4.4.1 Chromatofocusing.............................................................................................105
4.4.2 Gel Exclusion....................................................................................................107
4.4.3 Ion Exchange.....................................................................................................109
4.5 General Discussion...................................................................................................111
4.6 Conclusion................................................................................................................113
5 Appendix..........................................................................................................................115
5.1 Standard Curves........................................................................................................115
5.2 Chromatography.......................................................................................................117
5.3 Nitrile Hydratase Theoretical pI...............................................................................120
5.4 Mass Spectra.............................................................................................................121
5.5 Structures..................................................................................................................125
6 References.......................................................................................................................130
Table of Contents vii
List of Figures
Figure 1: Nitrile hydrolysis catalysed by one of two distinct pathways................................1
Figure 2: The four reaction types carried out by members of the nitrilase superfamily........3
Figure 3: A reaction mechanism for a nitrilase reaction requiring a covalent enzyme
intermediate...........................................................................................................5
Figure 4: Ribbon representation of photoactivated iron-containing nitrile hydratase from
Rhodococcus sp. R312 prepared from Protein Data Bank entry 1AHJ.................7
Figure 5: Iron coordination at the active site proposed for nitrile hydratase and a possible
reaction mechanism involving a coordinated hydroxyl group..............................8
Figure 6: Alkaline and acid hydrolysis of nitriles................................................................11
Figure 7: Schematic addition of cyanide to a molecule providing an additional carbon and
nitrogen for subsequent conversion to other functional groups..........................12
Figure 8: Schematic representation of the method used for colorimetric identification of
nitrilase or nitrile hydratase activity....................................................................27
Figure 9: Three-dimensional contour map of absorbance with wavelength and elution time
for benzonitrile as acquired by the photodiode array detector in HPLC.............30
Figure 10: Two-dimensional chromatograph of a 5 mM benzonitrile sample showing
absorbance over time at 224.1 nm.......................................................................30
Figure 11: Growth curve of Rhodococcus rhodochrous in minimal media measured at 600
and 660 nm. ........................................................................................................39
Figure 12: Growth curve of Rhodococcus rhodochrous in rich media measured at 600 and
660 nm.................................................................................................................39
Figure 13: Close-up detail of the fanning formation developed by aged Rhodococcus
rhodochrous culture on tryptone soya agar streak plates.....................................40
Figure 14: Germinating Rhodococcus rhodochrous ATCC BAA-870 cells in minimal
media...................................................................................................................41
Figure 15: Rhodococcus rhodochrous ATCC BAA-870 in advanced stages of growth
showing two distinct cell morphologies..............................................................41
Figure 16: Amount of benzoic acid formed from benzonitrile in post-extraction reactions
of samples sonicated for increasing lengths of time............................................42
List of Figures viii

Figure 17: Micrographs of Rhodococcus rhodochrous sonicated for increasing time
periods. ...............................................................................................................43
Figure 18: Average integrated area of benzonitrile, benzamide, benzoic acid,
hydrocinnamonitrile, 3-hydroxy-3-phenylpropionitrile and 3-hydroxy-3-
phenylpropionic acid with increasing concentration...........................................50
Figure 19: Average absorbance of benzonitrile, benzamide, benzoic acid,
hydrocinnamonitrile, 3-hydroxy-3-phenylpropionitrile and 3-hydroxy-3-
phenylpropionic acid with increasing concentration...........................................52
Figure 20: Mass spectra of 3-hydroxy-3-phenylpropionic acid and 3-hydroxy-3-
phenylpropinitrile standards................................................................................55
Figure 21: Chromatographs of 3-hydroxy-3-phenylpropionic acid and 3-hydroxy-3-
phenylpropionitrile standards..............................................................................56
Figure 22: Benzonitrile conversion to benzoic acid in ten different buffer systems............58
Figure 23: Relative conversion of 3-hydroxy-3-phenylpropionitrile to product in ten
different buffer types...........................................................................................59
Figure 24: Relative levels of hydrocinnamonitrile measured in ten different buffer types by
HPLC...................................................................................................................60
Figure 25: Amount of benzoic acid formed from benzonitrile at different pH’s.................62
Figure 26: Conversion of 5 mM benzonitrile to benzamide and benzoic acid over three
hours....................................................................................................................63
Figure 27: Conversion of 5 mM benzamide over three hours.............................................64
Figure 28: Formation of benzoic acid from benzamide over time.......................................65
Figure 29: Conversion of 5 mM 3-hydroxy-3-phenylpropionitrile over three hours..........66
Figure 30: Conversion of 5 mM 3-hydroxy-3-phenylpropionitrile over a twenty minute
reaction................................................................................................................67
Figure 31: Conversion of 5 mM benzonitrile over a ten minute time reaction, excluding
time zero..............................................................................................................67
Figure 32: Formation of benzoic acid from benzonitrile with increasing protein
concentration.......................................................................................................68
Figure 33: Formation of benzoic acid from benzamide with increasing protein
concentration.......................................................................................................69
Figure 34: Amount of benzamide and benzoic acid formed from benzonitrile with
increasing protein concentration..........................................................................70
List of Figures ix

Figure 35: Average integrated area of benzoic acid formation from benzamide over a 25
minute reaction with increasing protein concentration. 72
Figure 36: Average integrated area of product formed from 3-hydroxy-3-
phenylpropionitrile over a 25 minute reaction. 73
Figure 37: Polybuffer Exchanger 94 Chromatofocusing elution profile of the soluble
protein fraction from Rhodococcus rhodochrous grown in minimal media. 75
Figure 38: 10% SDS-PAGE of supernatant prepared from Rhodococcus rhodochrous
grown in defined minimal media containing benzonitrile as inducer. 76
Figure 39: Protein elution from Sephacryl S-200 during gel exclusion of a cell free protein
mix from Rhodococcus rhodochrous. 77
Figure 40: Nitrile hydrolytic activity profile of fractions from Sephacryl S-200 gel
exclusion of a cell free protein mix from Rhodococcus rhodochrous showing
residual substrate after reaction. 78
Figure 41: 12% SDS-PAGE of Sephacryl S-200 size exclusion chromatography fractions.
79
Figure 42: Sephacryl S-200 gel exclusion protein elution profile of Rhodococcus
rhodochrous supernatant treated with polyethylenimine. 80
Figure 43: Conversion of benzonitrile to product in Sephacryl S-200 gel exclusion fractions
showing total amount of product formation. 81
Figure 44: Conversion of benzamide to benzoic acid in Sephacryl S-200 eluted fractions.
81
Figure 45: Conversion of 3-hydroxy-3-phenylpropionitrile to product in Sephacryl S-200
eluted fractions. 82
Figure 46: Conversion of benzonitrile, benzamide and 3-hydroxy-3-phenylpropionitrile in
Sephacryl S-200 eluted fractions. 83
Figure 47: Wavelength scans of a coloured Sephacryl S-200 eluted gel exclusion fraction
compared to other fractions. 85
Figure 48: Protein elution profile from Toyopearl SuperQ 650M during ion exchange
chromatography of supernatant from Rhodococcus rhodochrous. 86
Figure 49: Conversion of benzonitrile to benzamide and benzoic acid in Toyopearl SuperQ
650M ion exchange eluted fractions. 87
Figure 50: Conversion of benzamide to benzoic acid in Toyopearl SuperQ 650M ion
exchange eluted fractions. 87
List of Figures x
Figure 51: Conversion of 3-hydroxy-3-phenylpropionitrile to product in Toyopearl SuperQ
650M ion exchange eluted fractions. 88
Figure 52: Amount of benzonitrile, benzamide and 3-hydroxy-3-phenylpropionitrile
remaining in Toyopearl SuperQ 650M ion exchange eluted fractions. 89
Figure 53: 10% SDS-PAGE of Toyopearl SuperQ 650M ion exchange eluted fractions.
90
Figure 54: Toyopearl Super-Q 650M ion exchange chromatography of supernatant from
Rhodococcus rhodochrous eluted with a 500 mM NaCl gradient. 91
Figure 55: Amount of benzamide formed from benzonitrile, and conversion of 3-hydroxy-
3-phenylpropionitrile in Toyopearl SuperQ 650M ion exchange eluted fractions.
92
Figure 56: NH4Cl Standard curve. 115
Figure 57: Sample BioRad protein concentration determination standard curve. 115
Figure 58: Standard curve of 10% SDS-PAGE size markers. 116
Figure 59: Sephacryl S-200 gel exclusion standard curve. 116
Figure 60: Sephacryl S-200 gel exclusion standard elution profile. 117
Figure 61: Sephacryl S-200 gel exclusion selectivity curve. 118
Figure 62: Benzamide mass spectrum. 121
Figure 63: Mass spectrum breakdown for benzamide showing the mass/charge ratio of
possible peak components. 122
Figure 64: Mass spectrum breakdown for 3-hydroxy-3-phenylpropionitrile showing the
mass/charge ratio of identified peak components. 122
Figure 65: 3-Hydroxy-3-phenylpropionitrile mass spectrum. 123
Figure 66: 3-Hydroxy-3-phenylpropionic acid mass spectrum. 124
Figure 67: Mass spectrum breakdown for 3-hydroxy-3-phenylpropionic acid showing the
mass/charge ratio of identified peak components. 124
List of Figures xi

List of Tables
Table 1: Relative growth of some Rhodococcus rhodochrous strains on different sole
nitrogen sources...................................................................................................18
Table 2: Percentage substrate conversion of selected commercial nitrilases and biocatalysts
.............................................................................................................................18
Table 3: The ten different buffer types used in this study and their composition................33
Table 4: Relative activities of various commercial nitrilase enzymes and Rhodococcus
rhodochrous whole cells reacted with benzonitrile.............................................46
Table 5: Name, structure and retention time of compounds used in this study....................48
Table 6: Linear regression equations and R2 values for standard curves of the average
integrated areas of increasing concentrations of various standard compounds...49
Table 7: Linear regression equations and R2 values for standard curves of absorbance with
increasing concentration for various compounds................................................51
Table 8: Apparent molecular weight of the proteins within each Sephacryl S-200 gel
exclusion fraction as estimated by comparison of the ratio of elution
volume/void volume of Blue Dextran to that of molecular weight standards...119
Table 9: Theoretical pI values of different nitrile hydratase enzymes from Rhodococcal and
Pseudomonad species........................................................................................120
Table 10: Table of compounds and structures referred to in this study..............................125
List of Tables xii

List of Abbreviations
A absorbance
ACN acetonitrile
BSA bovine serum albumin
BTB bromothymol blue
DTT dithiothreitol
EDTA ethylene diamine tetraacetic acid
EPR electron paramagnetic resonance
ENDOR electron nuclear double resonance
EXAFS extended x-ray absorption fine structure
Fhit fragile histidine triad protein
H-NHase high molecular mass nitrile hydratase
HPLC high performance liquid chromatography
Kav partition coefficient
kDa kilodaltons
L-NHase low molecular mass nitrile hydratase
M molar
Mr relative molecular mass
NHase nitrile hydratase
Nit nitrilase
NitFhit nitrilase-fragile histidine triad fusion protein
NO nitric oxide
OD optical density
OPA o-phthaldialdehyde
PDA photo diode array
rev./min revolutions per minute
RP-HPLC reversed-phase high performance liquid chromatography
SDS sodium dodecyl sulphate
SDS-PAGE sodium dodecyl sulphate polyacrylamide gel electrophoresis
TEMED N,N,N’N’-tetramethylethylenediamine
TFA trifluoroacetic acid
List of Abbreviations xiii

Tris Tris(hydroxymethyl)-aminomethane
TSA tryptone soya agar
TSB tryptone soya broth
UV ultraviolet
Ve elution volume
Vo void volume
Vt total column volume
The IUPAC-IUBMB one letter codes are used for amino acids.
List of Abbreviations xiv

Chapter 1
1 Introduction
Nitrilases and nitrile hydratases are attracting increasing attention in the field of
biotransformation and biocatalysis. Their ability to produce a carboxylic acid from a
corresponding nitrile, with nitrile hydratase producing an amide as an intermediate, has
provided great potential for the use of these enzymes as nitrile catalysts functioning under
relatively mild reaction conditions. One of the most well-known commercial examples of
nitrile bioconversion is that of the manufacture of acrylamide from acrylonitrile [1]. This
application of nitrile hydratase for the synthesis of acrylamide started in 1985, and
Mitsubishi Rayon now produces over 30,000 tons of acrylamide every year. This was the
first bioconversion process to be successfully applied to the petrochemical industry and
implemented for the industrial production of a commodity chemical. Most nitrile
bioconversions are still achieved through whole-cell treatment of substrates using
industrially useful microbial strains such as Rhodococcus rhodochrous.
Hydration of nitriles in plants and microbes may be catalysed by one of two distinct
pathways (Figure 1). Aliphatic nitriles are converted to amides by nitrile hydratases and
then hydrolysed by amidases to carboxylic acids. Aromatic nitriles, on the other hand, are
metabolised to the corresponding acid in a single-step reaction by nitrilases. Exceptions to
this include the nitrile hydratases of a Rhodococcus sp. [2] and Bacillus smithii SCJ05-1
[3], and the nitrilase of Rhodococcus rhodochrous K22 [4], which are capable of
hydrolysing both aliphatic and aromatic nitriles.
R NH2O
NH2
O
R
H2O
OH
O
R+ NH3
Nitrile Hydratase Amidase
Nitrilase
2H2O
Figure 1: Nitrile hydrolysis catalysed by one of two distinct pathways.
Chapter 1 1

It is usual for the expression of nitrile hydratase and amidase enzymes to be associated in
the same organism. Indeed, the structural genes are adjacent on the same operon and are
under the control of the same activator protein. The nitrile hydratase (NHase) operon
consists of six genes, nhr2, nhr1, ami, nha1, nha2 and nha3, that encode NHase regulator
2, NHase regulator 1, amidase, NHase α subunit, NHase β subunit and NHase activator,
respectively [5]. Expression of nitrilase, however, is separate from NHase and amidase
expression in the same organism, and can be selectively affected without affecting the
expression of nitrile hydratase and amidase genes (and vice versa). The amount of each
enzyme produced by an organism can be increased by addition of an inducer such as
propionitrile to the fermentation medium [6].
Although several nitrile-hydrolysing enzymes have been isolated from natural sources,
these enzymes were generally too unstable for commercial use in the isolated state, and
most applications of these enzymes has consequently been as whole-cell biocatalysts.
However, applying whole cell biocatalysts can present disadvantages in that some small
aliphatic nitriles, and those with hydroxy and amino groups, can be utilized by the
organism itself as carbon sources [7]. Also, the decreased yield of amides obtained when
whole cell systems are used can be avoided when using purified enzymes since they are
not utilized by the organism. Despite the large number of nitrilases and nitrile hydratases
that have been purified there is a scarcity of suitable and/or well-characterised commercial
nitrile-converting biocatalysts. Purified enzymes are the biocatalysts of choice for specific
hydrolysis of nitriles containing other hydrolysable groups, and for the production of
amides without carboxylic acid contamination.
1.1 Nitrile Hydrolysing Enzymes: Comparison of General
Structure and Enzymology
1.1.1 Nitrilase
Nitrilase enzymes form part of a superfamily of thiol enzymes that are found in all animals,
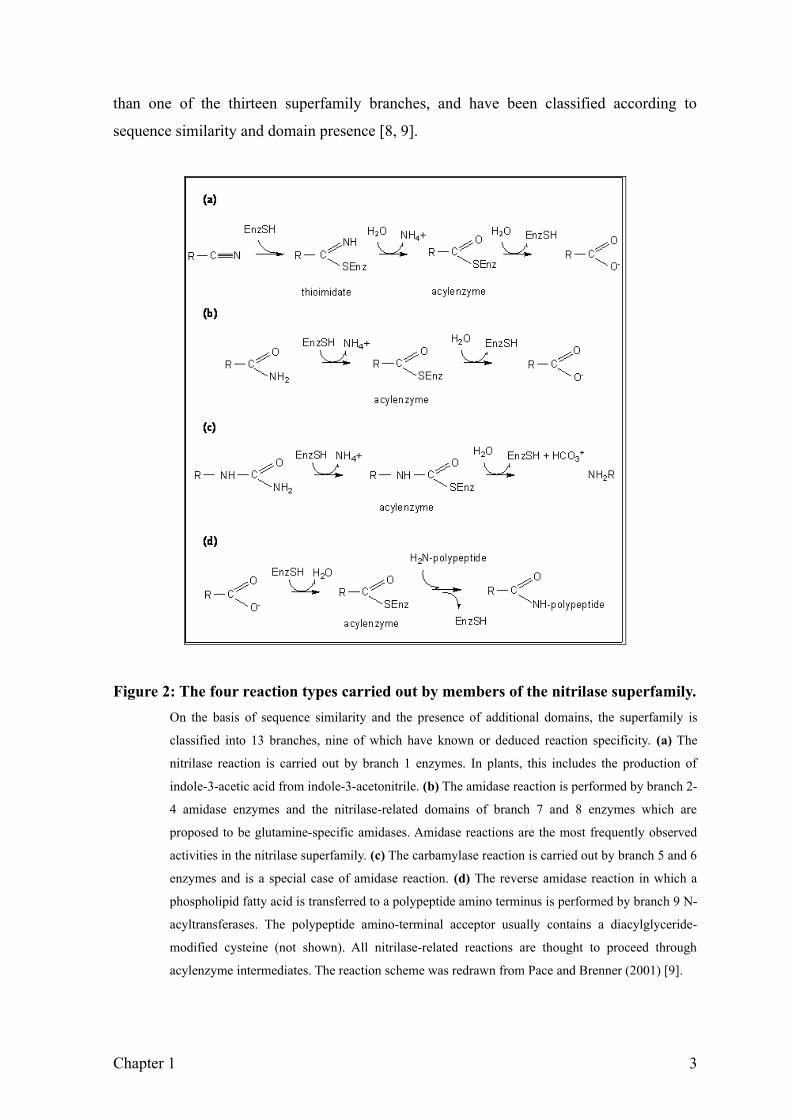
plants, fungi and bacteria [8]. Figure 2 shows the four types of reactions carried out by the
nitrilase superfamily branches. Some organisms may have multiple nitrilases from more
Chapter 1 2
than one of the thirteen superfamily branches, and have been classified according to
sequence similarity and domain presence [8, 9].
Figure 2: The four reaction types carried out by members of the nitrilase superfamily.On the basis of sequence similarity and the presence of additional domains, the superfamily is
classified into 13 branches, nine of which have known or deduced reaction specificity. (a) The
nitrilase reaction is carried out by branch 1 enzymes. In plants, this includes the production of
indole-3-acetic acid from indole-3-acetonitrile. (b) The amidase reaction is performed by branch 2-
4 amidase enzymes and the nitrilase-related domains of branch 7 and 8 enzymes which are
proposed to be glutamine-specific amidases. Amidase reactions are the most frequently observed
activities in the nitrilase superfamily. (c) The carbamylase reaction is carried out by branch 5 and 6
enzymes and is a special case of amidase reaction. (d) The reverse amidase reaction in which a
phospholipid fatty acid is transferred to a polypeptide amino terminus is performed by branch 9 N-
acyltransferases. The polypeptide amino-terminal acceptor usually contains a diacylglyceride-
modified cysteine (not shown). All nitrilase-related reactions are thought to proceed through
acylenzyme intermediates. The reaction scheme was redrawn from Pace and Brenner (2001) [9].
Chapter 1 3

Nitrilases are usually homooligomers, and very infrequently monomers, and do not contain
metal cofactors. The structures of other members of the superfamily, N-carbamyl-D-amino
acid amidohydrolase from Agrobacterium and worm NitFhit, branch 6 and 10 enzymes
respectively, were independently shown to consist of a tetramer of compact α-β-β-α
sandwiches in which two sheets of six β-strands form layers between pairs of α-helices.
The superfamily likely utilizes a novel glutamic acid, lysine and cysteine catalytic triad [8].
Both the lysine and glutamic acid residues have been shown to be catalytically essential by
construction of stable, inactive mutants with K134N and E59Q substitutions, respectively
[10]. Rhodococcus nitrilase characterisation has indicated the protein is a thiol enzyme that
proceeds via a covalent intermediate [11], and mutagenesis has identified the cysteine
nucleophile [12], as well as confirmed the essentiality of the corresponding cysteine
residue in other nitrilase superfamily branches [8, 13].
The nitrilase superfamily enzymes serve diverse roles in nature, including synthesis of
hormones and other signalling molecules, vitamin and coenzyme metabolism, protein post-
translational modification, as well as roles in the detoxification of small molecules [14,
15]. There is significant amino acid sequence similarity between bacterial and plant
nitrilases [16].
1.1.2 Nitrile Hydratase
Although they are involved in hydrolysis of the nitrile bond, the nitrile hydratases are not
members of the nitrilase superfamily, and hence have no structural or mechanistic
similarity. All characterised bacterial nitrile hydratases are composed of two kinds of
subunits assembled into heterooligomers (mostly dimers or tetramers, with a few larger
molecules containing up to 20 subunits). Nitrile hydratases typically form αβ or α2β2
functional proteins with the catalytic centre at the α-β subunit interface. Nitrile hydratase
contain a metal ion at the active site. Bacterial nitrile hydratases usually contain Fe3+ and/or
Co3+ [17] whilst the Myrrothecium verrucaria fungus has been shown to contain Zn2+ [18].
The microbial strain that has been the most exploited for its activity by industry,
Rhodococcus rhodochrous J1, produces both a high molecular mass (H-NHase) [19] and
lower molecular mass (L-NHase) nitrile hydratase [20, 21]. The enzymes are each
Chapter 1 4

composed of two subunits, α and β, with the α subunit differing in size from the β, and
both subunits of H-NHase differing from that of L-NHase. H-NHase is overproduced in
this strain (as more than 50% of the soluble protein fraction) when urea is used as an
inducer in the culturing medium.
1.2 Nitrilase (EC 3.5.5.1)
Nitrilase enzymes catalyse the direct hydrolysis of aliphatic and aromatic nitriles into the
corresponding carboxylic acid and ammonia (Equation 1).
R-CN + 2H2O → R-COOH + NH3 Equation 1.
Nitrilases are widely distributed in plants, where they catalyse the conversion of indole-3-
acetonitrile into the plant hormone indole-3-acetic acid. They are also found in fungi and
bacteria that can metabolise nitrile-containing herbicides. The cDNA for a number of
nitrilases has been obtained, and a comparative amino acid sequence analysis reveals the
presence of a conserved cysteine residue that is essential for catalytic activity [22, 23]. The
function of the conserved cysteine may be to act as a nucleophile in analogy to the bound
water molecule used for catalysis in the metal-containing nitrile hydratases. The formation
of an enzyme-bound intermediate upon the release of ammonia, and the subsequent
hydrolysis of this intermediate to restore the cysteine residue, could account for the
difference in reaction products from the two distinct types of nitrile-metabolizing enzymes.
The nitrilase reaction mechanism (Figure 3) probably involves a nucleophilic attack on the
nitrile carbon atom by a sulfhydryl (thiol) group of a cysteine residue with a concomitant
protonation of nitrogen to form a tetrahedral thiomidate intermediate. Hydrolysis of the
covalent thiomidate complex and protonation of the nitrogen atom then occurs, and this
nitrogen is lost as ammonia [11, 24].
Cys SH C
N
R
CysS
C
NH
RCys
SC
H2NR
CysS
C
O
R
HO
H
O H
H2O
NH3
Figure 3: A reaction mechanism for a nitrilase reaction requiring a covalent enzyme
intermediate.
Chapter 1 5

Recently, nitrilase (nit) genes have been described as fusion proteins with the nucleotide-
binding protein fragile histidine triad (Fhit). Fhit, an enzyme known to be crucial in
apoptosis, is encoded as a fusion protein with Nit in invertebrates, and in mice Nit1 and
Fhit genes have almost identical expression profiles. The naturally occurring fusion
protein, NitFhit (nitrilase-fragile histidine triad fusion protein) has recently had its
crystallographic structure solved by Pace et al. [25]. The fusion of the two enzymes is
proposed to imply a functional, but as yet unknown, link of two separate pathways.
A nitrilase isolated from Rhodococcus rhodochrous ATCC 39484 is reportedly converted to
an active form by subunit association when incubated with substrate [26] or when in the
presence of higher concentrations of enzyme, salt or organic solvent [27]. These conditions
may result in a hydrophobic effect that changes the conformation of the enzyme in such a
way so as to expose hydrophobic sites which enable subunit assembly and hence enzyme
activation.
1.3 Nitrile Hydratase (EC 4.2.1.84)
Nitrile hydratases (NHases) catalyse the direct hydrolytic conversion of aromatic and
aliphatic nitriles into the corresponding amide (Equation 2).
R-CN + 2H2O → R-CONH2 (Equation 2)
These enzymes are widely distributed in bacteria, plants and fungi. The industrial and
commercial uses of these enzymes have been demonstrated by the annual production of
over 30 000 tons of acrylamide from acrylonitrile in bioreactors [1], as well as the
production of the plant hormone indole-3-acetic acid from indole-3-acetonitrile.
Both cobalt- and iron-containing forms of the nitrile hydratases are known. The properties
of metal-containing NHases have been reviewed in detail [28] and the catalytic mechanism
is likely similar for all. An iron-containing NHase isolated from Rhodococcus sp. N-774
has been characterised by biochemical and genetic methods, and shown to be an (αβ)2
dimer. The α and β subunits, as calculated from their nucleotide sequences, are roughly 22
870 and 23 850 Da, respectively.
Chapter 1 6

The α subunit of NHase has the primary amino acid sequence motif Cys-X-X-Cys-X-Cys.
The observed amino acid motif and iron stoichiometry is comparable to the motif that
provides two of the four cysteine ligands in the rubredoxin iron site, suggesting that the
active site resides in the α subunit. It has been shown, through separation of the two
subunits, that iron is present in the α subunit but not the β subunit [29]. Various NHase
crystal structures have been obtained, including the apoenzyme of cobalt-containing nitrile
hydratase [30], a thermophilic Bacillus smithii nitrile hydratase [31], and nitrile hydratase
complexed with nitric oxide [32] or cyclohexyl isocyanide [33]. All protein ligands to the
iron in ferric NHase are provided by the α subunit, and there is one iron atom per αβ unit.
The crystal structure of photoactivated iron-containing nitrile hydratase from Rhodococcus
sp. R312 [34] was determined to 2.65 Å resolution by Huang et al. (1997) and is shown in
Figure 4.
Figure 4: Ribbon representation of photoactivated iron-containing nitrile hydratase
from Rhodococcus sp. R312 prepared from Protein Data Bank entry 1AHJ.The enzyme is shown as a homotetramer made up of the αβ asymmetric unit. The iron metal
centre (Fe3+) is located at the central cavity at the interface between two subunits and is indicated
by black spheres. The image was modelled on the protein data bank entry by Huang et al. (1997)
[34] using Swiss-PdbViewer version 3.7 by Berman et al. (2000) [35].
Resonance Raman spectroscopy [36, 37], EPR (electron paramagnetic resonance) [38],
ENDOR (electron nuclear double resonance) [39, 40] and EXAFS (extended X-ray
Chapter 1 7

absorption fine structure) [37, 41] studies have been used to propose a structural model for
the ferric active site shown in Figure 5. It is proposed to have an octahedral coordination
geometry consisting of two cysteine thiol ligands in cis configuration, three histidine
nitrogen ligands in mer configuration, and one solvent-exchangeable hydroxide ligand.
This configuration is considered to be relatively rare in a biological molecule [29].
Chemical synthesis of carboxylic acids from nitriles proceeds at elevated temperature and
pH. The feasible reaction mechanism for NHase shown in Figure 5 involves attack of the
metal-bound hydroxide on the nitrile group, which gives rise to an unstable amide tautomer
coordinated to the metal active site (Figure 5B). Rearrangement of the amide and
subsequent dissociation of the product implies there is a transient formation of a five-
coordinate iron site upon transfer of the bound hydroxide (Figure 5C). Re-coordination of a
solvent-derived hydroxide completes the catalytic cycle and accounts for the products
observed from NHases. A possible alternate mechanism in which the bound intermediate is
activated for attack by a solvent molecule, is also shown.
Fe3+
His OH
Cys HisHis
Cys
R C N
Fe3+
O
C R
HN
Fe3+
O
HH
ORH
NH
Fe3+
O RH
NH2
OH
A B C D
or
Fe3+
O
HOH
R
HN
Fe3+
OH
OH
C
NH
R
H+O
C
NH2
R
Figure 5: Iron coordination at the active site proposed for nitrile hydratase and a
possible reaction mechanism involving a coordinated hydroxyl group.The mechanism for nitrile hydration was proposed on the basis of EXAFS and EPR studies and
two X-ray crystal structures, and redrawn from Shearer et al. (2002) and Nagashima et al. (1998)
[42, 43].
Purified NHase may be obtained as a mixture of ‘low pH’ and ‘high pH’ forms. Low pH
forms are catalytically active while the high pH form needs to be activated. This activation
can be accomplished through photolysis [44]. Resonance Raman spectroscopy studies have
Chapter 1 8

shown that low- and high-pH forms have extensive differences in hydrogen bonding [36].
NHase, therefore, possesses unique intrinsic activity traits in the presence of light in that it
can undergo photo-reactivation when irradiated with visible light after aerobic incubation
in the dark. Endo and colleagues [45] have proposed a biochemical mechanism for this
photoreactivity. Light irradiation of an iron complex (chromophore) in the β-subunit of the
enzyme induces a conformational change of the subunit. Inactive NHase has a non-heme
iron (III) centre to which an endogenous nitric oxide (NO) molecule is bound. Upon photo-
reactivation, the NO is released and the activity of the enzyme recovered. It has been
suggested through the use of Fourier-transform infrared difference spectroscopy [45] that
irradiation causes a conformational change in the β subunit, and a subsequent breakage of
the Fe-N bond. This results in photo-dissociation of the endogenous NO molecule from the
NHase catalytic centre. Further studies of photo-activation of NHase is required to define
the structure of the enzyme fully, since the mechanism of photoactivation is still poorly
understood and reports are generally conflicting [36, 41, 44, 46-48]. Photoregulation and
NO-addition both allow points of control of NHase activity, and afford potential in the use
of the enzyme in biocatalysis.
Interestingly, it has been repeatedly reported that nitrile hydratase is generally induced by
amides (the reaction product) rather than the nitrile (substrate) in microorganisms that
metabolise nitriles [1, 20]. This may mean that a low level constitutive expression of
NHase may occur, allowing for formation of amide from nitrile, thereby causing induction.
1.4 Amidase (EC 3.5.1.4)
Amidases catalyse the hydrolysis of amides to free carboxylic acids and ammonia
(Equation 3) and are involved in nitrogen metabolism in both prokaryotic and eukaryotic
organisms [49].
R-CONH2 + 2H2O → R-COOH + NH3 (Equation 3)
Amidases display huge differences in substrate-specificity and characteristics. Some are
specific for aromatic amides [50] while others are specific for aliphatic amides [51] or
amides of α- or ω-amino acids [52]. The majority of the nitrilase superfamily consists of
Chapter 1 9

various amidase branches [8, 9]. However, there are many amidases that are unrelated to
the nitrilase superfamily by virtue of their sequence similarities, including thiol proteases
[53], triad hydrolases [54] and amidase signature enzymes [55].
The branch two enzymes are generally aliphatic amidases, and comprise a small group of
nearly identical proteins found mainly in Bacillus, Brevibacteria, Helicobacteria and
Pseudomonas [9]. They hydrolyse substrates such as the carboxamide sidechains of
glutamine and asparagines using the conserved cysteine found in the nitrilase superfamily.
The Pseudomonas amidase now has a predicted three-dimensional structure [10]. While
branch two amidases hydrolyse small-molecule substrates, the branch three enzymes
convert tertiary amino acid residues to secondary residues [8] and are generally described
as amino-terminal amidases. Typically, bacterial nitrile hydratases are co-expressed with an
amidase. Nitrile hydratase and amidase structural genes are co-transcribed in
Brevibacterium R312 [56] and Pseudomonas chlororaphis B23 [57]. It is therefore likely
that the branch two enzymes are those mostly involved in nitrile biocatalysis.
Amidases are being increasingly used in the biotechnology arena for production and/or
conversion of valuable intermediates. For example, immobilized penicillin acylase
(amidase) (E.C. 3.5.1.11) is widely used in the production of 6-aminopenicillanic acid from
penicillin [58]. Klebsiella oxytoca contains an (R)-specific amidase, and converts (R,S)-
amide to (R)-acid while the (S)-amide remains unconverted [59]. This enantiomeric
reaction has been developed for large-scale biotransformation by Lonza [60].
1.5 Nitrile biotransformation, biosynthesis and bioremediation
Nitrile compounds (R-C≡N) are widespread in nature where they are mainly present as
cyanoglycosides, cyanolipids, ricinine and phenylacetonitrile produced by plants [61].
Nitriles are also important and versatile intermediates in organic synthesis and used
extensively in industry for the production of polymers and chemicals. For example, nylon-
6,6 polymers and polyacrylonitrile (a plastics and acrylic fibre precursor) are produced
from adiponitrile and acrylonitrile, respectively. Nitriles are also used as solvents,
extractants, pharmaceuticals, feedstock, drug intermediates (chiral synthons), and
pesticides, as well as in organic synthesis of amines, amides, amidines, esters, carboxylic
Chapter 1 10

acids, aldehydes, ketones and heterocyclic compounds. Applications of nitrile-hydrolysing
enzymes include production of amides and acids such as acrylamide, nicotinic acid and
lactic acid from their corresponding nitriles [62], and the conversion of α–aminonitriles to
optically active amino acids [63]. Enantioselective hydrolysis of α-hydroxynitriles
(cyanohydrins) [64] and the production of optically active 2-arylpropionic acids, ibuprofen
[65] and naproxen [66, 67] have also been achieved using nitrile-converting biocatalysts.
Nitriles contain the cyanide group (-CN) and used to be referred to as cyanides. Most small
nitriles are soluble in water, but their solubility decreases with longer chain lengths or
inclusion of aromatic structures. For this reason, most reaction mixtures incorporate up to
5% (v/v) methanol as a co-solvent. Nitriles can be made by one of several routes, including
the dehydration of amides, or addition of hydrogen cyanide to carbonyl groups (aldehydes
and ketones). Traditionally, acid or alkaline hydrolysis of nitriles is used to form the
corresponding amide or acid from a nitrile (Figure 6). Chemical transformations of nitriles
require relatively severe conditions and often generate toxic by-products [68-70].
Figure 6: Alkaline and acid hydrolysis of nitriles.
Nitriles can be hydrolysed to carboxylic acids, partially hydrolysed to amides, reduced to
primary amines (Figure 7), or selectively unconverted by regio-specific catalysts where
there are multiple nitrile groups on one molecule.
Figure 7: Schematic addition of cyanide to a molecule providing an additional carbon
and nitrogen for subsequent conversion to other functional groups.
Chapter 1
R N + 2H2OKOH, 200oC
conc. HCl, 100oC OH
O
R
R1 N+
2H2O OH
O
R1
H2O
H2NH2
R1
NH2
O
R1R1 CN
11

In synthetic chemistry, nitriles are important sources (as precursors) of amides and
carboxylic acids via hydrolysis. A wide range of nitriles are substrates for nitrilases and
NHases. The enzyme-catalysed hydrolysis of nitriles has advantages over the traditional
organic synthesis route in many ways: The reaction proceeds under relatively mild
conditions (neutral pH and room temperature), and often with regio-, chemo- and
stereoselectivity [69]. Chemoselective hydrolysis of cyano functional groups, without any
effect on other functional groups such as esters, can also be enzymatically achieved [71].
The study of nitrile metabolism revolves around three major viewpoints, namely
biotransformation, biosynthesis and bioremediation. The application of these processes in
industry is becoming increasingly useful. Production of acrylamide from acrylonitrile is an
ongoing, commercially successful, biotransformation using NHase [1], as is the production
of nicotinic acid from 3-cyanopyridine using nitrilase [24]. Biosynthesis of the plant
hormone indole-3-acetic acid from indole-3-acetonitrile is another useful nitrile-converting
activity that has found a footing in industry [22]. The remediation of highly toxic nitrile-
containing wastes and the metabolism of nitrile-containing herbicides have proven useful
in environmental management [60]. Synthetic fibre production results in large amounts of
propionitrile as waste, and this was successfully converted by cells of Rhodococcus
erythropolis to ammonium propionate which is useful as a feed supplement [72].
The enzymatic synthesis of enantiopure carboxylic acids using nitrilases reached another
major milestone when Yamamato and co-workers produced (R)-mandelic acid from
mandelonitrile using Alcaligenes faecalis whole cells [73]. However, due to the limited
availability and stability of nitrilase enzymes, work on enantiopure compounds did not
progress much during the 1990’s. Recent developments in the technologies used to
improve enzymes, such as directed evolution techniques, have greatly influenced the use of
nitrilase in applied biocatalysis. One such example is that of the newly engineered papain
nitrile hydratase for use as a biocatalyst by Dufour and co-workers [74].
Papain, a cysteine protease, was successfully converted into an enzyme with nitrile
hydratase activity through protein engineering. This was achieved by replacing Gln19 in the
oxyanion hole of papain with a glutamic acid residue. The nitrile substrate forms a covalent
thiomidate adduct with the active site thiol group of the enzyme. The Glu19 residue
participates in the acid-catalysed hydrolysis of the thiomidate to an amide by providing a
Chapter 1 12

proton to form a more reactive protonated thiomidate. The hydrolysis of nitrile substrates
therefore proceeds in a stepwise manner. First, the nitrile is hydrolysed to the
corresponding amide. Since the Q19E mutant protein retains most of the natural amidase
activity of natural papain, the amide is then further hydrolysed in the second step to the
corresponding carboxylic acid. This mutant enzyme is considered a nitrilase in overall
function, since it possesses both nitrile hydratase and amidase activities. The mutant papain
is stable, active in organic solvents and at low pH, and is specific for peptide-based
substrates. To illustrate the uses of this engineered protein, the mutant enzyme has since
been used to synthesise amidrazones (that serve as intermediates in the synthesis of key
components of biologically active molecules) with a more than 4000-fold increase in rate
of production over the wild-type activity, and with a much higher level of purity [75].
Due to the hydrophobic nature of most nitriles, organic solvents are usually added to the
reaction medium during nitrile-conversion by nitrilases and serves to enhance the
bioavailability of the substrate. However, complete solubilisation of the substrate is not
necessary for enzymatic conversion. Moreover, some solvent systems significantly
enhance the enantioselectivity of certain enzymes. For example, hexane and acetone
improved the enantioselectivity of the asymmetrization of 3-arylglutaronitriles [76].
Unfortunately, many of these nitrile-hydrolysing enzymes cannot be used in the presence
of organic solvents, especially at high concentrations, which hampers their applicability to
situations where the organonitrile substrate is very poorly soluble in water. Water-miscible
solvents such as methanol and ethanol have been shown to be suitable cosolvents for
purified enzyme only in concentrations of up to 20% (v/v), above which inactivation
occurs. However, a purified NHase from Rhodococcus equi displayed activity in the
presence of high concentrations of water-immiscible hydrocarbons, for example up to 90%
(v/v) isooctane [77]. Purified high molecular mass NHase from Rhodococcus rhodochrous
is unusually stable, retaining 89 – 100% of its original activity in alcohols, and showing
appreciable activities in 50% (v/v) ethylene glycol, dimethyl sulfoxide and acetone [76].
This enzyme may be unusually tolerant to organic solvents due to its complex quaternary
structure, the holoenzyme being composed of 20 subunits [76].
Chapter 1 13

1.6 Nitrile Hydrolysis Activity Assays
The current methods for measuring or estimating nitrile hydrolyzing activity are limited
and most of them have many disadvantages. There is a need to explore and develop more
appropriate assaying procedures for nitrile activity. Most of the methods currently used
rely on measurement of the ammonia formed from nitrile hydrolysis.
1.6.1 The Ninhydrin Assay
The ninhydrin method, which detects α-amino acids colorimetrically, is now an uncommon
and old-fashioned method used to measure nitrile hydrolysis. Hydrolysis of an α-amino
nitrile gives an α-amino acid which is reacted with ninhydrin reagent. The originally
yellow ninhydrin reagent forms a purple anion that is colorimetrically measured at 570 nm.
The assay is limited, however, to the type of nitrile hydrolysis being detected, and is non-
specific for the type of α-amino acid produced.
1.6.2 Nesslerization
Nesslerization refers to the determination of ammonia using the Nessler method. Addition
of Nessler reagent to a solution containing ammonia produces an orange-brown colour
after development for a certain amount of time. This colour is read spectrophotometrically
between 400 and 425 nm. Unfortunately, the assay is interfered with by several inorganic
ions and some organic solvents, and the sensitivity of the method is very low (with
accuracy only between 0.4 – 5.0 mg ammonia/L) [78]. Calcium and magnesium ions for
example, can cause cloudiness of the reagent. Nesslerization is a common method for
determination of nitrile hydrolysing activity, and is used to measure quantitatively the
concentration of ammonia produced by the reaction. Most nitrogen in bacteria is
assimilated and released in the form of ammonia, and this method would not necessarily
only measure ammonia produced from nitrile hydrolysis when whole cell samples are
used.
Chapter 1 14

1.6.3 The Berthelot Method
The Berthelot method for measuring nitrile-hydrolysing activity is also referred to as the
phenol/hypochlorite method. Ammonia liberated from nitrile hydrolysis is quantified
colorimetrically at 640 nm after reaction with phenol/hypochlorite reagent. The procedure
requires heating of the test solution at 90 °C for 30 min or 100 °C for 5 min. Heating is
disadvantageous since vaporization of toxic phenols can occur. Also, insoluble MnO2 (used
as a catalyst) is formed, which interferes with the spectrophotometric determination. It is
reportedly sensitive in the range of 20-200 µM NH4Cl and at least 2 hours are required for
development of a stable fluorochrome [79]. There are several disadvantages to this method
other than the use of corrosive reagents, including the requirement for large samples due to
the low sensitivity of the assay.
1.6.4 A Fourier Transform Infrared Method
Nitrilase-catalysed reactions have been monitored in real-time using a silicone probe with
Fourier-transform IR technology [80]. A major drawback to an assay of this nature is the
lack of availability of such an instrument and probe in most biological laboratories.
Another problem is that the method is again insensitive. However, the technique may
provide kinetic data for nitrile hydrolysis under certain conditions, such as high nitrile
concentrations.
1.6.5 A Colorimetric pH Method
Kaul et al. (2004) have described measurement of nitrilase activity in several
microorganisms using a pH-sensitive indicator-based colorimetric assay [81]. Reaction
mixtures consisted of bromothymol blue (BTB) as indicator, mandelonitrile as substrate,
and whole cell culture as the source of enzyme. The colour change (green to yellow) could
be monitored over two hours. This method is of limited applicability due to poor
sensitivity, and the possibility of false reactions due to the generation of metabolic acids by
the microorganism (this is particularly true of yeasts).
Chapter 1 15

1.6.6 Fluorimetric Methods
Banerjee et al. (2003) described a fluorimetric assay method for the measurement of
nitrilase activity, in which 3-cyanopyridine was hydrolysed to nicotinic acid using
Rhodococcus rhodochrous [82]. The ammonia liberated in the reaction is reacted with a
buffered OPA (o-phthaldialdehyde) solution containing 2-mercaptoethanol and allowed to
form a fluorescent isoindole derivative. The fluorescence intensity of the resultant
fluorochrome is measured using excitation and emission wavelengths of 412 and 467 nm,
respectively. Unknown concentrations of ammonia are determined from a standard curve
constructed using known concentrations of NH4Cl. A unit of nitrile-hydrolysing activity
was defined as the amount able to release 1 µmol of NH3/ min per mg of cells. Their study
showed that this fluorescence method was more sensitive (2.5 – 1000 µM NH4Cl) than
previously used methods as summarised above [82].
Mana and Spohn [83] reported a method for determination of NH4+ ions using fluorimetric
flow-injection analysis based on the same principle of isoindole derivative formation.
However, the reported linearity range (0.05 – 100 µM NH4Cl) differed substantially from
that stated by Banerjee et al. (2.5 – 1000 µM NH4Cl) [82]. Although the sensitivity of the
OPA-based method used by Banerjee et al. (2003) is reportedly high, it has been suggested
by Goddard and Reymond (2004) that only very potent enzymes can be detected using this
method [84]. This is due to the fact that signal of the fluorescent isoindole chromophore
requires very high concentrations of substrate (100 mM) in order to be detectable.
1.7 Rhodococcus rhodochrous as the chosen biocatalyst
Rhodococcal nitrilases and nitrile hydratases are the best characterised of the nitrile-
degrading enzymes. By virtue of their ability to degrade a wide variety of nitrile
compounds they have found many uses in industry, and applications of their activity have
afforded useful industrial processes. Rhodococcus sp. R312 and Rhodococcus erythropolis
NCIMB 11540 whole cells, for example, were used to transform β-amino nitriles to β-
amino amides/acids [85], which have important pharmacological functions due to their
antibiotic [86-88], antifungal [89, 90] and cytotoxic [91] properties. Rhodococcus equi A4
is an efficient biocatalyst for chemoselective and diastereoselective transformations [92].
Chapter 1 16

Although many Pseudomonal nitrile-metabolising enzymes have been studied, they
generally have narrower substrate ranges than the Rhodococcal enzymes [93, 94].
Nitrile converting enzymes are found in Rhodococcus bacteria from geographically diverse
locations, including shallow marine sediments [95], deep-sea sediments [96] and various
soil types, including garden soil [66, 97, 98], subtropical rain forest soil [99], mangrove
mud [99] and contaminated river bank soil and sludges [100, 101]. The suitability of the
organism to diverse habitats accounts for the numerous types of nitrile metabolising
enzymes found within the species, including enzymes with wide pH and temperature
profiles from mesophilic and thermophilic organisms [102, 103]. The majority of
Rhodococcal nitrilases, nitrile hydratases and amidases referred to in literature are
inducible enzymes [12, 16, 81, 102, 104, 105].
The previously demonstrated broad nitrile substrate profile of Rhodococcus rhodochrous
ATCC BAA-870 by Brady et al. (2004), and its ability to be cultured using different
nitriles as the sole nitrogen source have made the organism a good target for further
investigation [106]. The relative growth of the organisms isolated from culturing on
various nitrile nitrogen sources is summarised in Table 1, while the relative activities of
various biocatalysts against different nitriles is summarised in Table 2. Rhodococcus
rhodochrous ATCC BAA-870 was cultured using 3-hydroxy-3-phenylpropionitrile as the
sole nitrogen source and was found to grow on 13 of the 17 growth substrates (Table 1). Of
these, the organism showed good or exceptionally good growth on at least 11 compounds.
Its ability to utilise benzamide, adipamide and acetoxy-phenylacetamide as sole nitrogen
sources suggested it contained amidase activity. Rhodococcus rhodochrous ATCC BAA-
870 converted 100% of benzonitrile, chlorobenzonitrile and naproxen nitrile, and displayed
fair activity towards phenylglycinonitrile, 1,2-cyanonitrile, 3-hydroxy-3-
phenylpropionitrile and benzylnitrile (Table 2). Both aliphatic and aromatic nitriles could
be utilised by the organism and its applications as a biocatalyst would therefore be
favourably versatile.
Chapter 1 17
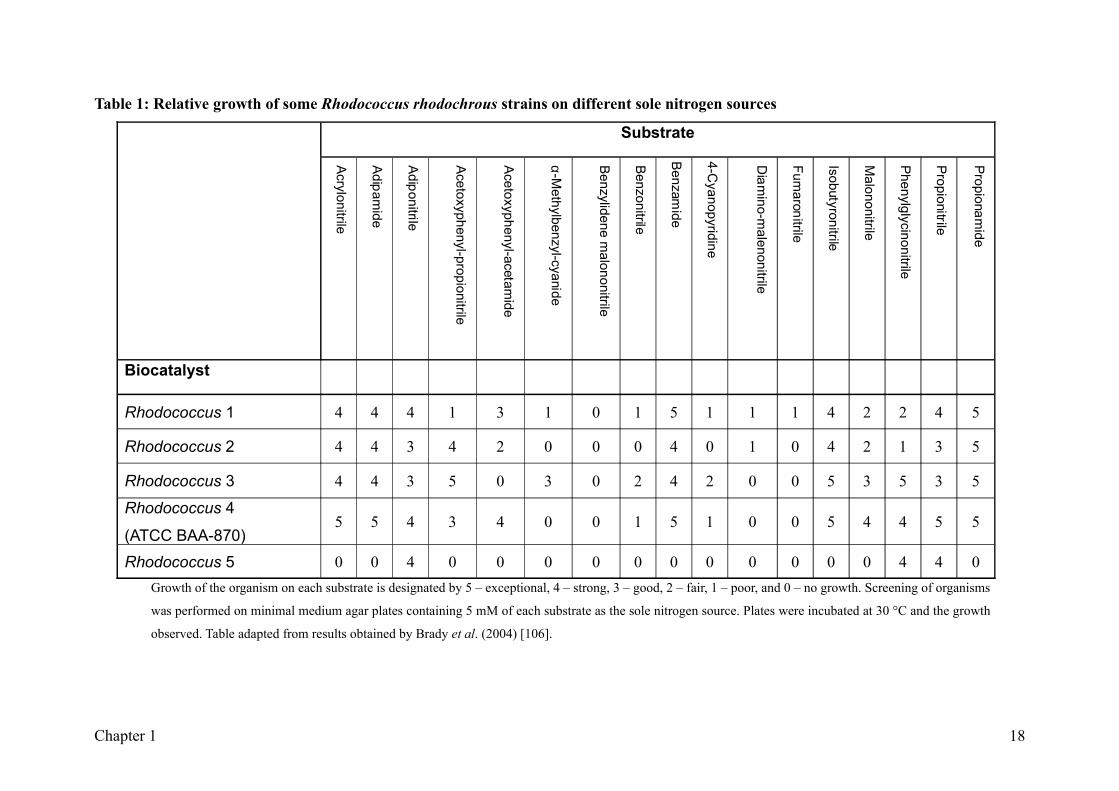
Table 1: Relative growth of some Rhodococcus rhodochrous strains on different sole nitrogen sources
Substrate
Acrylonitrile
Adipamide
Adiponitrile
Acetoxyphenyl-propionitrile
Acetoxyphenyl-acetamide
α -Methylbenzyl-cyanide
Benzylidene malononitrile
Benzonitrile
Benzamide
4-Cyanopyridine
Diam
ino-malenonitrile
Fumaronitrile
Isobutyronitrile
Malononitrile
Phenylglycinonitrile
Propionitrile
Propionamide
Biocatalyst
Rhodococcus 1 4 4 4 1 3 1 0 1 5 1 1 1 4 2 2 4 5
Rhodococcus 2 4 4 3 4 2 0 0 0 4 0 1 0 4 2 1 3 5
Rhodococcus 3 4 4 3 5 0 3 0 2 4 2 0 0 5 3 5 3 5
Rhodococcus 4
(ATCC BAA-870)5 5 4 3 4 0 0 1 5 1 0 0 5 4 4 5 5
Rhodococcus 5 0 0 4 0 0 0 0 0 0 0 0 0 0 0 4 4 0Growth of the organism on each substrate is designated by 5 – exceptional, 4 – strong, 3 – good, 2 – fair, 1 – poor, and 0 – no growth. Screening of organisms
was performed on minimal medium agar plates containing 5 mM of each substrate as the sole nitrogen source. Plates were incubated at 30 °C and the growth
observed. Table adapted from results obtained by Brady et al. (2004) [106].
Chapter 1 18

Table 2: Percentage substrate conversion of selected commercial nitrilases and biocatalysts% Conversion
O-A
cetoxyphenyl-acetonitrile
Benzylnitrile
α -Methylbenzyl-cyanide
2-Phenyl-glycinonitrile
Mandelonitrile
3-Hydroxy-3-phenylpropionitrile
2-Phenyl-butyronitrile
Benzonitrile
N-P
henyl-glycinonitrile
1,2-Cyanonitrile
Chlorobenzonitrile
p-Tolunitrile
3,4-Dim
ethoxy-benzonitrile
3-Phenyl-propionitrile
Naproxen nitrile
Phenylglycinonitrile
BiocatalystBioCatalytics Nit-1001 0 16 0 0 0 0 1 55 100 2 75 4 0 100 0 0BioCatalytics Nit-1004 ND 87 0 0 1 0 0 ND 9 3 ND 19 2 31 ND ND
BioCatalytics Nit-1005 0 78 0 0 0 0 0 100 100 48 100 100 100 100 0 0
BioCatalytics Nit-1006 100 100 0 14 41 0 0 100 7 3 85 0 0 0 0 100
P. fluorescens Nitrilase ND 97 21 89 64 0 1 ND 0 14 ND 0 0 ND ND ND
Rhodococcus ATCC BAA-870 9 14 1 1 2 24 3 100 5 33 100 5 5 6 100 18
Rhodococcus ABFGs ND 22 0 0 1 2 0 ND 30 0 ND 16 3 ND ND ND
Rhodococcus MAWA (C6) ND 100 46 11 6 76 3 ND 2 32 ND 100 44 ND ND ND
Rhodococcus NOVO SP361 ND 102 15 4 2 30 11 ND 41 19 ND 32 24 ND ND ND
Pseudomonas alcaligenes 1 0 ND ND ND ND ND ND 0 ND ND 0 ND ND ND 0 7
Microbacterium 1 0 ND ND ND ND ND ND 0 ND ND 0 ND ND ND 40 9
Alcaligenes faecalis 1 0 ND ND ND ND ND ND 0 ND ND 0 ND ND ND 2 12Conversion of each substrate is a percentage conversion. ND – not determined. Reactions were analysed using a Phenomenex Luna C18 column (from Separations) and a
Hewlett Packard Series 1100 Chromatograph with a Photo Diode Array detector (PDA). Gradient elution of compounds was done according to the method developed by N.
Wilde (2001, personal communication) and modified by G. Kupi (2003, personal communication), using a 1 ml/min flow rate, 5 µl injection volume, and 20 minute run time.
Table compiled from results obtained by Brady et al. (2004) [106].
Chapter 1 19
1.8 Objectives and potential applications of the research
Nitrile-converting enzymes are versatile biocatalysts and their applications are becoming
increasingly recognised for the production of several pharmaceutically important
compounds and fine chemicals. Although useful, they are generally not commercially
available and are extremely limited in variety. The scarcity of suitable and/or well-
characterised nitrile-converting biocatalysts has left a huge gap in the market for
development of the enzymes as a product available for specific reactions, or even as a
broad kit of enzymes with many purposes. Chemical industries make extensive use of
nitrile compounds for manufacturing a variety of polymers and other chemicals, and the
potential for nitrile-converting biocatalysts in these processes is great. Biocatalysis is a
much ‘greener’ approach to synthesis or treatment of compounds since enzymes work
under milder conditions and are non-destructive. By virtue of their capability to eliminate
highly toxic nitriles, nitrile-degrading enzymes also play a significant role in protecting the
environment.
The search for nitrile-hydrolysing enzymes with unique and improved properties, such as
higher activity and stability, for use in commercial processes is ongoing. The current
research may ultimately afford a new, efficient nitrile-converting biocatalyst that will add
to the rapidly expanding field of biotechnology, whether as a whole cell application for
selective activity or a partially purified enzyme preparation. Viral protease inhibitors have
been synthesized using β-hydroxynitriles as intermediates in the synthetic pathway, and
therefore exploration of the activity profile of Rhodococcus rhodochrous enzymes against
β-substituted nitriles may yield potential novel routes or intermediates for
biotransformations under milder conditions.
The biocatalyst studied herein is a bacteria isolated from South African soil. This brings
the opportunity to apply an indigenous biocatalyst to processes that are of use in this
country. The useful nitrile-metabolising activity of Rhodococcus rhodochrous ATCC BAA-
870 is explored herein. The development of appropriate activity assaying methods was
investigated for the purpose of finding assays specific enough for identifying nitrile
hydrolysing activity in both whole cell extracts and purified enzyme reactions. A nitrile-
hydrolysing assay with easily-identifiable colour change would be of use in the discovery
Chapter 1 20
of new enzyme sources, and could be applied to high-throughput screening of microbes or
enzymes with certain substrate specificities. The existing high performance liquid
chromatography assay for identifying nitrile hydrolysis is investigated and optimised for
the activity found within the studied organism. Buffer type and pH, and the influence of
time and protein concentration on nitrile hydrolysis is investigated with the aim of assaying
nitrile-converting activity with suitable parameters. In this study, enzyme separation
strategies are also investigated. An enzyme preparation with industrial use need not
necessarily be pure, but rather be one where specific activities can be easily separated in a
one-step process. The potential biocatalyst, Rhodococcus rhodochrous ATCC BAA-870,
displayed two types of activity in previous studies. This study aims to investigate the
nitrile-metabolising activities of the organism, namely that due to the nitrile
hydratase/amidase enzyme system. Assays for measuring this activity will be explored and
further developed, and strategies for the one-step separation of the enzyme activities using
chromatographic techniques will be investigated.
Chapter 1 21
Chapter 2
2 Materials and Methods
2.1 Materials
2.1.1 Chemicals
All chemicals, unless otherwise stated, were purchased from Sigma Aldrich. Precision Plus
protein standards and BioRad Protein Concentration Determination Reagent were obtained
from BioRad.
2.1.2 Nitrile Stocks
Nitriles, and the products thereof, were made up as 100 mM stock solutions in methanol.
The compounds 3-hydroxy-3-phenylpropionitrile and 3-hydroxy-4-phenylvaleronitrile
were synthesized by R. Pieterson and M. Molefe (CSIR, BioSciences).
2.1.3 Commercial Nitrilases
Broad-range purified Nitrilases-1001, -1005 and -1006 (catalogue numbers NIT-101, NIT-
105 and NIT-106, respectively) were obtained from Biocatalytics Inc. (USA). Purified
nitrilases from Pseudomonas fluorescens, Rhodococcus rhodochrous and Arabidopsis
thaliana (recombinant from Escherichia coli) were purchased from Fluka/ Sigma Aldrich.
2.1.4 Organism and Media
Rhodococcus rhodochrous ATCC BAA-870 was isolated from soil and characterised based
on morphological and substrate-usage profiling at the Onderstepoort Veterinary Institute,
South African Agricultural Research Council. The 16S rRNA was sequenced by the
University of Cape Town. Lyophilised stores of the organism cultured in defined medium
were available as part of an internal culture collection at CSIR Biosciences (South Africa).
Chapter 2 22

Tryptone soya broth was obtained from Anatech (Scharlau Chemie, S.A. Barcelona). Its
formula in g/L was: casein peptone, 17.0, soya peptone, 3.0, sodium chloride, 5.0,
dipotassium phosphate, 2.5, and dextrose, 2.5. The approximate pH of the media was 7.3.
Minimal medium consisted of a defined salt medium (4.97 g/L NaHPO4, 0.2 g/L KH2PO4,
0.05 g/L CaCl2.2H2O, 0.09 g/L FeSO4.7H2O and 0.02 g/L MgSO4) containing 1.2 g/L
glucose, 1 ml/L trace element solution (0.2 g/L ZnSO4.5H2O, 0.4 g/L CuSO4.5H2O, 0.004
g/L CoSO4.7H2O, 50 g/L trisodium citric acid and 0.4 g/L MnSO4.H2O) and 20 mM
benzonitrile as inducer [97].
2.1.5 Column Chromatography
Gel exclusion protein standards were purchased from BioRad. Sephacryl S-200 gel
exclusion media with a fractionation range in relative molecular mass (Mr) of 5 x 10³ – 2.5
x 105 was obtained from Bio-Rad/Amersham Biosciences. Blue Dextran 2 000 was from
Pharmacia, Uppsala, Sweden. Polybuffer 74 and Polybuffer Exchanger 94 were purchased
from Amersham Biosciences. TOYOPEARL Super-Q 650M ion exchange media was from
TOSOH Bioscience.
Chapter 2 23

2.2 Methods
2.2.1 Rhodococcus rhodochrous ATCC BAA-870
2.2.1.1 Routine Maintenance of Rhodococcus rhodochrous Cultures
Rhodococcus rhodochrous ATCC BAA-870 was originally isolated from soil samples by
Brady et al. (CSIR) using the enrichment method of Layh et al. (1997) [97]. Prior to
growth on defined medium agar plates, the cultures were enriched in nutrient agar. Isolate
biomass was stored as lyophilised powder at -80 °C, and regenerated by addition of a small
amount of sample to tryptone soya broth. The culture was grown at 30 °C with shaking at
200 rev./min for 24 hours. Streak plates were made of the culture and incubated at 30 °C
for observation. The inoculum was diluted 1:100 into fresh tryptone soya broth. Streak
plates were stored at 4 °C until further culturing was necessary.
2.2.1.2 Observations of Rhodococcus rhodochrous Growth
Routine streak plates from both liquid broth culture and other streak plates were made of
the organism. Plates were incubated at 30 °C and kept for different periods. A Sony
Cybershot digital camera was used to take photographs of various streak plates at different
stages of growth.
2.2.1.3 Microscope Observations of the Life Cycle of Rhodococcus
rhodochrous
Microscope slides of samples of Rhodococcus rhodochrous ATCC BAA-870 at various
stages of growth were prepared by smearing a bacterial colony with a drop of distilled
water or using a drop of culture directly on a slide. Slides were viewed under high power
using an Olympus BX40 microscope equipped with a Sony 3CCD colour video camera/
CCD-iris. Samples included culture grown in minimal media for different time periods, as
well as on rich medium (tryptone soya agar) plates for up to two weeks. The stages of
growth were then compared.
Chapter 2 24

2.2.1.4 Rhodococcus rhodochrous Growth Curves in Different Media
Tryptone soya broth was selected as the rich media of choice since the organism was
observed to grow well on tryptone soya agar. Defined minimal medium had benzonitrile
added to a concentration of 20 mM to induce production of nitrile hydrolysing enzymes
during growth. An overnight inoculum of Rhodococcus rhodochrous ATCC BAA-870 was
diluted 1:100 in tryptone soya agar for rich medium studies or defined medium for minimal
media studies and flasks incubated at 30 °C with shaking at 200 rev./min. Aliquots of the
culture were taken at hourly intervals from duplicate flasks and the optical densities
measured at 600 and 660 nm using a DU 800 Spectrophotometer.
2.2.1.5 Dry Cell Weight Determination
Eppendorf tubes (2 ml) were labelled and placed in a 105 °C drying oven for 24 hours with
their lids open. Tubes were then placed in a desiccator for an hour to cool, and the mass of
each recorded. Samples of Rhodococcus rhodochrous ATCC BAA-870 culture were
pipetted in 2 ml volumes into the Eppendorf tubes and centrifuged at 13 000 g for 5 min in
a standard microcentrifuge. The supernatant was discarded and the pellet washed with 2 ml
distilled water, 2 ml 0.1 M HCl and 2 ml distilled water again. The pellet was then placed
in a 105 °C drying oven for 24 hours with their lids open. Tubes were then cooled and
dried in a desiccator for one hour. Each tube was weighed and the average dry cell weight
calculated.
2.2.1.6 Cell Disruption Study
Rhodococcus rhodochrous ATCC BAA-870 grown in 200 ml minimal media for
approximately 28 hours at 30 °C with shaking was harvested by centrifugation at 8 000 x g
for 15 minutes at 4 °C. Pellets were resuspended with, and washed twice in 50 mM
phosphate buffer, pH 7.4. After re-centrifugation, pellets were resuspended as an
approximately 1 g/ml whole cell broth, and aliquoted into 2 ml volumes. Lysate volumes
were sonicated using a Vibra CellTM sonicator from Sonics & Materials Inc. (Danbury,
Conneticut, U.S.A.) for a total of up to six minutes (30 s on, 30 s off), sampled at one
minute intervals. Microscope slides of samples of Rhodococcus rhodochrous at different
stages of sonication were prepared by adding 100 µl of sonicated broth to a drop of
distilled water. Slides were viewed under high power using an Olympus BX40 microscope
Chapter 2 25

equipped with a Sony 3CCD colour video camera/ CCD-iris. Volumes of lysate were tested
for activity against benzonitrile and measured using high performance liquid
chromatography (HPLC) as described below in section 2.2.3.
2.2.1.7 BioRad Protein Concentration Determination Assays
Dye reagent was prepared by adding one part dye reagent to 4 parts distilled water and
filtered through Whatman® number 1 filter paper to remove particulates. Bovine serum
albumin (BSA) standards in the range 0.2 – 0.9 mg/ml were prepared in duplicate, and 100
µl of each added to 5 ml dye reagent. After vortexing, standards were incubated at room
temperature for a minimum of 5 minutes. The absorbance at 595 nm was read using a
Beckman Coultier DU 800 Spectrophotometer and a standard curve constructed (see
Appendix). The sample of unknown concentration (100 µl) was added to 5 ml dye reagent
and treated in the same manner. If required, dilutions of the unknown sample were
prepared until the absorbance reading fell within the linear range of the standard curve.
2.2.1.8 Preparation and Storage of Rhodococcus rhodochrous Supernatant
Rhodococcus rhodochrous was cultivated in 2 L shake flasks containing 400 ml defined
minimal media at 30 °C with shaking at 200 rev./min. After growth for 28 – 30 hours, cells
were harvested by centrifugation at 8 000 x g at 4 °C for 30 minutes, and washed twice
with 50 mM potassium phosphate buffer, pH 7.4. Cells were stored at -20 °C as
approximately 1 mg/ml suspensions in 20 mM potassium phosphate buffer, pH 7.4. To
prepare supernatant, cell suspensions were thawed on ice before sonicating for a total of
five minutes. Lysate was centrifuged at 8 000 x g for 30 minutes at 4 °C and the
supernatant collected.
2.2.2 Assays for Measuring Nitrilase/ Nitrile Hydratase Activity
2.2.2.1 Colorimetric Method
A pH-sensitive indicator-based assay based on experiments done by Kaul et al. (2004) [81]
was used to identify nitrilase and nitrile hydratase activity first in solution using cuvettes,
and secondly in agarose plate wells (Figure 8). An attempt to establish an easily detectable
assay for locating nitrilase activity on a native PAGE gel was undertaken. The assay
Chapter 2 26

involved using bromothymol blue as indicator for detecting a drop in pH on formation of
the corresponding acid from a nitrile.
Figure 8: Schematic representation of the method used for colorimetric identification
of nitrilase or nitrile hydratase activity.Blue colour represents solutions containing 0.05% (v/v) bromothymol blue and 2 mM benzonitrile
in 0.01 M potassium phosphate buffer, pH 7.2, with either commercial nitrile standards (1 mg/ml)
or whole cell culture. pH-induced colour change is shown in yellow. Colour change was monitored
over 2 hours. (A) Cuvettes containing 2 ml final reaction volumes showed colour changes using
both 0.05 and 0.01% (v/v) BTB indicator concentrations. (B) Only wells containing 10 and 20 µl
of commercial 1 mg/ml nitrilase exhibited yellowing of BTB-containing agarose with increasing
intensity respectively. Control reactions containing no enzyme showed no colour change.
The buffering capacity of potassium phosphate buffer at pH 7.2 was tested using
phenylglycinonitrile, benzonitrile and chlorobenzonitrile. Each substrate was added to the
buffer to a final concentration of 2 mM and the pH tested. Substrates were only used if the
pH of the final reaction mix was approximately 7.2. Agar plates (15 g/L) were made in
0.01 M potassium phosphate buffer, pH 7.2, and benzonitrile (2 mM) and 0.01 or 0.005%
(v/v) bromothymol blue added after autoclaving. Wells were punched into the plates using
a 2 ml disposable syringe. Increasing volumes of commercial Nitrilase 1005 (1 mg/ml) was
added to the wells and incubated at 30 °C. One well on each plate was used as an enzyme-
negative control. SDS-PAGE gels of commercial nitrilase enzymes were overlayed onto
bromothymol blue-containing agar plates, and incubated overnight at 30 °C in order to test
whether the acid-forming activity of the enzymes could be colorimetrically measured using
an overlay method.
Chapter 2
A
B
27

2.2.2.2 Fluorimetric Method for Determining Nitrilase Activity
A method based on formation of a fluorescent isoindole derivative from ammonia
produced during nitrilase activity was developed by Banerjee et al. (2003) [82]. Ammonia
released during the reaction reacts further with a buffered alcoholic o-phthaldialdehyde
solution, and the fluorescent derivative formed can be measured using excitation and
emission wavelengths of 412 and 467 nm, respectively. The method was reported by the
authors to be rapid and sensitive in the range of 100 to 1000 µM substrate concentration. A
buffered OPA/2-mercaptoethanol reagent was made by combining 4.5 ml of each of
solution A (75 mM OPA in ethanol) and B (72 mM 2-mercaptoethanol in ethanol) with 91
ml 0.2 M phosphate buffer, pH 7.4. All solutions were filtered using a Cameo 25SS PES
0.22 µm filter (Osmonics). Increasing concentrations of NH4Cl were reacted with buffered
alcoholic OPA reagent in order to construct a standard curve for unknown ammonia
concentration determination. Fluorescent isoindole derivatives were allowed to develop by
incubation at room temperature for 20 minutes prior to measurement. A PerkinElmer LS 55
Spectrometer was used to measure the intensity of emission at 467 nm when excited at 412
nm, using a 2.5 nm slit width and a scan speed of 200 nm/min. Standard curves were
generated using potassium phosphate, sodium phosphate and Tris buffers. Whole cell
Rhodococcus rhodochrous culture and commercial nitrilase enzymes (Nitrilase 1001, 1005
and 1006) were used as enzyme sources in the reactions. Substrates tested included
phenylpropionitrile, benzonitrile, chlorobenzonitrile, phenylglycinonitrile, mandelonitrile,
naproxen nitrile, fumaronitrile and malononitrile. Reactions consisted of 5 mM substrate,
0.2 ml cell suspension or supernatant and 175 mM phosphate buffer, pH 7, to a final
volume of 2 ml. Reactions were incubated at 50 °C for 20 minutes and stopped by the
addition of 2 ml HCl. After centrifugation at 5 000 x g for 10 minutes, 100 µl of each
reaction was added to 3 ml OPA/2-mercaptoethanol reagent and developed for 20 minutes
at room temperature. Assay troubleshooting included lowering the reaction temperature to
30 °C and increasing the incubation time to 2 hours in order to make the assay more
sensitive.
A modified method of the above assay was attempted to spot bands in polyacrylamide gel
electrophoresis (PAGE) gels with ammonia-forming activity. Commercial nitrilase samples
were prepared and run in duplicate non-denaturing PAGE gels. One gel was equilibrated
with 100 mM phosphate buffer, pH 7, using slow shaking at 25 °C for further testing using
Chapter 2 28
OPA while the other gel was Coomassie stained (Section 2.2.5). After equilibration, the
first gel was immersed in 17.5 ml 100 mM phosphate buffer, pH 7, to which 0.5 ml of 1 M
benzonitrile was added. The gel in the reaction mixture was incubated for 20 min at 30 °C
with slow shaking. OPA/2-mercaptoethanol reagent (9 ml) was then added and the gel left
to develop at room temperature for 20 min. The gel was viewed under a UV lamp.
2.2.3 Assay Development: High Performance Liquid Chromatography
2.2.3.1 RP-HPLC Method Set
All samples, unless otherwise indicated, were run according to the following reversed-
phase HPLC (RP-HPLC) method using a Waters 2690 Separations Module HPLC with 996
Photodiode Array Detector. The column used was a 100 x 4.6 mm Chromolith
Performance SpeedROD RP–18e (Merck, Germany, cat # 1.02129.0001).
Injection volume: 20 µl
Run Time: 10 minutes
Column Temperature: 28.0 °C
Flow rate: 0.5 ml/min
Isocratic elution: 6% TFA(aq) : 40% ACN
Degasser: on
Data were acquired with the PDA (with a 200 to 300 nm wavelength range) that generated
3D data (Figure 9). A plot of absorbance versus wavelength indicates the maximum
absorbance values of multiple wavelength maxima (Figure 10). Integration and data
analysis was done using Millennium32 Version 3.05.01 (© 1998 Waters Corporation)
software. The instrument was primed, and the column equilibrated for at least 2 hours
before each run.
Chapter 2 29

Figure 9: Three-dimensional contour map of absorbance with wavelength and elution
time for benzonitrile as acquired by the photodiode array detector in HPLC.The optimum absorbance and concentration is defined by the highest contour density. A 5 mM
sample of benzonitrile prepared in eluent, was isocratically eluted using 40% acetonitrile: 6%
aqueous trifluoracetic acid. Arrows indicate the retention time and absorbance maximum at which
data is extracted.
Figure 10: Two-dimensional chromatograph of a 5 mM benzonitrile sample showing
absorbance over time at 224.1 nm.Data were extracted from the three-dimensional contour map at the absorbance maximum of
benzonitrile (224.1 nm). The sample was eluted isocratically using 40% acetonitrile: 6% aqueous
trifluoracetic acid.
2.2.3.2 Qualitative HPLC Tests
Purified nitrilases from Pseudomonas fluorescens, Rhodococcus rhodochrous and
Arabidopsis thaliana (recombinant from Escherichia coli) and nitrilases NIT-1001, -1005
and -1006 were tested against benzamide, benzoic acid and benzonitrile by HPLC as a
measure of activity. Each nitrilase (750 µl of a 1 mg/ml stock) was added to 675 µl of a 50
Chapter 2 30
mM phosphate buffer, pH 7.4, and 75 µl of substrate (substrate final concentration 5 mM).
The final reaction volume was 1.5 ml. Standards were made by omitting enzyme from the
reaction. Reactions were incubated at 30 °C for 2 hours with shaking (200 rev./min), after
which they were centrifuged at 3 000 x g for 5 min. A 200 µl aliquot of each was filtered
through a Cameo 25SS PES 0.22 µm filter (from Osmonics) and transferred into a 2 ml
HPLC vial containing 800 µl acidic stop eluent (equal parts acetonitrile and aqueous 0.1%
(v/v) TFA).
2.2.3.3 Comparison of the Fluorimetric Method and HPLC for Measuring Activity
Rhodococcus rhodochrous ATCC BAA-870 cells grown in minimal media for 48 hours
were harvested by centrifugation at 8 000 x g for 15 min. Cells were washed twice in 50
mM phosphate buffer, pH 7.4, containing 20 mM dithiothreitol (DTT), and suspended in
200 µl of the same buffer. The reaction was initiated by addition of 0.05 ml 1 M
benzonitrile and 1.75 ml 50 mM phosphate buffer, pH 7.4, containing 20 mM DTT, and
incubated for 20 min at 30 °C with shaking (200 rev./min). The reaction was stopped by
addition of 2 ml of 0.1 M HCl and the mixture centrifuged at 5 000 x g for 10 min. The
supernatant was used for determining enzyme activity.
For reactions measured using fluorimetry, 1.5 ml buffered OPA solution was added to 0.5
ml supernatant. The generation of the fluorochrome was allowed to develop for 20 min in
the dark at room temperature. Fluorescence intensity was measured using excitation and
emission wavelengths of 412 and 467 nm, respectively, using a PerkinElmer LS 55
Spectrometer with a 2.5 nm slit width and a scan speed of 200 nm/min.
For reactions measured using RP-HPLC, 100 µl of supernatant or control sample was
mixed with 450 µl of each of 0.1% (v/v) aqueous trifluoracetic acid (TFA) and acetonitrile
(ACN), and capped in 2 ml HPLC vials. Control samples included 100 mM solutions of
benzonitrile, benzamide and benzoic acid that were prepared in the same manner except no
cells or enzyme was added. Also, the enzyme Nit-1005 was used as a further control based
on its successful conversion of benzonitrile to benzoic acid in previous HPLC results. All
samples were done in quadruplicate. HPLC results were obtained using the Waters
Chapter 2 31

Integrity™ System with photodiode array detector, using a flow rate of 0.5 ml/min, 20 µl
injection volume and 20 min sample run time. The column was isocratically eluted using
60% acetonitrile and 4% aqueous TFA, and the compounds monitored between 200 and
400 nm.
2.2.3.4 Standard Curves
Concentration standard curves were constructed for benzonitrile, benzamide, benzoic acid,
hydrocinnamonitrile, 3-hydroxy-3-phenylpropionitrile and 3-hydroxy-3-phenylpropionic
acid. Samples of each were made up in the concentration range 0 to 10 mM in 1 mM
intervals from 100 mM stock solutions in methanol. After thorough mixing, 100 µl of each
concentration was pipetted in triplicate into 2 ml HPLC vials containing 900 µl acidic stop
eluent and filtered through a Cameo 25SS PES 0.22 µm filter. Samples were run according
to the set method for nitrile analysis. Integrated peaks were measured as a function of
integration area and absorbance to check linearity of the absorbance detector with
concentration.
2.2.3.5 Commercial Nitrilase Enzyme Reactions
Nitrile substrate (5 mM) dissolved in methanol was added to 50 mM KH2PO4 buffer, pH
7.4. Enzyme dilutions (750 µl) were added to a final volume of 1.5 ml to initiate the
reaction, and incubated at 30 °C for 2 hours with agitation. Controls were prepared in the
same manner except no enzyme was added to the reaction mix. An aliquot (100 µl) of the
reaction mixture was added to 900 µl of acidic stop eluent to a final volume of 1 ml. The
reaction was centrifuged at 13 000 x g for 5 mins, and sealed in a 2 ml HPLC vial for
analysis.
2.2.3.6 LC-Mass Spectral Analysis
Coupled HPLC and mass spectral analysis was performed using the Waters Integrity™
System with photodiode array detector and Thermabeam™ mass detector, using the set
method for nitrile hydrolysis. Mass Spectral results of standards were compared to internal
library spectra from the Millennium32 Version 3.05.01 (© 1998 Waters Corporation)
software. Mass spectral sampling parameters for nitrile analysis were changed to a 20 µl
Chapter 2 32

injection volume and 30 min total sample run time. Initial elution was 0.2 ml/min of 0.1%
(v/v) formic acid for 15 min, followed by 2 min of a 0.3 ml/min 50% methanol:50%
acetonitrile elution, 5 min of 0.1% (v/v) formic acid at 0.25 ml/min, and lastly 8 min of
0.1% (v/v) formic acid at 0.2 ml/min. The column temperature was set at 40 °C. Where
reaction products had been identified, HPLC UV/VIS was often used without the coupled
MS detector.
2.2.3.7 The Effect of Different Buffer Types on Relative Activity
A series of ten different buffer types were made up, including Polybuffer 74 containing 5
mM DTT (pH 4, 5, 6 and 7.4), 100 mM and 50 mM potassium phosphate buffers (pH 7.4),
25 mM imidazole buffer pH 7.4, and 50 mM potassium phosphate buffers containing either
10 mM DTT, 10 mM ethylene diamine tetraacetic acid (EDTA) or 10 mM DTT and 10
mM EDTA, pH 7.4 (Table 3). Each reaction contained 975 µl of buffer, 75 µl of a 100 mM
benzonitrile or hydrocinnamonitrile stock and 450 µl Rhodococcus rhodochrous
supernatant to a final volume of 1.5 ml. Reactions were incubated at 30 °C for 2 hours with
shaking at 200 rev./min and stopped by addition of one part reaction to nine parts acidic
stop eluent. Samples were analysed by HPLC.
Table 3: The ten different buffer types used in this study and their composition
Buffer Number Buffer Composition
1 Polybuffer 74* containing 5 mM DTT, pH 7.4
2 Polybuffer 74* containing 5 mM DTT, pH 6
3 Polybuffer 74* containing 5 mM DTT, pH 5
4 Polybuffer 74* containing 5 mM DTT, pH 4
5 100 mM KH2PO4, pH 7.4
6 50 mM KH2PO4, pH 7.4
7 25 mM Imidazole, pH 7.4
8 50 mM KH2PO4 containing 10 mM EDTA, pH 7.4
9 50 mM KH2PO4 containing 10 mM DTT, pH 7.4
10 50 mM KH2PO4 containing 10 mM DTT and 10 mM EDTA, pH 7.4* Polybuffer 74 1:8 dilution, prepared as per chromatofocusing elution conditions.
Chapter 2 33
2.2.3.8 Testing the Effect of pH on Relative Activity
Universal buffer (300 mM acetic acid, 300 mM NaH2PO4, 300 mM Tris) was diluted two
times to a working 1 X solution and the pH adjusted in unit increments from pH 4 to ten.
Each reaction contained 975 µl universal buffer, 75 µl of a 100 mM benzonitrile or
hydrocinnamonitrile stock and 450 µl Rhodococcus rhodochrous supernatant to a final
volume of 1.5 ml. Samples were reacted at 30 °C for 2 hours with shaking at 200 rev./min
and stopped by addition of one part reaction to nine parts acidic stop eluent. Samples were
centrifuged at 13 000 x g, added to 2 ml HPLC vials and analysed by HPLC.
2.2.3.9 Determining Product Formation Over Time
Cell-free protein extract (1.8 ml) was mixed with 3.9 ml of a 50 mM potassium phosphate
buffer, pH 7.4, in reaction tubes set at 30 °C with stirring in a temperature-controlled
reaction carousel with magnetic stirrer from Radley’s Discovery Technologies. Mixes were
allowed to equilibrate for ten minutes before substrate addition, using a Hamilton syringe.
Substrate consisted of 5 mM benzonitrile, benzamide or 3-hydroxy-3-phenylpropionitrile
added at time zero to give a total reaction volume of 6 ml. At sampling times the reaction
tube was thoroughly mixed, and 100 µl immediately withdrawn using a Hamilton syringe
and added to 900 µl acidic stop eluent. After centrifugation at 13 000 x g, the 1 ml reaction
was transferred to a 2 ml sampling vial. Reactions were performed in triplicate and
analysed by HPLC.
2.2.3.10Testing the Effect of Protein Concentration on Activity
Supernatant from Rhodococcus rhodochrous of known protein concentration was added to
5 mM of benzonitrile, benzamide or 3-hydroxy-3-phenylpropionitrile in 50 mM potassium
phosphate buffer, pH 7.4, to a total reaction volume of 1.5 ml. Total protein concentration
in each reaction ranged from 0 to 1.86 mg/ml. Reactions were incubated at 30 °C with
shaking at 200 rev./min for 10, 25 or 30 min when reacted with benzonitrile, benzamide
and 3-hydroxy-3-phenylpropionitrile respectively. Reaction sample volumes (100 µl) were
added to 900 µl acidic stop eluent. After centrifugation at 13 000 x g, the 1 ml reaction was
transferred to a 2 ml sampling vial. Reactions were performed in triplicate and analysed by
HPLC.
Chapter 2 34

2.2.4 Column Chromatography
2.2.4.1 Chromatofocusing of the Soluble Protein Fraction of Rhodococcus
rhodochrous
After packing, the PBE 94 column was equilibrated with 0.025 M imidazole buffer, pH
7.4, containing 5 mM DTT. The equilibration buffer was set 0.4 pH units higher than the
start pH. Elution buffer containing 5 mM DTT was prepared by diluting commercial
Polybuffer 74 1:8 with distilled water, and subsequently pH-adjusted with HCl. All buffers
used in the process were degassed extensively to avoid fluctuations in the pH gradient
caused by bicarbonate ions. Protein elution was tracked by monitoring absorbance at 280
nm. The pH of each fraction was measured using a pH 211 Microprocessor pH Meter
(HANNA Instruments. Fractions (750 µl of each) were tested against certain substrates by
reaction with 5 mM benzonitrile, hydrocinnamonitrile, (R)-mandelonitrile, 2-
phenylglycinonitrile, 3-hydroxy-3-phenylpropionitrile, or 3-hydroxy-4-phenylvaleronitrile
for 2 hours at 30 °C with shaking. Samples were analysed by HPLC as described above.
2.2.4.2 Gel Exclusion Chromatography
The gel exclusion column was equilibrated using 100 mM potassium phosphate buffer, pH
7.4, containing 0.02% (w/v) sodium azide. Supernatant from Rhodococcus rhodochrous
was filtered using a DIAFLO® ultrafiltration membrane from AMICON Corporation
(Ireland) prior to loading. Gel exclusion standards of Mr 670 000 (bovine thyroglobulin),
158 000 (bovine gamma globulin), 44 000 (chicken ovalbumin), 17 000 (horse myoglobin)
and 1 350 (vitamin B-12) were used to create a size-exclusion standard curve. A gel
exclusion selectivity curve was created for the column according to the protocol laid out in
the Gel Filtration Principles and Methods Handbook by Amersham Biosciences (Uppsala,
Sweden). The column void volume (Vo) was determined from the elution of Blue Dextran
(2 000 kDa), and molecular mass estimated by comparison of its elution volume/void
volume to those of the standards. Standards and unknowns were eluted using a flow rate of
0.7 ml/min and the A280 monitored and recorded using a chart recorder set at 2 mm/ml.
Eluted fractions were tested for biocatalytic activity by adding 1.425 ml of each fraction to
75 µl benzonitrile, benzamide or 3-hydroxy-3-phenylpropionitrile. Reactions with
benzonitrile were incubated for 15 minutes while reactions with benzamide and 3-hydroxy-
Chapter 2 35
3-phenylpropionitrile were incubated for 30 minutes. Reactions were performed at 30 °C
with shaking and analysed by HPLC.
2.2.4.3 Ion Exchange Chromatography
The Toyopearl Super-Q 650M ion exchange column was equilibrated using 20 mM Tris
buffer, pH 8. Supernatant from Rhodococcus rhodochrous was buffer exchanged into 20
mM Tris buffer, pH 8, and 4.9 ml of a 10 mg/ml sample loaded onto the column. After
sample loading, the absorbance at 280 nm of each fraction was monitored until all unbound
proteins were eluted. Bound proteins were eluted using a 500 mM NaCl gradient over 42
ml. Eluted fractions were tested for biocatalytic activity by adding a volume (450 µl) of
fraction to 75 µl 5 mM benzonitrile, benzamide or 3-hydroxy-3-phenylpropionitrile in 975
µl 20 mM Tris buffer, pH 8, to a final volume of 1.5 ml. Reactions were incubated at 30 °C
with shaking for 30 minutes when reacting benzamide and 3-hydroxy-3-
phenylpropionitrile, and 15 minutes when reacting benzonitrile. Samples were analysed by
HPLC.
2.2.5 Polyacrylamide Gel Electrophoresis
2.2.5.1 SDS-PAGE
SDS-PAGE was done according to the discontinuous method of Laemmli (1970) using a
BioRad mini-protean gel system [107]. Proteins were separated using a stacking gel
consisting of 4% (m/v) acrylamide/bis-acrylamide solution, 0.126 M Tris-HCl, pH 6.8,
distilled water, 0.1% (m/v) SDS, 0.05% (m/v) ammonium persulphate and 0.1% (v/v)
TEMED, and a separating gel consisting of 10% (m/v) acrylamide/bis-acrylamide solution,
0.375 M Tris-HCl, pH 8.8, distilled water, 0.1% (m/v) SDS, 0.05% (m/v) ammonium
persulphate and 0.1% (v/v) TEMED. Samples were run alongside a protein molecular
weight marker (from BioRad) containing the protein standards of relative molecular mass
250 000, 150 000, 100 000, 75 000, 50 000, 37 000, 25 000, 20 000, 15 000 and 10 000.
Protein samples were incubated with protein loading buffer consisting of 0.125 M Tris-
HCl, 4% (w/v) SDS, 20% (v/v) glycerol, 5% (v/v) β-mercaptoethanol and 0.02% (w/v)
bromophenol blue, pH 6.8, for 5 min at 95 °C prior to loading, and gels were run at 150 V.
Running buffer consisted of 0.025 M Tris, 0.192 M glycine and 0.1% (w/v) SDS, pH 8.3.
Chapter 2 36

Gels were stained using 0.025% (w/v) Coomassie Brilliant Blue R250, 40% (v/v) methanol
and 7% (v/v) acetic acid staining solution and destained in a 7% (v/v) acetic acid, 5% (v/v)
methanol destain solution.
2.2.5.2 Non-Denaturing PAGE
Non-denaturing PAGE was done according to a modified method of Laemmli [107]
whereby SDS and reducing agents were omitted from the buffer and gel systems.
Chapter 2 37

Chapter 3
3 Results
3.1 Rhodococcus rhodochrous ATCC BAA-870 Characteristics
Identification of an appropriate nitrilase-containing microbe was undertaken based on
previous activity screens using various nitriles [106]. Substrate profiles were compiled by
Brady et al. (2006) and a suitable biocatalyst for this study chosen on the basis of their
results [108]. The organism, Rhodococcus rhodochrous ATCC BAA-870, was thoroughly
investigated, and growth parameters and characteristics of the organism were tested in
order to further study its activity and potential use as a bioconversion tool.
3.1.1 Rhodococcus rhodochrous Growth Curves in Different Media
Several nitrilases are known to be strongly induced by the addition of nitrile to culturing
media [109]. The growth curves of Rhodococcus rhodochrous in rich media (tryptone soya
broth) and a minimal defined media where benzonitrile was used as the nitrogen source
were measured and compared (Figure 11 and Figure 12).
Growth of Rhodococcus rhodochrous in tryptone soya broth follows a shallow sigmoidal
growth curve. The log phase of growth in rich medium occurs at an optical density of
approximately 1.2 at 600 and 660 nm. The log phase of growth in minimal medium occurs
at an optical density of approximately 0.8 (measured at both 600 and 660 nm). The cell
doubling time is roughly 28 hours in minimal media and 4-8 hours in rich media.
Chapter 3 38

0.0
0.2
0.4
0.6
0.8
1.0
1.2
1.4
1.6
0 4 8 12 16 20 24 28 32 36 40 44 48
Hours of Growth
Opt
ical
Den
sity
at 6
00 a
nd 6
60 n
m
Figure 11: Growth curve of Rhodococcus rhodochrous in minimal media measured at
600 and 660 nm. Optical density measurements of 50 ml shake flask cultures grown at 30 °C with shaking at 200
rev./min were performed in duplicate in separate experiments. The culture was grown in defined
media containing 20 mM benzonitrile as inducer. The O.D. at 660 nm ( ) and at 600 nm ( ) was
measured.
0.0
0.5
1.0
1.5
2.0
2.5
0 4 8 12 16 20 24
Hours of Growth
Opt
ical
Den
sity
at 6
00 a
nd 6
60 n
m
Figure 12: Growth curve of Rhodococcus rhodochrous in rich media measured at 600
and 660 nm.Optical density measurements of 50 ml cultures grown in tryptone soya broth in shake flasks at 30
°C with shaking at 200 rev./min were performed in duplicate in separate experiments. The O.D. at
660 nm ( ) and at 600 nm ( ) was measured.
Chapter 3 39

3.1.2 Dry Cell Weight Determination
The expected mass of Rhodococcus rhodochrous cells obtainable from batches of media
was used to estimate the volume needed for bulking up of biomass used in further studies.
The average dry cell weight of Rhodococcus rhodochrous grown in minimal media was 0.9
to 1.5 g per litre of culture.
3.1.3 Observations of Rhodococcus rhodochrous growth patterns
The rose-coloured appearance of Rhodococcus rhodochrous culture was clearly visible in
liquid and on solid media. Orange to red colonies were formed on tryptone soya agar and
became rough in appearance as the culture aged. Rhodococcus rhodochrous ATCC BAA-
870 was found to grow favourably in rich medium agar plates. Tryptone soya agar was
used for routine plating to check purity of cultures at each step of inoculation. A distinctive
morphological feature of the organism’s growth was its ability to form branches that
fragment into rods and cocci. Mycelial growth became visible on the agar substrate after 1
week of growth at 30 °C. The rose colour deepened and colonies became extensively flared
and spread out as the age of growth increased (Figure 13).
Figure 13: Close-up detail of the fanning formation developed by aged Rhodococcus
rhodochrous culture on tryptone soya agar streak plates.Fan formations are seen developing at the edge of a streak (A) and from a single colony (B).
Rhodococcus rhodochrous was streaked onto tryptone soya agar plates and grown at 30 °C for
more than 1 week.
Chapter 3
BA
40
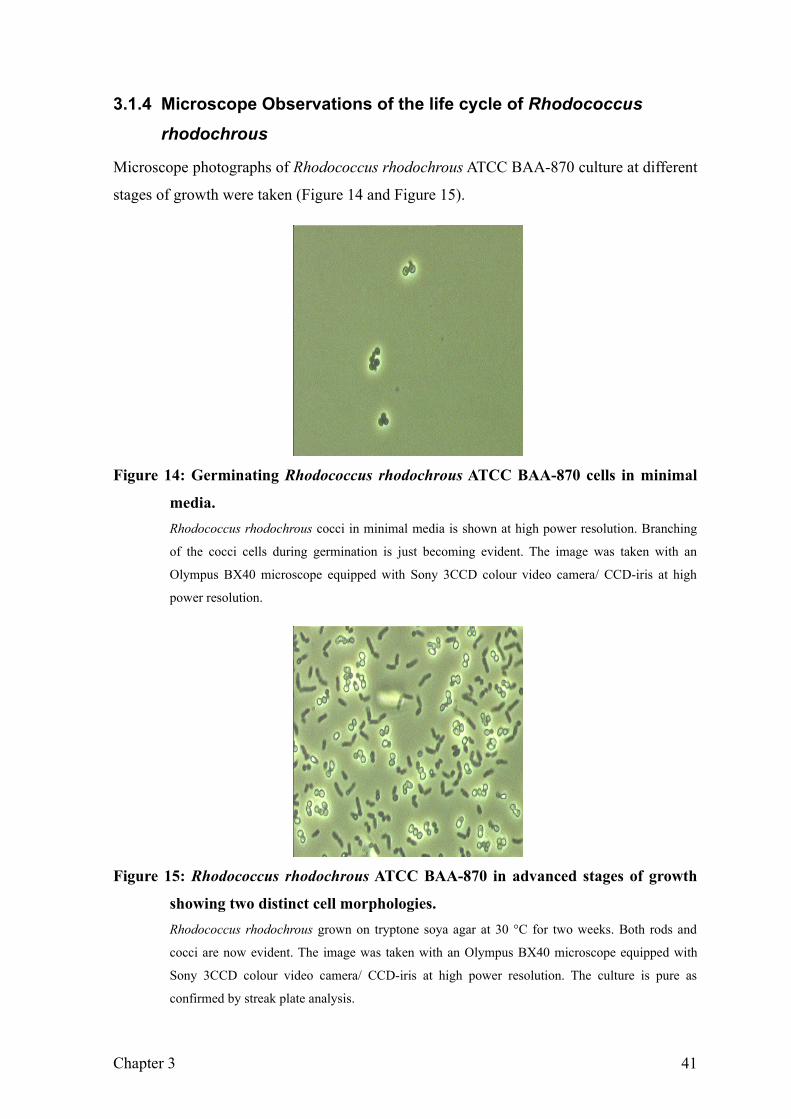
3.1.4 Microscope Observations of the life cycle of Rhodococcus
rhodochrous
Microscope photographs of Rhodococcus rhodochrous ATCC BAA-870 culture at different
stages of growth were taken (Figure 14 and Figure 15).
Figure 14: Germinating Rhodococcus rhodochrous ATCC BAA-870 cells in minimal
media.Rhodococcus rhodochrous cocci in minimal media is shown at high power resolution. Branching
of the cocci cells during germination is just becoming evident. The image was taken with an
Olympus BX40 microscope equipped with Sony 3CCD colour video camera/ CCD-iris at high
power resolution.
Figure 15: Rhodococcus rhodochrous ATCC BAA-870 in advanced stages of growth
showing two distinct cell morphologies.Rhodococcus rhodochrous grown on tryptone soya agar at 30 °C for two weeks. Both rods and
cocci are now evident. The image was taken with an Olympus BX40 microscope equipped with
Sony 3CCD colour video camera/ CCD-iris at high power resolution. The culture is pure as
confirmed by streak plate analysis.
Chapter 3 41

The cell morphology of Rhodococcus rhodochrous changes over time, with young cultures
showing only one cell type (cocci) that progressively branch to form rod-shaped cells in
mature cultures. The life-cycle growth of Rhodococcus rhodochrous follows an interesting
elementary branching-rod-coccus morphogenetic sequence. Germinating cocci give rise to
branching filaments (Figure 14), which then undergo fragmentation into rods and cocci to
complete the growth cycle (Figure 15).
3.1.5 Rhodococcus rhodochrous Cell Disruption Study
The optimal cell disruption time was determined for Rhodococcus rhodochrous. The
optimum total cell disruption time at which benzonitrile conversion was seen was 5
minutes (Figure 16).
0.0
0.5
1.0
1.5
2.0
2.5
0 1 2 3 4 5 6
Total Sonication Time (min)
Am
ount
( µm
ol)
Figure 16: Amount of benzoic acid formed from benzonitrile in post-extraction
reactions of samples sonicated for increasing lengths of time.After centrifugation, samples were reacted with 5 mM benzonitrile for 2 hours with shaking (200
rev./min) at 30 °C. Reduction of benzonitrile substrate ( ) and formation of benzoic acid product
( ) was monitored by HPLC. All benzonitrile was converted to product at a total sonication time of
5 minutes.
Micrographs (Figure 17) were taken to observe the breaking of cells, and qualitative HPLC
data were used to determine whether optimal activity release coincided with optimal
protein release.
Chapter 3 42
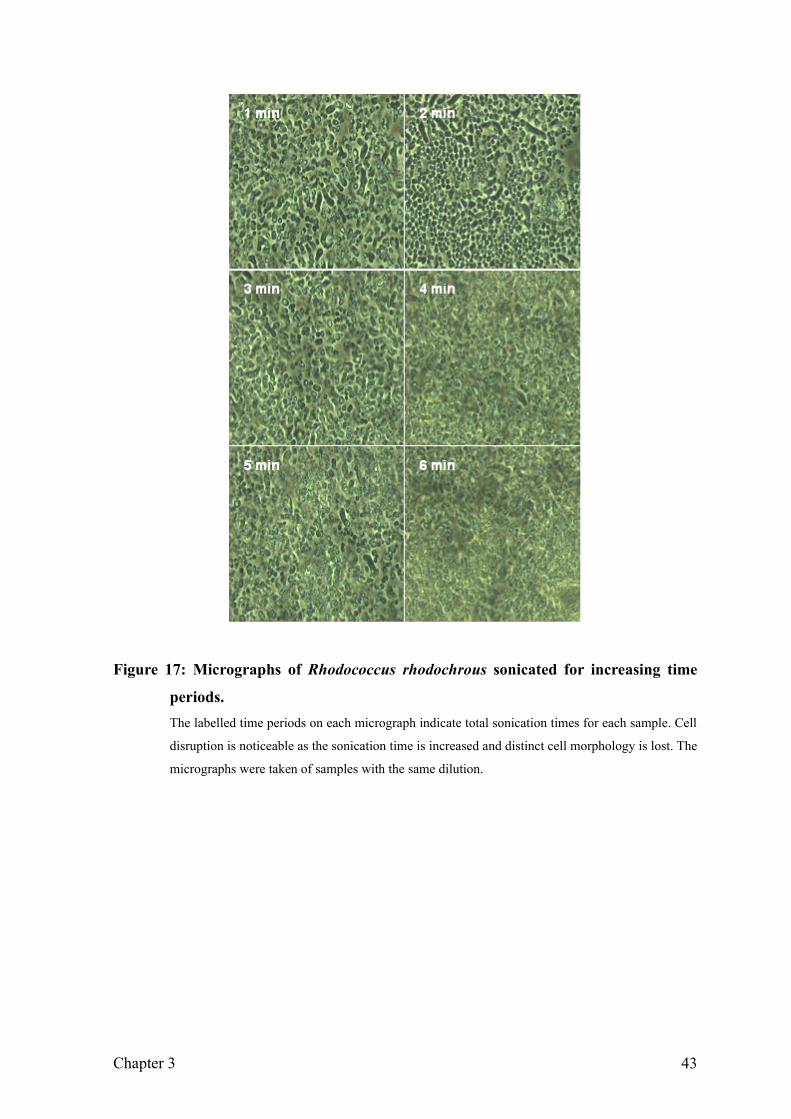
Figure 17: Micrographs of Rhodococcus rhodochrous sonicated for increasing time
periods. The labelled time periods on each micrograph indicate total sonication times for each sample. Cell
disruption is noticeable as the sonication time is increased and distinct cell morphology is lost. The
micrographs were taken of samples with the same dilution.
Chapter 3 43

3.2 Towards Establishing an Activity Assay for Nitrilase and/or
Nitrile Hydratase
3.2.1 Colorimetric Method
Both 0.1 and 0.01 M potassium phosphate buffer, pH 7.2, could be used to note colour
change when using 2 mM benzonitrile and chlorobenzonitrile. BTB at 0.05% (v/v) was
concentrated enough to indicate a colour change but at 0.01% (v/v) was more sensitive
since the colour change was more noticeable. Active commercial enzymes had to be
concentrated (at least 1 mg/ml in solution or a minimum of 10 mg purified enzyme) in
order to note colour change. A more concentrated sample resulted in a more intense colour
change to yellow. This assay was not sensitive enough to detect small concentrations of, or
perhaps less active forms of enzyme. A colour change was noted when Nit-1005 was tested
in agar plate wells and cuvettes, but activity could not be detected using the overlay
method.
3.2.2 Fluorescence-based OPA Assay and Comparison to HPLC Method
After unsuccessful attempts at establishing colorimetric activity assays for the enzymes of
interest based on electrophoretic separation of the enzymes and changes in pH on reaction,
a more sensitive fluorimetric assay was tested. The assay was originally developed by
Banerjee et al. (2003) [82], but some modifications were made after positive results were
found to be unattainable when using their protocol on this material. While they could
achieve linear standard ammonia fluorescence up to concentrations of 1000 µM, this study
indicated fluorescence intensity was only linear up to 100 µM (Appendix 5.1, Figure 56).
Troubleshooting included changing the buffers used in the assay (neither use of Tris buffer
nor sodium phosphate buffer improved results) and incubating the development step at a
lower temperature to avoid possible denaturation of enzyme.
When commercial nitrilases Nit 1001, 1005 and 1006 were tested against benzonitrile and
phenylpropionitrile, no positive results were observed. All substrates tested against whole
Chapter 3 44

cells of Rhodococcus rhodochrous yielded fluorescence intensity values of zero and hence
no measurable activity was detected.
A modification of the OPA method was used to “spot” ammonia-forming activity on
polyacrylamide gels, but did not prove useful (results not shown). Non-denaturing gels of
commercial nitrilase enzymes incubated with OPA reagent did not show any fluorescent
bands when viewed under UV light, although acid-forming activity was previously noted
for these enzymes [106].
Since qualitative HPLC data were previously used to test the substrate selectivity of
commercial nitrilases and whole cell Rhodococcus rhodochrous, HPLC reactions were
performed using the same volumes and incubation times as used in the OPA assay, but this
time assayed by HPLC to test whether the assays differed in sensitivity. The result was that
the conversion of substrates could be accurately quantitatively measured by HPLC, while
results obtained with the fluorimetric method proved to be unreliable or unreproducible.
3.2.3 High Performance Liquid Chromatography
HPLC is the most common method for measuring nitrile-hydrolysing activity, and is
specifically preferred when measuring the enantiomeric excess of enantiomeric products
formed from nitriles [6, 110-112]. HPLC was previously used by Brady et al. (2004) and
was found to be an appropriate method for identifying nitrilase activity in whole cell
bacterial samples [106]. Given the unsuccessful attempts at the previous methods of
measuring activity, HPLC was explored as a more accurate means of assaying nitrilase
activity in Rhodococcus rhodochrous. Commercial purified nitrilases from Pseudomonas
fluorescens, Rhodococcus rhodochrous and Arabidopsis thaliana and purified nitrilases
NIT-1001, -1005 and -1006 were tested by HPLC using the substrates benzamide, benzoic
acid and benzonitrile, and their relative activities compared.
Table 4 shows the relative activities of commercial purified nitrilases against benzonitrile
measured by HPLC. Reactions containing only buffer and substrate were used as controls.
None of the commercial nitrilases tested used benzamide as a substrate, confirming no
amidase activity was present. Benzoic acid was not converted indicating the reverse
reaction was not possible with the enzymes tested. Nit-1005 converted 100% of
Chapter 3 45

benzonitrile to benzoic acid while only residual activity was noted when using Nit-1001
and the nitrilase from A. thaliana. The P. fluorescens nitrilase was not active against
benzonitrile.
Table 4: Relative activities of various commercial nitrilase enzymes and Rhodococcus
rhodochrous whole cells reacted with benzonitrile
EnzymeRelative Activity against
Benzonitrile
NIT-1001 (BioCatalytics) +/-
NIT-1005 (BioCatalytics) +++
NIT-1006 (BioCatalytics) +
Rhodococcus rhodochrous (Fluka) +
Pseudomonas fluorescens (Fluka) -
Arabidopsis thaliana (Fluka) +/-
Rhodococcus rhodochrous ATCC BAA-870 whole cells +++Each nitrilase (750 µl of a 1 mg/ml stock) was added to 675 µl of a 50 mM phosphate buffer, pH
7.4, and 5 mM benzonitrile to a final reaction volume of 1.5 ml. Triplicate reactions were
incubated at 30 °C for 2 hours with shaking (200 rev./min), and centrifuged at 3 000 x g for 5 min.
A 200 µl aliquot of each was filtered through a 0.22 µm filter and transferred into a 2 ml HPLC
vial containing 800 µl acidic stop eluent. Samples were analysed by HPLC. Relative activity is
defined by +++: all substrate converted, +: some substrate converted, +/-: very little conversion,
and -: no conversion.
HPLC was successfully used to measure the nitrile-hydrolysing activity of various enzyme
sources, whether whole cell suspensions of Rhodococcus rhodochrous or purified enzymes
were used. The development of the assay used for HPLC analysis was further investigated.
3.3 HPLC Assay Method Development
Since Rhodococcus rhodochrous favoured benzonitrile as a substrate, the aromatic nitrile
and its corresponding amide and acid were used as controls in all further HPLC analyses.
The β-hydroxy nitrile, 3-hydroxy-3-phenylpropionitrile and its corresponding acid, 3-
hydroxy-3-phenylpropionic acid, were also used since the activity against this nitrile was
of particular interest. Hydrocinnamonitrile was chosen as a useful measure of substrate-
specificity comparison since the substrate has the same aliphatic chain length as 3-
hydroxy-3-phenylpropionitrile, but lacks the hydroxyl group at the beta position.
Chapter 3 46

The corresponding acid elutes earlier than the nitrile, while the amide has the shortest
elution time (Table 5).
Hydrocinnamonitrile has at least a 1.65 minute longer elution time than 3-hydroxy-3-
phenylpropionitrile, attributed to a structural difference of a single hydroxy group. The β-
phenyl-substituted rings have much lower absorbance maximum values than the α-phenyl
structures. All compounds, however, could be measured reproducibly. Average retention
times for the compounds were reproducible with negligible deviation between samples.
The absorbance wavelength maxima of benzonitrile, benzamide, benzoic acid,
hydrocinnamonitrile and 3-hydroxy-3-phenylpropionitrile were suitably different and
therefore easily differentiated. However, 3-hydroxy-3-phenylpropionic acid and 3-
hydroxy-3-phenylpropionitrile shared the same absorbance maximum. Their retention
times, however, were different, and the acid predictably eluted before the nitrile. The
corresponding amide product produced from 3-hydroxy-3-phenylpropionitrile by the
organism in the current study has an average retention time of 3.5 ± 0.01 min (27 samples).
Chapter 3 47

Table 5: Name, structure and retention time of compounds used in this study.
Compound Structure
Absorbance
wavelength
(nm)
Average
retention time
(min) ± S.D.
Average
amount in
each 1.5 ml
reaction (µ
mol) ± S.D.
Benzonitrile
N
224.15.55 ± 0.02 (30 samples)
8 ± 0.3(30 reactions)
Benzoic acid
HO O
228.84.37 ± 0.01 (30 samples)
6 ± 0.2(30 reactions)
Benzamide
N O
226.43.81 ± 0.01 (30 samples)
5.7 ± 0.1(30 reactions)
3-Hydroxy-3-
phenylpropionitrile
NOH
206.54.15 ± 0.004 (30 samples)
10.8 ± 0.3(30 reactions)
3-Hydroxy-3-
phenylpropionic acid
OH
O
OH
206.53.78 ± 0.004 (30 samples)
8.2 ± 0.2(30 reactions)
HydrocinnamonitrileN
205.35.80 ± 0.01 (30 samples)
9.2 ± 0.1(30 reactions)
Compounds were prepared as 5 mM samples in methanol and 100 µl added to 900 µl acidic
eluent in 2 ml HPLC vials. A Waters 2690 Separations Module HPLC with 996 Photodiode
Array Detector was used to analyse the samples. Compounds were eluted isocratically over 10
minutes from a Chromolith SpeedRod column at a flow rate of 0.5 ml/min using 40%
acetonitrile:60% aqueous 0.1% (v/v) trifluoracetic acid.
Chapter 3 48

3.3.1 Standard Curves
The correlation between the average integrated area of retention peaks of the standards
used with increasing concentration was tested by HPLC by preparing standards of different
concentrations (in the range 0 to 10 mM). The colours representing each standard were
kept constant throughout the study and are outlined in Table 6. The linearity of retention
area, amount and absorbance of each compound with increasing concentration was tested
to ensure the concentrations used fell within an acceptable range, and also to establish the
most appropriate parameters for measuring nitrile-converting activity.
Table 6: Linear regression equations and R2 values for standard curves of the average
integrated areas of increasing concentrations of various standard
compounds.
CompoundColour in
Figures
Linear Regression
Equation
R2
Value
Linear
Regression
Equation with
zero intercept
R2
Value
Benzonitrile Light blue y = 3 x 10⁶x - 905961 0.9978 y = 3 x 106x 0.9958
Benzoic acid Red y = 2 x 10⁶x - 5798 0.9998 y = 2 x 106x 0.9998
Benzamide Dark blue y = 2 x 10⁶x - 52285 0.9999 y = 2 x 106x 0.9999
3-Hydroxy-3-
phenylpropionitrileOrange y = 2 x 10⁶x + 123253 0.9998 y = 2 x 106x 0.9997
3-Hydroxy-3-
phenylpropionic
acid
Pink y = 2 x 10⁶x - 245084 0.9995 y = 2 x 106x 0.9989
Hydro-
cinnamonitrileGreen y = 2 x 10⁶x - 120389 0.9997 y = 2 x 106x 0.9996
Linear regression equations and corresponding R2 values were obtained from triplicate analysis
of the retention areas of each compound from 0 – 10 mM by HPLC.
The linear regression equations and R2 values of standard curves with a zero intercept were
compared to standard curves where the lines were not forced through zero and the R2
values found to be similar. The only standard with a positive y-intercept is 3-hydroxy-3-
phenylpropionitrile, and therefore also the only standard which may be overestimated
when extrapolating its amount from retention time. However, the values at which the
standard curves cut the y-axis were all smaller than the average standard deviations
between integrated areas. The standard curves of average integrated area versus
Chapter 3 49

concentration are plotted in Figure 18 with zero intercepts (see Table 6 for linear
equations).
Figure 18: Average integrated area of benzonitrile, benzamide, benzoic acid,
hydrocinnamonitrile, 3-hydroxy-3-phenylpropionitrile and 3-hydroxy-3-
phenylpropionic acid with increasing concentration.Standard curves for benzonitrile ( ), benzamide ( ), benzoic acid ( ), hydrocinnamonitrile ( ), 3-
hydroxy-3-phenylpropionitrile ( ) and 3-hydroxy-3-phenylpropionic acid ( ) were constructed by
measuring the integrated area of retention peaks of each substance by HPLC. Samples were
analysed in triplicate and the average ± the standard deviation between samples plotted as a
function of increasing concentration.
The average integrated area of each standard was plotted as a function of the amount (in µ
mol) present in each 1.5 ml reaction to ensure there was good correlation between the
retention area and amount of each compound. The linear regression equations obtained
from the standard curves in Figure 18 were used to calculate the actual amount of standard
Chapter 3
0
5000000
10000000
15000000
20000000
25000000
30000000
0 1 2 3 4 5 6 7 8 9 10
Concentration (mM)
Ave
rage
Inte
grat
ed A
rea
50

in each sample. The R2 values are all close to one and show a strong correlation between
retention peak integrated area and the amount or concentration used for each standard.
The absorbance of retention peaks of each standard was plotted as a function of increasing
concentration and compared to the above standard curves (Figure 19). The R2 values of
linear regression equations fitted to the data points were similar for all plots, and
measuring absorbance with increasing concentration by HPLC was also found to be
reproducible (Table 7).
Table 7: Linear regression equations and R2 values for standard curves of absorbance
with increasing concentration for various compounds.
CompoundColour in
Figures
Linear Regression
Equation
R2
Value
Linear
Regression
Equation
with zero
intercept
R2
Value
Benzonitrile Light blue y = 0.156x - 0.0338 0.9981 y = 0.1512x 0.9968
Benzoic acid Red y = 0.141x + 0.0047 0.9998 y = 0.1416x 0.9998
Benzamide Dark blue y = 0.1379x - 3 x 10⁻⁵ 0.9999 y = 0.1379x 0.9999
3-Hydroxy-3-
phenylpropionitrileOrange y = 0.1167x + 0.0128 0.9967 y = 0.1185x 0.9963
3-Hydroxy-3-
phenylpropionic
acid
Pink y = 0.1021x - 0.0039 0.9999 y = 0.1015x 0.9999
Hydrocinnamonitrile Green y = 0.078x + 0.0003 0.9998 y = 0.0781x 0.9998Linear regression equations and corresponding R2 values were obtained from triplicate
analysis of the retention areas of each compound from 0 – 10 mM by HPLC. Retention areas
were converted to amounts using the concentration standard curve equations for each
compound.
Linear concentration standard curves could be constructed as a function of retention area,
amount or absorbance for all six compounds tested. 3-Hydroxy-3-phenylpropionitrile had
greater standard deviation between the 10 mM absorbance readings than at lower
concentrations (Figure 19). When plotted including the 10 mM point, however, the linear
regression equation is y = 0.1185x with an R2 value of 0.9963. Both R2 values are, however,
similar. Standard deviation values in most cases are too small to be noted in the figures.
Chapter 3 51

0.0
0.2
0.4
0.6
0.8
1.0
1.2
1.4
1.6
0 1 2 3 4 5 6 7 8 9 10
Concentration (mM)
Abso
rban
ce
Figure 19: Average absorbance of benzonitrile, benzamide, benzoic acid,
hydrocinnamonitrile, 3-hydroxy-3-phenylpropionitrile and 3-hydroxy-3-
phenylpropionic acid with increasing concentration.Standard curves for benzonitrile ( ), benzamide ( ), benzoic acid ( ), hydrocinnamonitrile ( ), 3-
hydroxy-3-phenylpropionitrile ( ) and 3-hydroxy-3-phenylpropionic acid ( ) were constructed by
measuring the average absorbance maximum of retention peaks of each substance by HPLC.
Samples were analysed in triplicate and the average ± the standard deviation plotted as a function
of increasing concentration. Absorbance values for hydrocinnamonitrile were extracted at 205.3
nm, and 3-hydroxy-3-phenylpropionitrile and 3-hydroxy-3-phenylpropionic acid absorbance
values were extracted at 206.5 nm. Absorbance values for benzoic acid, benzamide and
benzonitrile were obtained by data extraction at 228.8, 226.4 and 224.1 nm, respectively. Refer to
Table 7 for compound identification.
The wavelength maxima at which each standard’s data were extracted when processing
HPLC data were monitored with increasing concentration to check that the compounds
were stable at all the concentrations tested. Only the wavelength maximum of benzamide
Chapter 3 52

was affected at higher concentrations, and it dropped from 226.4 nm to 225.2 nm when the
concentration was 7 mM and higher (data not shown). The wavelength maxima of
benzonitrile, benzoic acid, 3-hydroxy-3-phenylpropionitrile, 3-hydroxy-3-phenylpropionic
acid and hydrocinnamonitrile remained constant at all concentrations tested.
3.3.2 LC-Mass Spectral Analysis of the Standards Used in This Study
HPLC could be used to reliably measure elution of benzonitrile, benzamide and benzoic
acid. Although the elution of hydrocinnamonitrile, 3-hydroxy-3-phenylpropionitrile and 3-
hydroxy-3-phenylpropionic acid could be reliably measured and displayed different elution
times, the absorbance maxima of the three compounds were very similar. This was only a
problem in the identification of the product formed from 3-hydroxy-3-phenylpropionitrile
since only the corresponding acid was available as a standard for comparison. The acid and
nitrile share the same absorbance maximum but differ in their HPLC elution times (with
the nitrile eluting last). The initial product formed from 3-hydroxy-3-phenylpropionitrile
by Rhodococcus rhodochrous ATCC BAA-870 was presumed to be the corresponding
amide since previous studies showed that inhibiting the reaction at the amidase level still
resulted in disappearance of substrate, while the appearance of 3-hydroxy-3-
phenylpropionic acid was hindered. Also, the intermediate product formed from 3-
hydroxy-3-phenylpropionitrile before the corresponding acid was formed had the earliest
retention time compared to the nitrile and acid. However, mass spectral analysis was used
to confirm the structure of the amide since analysis by HPLC of compounds with
absorbance maxima close to 200 nm was not considered reliable since many HPLC
solvents absorb at or near 200 nm.
Mass spectral results for standard benzamide (Appendix 5.4), 3-hydroxy-3-
phenylpropionitrile and 3-hydroxy-3-phenylpropionic acid (Figure 20 and Figure 21)
coincided with spectra from the internal Millenium spectra library, and with spectra from
the Spectral Database for Organic Compounds SDBS (available at
http://www.aist.go.jp/RIODB/SDBS/cgi-bin/direct_frame_top.cgi). Since 3-hydroxy-3-
phenylpropionitrile was synthesized in-house, its structure was confirmed, and its
corresponding acid tested. Reactions in which conversion against 3-hydroxy-3-
phenylpropionitrile took place were also tested in order to identify the product formed. The
molecular mass of benzoic acid (122 g.mol-1) and benzamide (121 g.mol-1) are similar, and
Chapter 3 53

both compounds were too volatile to be measured with accuracy. Benzonitrile and benzoic
acid gave poor mass spectral results that could not be improved by increasing the
compound concentration. The gas phase volatility of these compounds and susceptibility to
thermal degradation is too high for good mass spectral results. Benzamide was not as
volatile as benzonitrile and benzoic acid since its mass spectrum could be improved and
the compound matched with 98% certainty to the internal standard by increasing the
concentration (Appendix 5.4). Hydrocinnamonitrile was also not suited to measurement by
mass spectrometry. Again, mass spectra for the standard compound were poor and were not
improved by increasing its concentration. Although hydrocinnamonitrile has a longer
aliphatic nitrile group than benzonitrile, it did not necessarily impact on the stability of the
compound.
The amide product formed from 3-hydroxy-3-phenylpropionitrile in bioconversion
reactions could not be analysed using mass spectrometry. It is assumed the volatility and
concentration of the compound may be factors in its measurement. However, 3-hydroxy-3-
phenylpropionitrile and 3-hydroxy-3-phenylpropionic acid standards could be measured to
reasonable degree of certainty using mass spectrometry (see Appendix 5.3, Figure 65 and
Figure 66 for the mass spectrum peak break down). Reactions against 3-hydroxy-3-
phenylpropionitrile are reported as a decrease in substrate or as total product formation
owing to the relative inaccuracy of measuring the amide by HPLC. Gas chromatography
may be a better alternative to mass spectrometry when attempting product identification
and measuring smaller, more volatile nitriles. Although the retention times for 3-hydroxy-
3-phenylpropionitrile and 3-hydroxy-3-phenylpropionic acid are similar (Figure 21), the
acid elutes earlier than the nitrile.
Chapter 3 54
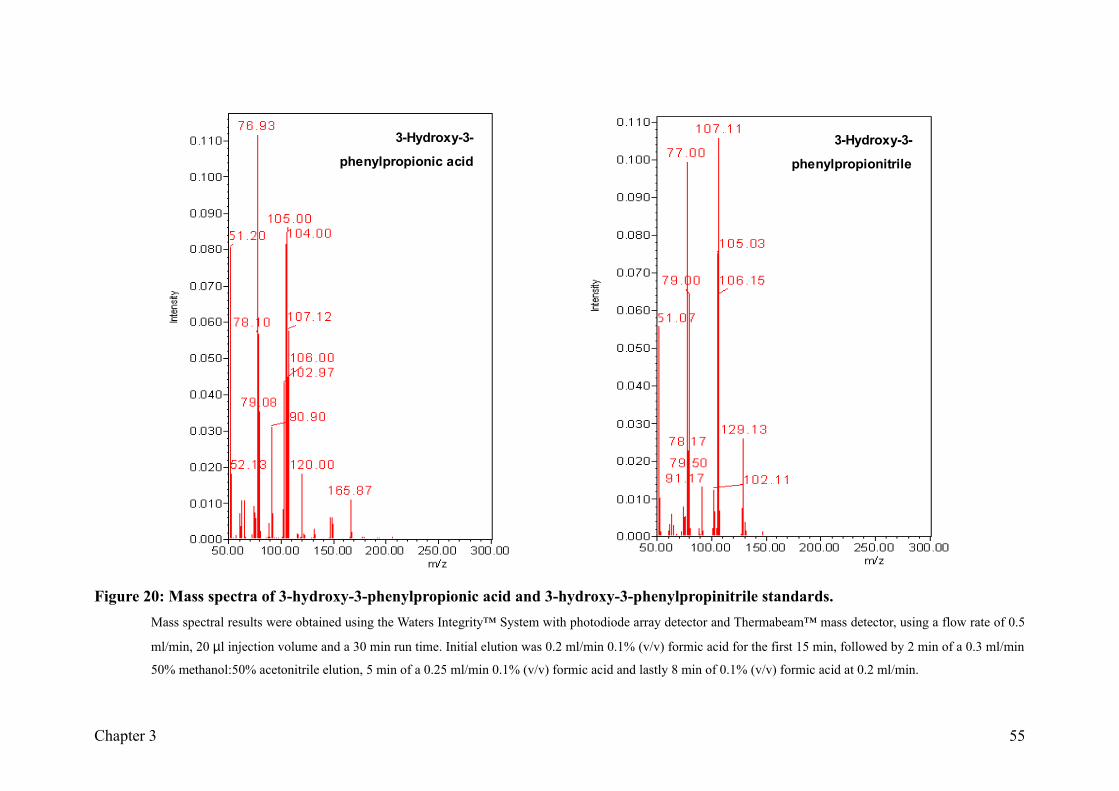
Figure 20: Mass spectra of 3-hydroxy-3-phenylpropionic acid and 3-hydroxy-3-phenylpropinitrile standards.Mass spectral results were obtained using the Waters Integrity™ System with photodiode array detector and Thermabeam™ mass detector, using a flow rate of 0.5
ml/min, 20 µl injection volume and a 30 min run time. Initial elution was 0.2 ml/min 0.1% (v/v) formic acid for the first 15 min, followed by 2 min of a 0.3 ml/min
50% methanol:50% acetonitrile elution, 5 min of a 0.25 ml/min 0.1% (v/v) formic acid and lastly 8 min of 0.1% (v/v) formic acid at 0.2 ml/min.
Chapter 3
3-Hydroxy-3-
phenylpropionic acid3-Hydroxy-3-
phenylpropionitrile
55

Figure 21: Chromatographs of 3-hydroxy-3-phenylpropionic acid and 3-hydroxy-3-phenylpropionitrile standards.Chromatographs were obtained using the Waters Integrity™ System with photodiode array detector and Thermabeam™ mass detector, using a flow rate of 0.5
ml/min, 20 µl injection volume and a 30 min run time. Initial elution was 0.2 ml/min 0.1% (v/v) formic acid for the first 15 min, followed by 2 min of a 0.3 ml/min
50% methanol:50% acetonitrile elution, 5 min of a 0.25 ml/min 0.1% (v/v) formic acid and lastly 8 min of 0.1% (v/v) formic acid at 0.2 ml/min.
Chapter 3
3-Hydroxy-3-
phenylpropionic acid
3-Hydroxy-3-
phenylpropionic acid
56

3.3.3 Different Buffer Types
The relative activity against benzonitrile contained in supernatant of Rhodococcus
rhodochrous was tested in ten different buffer types (listed in Table 3). Polybuffer 74 was
tested in the pH range 4 to 7.4 in order to test whether the activity against benzonitrile was
affected by the buffer system used during chromatofocusing, and to test the efficacy of
HPLC as an assaying method when using different buffers.
Figure 22 shows the average integrated area of benzonitrile remaining after reaction in
each different buffer type and its conversion to benzoic acid. The effect of pH on activity
against benzonitrile is shown by reaction in buffers 1 - 4, with the least product formation
occurring at pH 4. The total amount of substrate and product was underestimated in buffer
7 (containing imidazole) whereas for all other buffers the total amount was relatively
similar. Imidazole appears to greatly reduce the measurable amounts of benzonitrile and
benzoic acid.
0
1000000
2000000
3000000
4000000
5000000
6000000
7000000
1 2 3 4 5 6 7 8 9 10
Buffer Type
Ave
rage
Inte
grat
ed A
rea
Figure 22: Benzonitrile conversion to benzoic acid in ten different buffer systems.Rhodococcus rhodochrous supernatant was reacted with 50 mM benzonitrile ( ) for 2 hrs at 30 °C
with shaking (200 rev./min). Conversion of benzonitrile to benzoic acid ( ) was measured in
triplicate by HPLC.
The least conversion of benzonitrile to benzoic acid occurs in buffer 4 (Polybuffer 74
containing 5 mM DTT, pH 4). Although most of the benzonitrile present in samples reacted
with buffer 7 has disappeared, the amount of product (benzoic acid) formed is not
Chapter 3 57
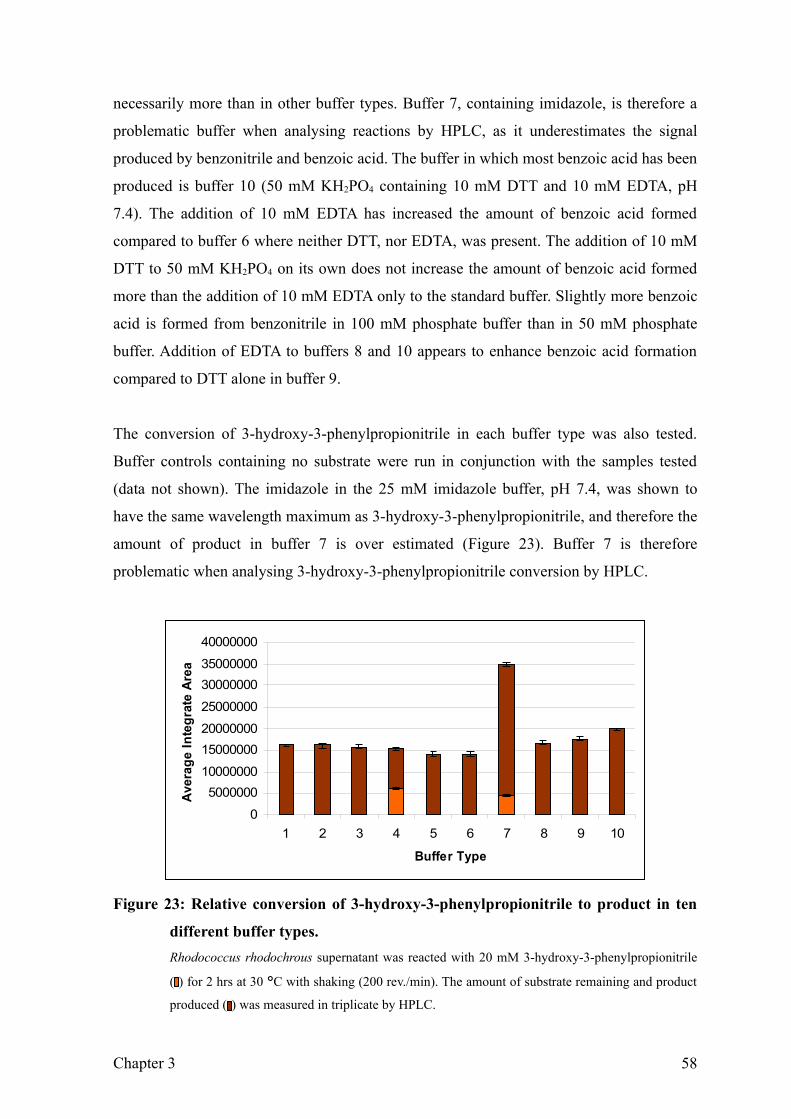
necessarily more than in other buffer types. Buffer 7, containing imidazole, is therefore a
problematic buffer when analysing reactions by HPLC, as it underestimates the signal
produced by benzonitrile and benzoic acid. The buffer in which most benzoic acid has been
produced is buffer 10 (50 mM KH2PO4 containing 10 mM DTT and 10 mM EDTA, pH
7.4). The addition of 10 mM EDTA has increased the amount of benzoic acid formed
compared to buffer 6 where neither DTT, nor EDTA, was present. The addition of 10 mM
DTT to 50 mM KH2PO4 on its own does not increase the amount of benzoic acid formed
more than the addition of 10 mM EDTA only to the standard buffer. Slightly more benzoic
acid is formed from benzonitrile in 100 mM phosphate buffer than in 50 mM phosphate
buffer. Addition of EDTA to buffers 8 and 10 appears to enhance benzoic acid formation
compared to DTT alone in buffer 9.
The conversion of 3-hydroxy-3-phenylpropionitrile in each buffer type was also tested.
Buffer controls containing no substrate were run in conjunction with the samples tested
(data not shown). The imidazole in the 25 mM imidazole buffer, pH 7.4, was shown to
have the same wavelength maximum as 3-hydroxy-3-phenylpropionitrile, and therefore the
amount of product in buffer 7 is over estimated (Figure 23). Buffer 7 is therefore
problematic when analysing 3-hydroxy-3-phenylpropionitrile conversion by HPLC.
0
500000010000000
1500000020000000
25000000
3000000035000000
40000000
1 2 3 4 5 6 7 8 9 10
Buffer Type
Ave
rage
Inte
grat
e Ar
ea
Figure 23: Relative conversion of 3-hydroxy-3-phenylpropionitrile to product in ten
different buffer types.Rhodococcus rhodochrous supernatant was reacted with 20 mM 3-hydroxy-3-phenylpropionitrile
( ) for 2 hrs at 30 °C with shaking (200 rev./min). The amount of substrate remaining and product
produced ( ) was measured in triplicate by HPLC.
Chapter 3 58

In buffer 4, conversion of 3-hydroxy-3-phenylpropionitrile was incomplete (Figure 23).
Activity of the 3-hydroxy-3-phenylpropionitrile-converting enzyme is therefore reduced at
pH 4.
Since it was previously established that Rhodococcus rhodochrous supernatant displayed
no activity against hydrocinnamonitrile, the substrate was tested using the different buffer
types to check for anomalous results arising from different buffers when measured by
HPLC (Figure 24). The amount of hydrocinnamonitrile remains approximately constant in
most buffer types and was only seen to drop in buffer four (Polybuffer 74 containing 5 mM
DTT, pH 4) and buffer nine (50 mM KH2PO4 containing 10 mM DTT, pH 7.4). However,
although it appears that hydrocinnamonitrile has been utilised, no product was detected in
these HPLC reactions. Control reactions containing only hydrocinnamonitrile and buffer
did not show disappearance of the nitrile (data not shown), and therefore it is unlikely the
compound was heat-degraded during the reaction. Although the amount of
hydrocinnamonitrile dropped in buffer four, the total amount of substrate and apparent
product remained constant in all buffers.
0500000
10000001500000200000025000003000000350000040000004500000
1 2 3 4 5 6 7 8 9 10
Buffer Type
Aver
age
Inte
grat
ed A
rea
Figure 24: Relative levels of hydrocinnamonitrile measured in ten different buffer
types by HPLC.Rhodococcus rhodochrous supernatant was reacted with 20 mM hydrocinnamonitrile ( ) for 2 hrs
at 30 °C with shaking (200 rev./min). The amount of substrate remaining and apparent product
produced ( ) was measured in triplicate by HPLC.
Although buffers eight and ten contain 10 mM DTT, both also contain 10 mM EDTA
which may have an inhibitory effect on activity against hydrocinnamonitrile. Polybuffer
Chapter 3 59

exhibits almost negligible absorbance at 280 nm (A280 approximately 0.2) but is detected at
254 nm. HPLC data is extracted at 254 nm and therefore amounts of substrate or product
present in reactions may be overestimated. The amount of 3-hydroxy-3-phenylpropionitrile
only is over estimated in buffer 7. Conversely, the amount of benzonitrile is less in buffer 7
than any other buffer type tested. Buffers one, two, three, five and six appear to have
similar effects on activity.
Results obtained from measuring activity by HPLC were therefore affected by the type of
buffer used, as well as the compound being tested. Imidazole buffer is not suitable for
analysis of nitrile conversion by HPLC.
3.3.4 pH Activity Profiles
The effect of pH on activity against benzonitrile was tested using Universal buffer at
different pH’s (Figure 25). The effect of pH on activity against benzonitrile in Polybuffer
74 can be seen in Figure 22. Benzoic acid formation from benzonitrile is highest at pH 6
(0.85 µmol) and pH 7 (0.87 µmol), and is present at all pH’s except pH 4. Only trace
amounts are formed at pH 5 (0.02 µmol) and pH 10 (0.08 µmol).
0.0
0.5
1.0
1.5
2.0
2.5
3.0
3.5
4.0
4 5 6 7 8 9 10
pH
Am
ount
( µm
ol)
Figure 25: Amount of benzoic acid formed from benzonitrile at different pH’s.Benzonitrile ( ) was reacted for 2 hrs at 30 °C with shaking (200 rev./min) in Universal buffer
made up at different pH values and its conversion to benzoic acid ( ) measured by HPLC.
Chapter 3 60

3.3.5 Time Course Activity Study
The depletion of benzonitrile was monitored over 3 hrs and the amount of product formed
measured (Figure 26). Benzamide was formed from benzonitrile within 60 minutes of
reaction, with its amount peaking within 10 – 20 minutes. Concurrently, benzoic acid was
formed from the benzamide produced and its amount steadily increased until reaching a
plateau from approximately 120 minutes. The amount of benzonitrile in reaction rapidly
drops within the first ten minutes, but after 90 minutes the amount utilised over time
becomes negligible. Once approximately 1 µmol of benzonitrile remains in the reaction, it
appears to no longer be converted and instead remains at a basal level (Figure 26).
0
1
2
3
4
5
6
7
8
0 20 40 60 80 100 120 140 160 180
Time (min)
Am
ount
( µm
ol)
Figure 26: Conversion of 5 mM benzonitrile to benzamide and benzoic acid over
three hours.Benzonitrile ( ) was added to reaction mix containing Rhodococcus rhodochrous supernatant (at
30 °C with stirring). Aliquots of the sample were withdrawn at given time points in triplicate and
added to stop buffer. The average integrated area of substrate remaining and benzamide ( ) and
benzoic acid ( ) produced was measured by HPLC, and converted to amount. The additive amount
of benzamide and benzoic acid was plotted on the same axes ( ). Benzonitrile was added to control
reactions in which no enzyme was present ( ) thereby demonstrating the stability of the substrate
under these reaction conditions.
Chapter 3 61

It can be seen that the amount of benzonitrile remaining in the reaction is not linear over
the time span tested (Figure 26). The amount of benzamide formed from benzonitrile
rapidly peaks after 10 minutes of reaction and plateaus between 10 and 30 minutes, but
decreases as it is further converted to benzoic acid. The benzamide formed from
benzonitrile is utilised within 60 minutes, since after 90 minutes benzamide is no longer
detected in the reaction mix.
Benzoic acid is immediately produced from benzamide when benzamide is formed from
benzonitrile. Benzoic acid continues to be formed over the full 3 hours of reaction, but the
amount produced plateaus after 90 minutes when the substrate is depleted (Figure 26).
Activity against benzamide and its dependence on time was tested, and compared to
reactions in which benzamide was first produced from benzonitrile. The average control
amount of benzamide present in reactions where no enzyme was present was 5.4 µmol,
with a standard deviation of 0.34 µmol (Figure 27).
0123456789
10
0 20 40 60 80 100 120 140 160 180
Time (min)
Am
ount
( µm
ol)
Figure 27: Conversion of 5 mM benzamide over three hours.Benzamide was added to reaction mix containing Rhodococcus rhodochrous supernatant (at 30 °C
with stirring). Aliquots of the sample were withdrawn at given time points in triplicate and added
to stop buffer. The average integrated area of benzamide remaining ( ) and benzoic acid produced
( ) was measured by HPLC, and converted to amount. Benzamide was added to control reactions
in which no enzyme was present ( ) and measured in the same way.
Chapter 3 62

After 60 minutes of reaction, there is no benzamide left in the reaction. Benzoic acid can
be measured from 30 minutes onwards and its amount increases with time until it levels off
after approximately 120 minutes. The formation of benzoic acid from benzamide is linear
up to 90 minutes (Figure 28).
y = 0.0635x + 0.5926R2 = 0.9911
0
1
2
3
4
5
6
7
30 45 60 75 90
Time (min)
Am
ount
Ben
zoic
Aic
d ( µ
mol
)
Figure 28: Formation of benzoic acid from benzamide over time.Benzamide was added to reaction mix containing Rhodococcus rhodochrous supernatant (at 30 °C
with stirring). Aliquots of the sample were withdrawn at given time points in triplicate and added
to stop buffer. The average integrated area of benzamide remaining and benzoic acid produced ( )
was measured by HPLC, and converted to amount.
The formation of product produced from 3-hydroxy-3-phenylpropionitrile over time is
shown in Figure 29. After reaction times longer than 45 minutes, 3-hydroxy-3-
phenylpropionitrile is no longer present in the reaction mix. Product appears within ten
minutes and increases over time until 60 minutes where its amount is seen to level off. The
amount of product remains more or less constant between 60 and 180 minutes.
Chapter 3 63

0
2
4
6
8
10
12
14
16
0 30 60 90 120 150 180
Time (min)
Am
ount
( µm
ol)
Figure 29: Conversion of 5 mM 3-hydroxy-3-phenylpropionitrile over three hours.3-Hydroxy-3-phenylpropionitrile was added to reaction mix containing Rhodococcus rhodochrous
supernatant (at 30 °C with stirring). Aliquots of the sample were withdrawn at given time points in
triplicate and added to stop buffer. The average integrated area of 3-hydroxy-3-phenylpropionitrile
remaining ( ) and product formed ( ) was measured by HPLC, and converted to amount. 3-
Hydroxy-3-phenylpropionitrile was added to control reactions in which no enzyme was present ( )
and measured in the same way.
The time scale of reaction against the substrates tested was reduced since it was evident
that the production of amide from nitrile occurs in a much shorter time frame than
expected. Indeed, in reactions occurring for 2 hours it would be assumed that benzoic acid
is produced directly from benzonitrile since benzamide would not be noted. Benzonitrile
conversion was tested over ten minutes and 3-hydroxy-3-phenylpropionitrile conversion
over twenty minutes. The disappearance of 3-hydroxy-3-phenylpropionitrile as substrate,
and appearance of its product, can be followed linearly over twenty minutes (Figure 30).
The linear regression R2 value is better for 3-hydroxy-3-phenylpropionitrile disappearance
than for the appearance of product (R2 = 0.99 as opposed to 0.94). When benzamide was
reacted over 10 minutes, the appearance of benzoic acid could not be measured linearly by
HPLC (data not shown), although disappearance of product was linear.
Chapter 3 64

y = -139805x + 1E+07R2 = 0.9926
y = 282198x + 2E+06R2 = 0.9453
0
2000000
4000000
6000000
8000000
10000000
12000000
14000000
16000000
0 2 4 6 8 10 12 14 16 18 20
Time (min)
Aver
age
Inte
grat
ed A
rea
Figure 30: Conversion of 5 mM 3-hydroxy-3-phenylpropionitrile over a twenty
minute reaction.3-Hydroxy-3-phenylpropionitrile was added to reaction mix containing Rhodococcus rhodochrous
supernatant (at 30 °C with stirring). Aliquots of the sample were withdrawn at given time points in
triplicate and added to stop buffer. The average integrated area of 3-hydroxy-3-phenylpropionitrile
remaining ( ) and product formed ( ) was measured by HPLC. 3-Hydroxy-3-phenylpropionitrile
was added to control reactions in which no enzyme was present ( ) and measured in the same way.
The average integrated area of benzonitrile reacted over ten minutes is also followed
linearly. Time zero is an unreliable point assumed to arise from poor mixing technique and
is omitted (Figure 31). The appearance of benzamide as product from benzonitrile can not
be accurately measured within a ten minute reaction by HPLC, although the disappearance
of substrate is already occurring. Benzamide appearance can only be measured after 10
minutes once the concentration of product is presumably within the instruments detection
limitation range. The initial reaction rate of benzamide production can therefore not be
calculated within the first few minutes of reaction.
Chapter 3 65
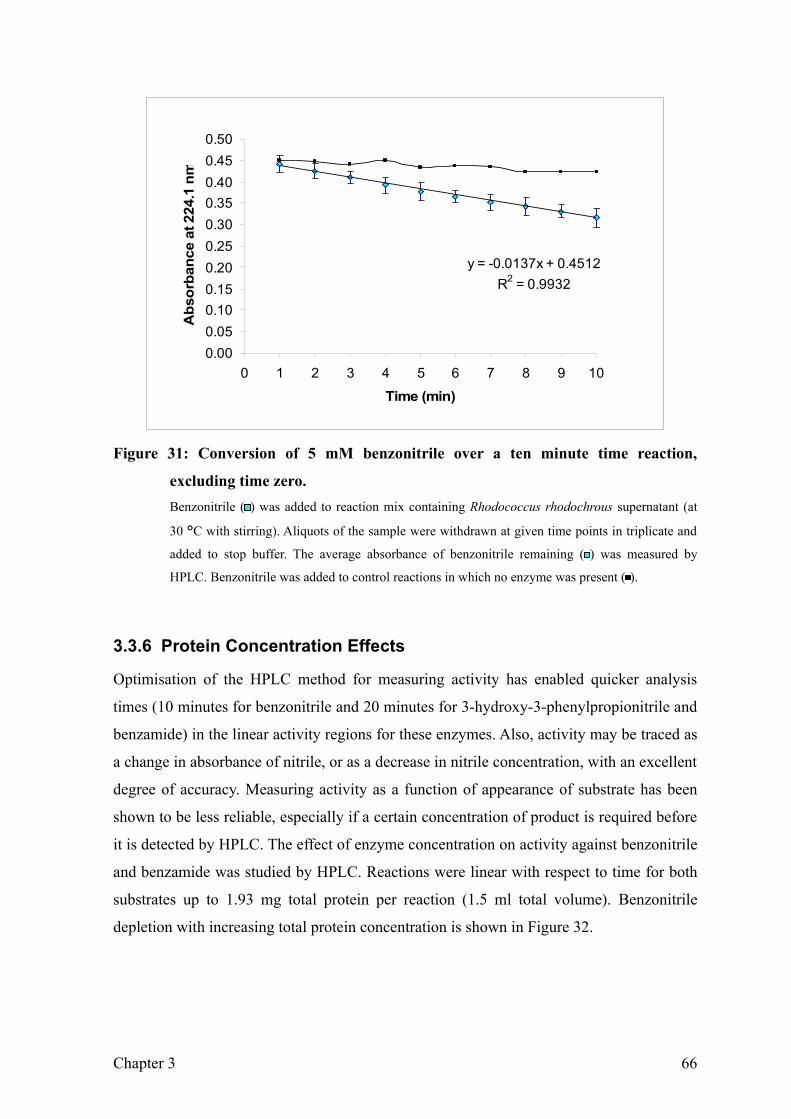
y = -0.0137x + 0.4512R2 = 0.9932
0.000.050.100.150.200.250.300.350.400.450.50
0 1 2 3 4 5 6 7 8 9 10
Time (min)
Abs
orba
nce
at 2
24.1
nm
Figure 31: Conversion of 5 mM benzonitrile over a ten minute time reaction,
excluding time zero.Benzonitrile ( ) was added to reaction mix containing Rhodococcus rhodochrous supernatant (at
30 °C with stirring). Aliquots of the sample were withdrawn at given time points in triplicate and
added to stop buffer. The average absorbance of benzonitrile remaining ( ) was measured by
HPLC. Benzonitrile was added to control reactions in which no enzyme was present ( ).
3.3.6 Protein Concentration Effects
Optimisation of the HPLC method for measuring activity has enabled quicker analysis
times (10 minutes for benzonitrile and 20 minutes for 3-hydroxy-3-phenylpropionitrile and
benzamide) in the linear activity regions for these enzymes. Also, activity may be traced as
a change in absorbance of nitrile, or as a decrease in nitrile concentration, with an excellent
degree of accuracy. Measuring activity as a function of appearance of substrate has been
shown to be less reliable, especially if a certain concentration of product is required before
it is detected by HPLC. The effect of enzyme concentration on activity against benzonitrile
and benzamide was studied by HPLC. Reactions were linear with respect to time for both
substrates up to 1.93 mg total protein per reaction (1.5 ml total volume). Benzonitrile
depletion with increasing total protein concentration is shown in Figure 32.
Chapter 3 66

y = 6x10⁶x - 1x10⁶
R2 = 0.99
y = -5x10⁶x + 1x10⁷
R2 = 0.99
0
2000000
4000000
6000000
8000000
10000000
12000000
14000000
16000000
0.0 0.2 0.4 0.6 0.8 1.0 1.2 1.4
Total Protein Concentration (mg/ml)
Ave
rage
Inte
grat
ed A
rea
Figure 32: Formation of benzoic acid from benzonitrile with increasing protein
concentration.Different enzyme concentrations were incubated with benzonitrile for 20 min at 30 °C with
shaking (200 rev./min). The disappearance of benzonitrile ( ) and appearance of benzoic acid ( )
was analysed in triplicate by HPLC and the average integrated area plotted ± S.D.
Benzoic acid formation from benzonitrile is evident with increasing protein concentration
from 0.2 mg protein. No benzamide was detected in any of the samples tested showing it
was concurrently converted to benzoic acid at all the protein concentrations tested. The
effect of increasing protein concentration on substrate benzamide showed that at 0.83 mg
of protein, benzamide is still present in the samples but is totally converted within 30
minutes of reaction when the protein concentration reaches 0.93 mg/ml. Benzoic acid
formation from benzamide is evident from 0.93 mg/ml of protein (Figure 33). Benzonitrile
conversion to benzamide occurs at much lower concentrations than benzamide conversion
to benzoic acid.
There appears to be a delay between the consumption of the amide and release of the acid
(Figure 33). A proportion of the benzamide may be bound to the amidase before benzoic
acid is release as product. This may account for the slower benzoic acid formation from
benzamide compared to benzamide formation from benzonitrile.
Chapter 3 67

y = 7x10⁶x + 266400R2 = 0.98
0
2000000
4000000
6000000
8000000
10000000
12000000
14000000
16000000
0.0 0.2 0.4 0.6 0.8 1.0 1.2 1.4 1.6 1.8 2.0
Total Protein Concentration (mg/ml)
Ave
rage
Inte
grat
ed A
rea
Figure 33: Formation of benzoic acid from benzamide with increasing protein
concentration.Different enzyme concentrations were incubated with benzamide for 30 min at 30 °C with shaking
(200 rev./min). The disappearance of benzamide ( ) and appearance of benzoic acid ( ) was
analysed in triplicate by HPLC and the average integrated area plotted ± S.D.
When a linear regression curve is fitted to the average integrated area of benzoic acid as a
function of protein concentration from 0.93 to 1.86 mg/ml only, the R2 value is improved
to 0.9978 (Figure 33). Formation of benzoic acid from benzamide is linear up to 1.93
mg/ml protein. The effect of increasing protein concentration on activity against
benzonitrile and benzamide was repeated with lower reaction times and lower total protein
concentration increments. When benzonitrile was used as the substrate, a reduced reaction
time and lower protein concentration allowed its conversion to benzamide to be measured
by HPLC, before it was further converted to benzoic acid.
During a 12 minute reaction, formation of benzamide from benzonitrile is evident from 0.3
mg to 0.9 mg/ml protein, and it was concurrently converted to benzoic acid in these
samples. Benzoic acid formation from benzamide occurs from 0.3 mg/ml protein and its
concentration increases in all further samples tested. The amount of benzamide and
benzoic acid formed from benzonitrile is shown in Figure 34.
Chapter 3 68

0
1
2
3
4
5
6
7
0.0 0.2 0.4 0.6 0.8 1.0 1.2 1.4 1.6 1.8Protein Concentration (mg/ml)
Am
ount
( µm
ol)
Figure 34: Amount of benzamide and benzoic acid formed from benzonitrile with
increasing protein concentration.Different enzyme concentrations were incubated with benzonitrile for 12 min at 30 °C with
shaking (200 rev./min). The formation of benzamide ( ) and benzoic acid ( ) from benzonitrile was
analysed in triplicate by HPLC and the amount of substrate and product plotted. All benzonitrile is
converted to benzamide and consequently to benzoic acid. The additive amounts of both products,
benzamide and benzoic acid ( ), was plotted on the same axes, indicating the total conversion by a
presumed nitrile hydratase.
Disappearance of substrate is “mirrored” by appearance of product, and when all
benzamide is utilised, the amount of benzoic acid formed plateaus at approximately 6.5 µ
mol. The starting amount of benzonitrile in the reaction was approximately 7.5 µmol. The
additive amount of benzamide and benzoic acid is shown in Figure 34 – assuming that all
the acid produced is due to amidase only, the total product formed shows the total activity
profile against benzonitrile at increasing protein concentration.
When benzonitrile was the primary substrate, the amount of benzoic acid formed from
benzamide, and disappearance of benzamide is linear at protein concentrations 0.29 to 0.86
mg/ml, and display linear regression analysis R2 values of 1 and 0.99, respectively (data
not shown).
Chapter 3 69

To compare formation of benzoic acid directly from benzamide, and from benzamide that
was first formed from benzonitrile, the effect of increasing protein concentration on
activity was tested by reacting protein against benzamide for 25 minutes. The average
integrated area of benzoic acid formation from benzamide with increasing protein
concentration is shown in Figure 35. Benzoic acid formation from benzamide plateaus
after protein concentrations of 0.9 mg/ml and all benzamide is converted at concentrations
higher than 0.57 mg/ml. Activity against benzamide is linear at total protein concentrations
from 0.3 to 0.9 mg (R2 = 0.99 for benzamide disappearance, and R2 = 0.98 for benzoic acid
formation) and is in agreement with results where benzamide was first formed from
benzonitrile (Figure 34).
0
2000000
4000000
6000000
8000000
10000000
12000000
14000000
0.0 0.2 0.4 0.6 0.8 1.0 1.2 1.4
Protein Concentration (mg/ml)
Ave
rage
Inte
grat
ed A
rea
Figure 35: Average integrated area of benzoic acid formation from benzamide over a
25 minute reaction with increasing protein concentration.Different enzyme concentrations were incubated with benzamide at 30 °C with shaking (200
rev./min). The formation of benzoic acid ( ) from benzamide ( ) was analysed in triplicate by
HPLC and the average integrated area plotted ± S.D.
The effect of increasing protein concentration on product formation from 3-hydroxy-3-
phenylpropionitrile was measured (Figure 36). 3-Hydroxy-3-phenylpropionitrile was not
present at any protein concentration tested, indicating it was all converted to product. Total
product formation from 3-hydroxy-3-phenylpropionitrile was linear up to 1.43 mg protein.
Activity against benzonitrile and 3-hydroxy-3-phenylpropionitrile follows similar trends.
Chapter 3 70
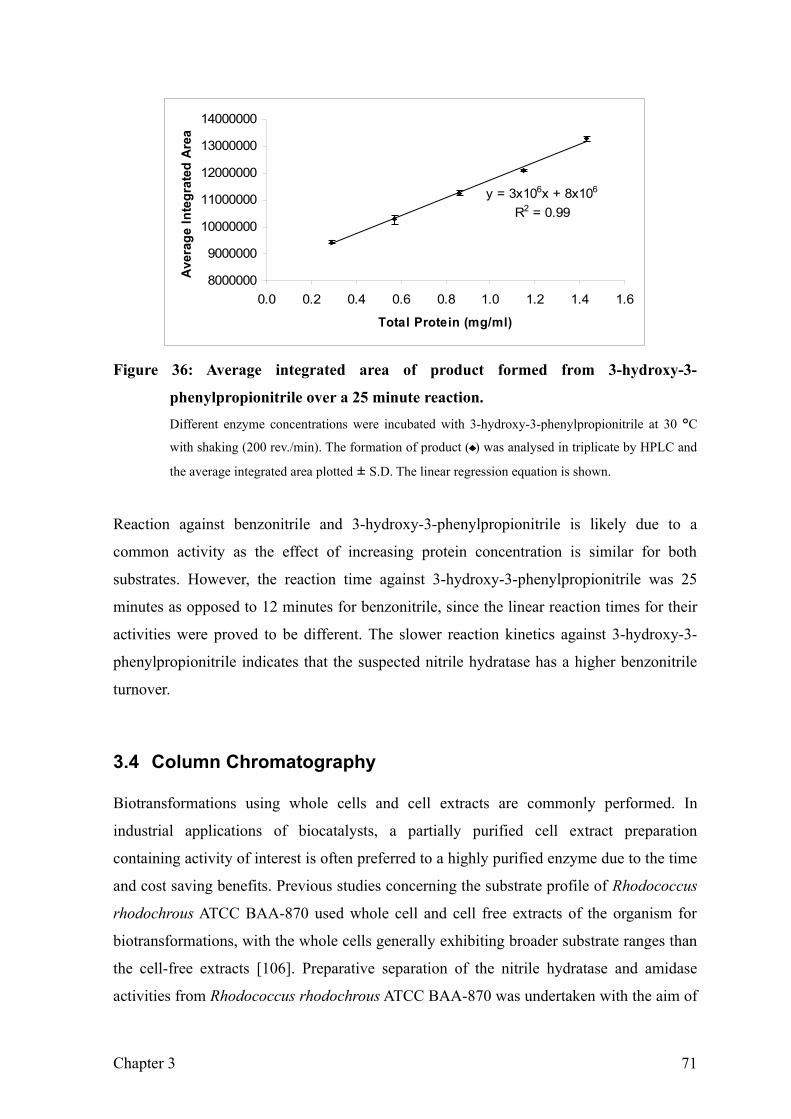
y = 3x10⁶x + 8x10⁶
R2 = 0.99
8000000
9000000
10000000
11000000
12000000
13000000
14000000
0.0 0.2 0.4 0.6 0.8 1.0 1.2 1.4 1.6
Total Protein (mg/ml)
Ave
rage
Inte
grat
ed A
rea
Figure 36: Average integrated area of product formed from 3-hydroxy-3-
phenylpropionitrile over a 25 minute reaction.Different enzyme concentrations were incubated with 3-hydroxy-3-phenylpropionitrile at 30 °C
with shaking (200 rev./min). The formation of product ( ) was analysed in triplicate by HPLC and
the average integrated area plotted ± S.D. The linear regression equation is shown.
Reaction against benzonitrile and 3-hydroxy-3-phenylpropionitrile is likely due to a
common activity as the effect of increasing protein concentration is similar for both
substrates. However, the reaction time against 3-hydroxy-3-phenylpropionitrile was 25
minutes as opposed to 12 minutes for benzonitrile, since the linear reaction times for their
activities were proved to be different. The slower reaction kinetics against 3-hydroxy-3-
phenylpropionitrile indicates that the suspected nitrile hydratase has a higher benzonitrile
turnover.
3.4 Column Chromatography
Biotransformations using whole cells and cell extracts are commonly performed. In
industrial applications of biocatalysts, a partially purified cell extract preparation
containing activity of interest is often preferred to a highly purified enzyme due to the time
and cost saving benefits. Previous studies concerning the substrate profile of Rhodococcus
rhodochrous ATCC BAA-870 used whole cell and cell free extracts of the organism for
biotransformations, with the whole cells generally exhibiting broader substrate ranges than
the cell-free extracts [106]. Preparative separation of the nitrile hydratase and amidase
activities from Rhodococcus rhodochrous ATCC BAA-870 was undertaken with the aim of
Chapter 3 71

establishing a quick protocol for their separation for future activity profiling and enzyme
stability studies, and to ensure that nitrile hydratase and amidase, and not nitrilase, was
responsible for the activity found within the organism. Column chromatography was used
for the separation of nitrile hydratase and amidase activities in a one-step process. If
separate activities were required in a biocatalytic process, a simplified method for an
enzyme preparation would be desirable in industry.
3.4.1 Chromatofocusing
Chromatofocusing is a powerful chromatographic technique that can be used to
preparatively separate concentrated protein mixes, as well as protein isoforms.
Chromatofocusing was the initial purification technique chosen to separate the enzyme/s of
interest from the Rhodococcus rhodochrous ATCC BAA-870 soluble protein fraction
(Figure 37). Due to the accuracy of the technique, a concentrated mixed protein sample can
be applied to a chromatofocusing column and proteins purified to within 0.2 pH units
difference in pI. An attempt at preparative separation of the nitrile-converting enzymes of
interest was undertaken in which chromatofocusing was used to separate the enzymes
based on pI differences, as well as to separate any isoforms of the enzymes.
The largest protein peak in chromatofocusing contained proteins at pI approximately 4
(Figure 37). It could be assumed that nitrile hydratase was contained within fractions of
acidic pI (see Appendix 5.3 for nitrile hydratase theoretical pIs).
Each eluting fraction was tested against 5 mM of benzonitrile, hydrocinnamonitrile,
(R)+mandelonitrile, 2-phenylglycinonitrile, 3-hydroxy-3-phenylpropionitrile, and 3-
hydroxy-4-phenylvaleronitrile by HPLC. Control reactions without fraction samples were
done (containing Polybuffer74 and substrate only, data not shown). All fractions showed
no conversion of any of the substrates tested, and hence no detectable activity could be
traced to any fractions. Unbound proteins also displayed no activity. BioRad protein
concentration determination of the eluting fractions showed that protein was concentrated
enough to afford activity as indicated by the protein concentration study (see Appendix 5.1
for example of standard curve). Fraction 100, for example contained 0.31 mg protein, a
concentration at which benzonitrile, 3-hydroxy-3-phenylpropionitrile and benzamide were
converted to products using the developed HPLC method.
Chapter 3 72

0.0
0.2
0.4
0.6
0.8
1.0
1.2
1.4
0 10 20 30 40 50 60 70 80 90 100 110
Fraction Number
Abs
orba
nce
at 2
80 n
m
3.03.54.0
4.55.05.56.06.5
7.07.58.0
pH
Figure 37: Polybuffer Exchanger 94 Chromatofocusing elution profile of the soluble
protein fraction from Rhodococcus rhodochrous grown in minimal media.Polybuffer 74 was used to elute the proteins with a pH 7 to 4 gradient ( ). The elution of protein
was monitored by measuring the absorbance at 280 nm of each fraction ( ).
In order to test whether the volume of fraction added to the reaction would significantly
alter the overall pH of the reaction thereby causing a loss in activity, a pH test was
performed. When 750 µl of Polybuffer 74 at pH 4 was added to reaction buffer at pH 7.4,
the buffering capacity of the reaction buffer was enough to prevent any major changes in
the reaction pH. The final pH was not changed by more than 0.3 pH units and therefore
was not enough to have affected the pH of the reaction.
The fractions eluted from the chromatofocusing column showed no visible colour although
an orange-coloured supernatant was originally loaded. The significance of the coloured
fractions will be discussed later on in the study.
3.4.2 Gel Exclusion Chromatography
Sephacryl S-200 gel exclusion media with fractionation range (Mr) 5 000 – 250 000 was
used to separate the enzymes present in supernatant of Rhodococcus rhodochrous. A
protein standard elution profile and standard curve (Appendix 5.2) for Sephacryl S-200
was generated using molecular weight standards. The column void volume (46 ml) was
Chapter 3 73

determined from the elution of Blue Dextran (2 000 kDa), and the apparent molecular
weight of proteins within each fraction were estimated by comparison of the ratio of
elution volume/void volume to those of the standards. A selectivity curve for Sephacryl S-
200 media was generated in order to determine the size exclusion limits of the gel
(Appendix 5.2). According to Figure 71, the exclusion limit for Sephacryl S-200 gel is log
Mr 3.83 – 5.33, which equates to an Mr of approximately 6 700 – 213 800. The table of
apparent average molecular weights of proteins within each eluted fraction (Table 8,
Appendix 5.2) shows that the Mr of proteins within fractions 1 - 6 and 11 - 17 fall outside
the exclusion limit for Sephacryl S-200, and therefore proteins falling outside this range
may not be accurately sized.
Samples of crude protein mix from two batches of minimal media-grown cell-free extract
from Rhodococcus rhodochrous were run on 10% SDS-PAGE (Figure 38).
Figure 38: 10% SDS-PAGE of supernatant prepared from Rhodococcus rhodochrous
grown in defined minimal media containing benzonitrile as inducer.Lanes 1 and 2 are duplicate samples of supernatants of sonicates (15.5 µg of protein), while lanes
3 and 4 are duplicate samples of a second batch of cell-free extract (16 µg of protein). Precision
plus protein markers from BioRad had relative molecular masses 250 000, 150 000, 100 000, 75
000, 50 000, 37 000 and 25 000. The gel was run at 150 volts using a BioRad mini Protean system.
A mixed protein sample from supernatant of Rhodococcus rhodochrous grown in minimal
media was eluted on a Sephacryl S-200 gel exclusion column (Figure 39). The high
Chapter 3
1 2 3 4Mr
25015010075
50
37
2520
15
74

molecular weight fractions eluting first off the gel exclusion column showed activity.
Fractions 5, 6, 7 and 8 (volume 40 – 64 ml) were active against benzonitrile, and converted
it to benzamide (Figure 40). This indicates the presence of a nitrile hydratase since no
benzoic acid was found. If so, this shows separation of nitrile hydratase activity from
amidase activity, since no benzoic acid was present in any of the fraction samples analysed.
Fractions 5, 6 and 7 also showed activity against 3-hydroxy-3-phenylpropionitrile. Again,
activity against benzonitrile and 3-hydroxy-3-phenylpropionitrile was similar and shared in
the same fractions (Figure 40).
Figure 39: Protein elution from Sephacryl S-200 during gel exclusion of a cell free
protein mix from Rhodococcus rhodochrous.Proteins were eluted at room temperature with a flow rate of 0.7 ml/min using 100 mM potassium
phosphate buffer, pH 7.4, containing 0.02% (w/v) sodium azide. A total of 9.46 mg protein was
loaded onto the column and the A280 was monitored ( ). Fraction numbers are indicated by arrows.
Fractions at an elution volume higher than approximately 72 ml displayed no activity.
From the standard curve of gel exclusion size standards created (Appendix 5.3), fractions
eluting after 72 ml are in the size region approximately 20 kDa and smaller. Fractions with
activity against benzonitrile contain proteins of average sizes roughly 700 kDa, 230 kDa
and 93 kDa (fractions 5-7, respectively) and fraction 8 contains proteins of approximately
40 kDa (Figure 40). Fractions displaying activity all contain high molecular weight
proteins, and elute with or just after the column void volume (43 ml).
Chapter 3
0.00.10.20.30.40.50.60.70.80.91.0
0 10 20 30 40 50 60 70 80 90 100 110 120 130 140
Elution Volume (ml)
Rel
ativ
e A
bsor
banc
e at
280
nm
5 6 7 8
75

0.0
0.1
0.2
0.3
0.4
0.5
0.6
0.7
0.8
0.9
1.0
0 10 20 30 40 50 60 70 80 90 100 110 120 130 140
Volume (ml)
Rel
ativ
e A
bsor
banc
e
0
5
10
15
20
25
30
Am
ount
of S
ubst
rate
Rem
aini
ng ( µ
M)
Figure 40: Nitrile hydrolytic activity profile of fractions from Sephacryl S-200 gel
exclusion of a cell free protein mix from Rhodococcus rhodochrous showing
residual substrate after reaction.Benzonitrile ( ), benzamide ( ) or 3-hydroxy-3-phenylpropionitrile ( ) was reacted in duplicate
with each fraction at 30 °C with shaking (200 rev./min) and the amount of substrate remaining or
product produced analysed by HPLC. Benzonitrile samples were reacted for 10 minutes, while
benzamide and 3-hydroxy-3-phenylpropionitrile were reacted for 30 minutes. Proteins were eluted
at room temperature with a flow rate of 0.7 ml/min using 100 mM potassium phosphate buffer, pH
7.4, containing 0.02% (w/v) sodium azide. A total of 9.46 mg protein was loaded onto the column
and the A280 was monitored ( ).
Although the sample applied to the column showed amidase activity, it was not detectable
in the fractions. Nitrile hydratase activity eluted at a volume of 40 – 56 ml. Proteins in this
volume were resolved on a 10% SDS-PAGE gel; this yielded a prominent protein band at
48 kDa and two, less prominent bands, at 56 and 84 kDa after Coomassie staining (Figure
41). SDS-PAGE analysis showed that the active fractions also contained proteins of less
than 25 kDa, however, a 10% polyacrylamide gel did not resolve in that molecular mass
region. The sample did not contain proteins of less than 10 kDa since molecular cut-off
filtration was used prior to gel exclusion, and contained no activity when tested by HPLC
(data not shown).
Chapter 3 76

Figure 41: 12% SDS-PAGE of Sephacryl S-200 size exclusion chromatography
fractions.Samples of eluting gel exclusion fractions were prepared by adding 15 µl of each fraction to 10 µl
sample loading buffer, and heating at 95 °C for 5 min prior to loading 20 µl of each sample. Lane
5 corresponds to fraction 5; lane 6, fraction 6 and lane 7, fraction 7. Protein size markers had
relative molecular mass 250 000, 150 000, 100 000, 75 000, 50 000, 37 000 and 25 000. The gel
was run at 150 volts using a BioRad mini Protean system. Arrows indicate sizes of resolved
proteins.
Interestingly, fraction 5 with highest apparent molecular weight (lane 3, Figure 41) eluted
orange-coloured. SDS-PAGE analysis showed a prominent 48 kDa band in this fraction
which may be responsible if the colour is protein associated. Since the elution in fraction 5
occurred at high molecular weight, the colour is more likely protein-associated than due to
a possible pigment contained within the sample.
Gel exclusion chromatography using Sephacryl S-200 was repeated to detect activity
against benzamide, and to further resolve the apparent sizes of the enzymes responsible for
activity. The protein sample was treated with polyethylenimine to remove any high
molecular weight nucleic acid excess prior to loading (Figure 42). Fractions were collected
in smaller volumes to further separate the activity against benzonitrile and 3-hydroxy-3-
phenylpropionitrile.
Chapter 3
56 kDa
75 6Mr
250150
100
75
50
37
25
48 kDa
84 kDa
77

00.10.20.30.40.50.60.70.80.9
0 20 40 60 80 100 120 140 160 180 200
Volume (ml)
Abs
orba
nce
at 2
80 n
m
Figure 42: Sephacryl S-200 gel exclusion protein elution profile of Rhodococcus
rhodochrous supernatant treated with polyethylenimine.Supernatant was buffer exchanged using a 10 k cut-off filtration membrane after treatment with
polyethylenimine. A 1 ml volume of a 10 mg/ml soluble protein mixture was loaded onto the
column and eluted using 20 mM phosphate buffer, pH 7.4 with a 0.7 ml/min flow rate. The A280
was monitored ( ).
Reactions of eluted fraction samples were performed for 2 hours to ensure detection of
activity and were therefore qualitative measures of activity. When fractions were reacted
with benzonitrile, conversion to benzamide and benzoic acid was detected, indicating
amidase activity was present. The profile of activity against benzonitrile showed distinct
fractions where only benzamide was formed, and fractions where benzamide and benzoic
acid were produced (Figure 43). Fractions reacted against benzamide confirmed amidase
activity in fractions 15 and 16, with fractions 13 to 16 showing conversion to benzoic acid
(Figure 44).
Chapter 3 78

0123456789
0 2 4 6 8 10 12 14 16 18 20 22 24 26 28 30 32 34 36 38
Fraction Number
Am
ount
( µm
ol)
Figure 43: Conversion of benzonitrile to product in Sephacryl S-200 gel exclusion
fractions showing total amount of product formation.Benzonitrile ( ) was reacted in duplicate with each fraction for 2 hours at 30 °C with shaking (200
rev./min) and the amount of substrate remaining and product produced analysed by HPLC.
Benzamide ( ) was produced from benzonitrile and benzoic acid ( ) produced concurrently from
benzamide. The sum of benzamide and benzoic acid amounts is indicated to show total product
formation ( , dotted line).
0
1
2
3
4
5
6
7
0 2 4 6 8 10 12 14 16 18 20 22 24 26 28 30 32 34 36 38
Fraction Number
Amou
nt (
µmol
)
Figure 44: Conversion of benzamide to benzoic acid in Sephacryl S-200 eluted
fractions.Benzamide ( ) was reacted in duplicate with each fraction for 2 hours at 30 °C with shaking (200
rev./min) and the amount of substrate remaining and benzoic acid ( ) produced analysed by HPLC.
Chapter 3 79

Activity against 3-hydroxy-3-phenylpropionitrile shared a similar profile with that of
benzamide, with fractions 13 to 16 showing conversion to product (Figure 45). Unlike
benzamide conversion, however, all the 3-hydroxy-3-phenylpropionitrile in fractions 14
and 15 was utilised.
0123456789
10
0 2 4 6 8 10 12 14 16 18 20 22 24 26 28 30 32 34 36 38
Fraction Number
Am
ount
( µm
ol)
Figure 45: Conversion of 3-hydroxy-3-phenylpropionitrile to product in Sephacryl S-
200 eluted fractions.3-Hydroxy-3-phenylpropionitrile ( ) was reacted in duplicate with each fraction for 2 hours at 30
°C with shaking (200 rev./min) and the amount of substrate remaining and product ( ) produced
analysed by HPLC.
Comparative activity profiles against benzonitrile, benzamide and 3-hydroxy-3-
phenylpropionitrile are shown in Figure 46. Although their activities overlap somewhat,
activity against 3-hydroxy-3-phenylpropionitrile had a wider fraction range than activity
against benzamide since it was converted to product in fractions 13 to 18, whereas
conversion of benzamide to benzoic acid occurs in fractions 13 to 16 (Figure 44 and Figure
45). Since the dilution of reacting enzyme from each fraction and the reaction time was the
same for reactions against both substrates, it may be said that activity against 3-hydroxy-3-
phenylpropionitrile is higher than that against benzamide.
Chapter 3 80

0
0.1
0.2
0.3
0.4
0.5
0.6
0.7
0.8
0.9
0 2 4 6 8 10 12 14 16 18 20 22 24 26 28 30 32
Fraction Number
Abs
orba
nce
at 2
80 n
m
012345678910
Am
ount
( µm
ol)
Figure 46: Conversion of benzonitrile, benzamide and 3-hydroxy-3-
phenylpropionitrile in Sephacryl S-200 eluted fractions.Benzonitrile ( ), benzamide ( ) or 3-hydroxy-3-phenylpropionitrile ( ) were reacted in duplicate
with each fraction at 30 °C with shaking (200 rev./min) and the amount of substrate remaining
analysed by HPLC. Benzonitrile reactions were reacted for 10 minutes, while benzamide and 3-
hydroxy-3-phenylpropionitrile were reacted for 30 minutes. Elution of protein was monitored at
280 nm ( ).
Elution of smaller fraction volumes allowed better protein size distinctions possible for
each fraction. Fractions 12 to 17 contained proteins of approximate relative molecular
mass 34 500 to 5 500. Fraction 14 and 15 contained proteins of a range of approximate
relative molecular mass between 17 000 and 25 000, respectively. Interestingly, activity
against benzonitrile was due to proteins spanning a large size range, and may be an enzyme
with mixed size species (similar to the low- and high-molecular mass nitrile hydratase of
Rhodococcus rhodochrous J1). The apparent protein sizes affording activity in the second
gel exclusion experiment are smaller (6 500 – 34 500) than sizes attributed to activity in
the first experiment (42 000 – 700 000). Treatment of supernatant with polyethylenimine
may have disrupted formation of high molecular weight enzyme aggregates in fractions of
the second experiment.
Chapter 3 81

SDS-PAGE of active fraction samples showed prominent bands in the 84, 56, 48 and 21
kDa region (Figure 41). Nitrile hydratase activity spans a native size range of
approximately 2 000 – 68 000 in the second gel exclusion experiment, and 42 000 – 700
000 in the first experiment. Since cut-off filtration using an ultrafiltration membrane was
used prior to loading the sample, the supernatant loaded onto the column should not
contain proteins of less than 10 kDa. If multimer formation was inhibited in the second
experiment, then functional αβ units in the 48 kDa range (made up of roughly 21 kDa
monomers) may be the protein sizes responsible. If larger multimers formed in the first
experiment, then a combination of αβ and α2β2 (possibly 84 kDa), and even some larger
multimers could be possible The native quaternary structures of bacterial nitrile hydratases
are highly variable, but most are αβ heteromultimers, typically dimers or tetramers [102].
Stronger reducing conditions may be necessary for subunit disruption during denaturing
PAGE – indeed, the reducing agents DTT and β-mercaptoethanol have been found to
enhance the activity of nitrile hydratases (presumably by stabilising the catalytically active
enzyme sulfhydryl groups) [103, 113], which may be further proof that the enzyme
structure is not compromised by reducing agents. Although the addition of urea to SDS-
PAGE serves to denature the native protein structure, urea itself is a known inducer of
nitrile hydratase activity. High- and low-molecular mass nitrile hydrates in Rhodococcus
rhodochrous has been selectively induced by reaction products (amides) and urea,
respectively [17, 20, 114].
Again, orange-coloured fractions (fractions 13 – 15) appeared in the second gel exclusion
elution experiment which correlated with maximum nitrile hydrolysing activity. A
spectrophotometric wavelength absorbance scan of the coloured fractions (fraction number
14 and 15) compared to a clear protein-containing fraction was done (Figure 47), and
showed increased absorption at 280 nm (due to higher protein levels) and a broad shoulder
at 300 – 460 nm, which would result in a colour in the red to yellow visible range.
Chapter 3 82

0.0
0.2
0.4
0.6
0.8
1.0
220 260 300 340 380 420 460 500 540 580 620
Wavelength (nm)
Abso
rban
ce
Figure 47: Wavelength scans of a coloured Sephacryl S-200 eluted gel exclusion
fraction compared to other fractions. All eluted fractions ( ) were clear apart from the fractions containing nitrile hydratase activity ( )
which was orange-pink in colour. Fractions were measured in quartz cuvettes using a DU 800
Spectrophotometer and are plotted as an average of three spectra.
The visual colour of fraction 14 and 15 was noted to be similar to the colour of
Rhodococcus rhodochrous colonies or growth in media (Figure 13). It was originally
assumed the colour was due to the pigment contained within the organism. Also,
supernatant of Rhodococcus rhodochrous ATCC BAA-870, and therefore the cell free
extract applied to the column, is orange in colour. Unbound proteins elute without colour,
and colour is only preserved in proteins with nitrile hydrolysing activity.
3.4.3 Ion Exchange
Gel exclusion chromatography showed that nitrile hydratase and amidase in Rhodococcus
rhodochrous ATCC BAA-870 are high molecular weight enzymes, and that their activities
overlap in these fractions. Ion exchange chromatography of supernatant from Rhodococcus
rhodochrous using Toyopearl SuperQ 650M ion exchange resin was performed to attempt
separation of the nitrile hydratase and amidase activity which was not possible using gel
exclusion. At first, twenty-one fractions were collected over a 42 ml salt gradient after
unbound proteins were eluted from the column (Figure 48).
Chapter 3 83

0.0
0.5
1.0
1.5
2.0
0 2 4 6 8 10 12 14 16 18 20 22 24 26 28 30 32
Fraction Number
Abs
orba
nce
at 2
80 n
m
050100150200250300350400450500
NaC
l Gra
dien
t (m
M)
Figure 48: Protein elution profile from Toyopearl SuperQ 650M during ion exchange
chromatography of supernatant from Rhodococcus rhodochrous.The column was equilibrated using 20 mM Tris buffer, pH 8. Supernatant from Rhodococcus
rhodochrous was buffer exchanged into 20 mM Tris buffer, pH 8, and 4.9 ml of a 10 mg/ml sample
loaded onto the column. Unbound proteins were allowed to elute prior to elution of bound proteins
using a 500 mM NaCl gradient over 42 ml ( ). The fraction A280 was monitored ( ).
All ion exchange elution fractions were tested for activity against benzonitrile, benzamide
and 3-hydroxy-3-phenylpropionitrile for 2 hours to ensure reactions ran to completion even
if enzyme levels were not concentrated. No activity was detected in the fractions
containing unbound protein. Figure 49 shows conversion of benzonitrile to benzamide and
benzoic acid in ion exchange fractions. When benzonitrile was reacted, the benzamide
produced was further converted to benzoic acid in fraction 17 and 18 (140 – 170 mM NaCl
elution) and therefore both nitrile hydratase and amidase was present in these fractions.
Fractions 19 and 20 (190 – 215 mM NaCl elution) contained benzamide only, and
therefore only nitrile hydratase was present in those fractions since it was not further
converted to benzoic acid even though it was reacted for 2 hours.
Based on the assumption that there is not a nitrilase present, an additive curve of amide
produced as a sum of benzamide and benzoic acid gives a profile of the overall nitrile
hydratase activity (Figure 49). Fraction 16 showed formation of 0.12 µmol of benzoic acid
whereas no benzamide was detected in that fraction, and hence presumably all benzamide
was converted to benzoic acid. When benzonitrile was the substrate, benzoic acid was
formed in fractions 16, 17 and 18, and benzamide was formed in fractions 17, 18, 19 and
20. When benzamide was reacted with the ion exchange fractions, conversion to benzoic
Chapter 3 84
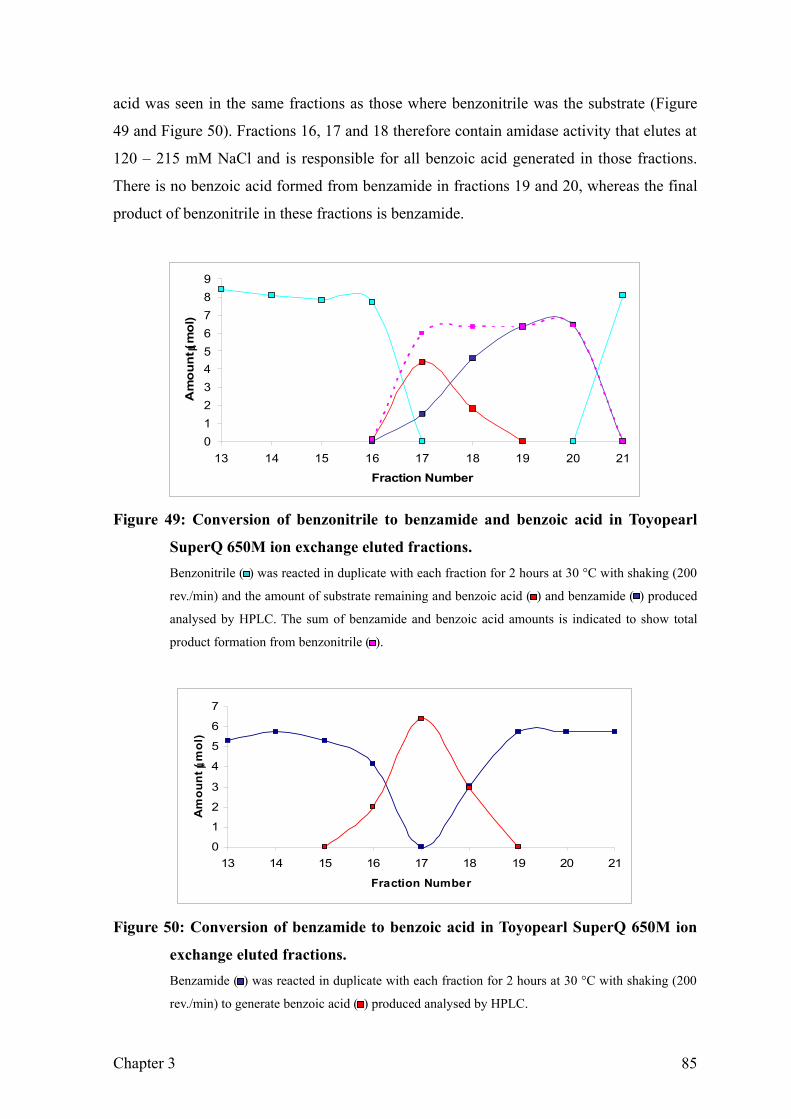
acid was seen in the same fractions as those where benzonitrile was the substrate (Figure
49 and Figure 50). Fractions 16, 17 and 18 therefore contain amidase activity that elutes at
120 – 215 mM NaCl and is responsible for all benzoic acid generated in those fractions.
There is no benzoic acid formed from benzamide in fractions 19 and 20, whereas the final
product of benzonitrile in these fractions is benzamide.
0123456789
13 14 15 16 17 18 19 20 21
Fraction Number
Am
ount
( µm
ol)
Figure 49: Conversion of benzonitrile to benzamide and benzoic acid in Toyopearl
SuperQ 650M ion exchange eluted fractions.Benzonitrile ( ) was reacted in duplicate with each fraction for 2 hours at 30 °C with shaking (200
rev./min) and the amount of substrate remaining and benzoic acid ( ) and benzamide ( ) produced
analysed by HPLC. The sum of benzamide and benzoic acid amounts is indicated to show total
product formation from benzonitrile ( ).
0
1
2
3
4
5
6
7
13 14 15 16 17 18 19 20 21
Fraction Number
Am
ount
( µm
ol)
Figure 50: Conversion of benzamide to benzoic acid in Toyopearl SuperQ 650M ion
exchange eluted fractions.Benzamide ( ) was reacted in duplicate with each fraction for 2 hours at 30 °C with shaking (200
rev./min) to generate benzoic acid ( ) produced analysed by HPLC.
Chapter 3 85
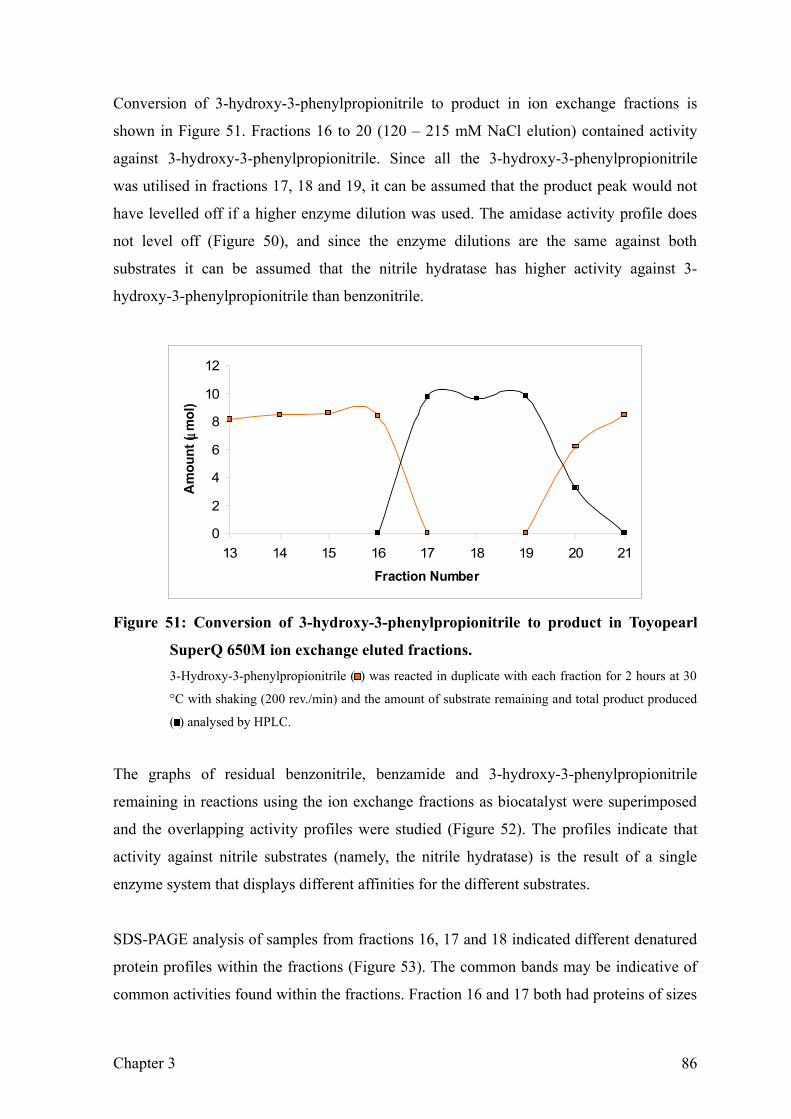
Conversion of 3-hydroxy-3-phenylpropionitrile to product in ion exchange fractions is
shown in Figure 51. Fractions 16 to 20 (120 – 215 mM NaCl elution) contained activity
against 3-hydroxy-3-phenylpropionitrile. Since all the 3-hydroxy-3-phenylpropionitrile
was utilised in fractions 17, 18 and 19, it can be assumed that the product peak would not
have levelled off if a higher enzyme dilution was used. The amidase activity profile does
not level off (Figure 50), and since the enzyme dilutions are the same against both
substrates it can be assumed that the nitrile hydratase has higher activity against 3-
hydroxy-3-phenylpropionitrile than benzonitrile.
0
2
4
6
8
10
12
13 14 15 16 17 18 19 20 21
Fraction Number
Am
ount
( µm
ol)
Figure 51: Conversion of 3-hydroxy-3-phenylpropionitrile to product in Toyopearl
SuperQ 650M ion exchange eluted fractions.3-Hydroxy-3-phenylpropionitrile ( ) was reacted in duplicate with each fraction for 2 hours at 30
°C with shaking (200 rev./min) and the amount of substrate remaining and total product produced
( ) analysed by HPLC.
The graphs of residual benzonitrile, benzamide and 3-hydroxy-3-phenylpropionitrile
remaining in reactions using the ion exchange fractions as biocatalyst were superimposed
and the overlapping activity profiles were studied (Figure 52). The profiles indicate that
activity against nitrile substrates (namely, the nitrile hydratase) is the result of a single
enzyme system that displays different affinities for the different substrates.
SDS-PAGE analysis of samples from fractions 16, 17 and 18 indicated different denatured
protein profiles within the fractions (Figure 53). The common bands may be indicative of
common activities found within the fractions. Fraction 16 and 17 both had proteins of sizes
Chapter 3 86

84 kDa, 47 kDa and 21 kDa, while fractions 17 and 18 both had proteins with sizes of 56
kDa and 36 kDa. SDS-PAGE of gel exclusion fractions with activity displayed common
subunit sizes to those found in ion exchange fractions (Figure 53). Gel exclusion fractions
with nitrile hydratase activity contained subunits of sizes 84 kDa, 56 kDa, 48 kDa and a
size less than 25 kDa (Figure 47), while ion exchange fractions show sizes 84 kDa, 56
kDa, 47 kDa, 36 kDa, 32 kDa and 21 kDa. Assuming the common subunit sizes are due to
common activities, nitrile hydratase and amidase in Rhodococcus rhodochrous ATCC
BAA-870 may be made up of one or more of these subunit sizes.
0123456789
10
13 14 15 16 17 18 19 20 21
Fraction Number
Am
ount
of S
ubst
rate
( µm
ol)
Figure 52: Amount of benzonitrile, benzamide and 3-hydroxy-3-phenylpropionitrile
remaining in Toyopearl SuperQ 650M ion exchange eluted fractions.Each fraction was reacted in duplicate with benzonitrile ( ) for 10 min, and benzamide ( ) and 3-
hydroxy-3-phenylpropionitrile ( ) for 30 min, at 30 °C with shaking (200 rev./min). The amount of
substrate remaining was analysed by HPLC.
Chapter 3 87

Figure 53: 10% SDS-PAGE of Toyopearl SuperQ 650M ion exchange eluted fractions.Lane 1 corresponds to fraction 16; lane 2, fraction 17 and lane 3, fraction 18. Protein size markers
had relative molecular mass 250, 150 and 100 (labels excluded for clarity), 75, 50, 37 and 25.
Unknowns 1-6 correspond to sizes 84, 56, 47, 36, 32 and 21, respectively. Samples of eluting gel
exclusion fractions were prepared by adding 80 µl of each fraction to 20 µl sample loading buffer,
and heating at 95 °C for 5 min prior to loading 20 µl of each sample. The gel was run at 150 volts
using a BioRad mini Protean system.
Ion exchange was repeated in an attempt to further separate the activities noted in eluted
fractions. The number of fractions collected over the salt gradient was increased to 49
(Figure 54). Again, the unbound protein in the flow through contained no activity against
any of the substrates tested. The activity profile and elution profile was significantly
altered when the fraction number was increased and fraction volume decreased in the
second ion exchange experiment, showing better protein peak separation and narrower
activity elution profiles against benzonitrile and 3-hydroxy-3-phenylpropionitrile. Amidase
activity was, however, not detected in any fractions from the second ion exchange
experiment.
Chapter 3
1 2 3Mr
755037
2520
12345
6
88

0.0
0.2
0.4
0.6
0.8
1.0
1.2
1.4
1.6
0 5 10 15 20 25 30 35 40 45 50
Fraction Number
Abs
orba
nce
at 2
80 n
m
050100150200250300350400450500
NaC
l Con
cent
ratio
n (m
M)
Figure 54: Toyopearl Super-Q 650M ion exchange chromatography of supernatant
from Rhodococcus rhodochrous eluted with a 500 mM NaCl gradient.The column was equilibrated using 20 mM Tris buffer, pH 8. Supernatant from Rhodococcus
rhodochrous was buffer exchanged into 20 mM Tris buffer, pH 8, and 4 ml of a 10 mg/ml sample
loaded onto the column. Unbound proteins were allowed to elute prior to elution of bound proteins
using a 500 mM NaCl gradient over 42 ml. The fraction A280 was monitored.
Benzamide was formed from benzonitrile in fractions 18 and 19 (45 - 60 mM NaCl), and
in fractions 22 to 28 (103 – 190 mM NaCl). All benzonitrile was converted to benzamide
in fractions 23 to 25 (Figure 55). The amount of 3-hydroxy-3-phenylpropionitrile
remaining in ion exchange fractions and its conversion to product is also shown in Figure
55. Fractions 23 to 27 (118 - 177 mM NaCl) converted 3-hydroxy-3-phenylpropionitrile to
product, with fraction 24 converting it all to product.
The activity profiles were similar against both substrates, except that all 3-hydroxy-3-
phenylpropionitrile was converted to product in fraction 24 only, whilst all benzonitrile
was converted to benzamide in fractions 23, 24 and 25 (Figure 55). Also, trace activity
against benzonitrile (forming benzamide only) is noted in fractions 18 and 19 while no
activity against 3-hydroxy-3-phenylpropionitrile is noted in these fractions. Fractions 18
and 19 may contain a substrate-specific nitrile hydratase with low activity against
benzonitrile whilst fractions 23 to 26 contain a nitrile hydratase with broad substrate
specificity.
Chapter 3 89

0123456789
10
12 14 16 18 20 22 24 26 28 30 32
Fraction Number
Am
ount
( µm
ol)
Figure 55: Amount of benzamide formed from benzonitrile, and conversion of 3-
hydroxy-3-phenylpropionitrile in Toyopearl SuperQ 650M ion exchange
eluted fractions.Benzonitrile ( ) was reacted in duplicate with each fraction for 10 minutes at 30 °C with shaking
(200 rev./min) and the amount of substrate remaining and benzamide ( ) produced analysed by
HPLC. 3-Hydroxy-3-phenylpropionitrile ( ) was reacted in duplicate with each fraction for 30
minutes at 30 °C with shaking (200 rev./min) and the amount of substrate remaining and product
produced ( ) analysed by HPLC.
Chapter 3 90

Chapter 4
4 Discussion
The use of biocatalysts presents advantages for the synthetic chemist. These include a more
ecofriendly approach to enzymatic conversions, with milder, cleaner chemistry, and the
synthesis of products without excessive production of waste or unwanted by-products. A
major problem in the development of a specific biotransformation reaction is finding a
suitable biocatalyst. Unlike the common commercial enzymes, such as proteases, lipases
and amylases for example, the study and application of nitrile hydrolysing enzymes is still
at an early stage. When the availability of commercial enzyme preparations is scarce,
exploring the use of a previously uncharacterised biocatalyst from a microbe has many
advantages. Once the activity of interest is identified through the screening of organisms in
a culture collection, the organism biomass can be isolated and bulked through enrichment
culturing. A strain of Rhodococcus rhodochrous (ATCC BAA-870) was identified as a
nitrile-metabolising organism, and its growth, nitrile substrate profile, and enzyme systems
subsequently investigated.
4.1 Characteristics of the chosen biocatalyst, Rhodococcus
rhodochrous
The Rhodococcus genus falls under the Nocardioform family. The rhodochrous species is
so named due its rose-coloured appearance (Gr. n. rhodon the rose; Gr. n. chrous; L. adj.
rhodochrous rose-coloured) and is easily identifiable. Most are isolated from soil, and are
therefore readily obtainable from natural sources. Bergey’s Manual of Systematic
Bacteriology confirmed that Rhodococcus rhodochrous forms orange to red rough colonies
on media such as glucose yeast extract agar, and that the life-cycle growth of Rhodococcus
rhodochrous follows an elementary branching-rod-coccus morphogenetic sequence. The
gram-positive organism is a practical, robust and easily cultured organism.
Rhodococcus rhodochrous ATCC BAA-870 was found to be a suitable organism for
metabolism of selective nitriles. The nitrile activity of the organism could be easily
induced using defined media and the activity of interest was extracellularly expressed,
Chapter 4 91

eliminating the need for complicated recovery of enzyme. Although the cell doubling time
of the organism in defined minimal media was at least 30 hours, induction of activity was
easily achieved through addition of nitrile to the culturing media. Nitrilases from
Rhodococcus have been known to be strongly induced by the addition of nitrile to the
medium [109]. For example, the nitrilases of Rhodococcus rhodochrous K22 and
Rhodococcus rhodochrous J1 can be induced by addition of isovaleronitrile to the medium
[4, 115], with the latter induced nitrilase forming up to 35% of the total soluble protein
[24]. The organism can be stored refrigerated on solid medium agar for many weeks
without losing viability, and culturing of the organism by addition of a nitrile such as
benzonitrile enables minimum use of antibiotics in the medium since the nitrile is toxic to
many other bacterial strains. The cell disruption study showed that cell-free extract
preparation from the organism is quick and simple. The Rhodococcus rhodochrous used in
this study has presented interesting activity. Its ability to transform benzonitrile, and the β-
hydroxynitrile, 3-hydroxy-3-phenylpropionitrile, makes it a particularly worthwhile subject
for a potential commercial biocatalyst.
It is generally reported that nitrilases predominantly hydrolyse aromatic nitriles, whereas
nitrile hydratase/amidase systems mainly have a preference for aliphatic nitriles [62, 68].
Nitrilases that utilize benzonitrile as a preferred substrate have, for example, been isolated
from Nocardia sp. NCIB 11215, NCIB 11216, Fusarium solani and Arthrobacter sp., but
only in small amounts since the enzymes were labile [115]. Benzonitrile was used in all the
tests of activity performed on the organism in this study due to its preference and so-called
adaptation to utilizing benzonitrile as a substrate. The enzyme/s suspected of being
responsible for the metabolism of the aforementioned aromatic nitriles in Rhodococcus
rhodochrous ATCC BAA-870 was a nitrile hydratase with aromatic nitrile specificity.
4.2 Towards Establishing an Activity Assay for Nitrile Hydratase
Enzymatic transformations are pivotal to biocatalysis and the move toward “greener”
chemistry, whether in drug design or synthesis of commodity chemicals. However, the
success of any development of an enzymatic transformation, enzyme discovery and/or
enzyme engineering will depend mostly on the assay used to measure the activity of
interest. Enzyme activity profiling may be used as a tool for identification and
Chapter 4 92

classification of the activity of interest, but assay development plays a crucial role in taking
an enzyme from the discovery phase, to one in which the enzyme is a viable commercial
protein technology. There was a need for establishing a suitable and reliable assay for
measuring nitrilase and/or nitrile hydratase activity in the organism studied herein. At first,
an effort was made to find a qualitative assay that would allow quick and easy
identification of nitrile-metabolising activity. Hence, a colorimetric assay method using
pH-based colour changes was attempted.
Other researchers have determined the rate of nitrile hydrolysis for the isolates
Pseudomonas putida, Microbacterium paraoxydans and Microbacterium liquefaciens by
measurement using a pH-sensitive indicator-based colorimetric assay [81]. The faster
reaction rate of Pseudomonas putida was followed by a quicker colour turn from green to
yellow than the other organisms, but was confirmed by monitoring the percentage product
conversion by HPLC. The colorimetric assay used in the present study was based on that
developed by Banerjee et al. (2003) [116].
Bromothymol blue was chosen as the pH indicator since its pKa (7.0) is close to that of
phosphate buffer. According to Kaul et al. (2004) [81] an appropriately matched
indicator/buffer pair is required for accurate measurement of dehalogenase activity.
Bromothymol blue is most sensitive to pH changes between pH 6.0 and 7.6, and changes
from blue/green to yellow with increasing proton concentration generated by the enzyme
activity. The BTB concentration in the assay was adjusted in order to increase the
sensitivity while maximise the observable colour change. A colour change from blue/green
to yellow was visible using both 0.05% and 0.01% (v/v) in solution (in cuvettes). However,
the lower concentration was optimal since the colour change was more noticeable. This
was also true for the colour change observed around agar wells in which reaction took
place. Drawbacks to this assay include low sensitivity and poor differentiation between the
reaction mix original colour (blue/green) and positive colour change (yellow). At the lower
indicator concentration where colour change is more noticeable, the colour differentiation
is poor. High concentrations of purified enzyme were required for a positive colour change
suggesting a colorimetric assay of this nature is only selective for either potent or
concentrated enzyme. Colour change was not noted when Rhodococcus rhodochrous cells
were used in the reaction mix, although this culture previously tested positive for nitrilase
activity. The organism itself may have its own buffering capacity which masks any colour
Chapter 4 93
change produced by the enzyme. It was also not established whether the kinetic parameters
of the enzyme changed upon changing pH, and therefore this assay may only be used as a
qualitative indication of acid-forming activity. Indeed, released ammonia could itself buffer
carboxylic acid formation. The assay did not seem applicable to whole cell reactions.
Phenylglycinonitrile was acidic (pH approximately 3.5) in both buffer concentrations and
therefore not a suitable substrate for this assay. Very hydrophobic nitriles such as
adiponitrile would cause solubility problems in the pH-based indicator assay which relies
on a buffered solution system for measuring activity. Many nitriles are acidic or relatively
hydrophobic in nature and would therefore also be excluded from this assay. Even
concentrated commercial enzyme samples separated on non-denaturing PAGE gels could
not be detected using colour change, and therefore the assay could not be applied to
detecting activity using an overlay method.
After unsuccessful attempts at establishing colorimetric activity assays for the enzymes of
interest (based on electrophoretic separation of the enzymes and changes in pH on
reaction), a more sensitive fluorimetric assay was tested. The fluorescence-based OPA
assay was compared to the HPLC method previously used to detect activity. Fluorimetric
methods of measuring enzyme activity are generally far more sensitive than
spectrophotometric methods.
The reported nitrilase assay in which the release of ammonia reacted with o-
phthaldialdehyde and 2-mercaptoethanol forms a fluorescent isoindole derivative is a
potentially simple and commercially viable assay [82]. In contrast to the HPLC assay
method, the fluorimetric method proved to be unreliable or unreproducible. The linearity of
the ammonia standard curve obtained in this study did not compare with that reported by
the authors. Activity identification on non-denaturing PAGE gels was tested using the
fluorimetric method, but also proved unsuccessful. To be detected, the signal generated
requires high concentrations of substrate (100 mM) which implies that only highly
concentrated enzyme preparations that are stable in the presence of high concentrations of
substrate can be measured using this assay.
Although the assay was originally used testing whole cells of Rhodococcus rhodochrous by
Banerjee et al. 2003 [116], using ammonia release by whole cell suspensions of an
Chapter 4 94

organism to determine activity is also non-specific since ammonia-forming activity may be
due to other metabolic activities such as protein turnover. Hence, the origin of ammonia in
whole cell suspensions is not defined using this method, and activity measured may be
over or under estimated.
4.3 High Performance Liquid Chromatography and Mass
Spectrometry
Since HPLC was previously used for measuring nitrilase activity qualitatively and is a
well-documented method in nitrilase literature, the development of the method as a reliable
and reproducible procedure was undertaken. The commercial nitrilases tested showed
different substrate specificity and the relative activities could be accurately and reliably
quantified by HPLC. Another advantage of the HPLC method used in the present study is
that disappearance of nitrile substrate and appearance of product can be measured
simultaneously, providing an internal molar balance with which to ascertain the validity of
the results.
Interestingly, the commercial nitrilase from Rhodococcus rhodochrous showed only slight
activity against benzonitrile, while the NIT-1005 converted all benzonitrile to benzoic acid.
Even though it is widely suggested that nitrilases generally have a preference for aromatic
substrates, there is large variability amongst nitrilases from different sources [106, 108].
The development of the HPLC method for assaying nitrile converting activity included
analysis of nitrile standards, commercial nitrilase reactions, and construction of standard
curves of concentration versus absorbance, retention area, and amount for nitrile standards
(including benzonitrile, benzamide, benzoic acid, hydrocinnamonitrile, 3-hydroxy-3-
phenylpropionitrile and 3-hydroxy-3-phenylpropionic acid). Benzonitrile is less polar than
its hydrolytic products, benzoic acid and benzamide, with the latter eluting earliest.
Separation of the nitrile and its corresponding amide and acid is effectively achieved using
the isocratic elution method described, and the three compounds have roughly one minute
time separation in their respective elutions. Benzonitrile and its products can be easily
identified by HPLC owing to their predictable elution times and differing lambda
maximum absorbance values. The compounds with longer chains, namely
Chapter 4 95
hydrocinnamonitrile, 3-hydroxy-3-phenylpropionitrile and 3-hydroxy-3-phenylpropionic
acid, have lambda maximum values closer to each other and are much lower (closer to 200
nm) than benzonitrile and its corresponding acid and amide. Although it is generally not
considered reliable to measure compounds in the 200 nm range by HPLC (since many
HPLC solvents display absorbance at or near this wavelength), control samples containing
reaction buffer and the acidic stop reagent/ elution solvent did not absorb in this region.
Standard curves of the six compounds showed that all were reliably measured in the
concentration range zero to ten millimolar, and all displayed linear dependence curves
(with R2 values close to one) of concentration versus absorbance, retention area, and
amount. All the compounds, except benzamide, had stable absorbance maxima values in
the concentration range tested. At concentrations higher than 7 mM, the absorbance
maximum of benzamide was seen to drop slightly, and remained at the lowered value up to
10 mM. The current method used for measuring activity against nitriles or amides,
however, uses substrates at a concentration of 5 mM which is within the accurate region
for benzamide. In cases where other substrates are tested for activity, the concentration
range in which absorbance, retention area and amount are linear should be measured.
Since it was shown that HPLC could be used to measure the six compounds (Table 5) and
their conversion accurately in a wide concentration range, the method was further extended
to investigate the relationship between activity and time for reactions against benzonitrile,
benzamide and 3-hydroxy-3-phenylpropionitrile.
Mass spectral analysis of the above-mentioned 6 nitrile standards was done to confirm the
structures, but more importantly to elucidate the subtle differences between 3-hydroxy-3-
phenylpropionitrile and its corresponding amide and acid. Due to the relatively lower
absorbance lambda maximum values of the arylaliphatic compounds, HPLC may not be
the best method of analysis for these compounds. Although their respective retention times
differ (4.15 minutes for the nitrile, 3.4 minutes for the amide and 3.8 minutes for the acid),
the wavelength maxima of the nitrile and acid are identical (206.5 nm) and the amide
product very similar (200.7 nm). This would not normally pose a problem since the data
obtained for each have almost negligible standard deviations, but the accuracy of following
substances close to 200 nm is not ideal when analysed by HPLC.
Chapter 4 96
Nitriles generally give poor mass spectral data. The smaller nitriles are not well suited to
mass spectral analysis and some are too volatile to be measured with certainty.
Benzonitrile, benzamide and benzoic acid are problematic in that regard, and even higher
sample concentrations did not improve the spectra. The larger nitriles with longer, aliphatic
chains, and the products thereof, however, gave better spectra and results comparable with
those from a database and the Millenium internal spectra library. 3-Hydroxy-3-
phenylpropionitrile and 3-hydroxy-3-phenylpropionic acid could be matched with
approximately 97% and 96% certainty to internal standards, and mass spectral analysis is
therefore a good method for these types of compounds. Hydrocinnamonitrile, although
similar in structure to 3-hydroxy-3-phenylpropionitrile did not give good mass spectral
results and could not be matched to internal standards.
Mass spectral analysis could not be used to confirm the structure of the corresponding
amide produced from 3-hydroxy-3-phenylpropionitrile. However, the intermediate product
produced by Rhodococcus rhodochrous ATCC BAA-870 when 3-hydroxy-3-
phenylpropionitrile is converted to 3-hydroxy-3-phenylpropionic acid has a stable retention
time, and elutes earlier than the nitrile and acid (as expected, and similar to benzonitrile
and its corresponding amide and acid). Gas chromatography may be a more suitable
method for analysis of the arylaliphatic and volatile nitriles and the corresponding amide
and acid thereof.
4.3.1 Different Buffer Types
By HPLC, reactions against benzonitrile, 3-hydroxy-3-phenylpropionitrile and
hydrocinnamonitrile were analysed in ten different buffer types to optimise buffer
conditions and test the efficacy of the buffer system used for chromatofocusing. Activity
observed was qualitative only and the differences observed in the buffers were
comparatively measured.
EDTA did not affect the activity against benzonitrile whilst DTT on its own appeared to
have a slightly negative effect on activity. The nitrilase activity of Rhodococcus
rhodochrous J1 was not affected by chelating agents such as EDTA or azide, indicating it
lacked a metal-ion requirement [115], and was also unaffected by Fe2+ and Mn2+ that are
inhibitory toward the Nocardia sp. NCIB 11216 [117]. The activity of nitrile hydratase
Chapter 4 97

from Bacillus pallidus Dac521 was not affected by EDTA [103]. However, it is suggested
that chelating data can be misleading since Rhodococcus rhodochrous J1 nitrile hydratase
reportedly contains 11 atoms of cobalt per mol of active enzyme and its activity is
unaffected when dialysed with EDTA for 1 week [113], whereas nitrile hydratase of
Myrothecium verrucaria which contains 4 mol of zinc per mol of enzyme lost 90% of its
activity after dialysis with EDTA for 15 minutes [18].
DTT is included in the buffer as a reducing agent to counteract oxidation of the enzyme.
DTT had no negative effect on nitrile hydratase activity in Rhodococcus rhodochrous
ATCC BAA-870, suggesting that the cysteine residues are maintained in a reduced state at
the active site with the concentrations tested. The Rhodococcus rhodochrous J1 nitrilase is
inactivated by some thiol reagents [115]. The activity of purified J1 nitrilase in the
presence of dithiothreitol was six times higher than activity measured without the presence
of reductant [115], and DTT was the most effective in restoring activity of nitrilase
inhibited by other thiol reagents.
Reactions against hydrocinnamonitrile in different buffer types indicated buffers which
caused anomalous effects when measuring substrate levels by HPLC since it was not
utilised by the organism. A reduction in the measurable levels of hydrocinnamonitrile at pH
4 was presumably a pH-induced effect, while DTT caused the measurable levels of the
substrate to almost completely disappear. HPLC is therefore not suited to measurement of
reactions in all buffer types, and is particularly not suited to measurement in buffers that
display a wavelength maximum at or near that of the compound being measured (such as
imidazole which has the same absorbance maximum as hydrocinnamonitrile and 3-
hydroxy-3-phenylpropionitrile).
4.3.2 pH Profiles
The effect of pH on activity (pH 4 to 10) was tested using benzonitrile and
hydrocinnamonitrile. Again, no activity was seen against hydrocinnamonitrile at any pH,
confirming previous results that showed no product formation from this substrate. The
activity maximum against benzonitrile was broad between pH 6 and 7, with the activity
gradually decreasing at higher pH but more rapidly at lower pH. The Rhodococcus
rhodochrous J1 pH profile was examined using benzonitrile as substrate [115], and showed
Chapter 4 98

maximum activity at pH approximately 7.5. The J1 nitrilase had a narrow pH range
compared to the broad nitrilase pH ranges found in Nocardia NCIB 11215 nitrile hydratase
[118] and Fusarium [119].
Nitrile hydratase from Bacillus pallidus Dac521 had optimum activity between pH 7 and
7.5 and retained greater than 50% activity between pH 6.2 and 8.7 [103]. Its activity
rapidly decreased as pH was reduced from the optimum, and at pH 5 it still retained
activity although it was 21-fold less than at pH 7. The pH profile of nitrile hydratase from
Bacillus pallidus Dac521 is similar to the one tested in this study, and similar to the pH
dependence of mesophilic enzymes which have pH optima in the pH 7 – 7.5 range [103,
120]. It is not known whether the rapid loss of activity at reduced pH is due to subunit
dissociation, denaturation, or a change in ionization of critical active site residues. A
change in ionization states is probable since catalytic thiol residues generally have a pKa of
approximately 4.6, and in nitrile hydratase may play a role in the catalytic mechanism of
the enzyme. However, according to Huang et al. (1997) [34], the thiolate ligands of
Rhodococcus sp. R312 nitrile hydratase coordinate the FeIII cofactor rather than participate
in the catalytic process itself. All known mesophilic nitrile hydratases contain a catalytic
metal ion cofactor. Rhodococcus rhodochrous N771 [121] and Rhodococcus R312 [122]
nitrile hydratases, for example, contain FeIII chelated by thiolate ligands, Rhodococcus
rhodochrous J1 nitrile hydratase contains non-corrinoid cobalt [123] and Myrothecium
verrucaria nitrile hydratase contains zinc [18].
It is possible that the enzymes may precipitate out at their isoelectric point, and hence their
activity may not be accurately quantified even though the enzyme is viable. Protein
solubility is affected by pH and is minimal at its isoelectric point. Most proteins have a pI
in the acidic range. The broad pH range in which Rhodococcus rhodochrous ATCC BAA-
870 activity can be measured suggests flexible assaying procedures may be possible with
this organism, and highlights its use as a potential industrial bioconversion tool.
4.3.3 Time Course Activity Study
The activity of interest displayed by the isolated Rhodococcus rhodochrous was explored,
and reaction times were optimised to ensure sampling for HPLC was done in the linear
region. The activity of this organism was previously sampled after reaction for two hours
Chapter 4 99
[106]. The linear region of activity against benzonitrile occurs within the first ten minutes
of reaction, and hence the sampling time for this activity has been dramatically reduced.
The benzamide produced from benzonitrile is itself utilised within 60 minutes, and if the
reaction time was extended and sampled after this, it could easily be assumed that benzoic
acid is the only product. Reactions against benzamide only confirmed the activity against
benzamide which was first produced from benzonitrile, and also showed that benzamide is
utilised within 60 minutes of reaction. The linear sampling times when testing activity
against benzamide and 3-hydroxy-3-phenylpropionitrile is now performed in 20 minutes,
again a much reduced reaction time.
The activity against the amide in Rhodococcus rhodochrous ATCC BAA-870 is likely the
rate-limiting step in production of acid from nitrile. The production of acid is rapid and
occurs in under ten minutes, whereas production of amide from this acid occurs over a
much longer time frame. The nitrile hydratase may be an efficient enzyme with high
turnover (relative to the amidase). It is possible that although the two enzymes are co-
transcribed, the amidase may be transcribed at a lower rate than the nitrile hydratase.
However, it is more likely that the two enzymes differ with respect to their kinetics towards
the selected unnatural substrates.
The stoichiometry of nitrile consumption and amide or acid formation from the hydrolysis
of nitrile was examined in reaction mixture containing 50 mM potassium phosphate pH
7.4, 6.2 ± 0.2 µmol benzonitrile, and enzyme in a final reaction volume of 1.5 ml. After the
chosen reaction incubation time, the amounts of benzonitrile, benzamide and benzoic acid
in the reaction mix were determined. The maximum amounts of benzamide and benzoic
acid formed from benzonitrile was 2.2 µmol and 6 µmol respectively. All the benzamide
was converted to benzoic acid. The amount of benzonitrile remaining after the reaction was
run until completion was 2 µmol. The results indicated that the total amount of benzoic
acid and benzamide formed from benzonitrile was approximately 6.2 µmol, and product
formation is stoichiometric with the consumption of benzonitrile. The possibility of the
reverse reaction was investigated (data not shown) but the formation of amide or nitrile
from benzoic acid was not detected, even when reacted for over 2 hours. Utilisation of
benzamide shows that the amide is an intermediate in the nitrile hydrolysis pathway of the
nitrile-metabolising enzymes involved, and hence it is suspected that the nitrile hydrolyis is
Chapter 4 100

due to a nitrile hydratase and amidase combination rather than a nitrilase. During enzyme
kinetic studies of the J1 nitrilase, it was shown that benzamide was not formed from
benzonitrile, and benzoic acid was formed stoichiometrically with the consumption of
nitrile [115].The major product of a ricinine nitrilase purified from a pseudomonad was the
corresponding acid, but approximately 9% of the substrate was converted to the amide
[124].
Conversion of 3-hydroxy-3-phenylpropionitrile to product was linear over 20 minutes
under the conditions used. Elution of nitrile hydratase activity for benzonitrile in
chromatography experiments was seen to always coincide with activity against 3-hydroxy-
3-phenylpropionitrile, and therefore the reaction kinetics of nitrile hydratase against
benzonitrile and 3-hydroxy-3-phenylpropionitrile is different. Benzonitrile is converted to
benzamide more rapidly than the conversion of the arylapliphatic nitrile 3-hydroxy-3-
phenylpropionitrile, and therefore the nitrile hydratase in Rhodococcus rhodochrous ATCC
BAA-870 has a preference for the small aromatic nitrile.
Although most biocatalysts are inherently labile, the proposed nitrile hydratase and
amidase enzymes responsible for nitrile metabolism in the organism studied, are
reasonably stable. When reacted for 2 hours at 30 degrees, all substrate is converted to
product, and since no starting material remains, it can be safely assumed that the
biocatalyst itself does not lose activity within the given reaction time frame. In addition,
the relatively wide pH profiles and ability to convert substrate in the presence of methanol
support the notion that the catalyst stability is high when activity is derived from cell
extracts.
4.3.4 Protein Concentration Effects
The previous assay tested required at least 1 mg/ml of purified commercial enzyme
preparation to detect activity (the pH-based colorimetric assay) and the OPA-based
fluorimetric assay showed no measurable activity even at this concentration. The levels of
protein required to measure activity by HPLC are, however, considerably lower. The
activity of interest was part of a total protein cell-free extract and not purified enzyme.
Benzonitrile conversion to benzoic acid (via benzamide) is evident at concentrations as low
as 0.2 mg/ml protein when reacted for 20 minutes, and formation of benzoic acid was
Chapter 4 101

linear with respect to concentration. However, since benzamide was not detected and
presumably immediately converted to benzoic acid, the concentration of protein used was
reduced and the reactions were reacted for only ten minutes. Appearance of benzamide
produced from benzonitrile, and its subsequent conversion to benzoic acid can be followed
when the concentration of protein is reduced and reacted for ten minutes. When benzamide
was the substrate, its conversion to benzoic acid occurred at higher concentrations than
when it was first formed from benzonitrile. The level of benzamide dropped at
concentrations higher than 0.4 mg/ml and was completely converted to benzoic acid only
when the concentration reached 0.9 mg/ml. The results once again suggest that the
formation of benzoic acid from benzamide is rate-limiting, while formation of benzamide
from benzonitrile occurs within seconds to minutes. Interestingly, conversion of 3-
hydroxy-3-phenylpropionitrile to product also occurs at protein concentrations lower than
0.29 mg/ml, and all substrate was converted within the given reaction time. Activity
against 3-hydroxy-3-phenylpropionitrile and benzonitrile follow similar trends and
therefore may be due to the same enzyme, or perhaps two different enzymes with great
affinity for both substrates (e.g. isozymes). The amidase activity, however, has clearly
different reaction characteristics to the activity attributed to nitrile hydratase. Rhodococcus
rhodochrous ATCC BAA-870 was previously selected on 3-hydroxy-3-phenylpropionitrile
and the organism therefore has a natural affinity for the substrate.
Reactions against both benzonitrile and benzamide are linear up to 1.93 mg total protein
concentration per reaction (1.5 ml total volume). This effectively will reduce the
concentration of enzyme used for these reactions since they can be measured at
concentrations lower than those previously used. Also, since this is total protein, and not
necessarily purified, the levels of purified protein needed for reaction was possibly very
low. It was highly probable that these enzymes of interest were either potent with high
activity per mg protein, or that a large proportion of the protein was induced enzyme. It is
suggested that the nitrile-converting enzymes in Rhodococcus rhodochrous ATCC BAA-
870 are more likely very active against the substrates tested, rather than concentrated.
Chapter 4 102

4.4 Column Chromatography
4.4.1 Chromatofocusing
Prior to attempting chromatofocusing of the cell-free extract of the Rhodococcus
rhodochrous biocatalyst, the pI profiles of other organisms were evaluated. Ampholyte
electrofocusing of Rhodococcus rhodochrous J1 indicated the nitrilase had a pI of 5.6,
which was similar to a calculated pI derived from a Klebsiella bromoxynil-specific enzyme
nucleotide sequence [115]. Bacillus pallidus Dac521 has two nitrile hydratase isoforms
with pIs of 4.7 and 5.48. Generally, mesophilic nitrile hydratases have pI values ranging
from 3.6 [51] to 5.7 [125]. Within the nitrilase/nitrile hydratase enzyme classes, it is
evident that the enzyme properties differ greatly according to species and that isoforms of
the enzymes with differing properties exist. Although measured pI values for these
enzymes differ, it can generally be said that they fall within the acidic range. The
theoretical pI for all known Rhodococcal and Pseudomonal nitrile hydratases from the
Swiss-Prot and TrEMBL database was calculated based on their known sequences and
compared (Appendix 5.3). Rhodococcal theoretical pI values ranged from 4.87 to 5.3 and
all were acidic. The theoretical pI for the cobalt-containing high-molecular weight NHase
(P21219 and P21220) was calculated using the ProtParam tool at the Expasy Proteomics
Server [126]. Based on the primary sequence of the enzyme, the theoretical pI for the
heterodimeric enzyme was calculated to be 5.3 (see Table in Appendix 5.3). A pH 7 to 4
elution gradient was therefore proposed to be suitable for the attempt of this technique.
The elution profile obtained showed the majority of proteins contained in the soluble
protein fraction of Rhodococcus rhodochrous eluted at pH 4 and less. Unfortunately, while
the protein mix initially applied to the column was active against nitriles, none of the
fractions tested positive for activity and hence no detectable activity could be traced to any
fractions. Although Polybuffer does not reportedly interfere with many protein assays,
components of Polybuffers adhere to certain proteins thereby affecting their assaying
methods. For example, Polybuffer forms a complex with copper ions and therefore
interferes with the Lowry method for measuring protein concentration. It may be possible
that the ampholytes in Polybuffer inhibit nitrile-hydrolysing enzyme activity, either by
binding at the enzyme active site, or by blocking the formation of active enzyme
multimers.
Chapter 4 103

The pH of the post fractionation assay mixture showed that the pH of the reaction mix was
not responsible for the lack of detectable activity. The lack of measurable activity may
possibly be due to a dilution problem. It has been previously reported that nitrile
hydratases are labile to dilution, and can be stabilised by addition of organic acids such as
valerate or butyrate [120]. When dialysed against buffer that did not contain organic acid,
the iron-containing nitrile hydratase from Rhodococcus sp. R312 released iron molecules
essential to catalytic activity [29]. The same has not been reported with cobalt-containing
nitrile hydratase.
Another possible problem was that the buffer system used with chromatofocusing may not
have been compatible with the current method of HPLC analysis. The amount of benzoic
acid formed from benzonitrile when reacted with Polybuffer 74 containing 5 mM DTT was
shown to be different at different pH’s even though reaction conditions were identical.
Figure 34 showed more benzoic acid produced at pH 6 than at pH 7.4, with the least
amount produced at pH 4. Since activity against the same substrate may be different at
different pH’s, fractions eluting from a chromatofocusing column should be brought to the
same pH before adding it to the reaction mixture. This could, however, cause further
dilution problems which may also affect the ability to quantitatively detect activity.
Benzoic acid formation from benzonitrile could be measured when reacted in imidazole
buffer and therefore the chromatofocusing buffer should not have affected measurable
activity.
The loss of orange colour from supernatant applied to the chromatofocusing column
(colour which was associated with nitrile-converting activity in both gel exclusion- and ion
exchange chromatography-eluted fractions) may indicate a reason for loss of detectable
activity within those fractions. Since activity could be associated with the colour, loss of
colour may likewise indicate a loss of activity, and may prove that metal chelation at the
enzyme active site was interfered with by the polybuffer ampholytes, either directly (by
binding to the active site metal) or through interaction with the sulphur containing residues
(including the modified oxidised ones). Nitrile hydratase has two cysteine residues and
three histidine residues involved in catalysis at the active site. Chromatofocusing has not
been done by anyone else on this class of enzymes to the best of our knowledge.
Chapter 4 104

Chromatofocusing has given insight as to the pI range of the enzymes of interest in the
organism, but may not necessarily be used in conjunction with the current HPLC method
of measuring or screening for activity. To overcome the problem of loss of activity with
separation using chromatofocusing, traditional methods of chromatographic separation of
enzymes were applied.
4.4.2 Gel Exclusion
Most NHase, amidase and nitrilase enzymes are high molecular weight, multimeric
assemblies, and many of these form multimers in the presence of substrate only. Nocardia
enzymes [117, 118] and Fusarium enzyme [119] form active high-molecular-mass
aggregates. This could be the case for the amidase activity seen in this organism.
Unexpectedly, although the sample applied to the column showed amidase activity, it was
absent in the collected fractions. The amidase in this organism may be made up of α- and
β-subunits greatly differing sizes, and hence may have eluted in different fractions.
Although it was shown using protein concentration studies that the enzyme concentration
required for benzamide hydrolysis was higher than that required for benzonitrile, the
reactions were reacted for at least 2 hours, during which measurable levels of product
should have been detected by HPLC.
Since the fractions containing activity of interest eluted near the column void volume, it
was estimated that the enzymes responsible for the activity are high molecular weight
multimeric enzymes. This is not uncommon for nitrilases, nitrile hydratases or amidases. A
nitrilase from Rhodococcus sp. NCIB 11216 forms a benzonitrile-induced 560-kDa
dodecamer from association of a 47-kDa monomer, and this is accelerated by increased
temperature and enzyme concentration [117, 127]. Similarly, Rhodococcus ATCC 39484
nitrilase has a substrate-induced aggregation of 40-kDa subunits to form a 560-kDa
complex [26]. An enantiomeric homooctomeric amidase purified from Agrobacterium
tumefaciens strain d3 was estimated to be 490 kDa and composed of 63 kDa subunits
[128].
The subunit molecular weights estimated using SDS-PAGE show that the putative nitrile
and amide hydrolysing enzymes may be made up of 21, 48, 56, or 84 kDa subunits. The 48
kDa band density was double that of the smaller bands, indicating that subunits of that size
Chapter 4 105

are in the majority. The 56 and 84 kDa protein bands were of similar density and therefore
may represent the subunits of a two-subunit heteromer. NHases generally contain two
subunits (α and β), with both subunits having a molecular weight of approximately 23
kDa, and two αβ heterodimers associate to form the (αβ)2 tetramer. Mesophilic nitrile
hydratases have native molecular masses ranging from 54 kDa (Pseudomonas putida
[129]) to 530 kDa (Rhodococcus rhodochrous J1 [113]) and are usually composed of
distinct α and β subunits which are typically between 22 and 29 kDa, respectively [57,
130]. The cyanide dihydratase of Bacillus pumilus is a multimer of 18 subunits with a total
molecular mass of 672 kDa [131]. The α subunit is, by convention, the smaller subunit in
nitrile hydratase enzymes. It is possible that the same enzyme may be a mixed molecular
weight species such as the high and low molecular mass nitrile hydratase from
Rhodococcus rhodochrous J1. Rhodococcus rhodochrous J1 produces two forms of nitrile
hydratase, a high-molecular mass enzyme of approximately 520 kDa and a low-molecular
mass enzyme of approximately 130 kDa, depending on the inducer added to the culturing
media. Both enzymes are composed of α and β subunits, with the high-molecular mass
enzyme made up of nine or ten subunits, and the smaller enzyme of two of each subunit. In
Rhodococcus rhodochrous J1, the expression of both high- and low-molecular mass nitrile
hydratases is regulated at the transcriptional level by the levels of reaction product (amide)
present [132].
Gel exclusion chromatography has shown that the activity of interest in Rhodococcus
rhodochrous ATCC BAA-870 is a result of high-molecular weight protein, and possibly is
higher than the previously reported values for nitrile hydratase. Many amidases are high
molecular weight enzymes. For example, Rhodococcus erythropolis MP50 is 480 kDa [50]
and Agrobacterium tumefaciens d3 is a 490 kDa protein made up of 63 kDa subunits [128].
The notion that nitrile hydratase and amidase in Rhodococcus rhodochrous ATCC BAA-
870 are both made of relatively big subunits is therefore supported by the previously
published values. If the α- and β-subunits of nitrile hydratase Rhodococcus rhodochrous
ATCC BAA-870 were roughly 21-26 kDa in size, it may be possible that tightly associated
αβ units were responsible for the 48 kDa size, and α2β2 units for the 84 kDa size noted in
SDS-PAGE gels. This would be true only if the reducing conditions in SDS-PAGE were
not strong enough to ensure complete separation of the subunits making up the proposed
high molecular weight nitrile hydratase. The amidase subunits would then be due to the 56
Chapter 4 106

kDa band noted, which is the most commonly reported subunit size for amidase enzymes
[128].
The rose colour evident in fraction five adds an interesting point for thought. The colour
can be correlated with high activity, and good cell disruption shows increasing colour
intensity. Not only is this colour a useful marker, but it is associated with NHase activity
and is an interesting route for further investigation. It is possible that, although not
confirmed, the colour may be due to cobalt or iron ions contained within the active site of
nitrile hydratase.
4.4.3 Ion Exchange
It is suggested that the benzonitrile degradation activity detected in fractions was only due
to a nitrile hydratase and amidase, and not a nitrilase as was previously thought. All
purification procedures were carried out at room temperature, indicating the thermal
stability of the enzymes was reasonably high. Most mesophilic nitrile degrading enzymes
(such as Nocardia sp. 11216 nitrilase [117] and Pseudomonas chlororaphis nitrile
hydratase [120]) are purified at temperatures below 4 °C due to their thermal instabilities.
Although previously postulated on the basis of gel exclusion studies that the enzyme, when
induced, may form a large proportion of the total protein, it is seen in the elution profile
that the activity peaks do not necessarily correspond with elution peaks in which protein is
concentrated. Therefore, the assumption that the activity of interest is due to a potent,
rather than concentrated enzyme, is further supported.
Gel exclusion chromatography indicated that nitrile hydratase activity eluted at high
molecular weight which constituted the majority of eluting proteins. It could be said that a
large proportion of the soluble protein fraction of Rhodococcus rhodochrous ATCC BAA-
870 contains nitrile hydratase and that the organism overproduces the enzyme. The
relatively slow reaction kinetics against 3-hydroxy-3-phenylpropionitrile would support
this. However, elution of proteins using ion exchange chromatography indicated that
although the activity eluted within a protein peak, it did not constitute the majority of
eluted proteins. Nitrile hydratase is therefore produced in the organism in fair amounts, but
is more likely a potent enzyme.
Chapter 4 107

Ion exchange fractions with activity also had a rose-coloured appearance. The absorbance
spectrum obtained confirmed the difference in absorbance between the coloured and clear
fractions, with the coloured fraction showing a broad absorbance shoulder between 300 to
500 nm. The colouring of active fractions is likely enzyme-associated, and may be due to
the type of ion associated at the active site. Pseudomonas [120] and Brevibacterium [122]
nitrile hydratases are composed of two subunits (α and β) containing tightly bound iron
[38], and exhibit broad absorptions in the visible range with an absorption maximum at
720 nm and a broad shoulder at 300 – 500 nm. A concentrated solution of highly purified
cobalt-containing nitrile hydratase from Rhodococcus rhodochrous J1 exhibited a broad
absorption spectrum in the visible range, with an absorption maximum at approximately
410 nm [113]. With one cobalt atom per α-subunit, a high molecular weight nitrile
hydratase concentrated in one or two fractions could very likely exhibit colour.
Separation of nitrile hydratase and amidase activities suggests the nitrile hydratase and
amidase enzymes in Rhodococcus rhodochrous can be purified using ion exchange
chromatography alone. In conjunction with gel exclusion chromatography, a quick and
simple method of purification for the nitrile-hydrolysing enzymes is possible, and is a vast
improvement from the previously reported laborious eight- and six-step purification
protocols for nitrile hydratase [104, 133]. The isolation of nitrile hydratase and amidase
enzymes from Rhodococcus rhodochrous ATCC BAA-870 to a great degree of purity may
not be necessary provided that no interfering contaminating activity is present. The degree
of purity of commercial enzymes ranges from highly purified to raw protein preparations
depending on the application. A partially purified enzyme preparation is more cost
effective for industrial application and therefore preferred to highly purified enzymes. The
application of the enzyme preparation from Rhodococcus rhodochrous ATCC BAA-870 is
suited to analytical purposes since it is free of stabilizers and preservatives, and is easy to
pipette. It is also easily stored frozen for long periods of time without a loss in activity.
Only benzamide was formed from benzonitrile in ion exchange fractions when the
procedure was optimised, and therefore nitrile hydratase was in those fractions. The
activity against 3-hydroxy-3-phenylpropionitrile in the same fractions supports the findings
that nitrile hydratase converts the β-hydroxy substrate. Amidase activity was lost when
fractions were separated using the shallower salt gradient in ion exchange, and when gel
exclusion fractions were collected over a longer elution. It is suggested that the amidase in
Chapter 4 108

Rhodococcus rhodochrous ATCC BAA-870 either requires some other component of
protein for activity, or is easily disassociated into subunits which eliminates activity.
4.5 General Discussion
Monosubstituted benzonitrile derivatives with hydroxyl groups were suitable substrates for
the enzymes found in Rhodococcus rhodochrous. Hydrocinnamonitrile was not hydrolysed
but 3-hydroxy-3-phenylpropionitrile could be utilised. The Rhodococcus rhodochrous
ATCC BAA-870 enzymes are suited to hydrolysis of the aromatic nitrile, benzonitrile, and
arylaliphatic nitrile, 3-hydroxy-3-phenylpropionitrile. It is postulated that the enzyme’s
nitrile-binding site may have a high affinity for an aromatic ring. It has generally been
accepted that aliphatic-specific nitrile hydratases have low specificity for aromatic nitriles.
However, it is possible that certain nitriles act as high affinity inhibitors rather than
substrates, as suggested by some studies. For example, benzonitrile-induced inhibition of
Bacillus pallidus Dac521 nitrile hydratase activity is irreversible [103], and nitrile
hydratases of Corynebacterium nitrilophilus [134] and Rhodococcus R312 [122] are
inhibited by α-hydroxynitriles and isobutyronitrile respectively. Absence of activity against
certain nitriles may be due to structural gene expression repression or inhibition of
expressed nitrile hydratase activity.
Hydrocinnamonitrile appears to not be utilised/ converted by any enzyme present in
supernatant of Rhodococcus rhodochrous when tested routinely according to the protocol
laid out in the methods section. The bulkiness of the substrate should not be a factor in its
inability to be utilized, since 3-hydroxy-3-phenylpropionitrile was converted even though
it has an extra hydroxyl group in its structure.
Most nitrilases produce only the corresponding acid and ammonia as products. However,
purified nitrilases from Rhodococcus rhodochrous ATCC39484 [26], Pseudomonas
DSM7155 [93] and Fusarium oxysporum f.sp. melonis [135] produce a small amount of
amide product, and therefore have nitrile hydratase activity as well. In these cases the
amount of amide produced is less than 5% of the total product formed. The AtNIT1
enzyme of A. thaliana has high nitrile hydratase activity against some substrates but not
with others. For example, the ratio of amide to acid produced from fumaronitrile was 93:7,
Chapter 4 109
while from crotonitrile it was 1:99 [136]. The nitrilase of Rhodococcus rhodochrous J1
utilises benzamide at a rate of 0.00022% compared to benzonitrile, and therefore has
measurable nitrile hydratase activity [15]. The enzyme mechanism proposed by Kobayashi
et al. (1998) explains the activities mentioned above by proposing two possible routes of
nitrile degradation. The tetrahedral intermediate formed by nucleophilic attack of the nitrile
carbon atom by nitrilase is broken down to the acid in most cases, but can also be released
as an amide. Whether the amide product is a by-product from nitrile hydratase activity, or a
result of premature release of substrate from the enzyme-ligand complex, many organisms
have dual nitrilase and nitrile hydratase/amidase enzyme systems. It is therefore possible
for an organism to have both the nitrilase and nitrile hydratase/amidase enzyme systems,
while only one system is selectively used depending on the conditions of induction and/or
reaction. Nitrilase in Rhodococcus rhodochrous J1, for example, can be selectively induced
using valeronitrile without affecting the expression of nitrile hydratase and amidase, and
vice versa [15].
Although the organism studied herein shows distinct nitrile hydratase/amidase activity as
measured by the conversion of benzonitrile and 3-hydroxy-3-phenylpropionitrile to their
respective amides, the existence of a nitrilase within Rhodococcus rhodochrous ATCC
BAA-870 can not be entirely ruled out. A wider set of reaction substrates, or indeed
different induction substrates, could show the presence of a nitrilase. In general, the ability
of one nitrile-converting organism to selectively use an enzyme set depending on reaction
parameters and/or induction conditions, further lends favour to their versatility as
biocatalysts in industrial applications.
Chapter 4 110

4.6 Conclusion
Enzymes that hydrolyse nitriles have enormous potential as industrial biocatalysts in that
they can provide the common functional groups of amides and carboxylic acids subsequent
to the facile chemical addition of a carbon to a simpler (and cheaper) substrate. Using a
chosen nitrile substrate such as benzonitrile as the sole nitrogen source during simple
enrichment culturing isolates bacterial enzyme systems that are adapted to metabolism of
the substrate of interest. The microorganism which formed the basis of the current study,
Rhodococcus rhodochrous ATCC BAA-870, converted benzonitrile to benzamide and
benzoic acid, and also converted the β-hydroxynitrile, 3-hydroxy-3-phenylpropionitrile to
the corresponding amide and acid. Increasing the concentration of biocatalyst caused faster
conversions, and extending the reaction time allowed complete conversion of all substrate
to product. The mild hydrolysis of the β-hydroxynitrile would be of value as a
biotransformation process since the substrate is prone to elimination reactions in harsh
reaction conditions.
The main objective of a biocatalytic process would be a high degree of selective substrate
conversion within the shortest possible time, and for this reason the benzonitrile-converting
enzyme found in Rhodococcus rhodochrous (which converted 5 mM benzonitrile to
benzamide in less than 10 minutes) is identified as an enzyme worthy of further
investigation for practical applications in industry. The reasonably stable enzymes would
allow flexibility in an industrial bioconversion process. The enzyme system was identified
as a nitrile hydratase that converts the aromatic benzonitrile to the corresponding amide,
and a putative amidase subsequently converts the aromatic amide, benzamide, to benzoic
acid. Inhibiting the amidase would allow stopping the reaction at the amide intermediate.
Although certain colorimetric assays may be useful in detecting potent nitrile-hydrolysing
activity during the biocatalyst screening process, they are unreliable and nonspecific.
HPLC remains the most reliable quantitative method for determination of nitrile activity,
but is not suitable for high-throughput screening. The multistep process of measuring
activity by HPLC may be a drawback to the assay, as is the lengthy processing of samples.
Chapter 4 111

Nitrile hydratase activity in Rhodococcus rhodochrous ATCC BAA-870 has useful colour-
association, and can be separated from amidase activity using ion exchange
chromatography. Gel exclusion chromatography has shown that both the nitrile hydratase
and amidase enzymes in Rhodococcus rhodochrous ATCC BAA-870 are high molecular
weight native structures, and are suited to conversions of mono-substituted aromatic
nitriles such as benzonitrile and the β-hydroxy nitrile, 3-hydroxy-3-phenylpropionitrile.
The enzymes appear to have a broad pH range, fast reaction times, and are relatively
stable. Nitrile hydratase and amidase from Rhodococcus rhodochrous ATCC BAA-870 are
potentially useful enzymes which could be applied to biocatalysis in industry.
Chapter 4 112

5 Appendix
5.1 Standard Curves
Ammonia concentration standard curve:
y = 5.683x + 19.137R2 = 0.9963
0
100
200
300
400
500
600
0 10 20 30 40 50 60 70 80 90 100
NH4Cl Concentration (µ M)
Flu
ore
scen
ce I
nte
nsi
ty a
t 46
7 n
m
Figure 56: NH4Cl Standard curve.Increasing concentrations of o-phthaldialdehyde derivatised ammonia were measured using a
PerkinElmer LS 55 fluorescence spectrometer. Excitation and emission wavelengths were set at
412 and 467 nm respectively.
Example of a bovine serum albumin concentration standard curve using the BioRad assay:
y = 1.0257x + 0.0426R2 = 0.9991
0.00.10.20.30.40.50.60.70.80.91.0
0 0.1 0.2 0.3 0.4 0.5 0.6 0.7 0.8 0.9
BSA Concentration (mg/ml)
Ab
sorb
ance
at
595
nm
Figure 57: Sample BioRad protein concentration determination standard curve.BSA standards in the range 0.2 – 0.9 mg/ml were prepared in duplicate, and 100 µl of each added
to 5 ml protein concentration determination dye reagent. Standards were incubated at room
temperature for a minimum of 5 minutes. The absorbance at 595 nm was read using a Beckman
Coultier DU 800 Spectrophotometer. Unknown samples were prepared and the concentration
determined from the standard curve.
Chapter 5 113

Example of an SDS-PAGE size marker standard curve:
Figure 58: Standard curve of 10% SDS-PAGE size markers.Relative molecular mass markers 250 000, 150 000, 100 000, 75 000, 50 000, 37 000 and 25 000
were run on a 10% SDS polyacrylamide gel at 150 V using a BioRad mini Protean gel system, and
their distances measured. A standard curve was constructed for estimation of unknown sizes by
plotting the marker 1/log Mr versus distance (mm).
Gel exclusion standard curve:
y = 0.0019x + 0.095R2 = 0.9999
0.150.170.190.210.230.250.270.290.310.33
50 60 70 80 90 100 110 120
Elution Volume (ml)
1/lo
g M
r
Figure 59: Sephacryl S-200 gel exclusion standard curve.Gel exclusion standards were eluted from a Sephacryl S-200 gel exclusion column run at a 0.7
ml/min flow rate using 100 mM potassium phosphate buffer, pH 7.4, containing 0.02% (w/v)
sodium azide. A standard curve of 1/log Mr versus elution volume was constructed for estimation
of eluting proteins of unknown size.
Chapter 5
y = 0.0059x + 0.3893R2 = 0.9969
0.40
0.450.50
0.55
0.60
0.650.70
0.75
0.80
0 10 20 30 40 50
Distance (mm)
1/lo
g M
r
114
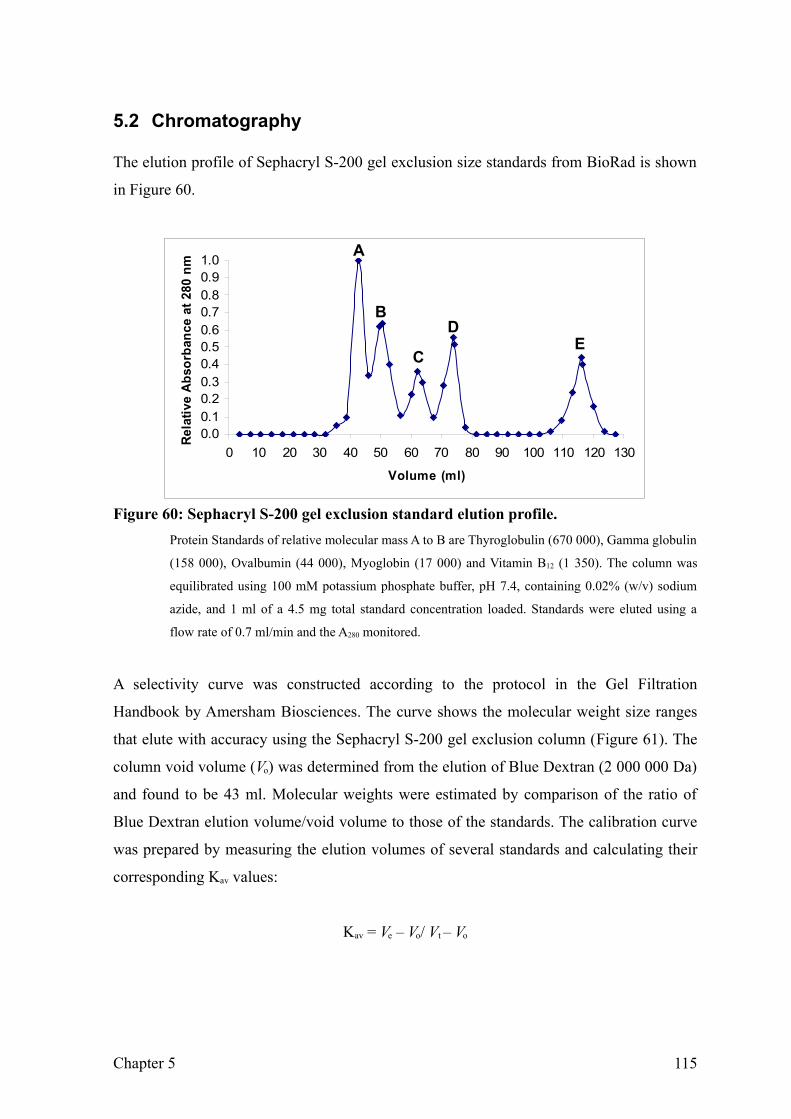
5.2 Chromatography
The elution profile of Sephacryl S-200 gel exclusion size standards from BioRad is shown
in Figure 60.
Figure 60: Sephacryl S-200 gel exclusion standard elution profile.Protein Standards of relative molecular mass A to B are Thyroglobulin (670 000), Gamma globulin
(158 000), Ovalbumin (44 000), Myoglobin (17 000) and Vitamin B12 (1 350). The column was
equilibrated using 100 mM potassium phosphate buffer, pH 7.4, containing 0.02% (w/v) sodium
azide, and 1 ml of a 4.5 mg total standard concentration loaded. Standards were eluted using a
flow rate of 0.7 ml/min and the A280 monitored.
A selectivity curve was constructed according to the protocol in the Gel Filtration
Handbook by Amersham Biosciences. The curve shows the molecular weight size ranges
that elute with accuracy using the Sephacryl S-200 gel exclusion column (Figure 61). The
column void volume (Vo) was determined from the elution of Blue Dextran (2 000 000 Da)
and found to be 43 ml. Molecular weights were estimated by comparison of the ratio of
Blue Dextran elution volume/void volume to those of the standards. The calibration curve
was prepared by measuring the elution volumes of several standards and calculating their
corresponding Kav values:
Kav = Ve – Vo/ Vt – Vo
Chapter 5
0.00.10.20.30.40.50.60.70.80.91.0
0 10 20 30 40 50 60 70 80 90 100 110 120 130
Volume (ml)
Rela
tive
Abs
orba
nce
at 2
80 n
m
A
B
C
DE
115

where Ve = 43 ml, Vt = 111 ml, and Vo the elution volume for each standard. The standard
Kav values were then plotted versus the logarithm of their molecular weight (Figure 61).
y = -0.4061x + 2.2564R2 = 0.9473
-0.5
-0.3
-0.1
0.1
0.3
0.5
0.7
0.9
1.1
1.3
3.0 3.3 3.5 3.8 4.0 4.3 4.5 4.8 5.0 5.3 5.5 5.8 6.0
log Mr
Kav
Figure 61: Sephacryl S-200 gel exclusion selectivity curve.The column void volume (Vo) was determined from the elution of Blue Dextran (2 000 kDa) at 0.7
ml/min using 100 mM potassium phosphate buffer, pH 7.4, containing 0.02% (w/v) sodium azide.
Molecular weights were estimated by comparison of Blue Dextran elution volume/void volume
ratio to that of standards. Standards and unknowns were eluted using a flow rate of 0.7 ml/min and
the A280 monitored.
The Kav = 1 to Kav = 7 is the accepted linear range for a selectivity curve and determines
the fractionation range of the gel exclusion medium. The exclusion limit indicates the size
of molecule that is excluded from the gel pores and therefore elutes in the void volume.
Chapter 5 116

The apparent molecular weight contained within each eluting fraction was calculated for
the Sephacryl S-200 column (Table 8). The molecular weight of an unknown substance can
be determined from the calibration curve once its Kav value is calculated from its measured
elution volume.
Table 8: Apparent molecular weight of the proteins within each Sephacryl S-200 gel
exclusion fraction as estimated by comparison of the ratio of elution
volume/void volume of Blue Dextran to that of molecular weight standards
Fraction Number Elution VolumeApparent Molecular Weight
Within Each Fraction
1 8 1174897600
2 16 93325400
3 24 12882500
4 32 2630300
5 40 707900
6 48 234400
7 56 93330
8 64 41690
9 72 20420
10 80 11220
11 88 6460
12 96 3980
13 104 2630
14 112 1780
15 120 1260
16 128 910
17 136 680The column was run at a 0.7 ml/min flow rate using 100 mM potassium phosphate buffer, pH
7.4, containing 0.02% (w/v) sodium azide.
Chapter 5 117

5.3 Nitrile Hydratase Theoretical pI
Table 9: Theoretical pI values of different nitrile hydratase enzymes from Rhodococcal and Pseudomonad species
NHase Type Swiss-Prot Number and Code Organism Reference Theorotical pI*α subunit β subunit α subunit β subunit αβ unit
Cobalt-containingQ7SID2
NHAA_PSETH
Q7SID3
NHAB_PSETH
Pseudonocardia
thermophila
Yamaki et al.
(1997)4.89 5.42 5.12
Cobalt-containingP97051
NHAA_PSEPU
P97052
NHAB_PSEPUPseudomonas putida Payne et al . (1997) 5.44 5.97 5.71
Cobalt-containing low
molecular weight
P29378
NHA2_RHORH
P29379
NHB2_RHORH
Rhodococcus
rhodochrous
Kobayashi et al .
(1991)4.93 4.92 4.93
Cobalt-containing high
molecular weight
P21219
NHA1_RHORH
P21220
NHB1_RHORH
Rhodococcus
rhodochrous
Kobayashi et al .
(1991)4.85 5.86 5.3
Iron-containingP27764
NHAA_PSECL
P27763
NHAB_PSECL
Pseudomonas
chlororaphis
Nishiyama et al .
(1991)5.16 5.8 5.55
Iron-containingP13448
NHAA_RHOER
P13449
NHAB_RHOER
Rhodococcus
erythropolis
Ikehata et al .
(1989)4.79 4.93 4.87
Iron-containingQ53118
NHAA_RHOSO
Q53117
NHAB_RHOSORhodococcus sp.
Mayaux et al.
(1991)4.57 5.12 4.79
*Theorotical pI values were calculated using the ProtParam tool from ExPasy [Gasteiger et al. (2005)] as deduced from the protein sequence and assuming there is no
post-translational modification of the protein.
Chapter 5 118
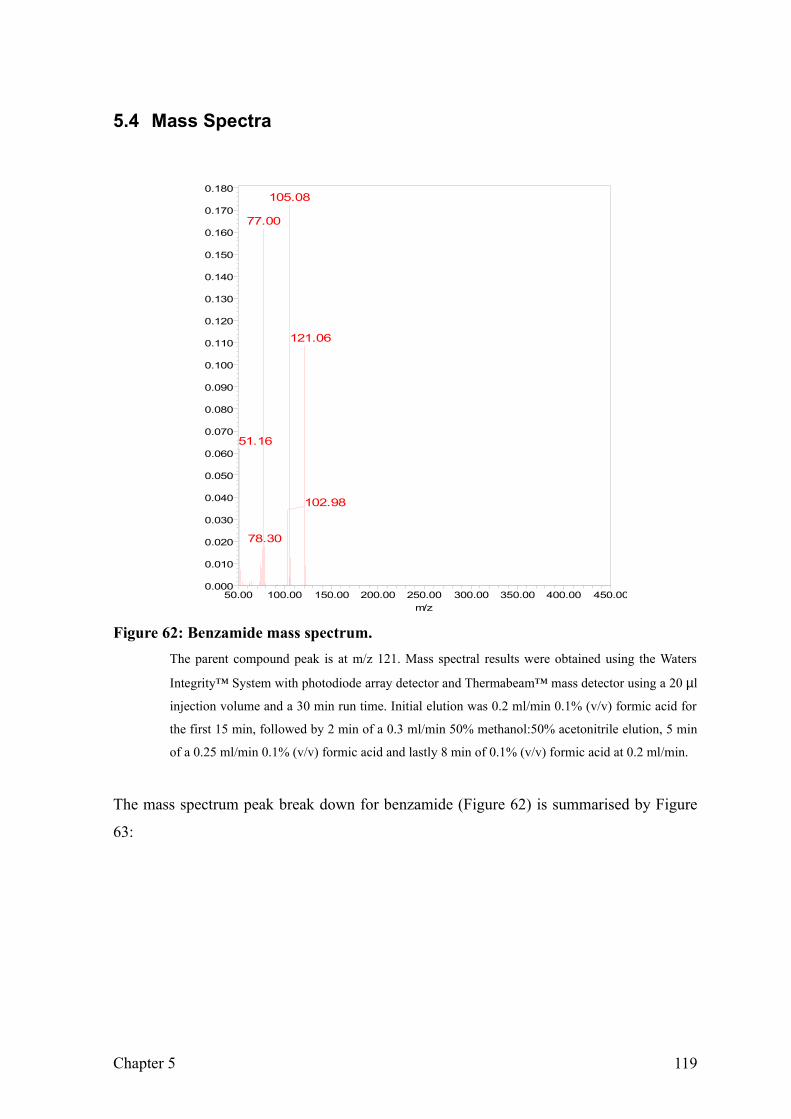
5.4 Mass Spectra
0.000
0.010
0.020
0.030
0.040
0.050
0.060
0.070
0.080
0.090
0.100
0.110
0.120
0.130
0.140
0.150
0.160
0.170
0.180
m/z50.00 100.00 150.00 200.00 250.00 300.00 350.00 400.00 450.00
51.16
77.00
78.30
102.98
105.08
121.06
Figure 62: Benzamide mass spectrum.The parent compound peak is at m/z 121. Mass spectral results were obtained using the Waters
Integrity™ System with photodiode array detector and Thermabeam™ mass detector using a 20 µl
injection volume and a 30 min run time. Initial elution was 0.2 ml/min 0.1% (v/v) formic acid for
the first 15 min, followed by 2 min of a 0.3 ml/min 50% methanol:50% acetonitrile elution, 5 min
of a 0.25 ml/min 0.1% (v/v) formic acid and lastly 8 min of 0.1% (v/v) formic acid at 0.2 ml/min.
The mass spectrum peak break down for benzamide (Figure 62) is summarised by Figure
63:
Chapter 5 119

N O
M+
Benzamide parent ion
O
m/z = 121 m/z = 105 m/z = 77m/z = 103
phenyl cation aryl cation
C4H3+
m/z = 51
Figure 63: Mass spectrum breakdown for benzamide showing the mass/charge ratio
of possible peak components.Only the components of the main identification peaks are shown. Structures were drawn using
ChemDraw® Ultra version 8.0 (by CambridgeSoft Corporation, 2003).
The mass spectrum peak break down for 3-hydroxy-3-phenylpropionitrile (Figure 65) is
summarised by Figure 64:
m/z = 107 m/z = 105m/z = 77
phenylcation
arylcation
C4H3+
m/z = 51
C6H5C2H4+
substitutedbenzenecationOH
Figure 64: Mass spectrum breakdown for 3-hydroxy-3-phenylpropionitrile showing
the mass/charge ratio of identified peak components.Only the components of the main identification peaks are shown. Structures were drawn using
ChemDraw® Ultra version 8.0 (by CambridgeSoft Corporation, 2003).
Chapter 5 120

0.000
0.010
0.020
0.030
0.040
0.050
0.060
0.070
0.080
0.090
0.100
0.110
m/z50.00 100.00 150.00 200.00 250.00 300.00 350.00 400.00 450.00
51.07
77.00
78.17
79.00
79.5091.17 102.11
105.03
106.15
107.11
129.13
Figure 65: 3-Hydroxy-3-phenylpropionitrile mass spectrum.The parent compound peak would be at m/z 147.18 but is too weak to be observed. Mass spectral
results were obtained using the Waters Integrity™ System with photodiode array detector and
Thermabeam™ mass detector using a 20 µl injection volume and a 30 min run time. Initial elution
was 0.2 ml/min 0.1% (v/v) formic acid for the first 15 min, followed by 2 min of a 0.3 ml/min
50% methanol:50% acetonitrile elution, 5 min of a 0.25 ml/min 0.1% (v/v) formic acid and lastly 8
min of 0.1% (v/v) formic acid at 0.2 ml/min.
Chapter 5 121

0.000
0.010
0.020
0.030
0.040
0.050
0.060
0.070
0.080
0.090
0.100
0.110
m/z50.00 100.00 150.00 200.00 250.00 300.00 350.00 400.00 450.00
51.20
52.13
76.93
78.10
79.0890.90
102.97
104.00105.00
106.00
107.12
120.00
165.87
Figure 66: 3-Hydroxy-3-phenylpropionic acid mass spectrum.Mass spectral results were obtained using the Waters Integrity™ System with photodiode array
detector and Thermabeam™ mass detector using a 20 µl injection volume and a 30 min run time.
Initial elution was 0.2 ml/min 0.1% (v/v) formic acid for the first 15 min, followed by 2 min of a
0.3 ml/min 50% methanol:50% acetonitrile elution, 5 min of a 0.25 ml/min 0.1% (v/v) formic acid
and lastly 8 min of 0.1% (v/v) formic acid at 0.2 ml/min.
The mass spectrum peak break down for 3-hydroxy-3-phenylpropionic acid (Figure 66) is
summarised by Figure 67:
m/z = 107m/z = 105m/z = 77
phenylcation
arylcation
C4H3+
m/z = 51
C6H5C2H4+
substitutedbenzene
cation OH
m/z = 91
Figure 67: Mass spectrum breakdown for 3-hydroxy-3-phenylpropionic acid showing
the mass/charge ratio of identified peak components.Only the components of the main identification peaks are shown. Structures were drawn using
ChemDraw® Ultra version 8.0 (by CambridgeSoft Corporation, 2003).
Chapter 5 122

5.5 Structures
Table 10: Table of compounds and structures referred to in this study
Compound Name Alternate Name/s Structure ClassificationAcetonitrile Methyl cyanide;
Cyanomethane;Ethanenitrile
N
Aliphatic mononitrile
Acrylamide 2-Propenamide O
NH2
Aliphatic amide
Acrylonitrile Propenenitrile;Vinyl cyanide;Cyanoethylene;Acritet;Fumigrain;Ventox
N
Aliphatic mononitrile
Adipamide Hexanediamide;Hexanedioic diamide H2N
OO
NH2
Adiponitrile Hexanedinitrile
N
N Aliphatic dinitrile
6-Aminopenicillanic acid
6-Amino-3,3-dimethyl-7-oxo-4-thia-1- azabicyclo;Heptane-2- carboxylic acid
N
S
OHO
H2N
O
Aromatic acid; Penicillin synthesis precursor
Benzamide Benzoylamide;Benzoic acid amide;Phenylcarboxyamide
N O Aromatic amide
Benzoic acid Benzenecarboxylic acid;Benzeneformic acid;Phenyl carboxylic acid;Phenyl formic acid; Dracylic acid
HO OAromatic acid
Benzonitrile Phenyl Cyanide;Cyanobenzene
N Aromatic mononitrile
Benzyl nitrile See Phenylacetonitrile
Chapter 5 123
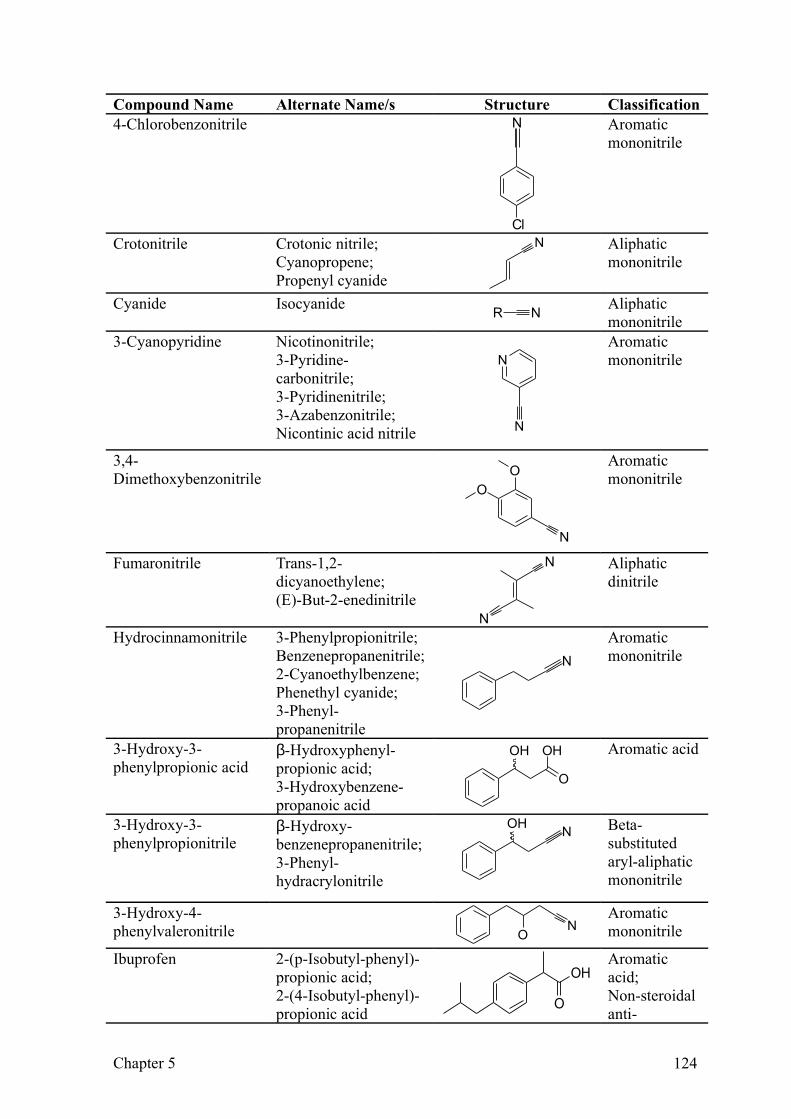
Compound Name Alternate Name/s Structure Classification4-Chlorobenzonitrile N
Cl
Aromatic mononitrile
Crotonitrile Crotonic nitrile;Cyanopropene;Propenyl cyanide
N Aliphatic mononitrile
Cyanide Isocyanide R N Aliphatic mononitrile
3-Cyanopyridine Nicotinonitrile;3-Pyridine-carbonitrile;3-Pyridinenitrile;3-Azabenzonitrile;Nicontinic acid nitrile
N
N
Aromatic mononitrile
3,4-Dimethoxybenzonitrile O
O
N
Aromatic mononitrile
Fumaronitrile Trans-1,2-dicyanoethylene;(E)-But-2-enedinitrile
N
N Aliphatic dinitrile
Hydrocinnamonitrile 3-Phenylpropionitrile;Benzenepropanenitrile;2-Cyanoethylbenzene;Phenethyl cyanide;3-Phenyl-propanenitrile
N
Aromatic mononitrile
3-Hydroxy-3-phenylpropionic acid
β-Hydroxyphenyl-propionic acid;3-Hydroxybenzene-propanoic acid
OH
O
OH Aromatic acid
3-Hydroxy-3-phenylpropionitrile
β-Hydroxy-benzenepropanenitrile;3-Phenyl-hydracrylonitrile
NOH Beta-substituted aryl-aliphatic mononitrile
3-Hydroxy-4-phenylvaleronitrile N
OAromatic mononitrile
Ibuprofen 2-(p-Isobutyl-phenyl)-propionic acid;2-(4-Isobutyl-phenyl)-propionic acid
OH
O
Aromatic acid;Non-steroidal anti-
Chapter 5 124

Compound Name Alternate Name/s Structure Classificationinflammatory drug
Indole-3-acetic acid Heteroauxin;Indoleacetic acid
NH
O
OH Aromatic acid;Plant phytohormone (auxin)
Indole-3-acetonitrile 3-Indoleacetonitrile;3-Indolylacetonitrile;3-Cyanomethyl-indole;1H-Indole-3-acetonitrile
NH
N Aromatic mononitrile
Isobutyronitrile 2-Methyl-propanenitrile;Isopropylcyanide;2-Cyanopropane
N
Aliphatic mononitrile
Isonicotinamide 4-Carbamoylpyridine; Isonicotinic acid amide;Gamma-Pyridine-carboxamide; 4-Pyridine-carboxamide
N
O NAromatic amide
Isonicotinic acid Cinnamylidene-hydrazide;Pyridine-4-carboxylic Acid;4-Pyridinecarboxylic acid;4-Picolinic acid
N
O OAromatic acid
Isovaleronitrile N Aliphatic mononitrile
Lactic acid 2-Hydroxypropanoic acid
OH
OH
Aliphatic acid
Malononitrile Propanedinitrile;Dicyanomethane
N
N Aliphatic dinitrile
Mandelic acid α-Hydroxy-benzeneacetic acid;α-Hydroxy-phenylacetic acid;Amygdalic acid;Uromaline
O
OH
OH
Aromatic acid
Chapter 5 125

Compound Name Alternate Name/s Structure Classification(R)+Mandelonitrile α-Hydroxy-
benzeneacetonitrile;Benzaldehyde; cyanohydrin;Mandelic acid nitrile
N
O
H
Aromatic mononitrile
α-Methylbenzyl cyanide
α−Methylphenyl-acetonitrile;α-2-Phenyl-propionitrile
N
Aromatic mononitrile
Naproxen 2-(6-Methoxy-naphthalen-2-yl)-propanoic acid;(S)-6-Methoxy-α-methyl-2-naphthaleneacetic acid
OOH
O
Aromatic acid;Non-steroidal anti-inflammatory drug
Naproxen nitrile
ON
Aromatic mononitrile
Nicotinic acid Vitamin B3;Niacin
N
O
OH
Aromatic acid; Essential amino acid
Ninhydrin O
O
OHOH
Colorimetric reagent
Penicillin Penicillin-G
N
S
OHO
O
HNR
O β-Lactam antibiotic
Phenylacetonitrile Benzyl nitrile;α-Cyanotoluene;Benzeneacetonitrile;α-Tolunitrile
N
Aromatic mononitrile
PhenylbutyronitrileN
Arylaliphatic mononitrile
Phenylglycinonitrile Amino-phenyl-acetonitrile
N
N Alpha-substituted aryl-aliphatic mononitrile
3-Phenylpropionitrile See Hydrocinnamonitrile
Chapter 5 126

Compound Name Alternate Name/s Structure ClassificationPropionamide
NH2
O Aliphatic amide
Propionitrile Propylnitrile;Ethyl cyanide;Cyanoethane;Propiononitrile
N
Aliphatic mononitrile
Ricinine 1,2-Dihydro-4-methoxy-1-methyl-2-oxo-3-pyridine-nitrile
N
O N
OAromatic mononitrile;Plant toxin
p-Tolunitrile N Aromatic mononitrile
Valeronitrile Pentanenitrile;1-Cyanobutane;Butyl cyanide
N
Aliphatic mononitrile
Structures were drawn using ChemDraw® Ultra version 8.0 (by CambridgeSoft Corporation,
2003).
Chapter 5 127

6 References
1 Kobayashi, M., Nagasawa, T. and Yamada, H. (1992) Enzymatic synthesis of acrylamide: a success story not yet over. TRENDS Biotechnol. 10, 402-408
2 Hjort, C. M., Godtferedson, S. E. and Emborg, C. (1990) Isolation and characterisation of a nitrile hydratase from a Rhodococcus sp. J. Chem. Technol. Biotechnol. 48, 217-226
3 Takashima, Y. (1995) Process for the production of amide compounds using microorganisms. In European Patent Application, 95-101282.2, pp. 10
4 Kobayashi, M., Yanaka, N., Nagasawa, T. and Yamada, H. (1990) Purification and characterization of a novel nitrilase of Rhodococcus rhodochrous K22 that acts on aliphatic nitriles. J. Bacteriol. 172, 4807-4815
5 Lu, J., Zheng, Y., Yamagishi, H., Odaka, M., Tsujimura, M., Maeda, M. and Endo, I. (2003) Motif CXCC in nitrile hydratase activator is critical for NHase biogenesis in vivo. FEBS Lett. 553, 391-396
6 Gradley, M. L., Deverson, C. J. F. and Knowles, C. J. (1994) Asymmetric hydrolysis of R-(–),S(+)-2-methylbutyronitrile by Rhodococcus rhodochrous NCIMB 11216. Arch. Microbiology 161, 246-251
7 Meth-Cohn, O. and Wang, M.-X. (1997) An in-depth study of the biotransformation of nitriles into amides and/or acids using Rhodococcus rhodochrous AJ270. J. Chem. Soc. Perkin Trans. 1, 1099-1104
8 Brenner, C. (2002) Catalysis in the nitrilase superfamily. Curr. Opin. Struct. Biol. 12, 775-782
9 Pace, H. C. and Brenner, C. (2001) The nitrilase superfamily: classification, structure and function. Genome Biology 2, 1.1-1.9
10 Novo, C., Farnaud, S., Tata, R., Clemente, A. and Brown, P. R. (2002) Support for a three-dimensional structure predicting a Cys-Glu-Lys catalytic triad for Pseudomonas aeruginosa amidase comes from site-directed mutagenesis and mutations altering substrate specificity. Biochem. J. 365, 731-738
11 Stevenson, D. E., Feng, R. and Storer, A. C. (1990) Detection of covalent enzyme-substrate complexes of nitrilase by ion-spray mass spectroscopy. FEBS Lett. 277, 112-114
12 Kobayashi, M., Komeda, H., Yanaka, N., Nagasawa, T. and Yamada, H. (1992) Nitrilase from Rhodococcus rhodochrous J1: sequencing and overexpression of the gene and identification of an essential cysteine residue. J. Biol. Chem. 267, 20746-20751
13 Grifantini, R., Pratesi, C., Galli, G. and Grandi, G. (1996) Topological mapping of the cysteine residues of N-carbamyl-D-amino-acid amidohydrolase and their role in enzymatic activity. J. Biol. Chem. 271, 9326-9331
14 Kobayashi, M., Fujiwara, Y., Goda, M., Komeda, H. and Shimizu, S. (1997) Identification of active sites in amidase: Evolutionary relationship between amide bond- and peptide bond-cleaving enzymes. Proc. Natl. Acad. Sci. USA 94, 11986-11991
15 Kobayashi, M., Goda, M. and Shimizu, S. (1998) Nitrilase Catalyzes Amide Hydrolysis as Well as Nitrile Hydrolysis. Biochem. Biophys. Res. Comm. 253, 662-666
16 Kobayashi, M., Yanaka, N., Nagasawa, T. and Yamada, H. (1992) Primary structure of an aliphatic nitrile-degrading enzyme, aliphatic nitrilase from Rhodococcus
References 128

rhodocrous K22 and expression of its gene and identification of its active site residue. Biochemistry 31, 9000-9007
17 Yamada, H. and Kobayashi, M. (1996) Nitrile hydratase and its application to industrial production of acrylamide. Biosci. Biotech. Biochem. 60, 1391-1400
18 Maier-Greiner, U. H., Obermaier-Skrobranek, B. M. M., Estermaier, L. M., Kammerloher, W., Freund, C., Wülfing, C., Burkert, U. I., Matern, D. H., Breuer, M., Eulitz, M., Küfrevioglu, Ö. I. and Hartmann, G. R. (1991) Isolation and properties of a nitrile hydratase from the soil fungus Myrothecium verrucaria that is highly specific for the fertilizer cyanamide and cloning of its gene. Proc. Natl. Acad. Sci. USA 88, 4260-4264
19 Komeda, H., Kobayashi, M. and Shimizu, S. (1996) Characterization of the gene cluster of high-molecular-mass nitrile hydratase (H-NHase) induced by its reaction product in Rhodococcus rhodocrous J1. Proc. Natl. Acad. Sci. USA 93, 4267-4272
20 Komeda, H., Kobayashi, M. and Shimizu, S. (1996) A novel gene cluster including the Rhodococcus rhodocrous J1 nhIBA genes encoding a low molecular mass nitrile hydratase (L-NHase) induced by its reaction product. J. Biol. Chem. 271, 15796-15802
21 Wieser, M., Takeuchi, K., Wada, Y., Yamada, H. and Nagasawa, T. (1998) Low-molecular-mass nitrile hydratase from Rhodococcus rhodocrous J1: purification, substrate specificity and comparison with the analogous high-molecular-mass enzyme. FEMS Microbiol. Lett. 169, 17-22
22 Kobayashi, M., Izui, H., Nagasawa, T. and Yamada, H. (1993) Nitrilase in biosynthesis of the plant hormone indole-3-acetic acid from indole-3-acetonitrile: cloning of the Alcaligenes gene and site directed mutagenesis of cysteine residues. Proc. Natl. Acad. Sci. USA 90, 247-251
23 Bartling, D., Seedorf, M., Schmidt, R. C. and Weiler, E. W. (1994) Molecular characterization of two cloned nitrilases from Arabidopsis thaliana: key enzymes in biosynthesis of the plant hormone indole-3-acetic acid. Proc. Natl. Acad. Sci. USA 91, 6021-6025
24 Kobayashi, M. and Shimizu, S. (1994) Versatile nitrilases: nitrile-hydrolyzing enzymes. FEMS Microbiol. Lett. 120, 217-224
25 Pace, H. C., Hodawadekar, S. C., Draganescu, A., Huang, J., Bieganowski, P., Pekarsky, Y., Croce, C. M. and Brenner, C. (2000) Crystal structure of the worm NitFhit Rosetta Stone protein reveals a Nit tetramer binding two Fhit dimers. Curr. Biol. 10, 907-917
26 Stevenson, D. E., Feng, R., Dumas, F., Groleau, D., Mihoc, A. and Storer, A. C. (1992) Mechanistic and structural studies on Rhodococcus ATCC 39484 nitrilase. Biotechnol. Appl. Biochem. 15, 283-302
27 Nagasawa, T., Wieser, M., Nakamura, T., Iwahara, H., Yoshida, T. and Gekko, K. (2000) Nitrilase of Rhodococcus rhodochrous J1, conversion into the active form by subunit association. Eur. J. Biochem. 267, 138-144
28 Kobayashi, M. and Shimizu, S. (1998) Metalloenzyme nitrile hydratase: structure, regulation, and application to biotechnology. Nat. Biotechnol. 16, 733-736
29 Okada, M., Noguchi, T., Nagashima, T., Yohda, M., Yabuki, S., Hoshino, M., Inoue, Y. and Endo, I. (1996) Location of the non-heme iron center on the a-subunit of photoreactive nitrile hydratase from Rhodococcus sp. N-771. Biochem. Biophys. Res. Commun. 221, 146-150
30 Miyanaga, A., Fushinobu, S., Ito, K., Shoun, H. and Wakagi, T. (2004) Mutational and structural analysis of cobalt-containing nitrile hydratase on substrate and metal binding. Eur. J. Biochem. 271, 429-438
References 129

31 Hourai, S., Miki, M., Takashima, Y., Mitsuda, S. and Yanagi, K. (2003) Crystal structure of nitrile hydratase from a thermophilic Bacillus smithii. Biochem. Biophys. Res. Comm. 312, 340-345
32 Nagashima, S., Nakasako, M., Dohmae, N., Tsujimura, M., Takio, K., Odaka, M., Yohda, M., Kamiya, N. and Endo, I. (1998) Novel non-heme iron center of nitrile hydratase with a claw setting of oxygen atoms. Nat. Struct. Biol. 5, 347-351
33 Nojiri, M., Kawano, Y., Hashimoto, K. and Kamiya, N. (To be published) X-ray snap shots of inhibitor binding process in photo-reactive nitrile hydratase.
34 Huang, W., Jia, J., Cummings, J., Nelson, M., Schneider, G. and Lindqvist, Y. (1997) Crystal structure of nitrile hydratase reveals a novel iron centre in a novel fold. Structure 5, 691-699
35 Berman, H. M., Westbrook, J., Feng, Z., Gilliland, G., Bhat, T. N., Weissig, H., Shindyalov, I. N. and Bourne, P. E. (2000) The Protein Data Bank. Nuc. Acids Res. 28, 235-242
36 Brennan, B. A., Cummings, J. G., Chase, D. B., Turner, I. M. J. and Nelson, M. J. (1996) Resonance Raman spectroscopy of nitrile hydratase, a novel iron-sulfur enzyme. Biochemistry 35, 10068-10077
37 Nelson, M. J., Jin, H., Turner, I. M. J., Grove, G., Scarrow, R. C., Brennan, B. A. and Que, L. J. (1991) A novel iron-sulfur center in nitrile hydratase from Brevibacterium sp. J. Am. Chem. Soc. 113, 7072-7073
38 Sugiura, Y., Kuwahara, J., Nagasawa, T. and Yamada, H. (1987) Nitrile hydratase: the first non-heme iron enzyme with a typical low spin Fe(III) active centre. J. Am. Chem. Soc. 109, 5848-5850
39 Jin, H., Turner, I. M. J., Nelson, M. J., Gurbiel, R. J., Doan, P. E. and Hoffman, B. (1993) Coordination sphere of the ferric ion in nitrile hydratase. J. Am. Chem. Soc. 115, 5290-5291
40 Doan, P. E., Nelson, M. J., Jin, H. and Hoffman, B. (1996) An Implicit TRIPLE Effect in Mims Pulsed ENDOR: A Sensitive New Technique for Determining Signs of Hyperfine Couplings. J. Am. Chem. Soc. 118, 7014-7015
41 Scarrow, R. C., Brennan, B. A., Cummings, J. G., Jin, H., Duong, D. J., Kindt, J. T. and Nelson, M. J. (1996) X-ray spectroscopy of nitrile hydratase at pH 7 and 9. Biochemistry 35, 10078-10088
42 Nagashima, S., Nakasako, M., Dohmae, N., Tsujimura, M., Takio, K., Odaka, M., Yohda, M., Kamiya, N. and Endo, I. (1998) Novel non-heme iron center of nitrile hydratase with a claw setting of oxygen atoms. Nat. Struct. Biol. 5, 347-351
43 Shearer, J., Jackson, H. L., Schweitzer, D., Rittenberg, D. K., Leavy, T. M., Kaminsky, W., Scarrow, R. C. and Kovacs, J. A. (2002) The First Example of a Nitrile Hydratase Model Complex that Reversibly Binds Nitriles. J. Am. Chem. Soc. 124, 11417-11428
44 Honda, J., Kandori, H., Okada, T., Nagamune, T., Shichida, Y., Sasabe, H. and Endo, I. (1994) Spectroscopic observation of the intramolecular electron transfer in the photoactivation processes of nitrile hydratase. Biochemistry 33, 3577-3583
45 Endo, I., Odaka, M. and Yohda, M. (1999) An enzyme controlled by light: the molecular mechanism of photoreactivity in nitrile hydratase. TRENDS Biotechnol. 17, 244-249
46 Noguchi, T., Honda, J., Nagamune, T., Sasabe, H., Inoue, Y. and Endo, I. (1995) Photosensitive nitrile hydratase intrinsically possesses nitric oxide bound to the non-heme iron center: evidence by Fourier transform infrared spectroscopy. FEBS Lett. 358, 9-12
References 130

47 Endo, I. and Odaka, M. (2000) What evidences were elucidated about photoreactive nitrile hydratase? J. Mol. Catal. B: Enzymatic 10, 81-86
48 Popescu, V.-C., Münck, E., Fox, B. G., Sanakis, Y., Cummings, J. G., Turner, I. M. J. and Nelson, M. J. (2001) Mössbauer and EPR Studies of the Photoactivation of Nitrile Hydratase. Biochemistry 40, 7984-7991
49 Banerjee, A., Sharma, R. and Banerjee, U. C. (2002) The nitrile-degrading enzymes: current status and future prospects. Appl. Microbiol. Biotechnol. 60, 33-44
50 Hirrlinger, B., Stolz, A. and Knackmuss, H.-J. (1996) Purification and characterization of an amidase from Rhodococcus erythropolis MP 50 which enantioselectively hydrolyzes 2-arylpropionamides. J. Bacteriol. 178, 3501-3507
51 Asano, Y., Fujishiro, K., Tany, Y. and Yamada, H. (1982) Aliphatic nitrile hydratase from Arthrobacter sp. J1: Purification and characterisation. Agric. Biol. Chem. 46, 1165-1174
52 Stelkes-Ritter, U., Wyzgol, K. and Kula, M. (1995) Purification and characterization of a newly screened microbial peptide amidase. Appl. Microbiol. Biotechnol. 44, 393-398
53 Rawlings, N. D. and Barrett, A. J. (2000) MEROPS: the peptidase database. Nucleic Acids Res. 28, 323-325
54 Zalkin, H. and Smith, J. L. (1998) Enzymes utilizing glutamine as an amide donor. Adv. Enzymol. Relat. Areas Mol. Biol. 72, 87-144
55 Patricelli, M. P. and Cravatt, B. F. (2000) Clarifying the catalytic roles of conserved residues in the amidase signature family. J. Biol. Chem. 275, 19177-19184
56 Mayaux, J. F., Cerbelaud, E., Soubrier, F., Faucher, D. and Petre, D. (1990) Purification, cloning, and primary structure of an enantiomer-selective amidase from Brevibacterium sp. strain R312 - structural evidence for genetic coupling with nitrile hydratase. J. Bacteriol. 172, 6764-6773
57 Nishiyama, M., Horinouchi, S., Kobayashi, M., Nagasawa, T., Yamada, H. and Beppu, T. (1991) Cloning and characterization of genes responsible for metabolism of nitrile compounds from Pseudomonas chlororaphis B23. J. Bacteriol. 173, 2465-2472
58 Rolf, M. J. and Lim, H. C. (1985) In Comprehensive Biotechnology (Moo-Young, M., ed.), pp. 165-174, Pergamon Press, Oxford
59 Shaw, N. M., Naughton, A., Robins, K., Tinschert, A., Schmid, E., Hischier, M.-L., Venetz, V., Werlen, J., Zimmerman, T., Brieden, W., de Riedmatten, P., Roduit, J.-P., Zimmerman, B. and Neumüller, R. (2002) Selection, Purification, Characterisation, and Cloning of a Novel Heat-Stable Stereo-Specific Amidase from Klebsiella oxytoca, and Its Application in the Synthesis of Enantiomerically Pure (R)- and (S)-3,3,3-Trifluoro-2-hydroxy-2-methylpropionic Acids and (S)-3,3,3-Trifluoro-2-hydroxy-2-methylpropionamide. Organic Process Res. & Dev. 6, 497-504
60 Shaw, N. M., Robins, K. T. and Kiener, A. (2003) Lonza: 20 Years of Biotransformations. Adv. Synth. Catal. 345, 425-435
61 Conn, E. E. (1981) Biosynthesis of cyanogenic glycosides. In Cyanide in Biology (Vennesland, B., Conn, E. E., Knowles, C. J., Westley, J. and Wissing, F., eds.), pp. 183-196, Academic Press, London
62 Wyatt, J. M. and Linton, E. A. (1988) in Ciba Foundation Symposium 140 (Evered, D. and Harnett, S., eds.), pp. 32-48, Wiley, Chichester
63 Bhalla, T. C., Miura, A., Wakamoto, A., Ohba, Y. and Furuhashi, K. (1992) Asymmetric hydrolysis of alpha aminonitriles to optically active amino acids by a nitrilase of Rhodococcus rhodochrous PA-34. Appl. Microbiol. Biotechnol. 37, 184-190
References 131
64 Faber, K. (1995) In Biotransformations in Organic Chemistry, Springer-Verlag, Berlin65 Yamamoto, K., Ueno, Y., Otsubo, K., Kawakami, K. and Komatsu, K.-I. (1990)
Production of S-(+)-ibuprofen from a nitrile compound by Acinetobacter sp. strain AK226. Appl. Environ. Microbiol. 56, 3125-3129
66 Layh, N., Stoltz, A., Böhme, J., Effenberger, F. and Knackmuss, H.-J. (1994) Enantioselective hydrolysis of racemic naproxen nitrile and naproxen amide to S-naproxen by new bacterial isolates. J. Biotechnol. 33, 175-182
67 Effenberger, F. and Böhme, J. (1994) Enzyme-catalysed enantioselective hydrolysis of racemic naproxen nitrile. Bioorg. Med. Chem. 2, 715-721
68 Nagasawa, T. and Yamada, H. (1990) In Biocatalysis (Abramowicz, D. A., ed.), pp. 277-318, Van Nostrand Reinhold, New York
69 Wieser, M. and Nagasawa, T. (2000) Stereoselective Nitrile-Converting Enzymes. In Stereoselective Biocatalysis (Patel, R. N., ed.), pp. 467-486
70 Crosby, J., Moilliet, J., Parratt, J. S. and Turner, N. J. (1994) Regioselective hydrolysis of aromatic dinitriles using a whole cell catalyst. J. Chem. Soc. Perkin Trans. I, 1679-1687
71 Kobayashi, M. and Shimizu, S. (2000) Nitrile hydrolases. Curr. Opin. Chem. Biol. 4, 95-102
72 Christian, H.-J., Hollergeschwandner, C., Peitzsch, M., Ress-Loeschke, M., Hauer, B., Brandao, P. F., Bunch, A., Robinson, G., Bull, A. T. and Syldatk, C. (2001) in 5th Int. Symp. on Biocatalysis and Biotransformation, pp. 140, Darmstadt
73 Yamamoto, K., Oishi, K., Fujimatsu, I. and Komatsu, K.-I. (1991) Production of R-(-)mandelic acid from mandelonitrile by Alcaligenes faecalis ATCC 8750. Appl. Environ. Microbiol. 57, 3028-3032
74 Dufour, É., Storer, A. C. and Ménard, R. (1995) Engineering nitrile hydratase activity into a cysteine protease by a single mutation. Biochemistry 34, 16382-16388
75 Dufour, É., Tam, W., Nägler, D. K., Storer, A. C. and Ménard, R. (1998) Synthesis of amidrazones using an engineered papain nitrile hydratase. FEBS Lett. 433, 78-82
76 Nagasawa, T., Shimizu, S. and Yamada, H. (1993) The superiority of the third-generation catalyst, Rhodococcus rhodochrous J1 nitrile hydratase, for industrial production of acrylamide. Appl. Microbiol. Biotechnol. 40, 189-195
77 Prepechalová, I., Martínková, L., Stoltz, A., Ovesná, M., Bezouska, K., Kopecký, J. and Kren, V. (2001) Purification and characterization of the enantioselective nitrile hydratase from Rhodococcus equi A4. Appl. Microbiol. Biotechnol. 55, 150-156
78 Kruse, J. M. and Mellon, M. G. (1953) Colorimetric Determination of Cyanide and Thiocyanate. Anal. Chem. 25, 1188-1192
79 Fawcett, J. K. and E., S. J. (1960) A rapid and precise method for the determination of urea. J. Clin. Pathol. 13, 156-159
80 Dadd, M. R., Sharp, D. C. A., Pettman, A. J. and Knowles, C. J. (2000) Real-time monitoring of nitrile biotransformations by mid-infrared spectroscopy. J. Microbiol. Methods 41, 69-75
81 Kaul, P., Banerjee, A., Mayilraj, S. and Banerjee, U. C. (2004) Screening for enantioselective nitrilases: kinetic resolution of racemic mandelonitrile to (R)-(–)-mandelic acid by new bacterial isolates. Tetrahedron: Asymmetry 15, 207-211
82 Banerjee, A., Sharma, R. and Banerjee, U. C. (2003) A rapid and sensitive fluorimetric assay method for the determination of nitrilase activity. Biotechnol. Appl. Biochem. 37, 289-293
83 Mana and Spohn. (2000) Rapid and selective determination of ammonia by fluorimetric flow injection analysis. Fresenius' J. Anal. Chem. 366, 825-829
References 132

84 Goddard, J.-P. and Reymond, J.-L. (2004) Enzyme assays for high-throughput screening. Curr. Opin. Biotech. 15, 314-322
85 Preiml, M., Hönig, H. and Klempier, N. (2004) Biotransformation of b-amino nitriles: the role of the N-protecting group. J. Mol. Biocat. B: Enz 29, 115-121
86 Garner, P. and Ramakanth, S. (1986) Stereodivergent Syntheses of threo- and erythro-6-Amino-6-deoxyheptosulose Derivatives via an Optically Active Oxazolidine Aldehyde. J. Org. Chem. 51, 2609-2612
87 Czernecki, F., Franco, S. and Valery, J.-M. (1997) Further Study toward Amipurimycin: Synthesis of the Northern Part. J. Org. Chem. 62, 4845-4847
88 Davies, S. G., Smyth, G. D. and Chippindale, A. M. (1999) Syntheses of derivatives of L-daunosamine and its C-3 epimer employing as the key step the asymmetric conjugate addition of a homochiral lithium amide to tert-butyl (E,E)-hexa-2,4-dienoate. J. Chem. Soc. Perkin Trans. 1, 3089-3104
89 Davies, S. G., Ichihara, O., Lenoir, I. and Walters, I. A. S. (1994) Asymmetric-synthesis of (-)-(1R,2S)-cispentacin and related cis-2-amino and trans-2-amino cyclopentane-1-carboxylic and cyclohexane-1-carboxylic acids. J. Chem. Soc. Perkin Trans. 1, 1411-1415
90 Theil, F. and Ballschuh, S. (1996) Chemoenzymatic synthesis of both enantiomers of cispentacin. Tetrahedron: Asymmetry 7, 3565-3572
91 Sone, H., Nemoto, T., Ishiwata, H., Ojika, M. and Yamada, K. (1993) Isolation, structure, and synthesis of dolastatin D, a cytotoxic cyclic depsipeptide from the sea gare Dolabella auricularia. Tetrahedron Lett. 34, 8449-8452
92 Martínková, L. and Kren, V. (2002) Nitrile- and Amide-converting Microbial Enzymes: Stereo-, Regio- and Chemoselectivity. Biocatal. Biotrans. 20, 73-93
93 Layh, N., Parratt, J. S. and Willetts, A. (1998) Characterization and partial purification of an enantioselective arylacetonitrilase from Pseudomonas fluorescens DSM7155. J. Mol. Catal. B: Enzymatic 5, 467-474
94 Dhillon, J., Chhatre, S., Shanker, R. and Shivaraman, N. (1999) Transformation of aliphatic and aromatic nitriles by a nitrilase from Pseudomonas sp. Can. J. Microbiol. 45, 811-815
95 Langdahl, B. R., Bisp, P. and Ingvorsen, K. (1996) Nitrile hydrolysis by Rhodococcus erythropolis BL1, an acetonitrile-tolerant strain isolated from a marine sediment. Microbiology 142, 145-154
96 Heald, S. C., Brandao, P. F., Hardicre, R. and Bull, A. T. (2001) Physiology, biochemistry and taxonomy of deep-sea nitrile metabolising Rhodoccocus strains. Antonie Van Leeuwenhoek 80, 169-183
97 Layh, N., Hirrlinger, B., Stolz, A. and Knackmuss, H.-J. (1997) Enrichment strategies for nitrile-hydrolysing bacteria. Appl. Microbiol. Biotechnol. 47, 668-674
98 Kato, Y., Ooi, R. and Asano, Y. (1998) Isolation and characterization of a bacterium possessing a novel aldoxime-dehydration activity and nitrile-degrading enzymes. Arch. Microbiology 170, 85-90
99 Brandão, P. F. B., Clapp, J. P. and Bull, A. T. (2002) Diversity and taxonomy of geographically diverse strains of nitrile-metabolising actinomycetes using chemometric and molecular sequencing techniques. Environ. Microbiol. 4, 262-276
100 Blakey, A. J., Colby, J., Williams, E. and O'Reilly, C. (1995) Regio-specific and stereo-specific nitrile hydrolysis by the nitrile hydratase from Rhodococcus AJ270. FEMS Microbiol. Lett. 129, 57-61
101 Scholtz, R., Schmuckle, A., Cook, A. M. and Leisinger, T. (1987) Degradation of eighteen 1-monohaloalkanes by Arthrobacter sp. strain HA1. J. Gen. Microbiol. 133, 267-274
References 133

102 Cowan, D., Cramp, R., Pereira, R., Graham, D. and Almatawah, Q. (1998) Biochemistry and biotechnology of mesophilic and thermophilic nitrile metabolizing enzymes. Extremophiles 2, 207-16
103 Cramp, R. A. and Cowan, D. A. (1999) Molecular characterisation of a novel thermophilic nitrile hydratase. Biochim. Biophys. Acta 1431, 249-260
104 Kato, Y., Tsuda, T. and Asano, Y. (1999) Nitrile hydratase involved in aldoxime metabolism from Rhodococcus sp. strain YH3-3: Purification and characterization. Eur. J. Biochem. 263, 662-670
105 Kashiwagi, M., Fuhshuku, K.-I. and Sugai, T. (2004) Control of the nitrile-hydrolyzing enzyme activity in Rhodococcus rhodochrous IFO 15564: preferential action of nitrile hydratase and amidase depending on the reaction condition factors and its application to the one-pot preparation of amides from aldehydes. J. Mol. Biocat. B: Enz 29, 249-258
106 Brady, D., Beeton, A., Zeevaart, J., Kgaje, C., van Rantwijk, F. and Sheldon, R. A. (2004) Characterisation of nitrilase and nitrile hydratase biocatalytic systems. Appl. Microbiol. Biotechnol. 64, 76-85
107 Laemmli, U. K. (1970) Cleavage of Structural Proteins during the Assembly of the Head of Bacteriophage T4. Nature (London) 227, 680-685
108 Brady, D., Dube, N. and Peterson, R. (2006) Green Chemistry: Highly Selective Biocatalytic Hydrolysis of Nitrile Compounds. S. Afr. J. Sci. in print
109 Komeda, H., Hori, Y., Kobayashi, M. and Shimizu, S. (1996) Transcriptional regulation of the Rhodococcus rhodochrous J1 nitA gene encoding a nitrilase. Proc. Natl. Acad. Sci. USA 93, 10572-10577
110 Wang, M.-X., Feng, G.-Q. and Zheng, Q.-Y. (2004) Synthesis of high enantiomeric purity gem-dihalocyclopropane derivatives from biotransformations of nitriles and amides. Tetrahedron: Asymmetry 15, 347-354
111 Effenberger, F. and Bohme, J. (1994) Enzyme-catalysed enantioselective hydrolysis of racemic naproxen nitrile. Bioorg. Med. Chem. 2, 715-721
112 Beard, T. M. and Page, M. I. (1998) Enantioselective biotransformations using rhodococci. Antonie Van Leeuwenhoek 74, 99-106
113 Nagasawa, T., Takeuchi, K. and Yamada, H. (1991) Characterization of a new cobalt-containing nitrile hydratase purified from urea-induced cells of Rhodococcus rhodochrous J1. Eur. J. Biochem. 196, 581-589
114 Mizunashi, W., Nishiyama, M., Horinouchi, S. and Beppu, T. (1998) Overexpression of high-molecular-mass nitrile hydratase from Rhodococcus rhodochrous J1 in recombinant Rhodococcus cells. Appl. Microbiol. Biotechnol. 49, 568-572
115 Kobayashi, M., Nagasawa, T. and Yamada, H. (1989) Nitrilase of Rhodococcus rhodochrous J1: Purification and characterization. Eur. J. Biochem. 182, 349-356
116 Banerjee, A., Kaul, P., Sharma, R. and Banerjee, U. C. (2003) A High-Throughput Amenable Colorimetric Assay for Enantioselective Screening of Nitrilase-Producing Microorganisms Using pH Sensitive Indicators. J. Biomolecular Screening 8, 559-565
117 Harper, D. B. (1977) Microbial metabolism of aromatic nitriles: Enzymology of C-N cleavage by Nocardia sp. NCIB 11216. Biochem. J. 165, 309-319
118 Harper, D. B. (1985) Characterization of a nitrilase from Nocardia sp. NCIB 11215, using p-hydroxybenzonitrile as sole carbon source. Int. J. Biochem. 17, 677-683
119 Harper, D. B. (1977) Fungal degradation of aromatic nitriles. Enzymology of C-N cleavage by Fusarium solani. Biochem. J. 165, 685-692
References 134

120 Nagasawa, T., Nanba, H., Ryuno, K., Takeuchi, K. and Yamada, H. (1987) Nitrile hydratase of Pseudomonas chlororaphis B23. Purification and characterization. Eur. J. Biochem. 162, 691-698
121 Honda, J., Teratani, Y., Kobayashi, M., Nagamune, T., Sasabe, H., Hirata, A., Ambe, F. and Endo, I. (1992) Light-induced oxidation of iron atoms in a photosensitive nitrile hydratase. FEBS Lett. 301, 177-180
122 Nagasawa, T., Ryuno, K. and Yamada, H. (1986) Nitrile hydratase of Brevibacterium sp. R312. Purification and characterization. Biochem. Biophys. Res. Commun. 139, 1305-1312
123 Nagasawa, T., Takeuchi, K. and Yamada, H. (1988) Occurrence of a cobalt-induced and cobalt-containing nitrile hydratase in Rhodococcus rhodochrous J1. Biochem. Biophys. Res. Comm. 155, 1008-1016
124 Hook, R. H. and Robinson, W. G. (1964) Ricinine nitrilase II. Purification and properties. J. Biol. Chem. 239, 4263-4267
125 Duran, R., Nishiyama, M., Horinouchi, S. and Beppu, T. (1993) Characterization of nitrile hydratase genes cloned by DNA screening from Rhodococcus erythropolis. Biosci. Biotech. Biochem. 57, 1323-1328
126 Gasteiger, E., Hoogland, C., Gattiker, A., Duvaud, S., Wilkins, M. R., Appel, R. D. and Bairoch, A. (2005) Protein Identification and Analysis Tools on the ExPASy Server. In The Proteomics Protocols Handbook (Walker, J. M., ed.), pp. 571-607, Humana Press
127 Harper, D. B. (1976) Purification and properties of an unusual nitrilase from Nocardia NCIB 11216. Biochem. Soc. Trans. 4, 502-594
128 Trott, S., Bauer, R., Knackmuss, H.-J. and Stolz, A. (2001) Genetic and biochemical characterization of an enantioselective amidase from Agrobacterium tumefaciens strain d3. Microbiology 147, 1815-1824
129 Payne, M. S., Wu, S., Fallon, R. D., Tudor, G., Stieglitz, B., Turner, I. M., Jr. and Nelson, M. J. (1997) A stereoselective cobalt-containing nitrile hydratase. Biochemistry 36, 5447-5454
130 Endo, T. and Watanabe, I. (1989) Nitrile hydratase of Rhodococcus sp. N-774 - purification and amino acid sequences. FEBS Lett. 243, 61-64
131 Jandhyala, D., Berman, M., Meyers, P. R., Sewell, B. T., Willson, R. C. and Benedik, M. J. (2003) CynD, the Cyanide Dihydratase from Bacillus pumilus: Gene Cloning and Structural Studies. Appl. Environ. Microbiol. 69, 4794-4805
132 Kobayashi, M. and Shimizu, S. (1999) Cobalt proteins. Eur. J. Biochem. 261, 1-9133 Kato, Y., Yoshida, S., Xie, S. X. and Asano, Y. (2003) Aldoxime dehydratase co-
existing with nitrile hydratase and amidase in the iron-type nitrile hydratase-producer Rhodococcus sp. N-771. J. Biosci. Bioeng. 97, 250-259
134 Amarant, T., Vered, Y. and Bohak, Z. (1989) Substrates and inhibitors of the nitrile hydratase and amidase of Corynebacterium nitrilophilus. Biotechnol. Appl. Biochem. 11, 49-59
135 Goldlust, A. and Bohak, Z. (1989) Induction, purification, and characterization of the nitrilase of Fusarium oxysporum f.sp. melonis. Biotech. Appl. Biochem. 11, 581-601
136 Osswald, S., Wajant, H. and Effenberger, F. (2002) Characterization and synthetic applications of recombinant AtNIT1 from Arabidopsis thaliana. Eur. J. Biochem. 269, 680-687
References 135


![[PPT]PowerPoint Presentation · Web viewcarboxylic acids and ammonia by nitrilase (EC 3.5.5.1) In the second, nitrile hydratase (EC 4.2.1.84) catalyzes nitriles to amides which are](https://img.pdfslide.net/doc/110x75/5af616a07f8b9a9e598ef2ce/pptpowerpoint-presentation-viewcarboxylic-acids-and-ammonia-by-nitrilase-ec-3551.jpg)