Embed Size (px)
Citation preview
Discrete Element Modelling in Rock Slope Stability Analysis.
Rini A. Abdullah*, Mohd For Mohd Amin, Ahmad S A Rashid
Department of Geotechnics & Transportation, Faculty of Civil Engineering, Universiti Teknologi
Malaysia, 81310 Johor Bahru, Johor, Malaysia
* Corresponding author e-mails: [email protected], [email protected]
Notation list: = Strain b = Basic friction angle
= Maximum deformation of slope r = Residual friction angle
H = Total height of the slope Jkn = Joint normal stiffness
E = Young’s modulus Jks = Joint shear stiffness
= Poison’s ratio f = Dip of the slope face
c = Cohesion d = Dip of the discontinuity
Abstract
Evidence of a complex failure mechanism which involved both a distinct planar sliding surface, in
addition to block-flexural toppling has contributed to the instability at a Penrhyn slate quarry. The
objective of this study is to identify parameters that control instability in the rock slope, which has
been based on the parametric analysis of Discrete Element Method (DEM). The methodologies
combine the discrete element method of analysis together with field observation. From the study, it
was found that, factors that controlling rock slope instability are dip of discontinuity, water,
weathering grade and slope angle. The results supported the evidence from the Penrhyn failed slope,
where the modelling has confirmed the influence of structurally dipping at 78 of cleavage in slate and
the water that fills in the crack and developed the water pressure that triggered the failure.
Keywords: Discrete element method, UDEC, rock slope, block-flexural toppling
Introduction
In rock slope stability, there is no single parameter which dominates the rock slope behaviour. Rather,
a combination of properties determines the slope behaviour [1-13]. Therefore, a robust type of
analysis is required to represent the behaviour of rock slopes. Broad selections of analysis types are
available, which includes limit equilibrium, kinematics and probability approaches and now more
recently, the numerical types of analysis which covers finite element and discrete element methods
[14-20].The discrete element method which allowed modelling and analysis of the rock mass as a
discontinuum is considered be an alternative way of understanding rock slope behaviour. It also has
found to give good agreement with the real-world conditions [21-25]. Since the rock masses consist of
an assemblage of blocks with discontinuities, it would be reasonable to analyse and predict the
stability of the rock slope using this method
Penrhyn Quarry Slope
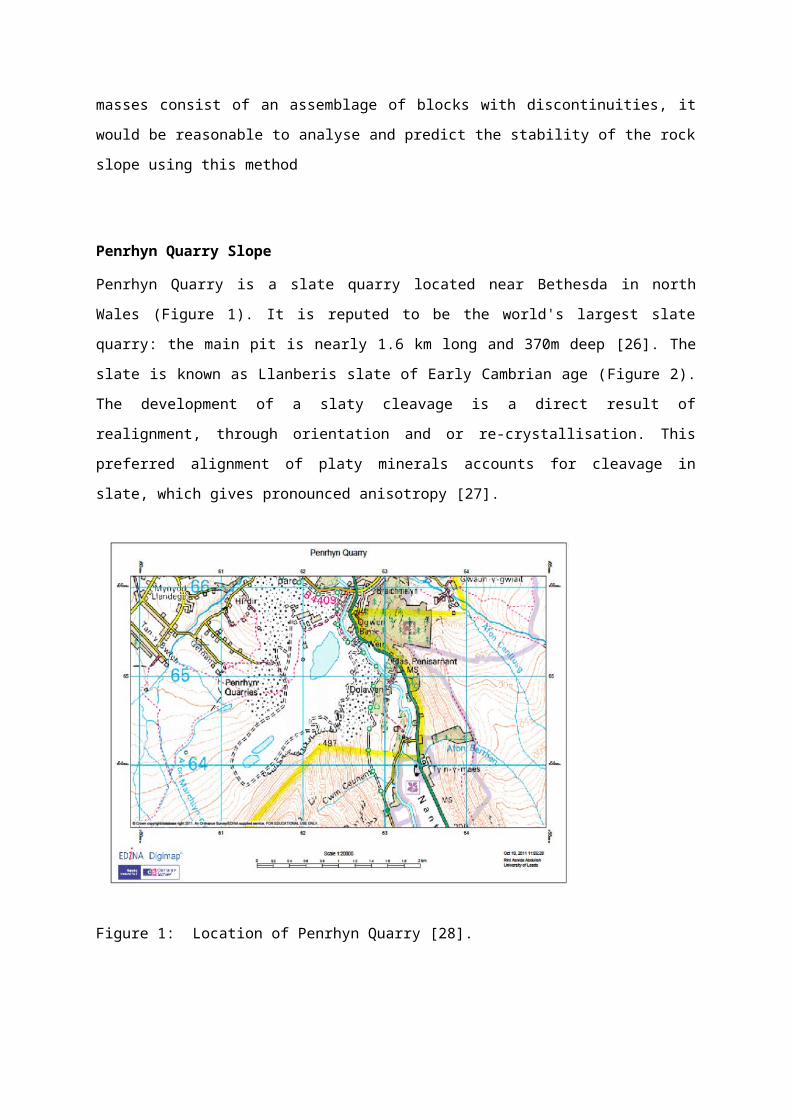
Penrhyn Quarry is a slate quarry located near Bethesda in north Wales (Figure 1). It is reputed to be
the world's largest slate quarry: the main pit is nearly 1.6 km long and 370m deep [26]. The slate is
known as Llanberis slate of Early Cambrian age (Figure 2). The development of a slaty cleavage is a
direct result of realignment, through orientation and or re-crystallisation. This preferred alignment of
platy minerals accounts for cleavage in slate, which gives pronounced anisotropy [27].
Figure 1: Location of Penrhyn Quarry [28].
TILLD
LLBS
Made ground
Igneous intrusion
N
BGR
Legend: Rock unit Age
Till Devensian (TILLD) Devensian
Llanberis Slates Formation (LLBS) Early Cambrian
Bronllwyd Grit Formation (BGR) Late Cambrian
Figure 2: Geology of Penrhyn Quarry [28].
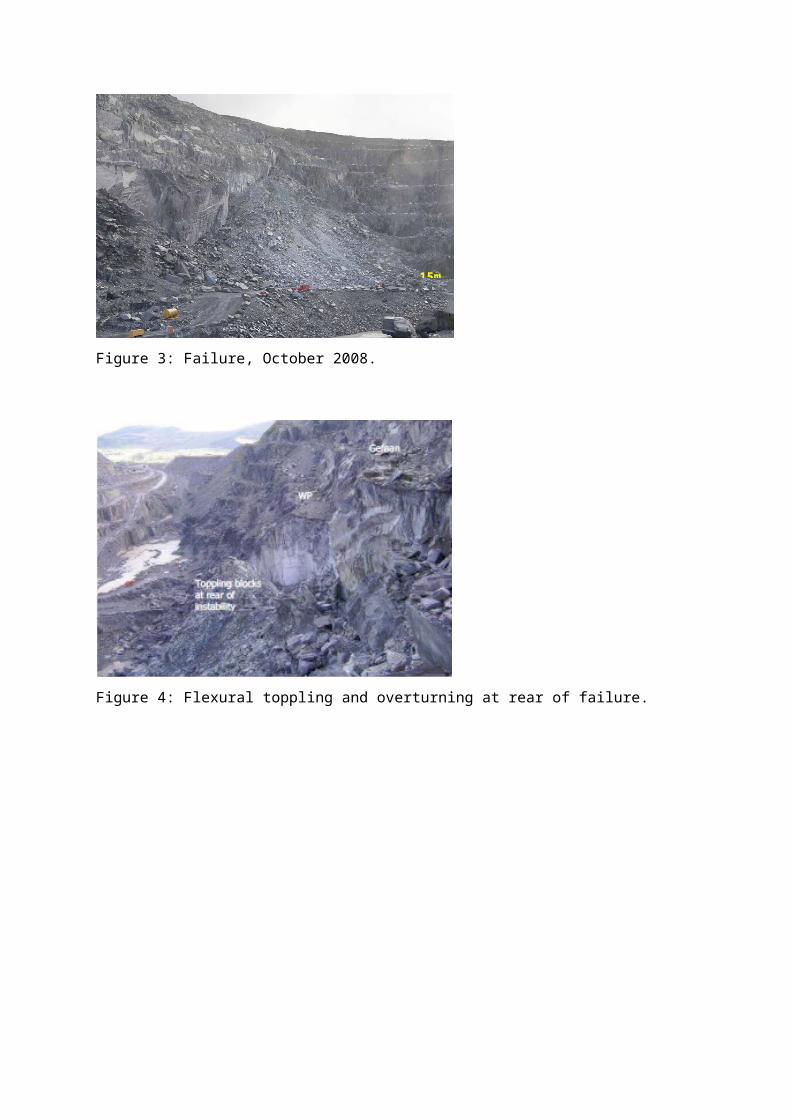
The south-eastern faces have been the site of a series of large historic slope failures in both the North
and South Quarries over the past 100 years. Following a significant failure in the North Quarry in
1989 this area was closed and the workings were then concentrated in the South Quarry. The most
recent instability occurred overnight on 2nd October 2008, with a secondary movement reported to
have occurred during 5th October 2008, see Figures 3 to 5.
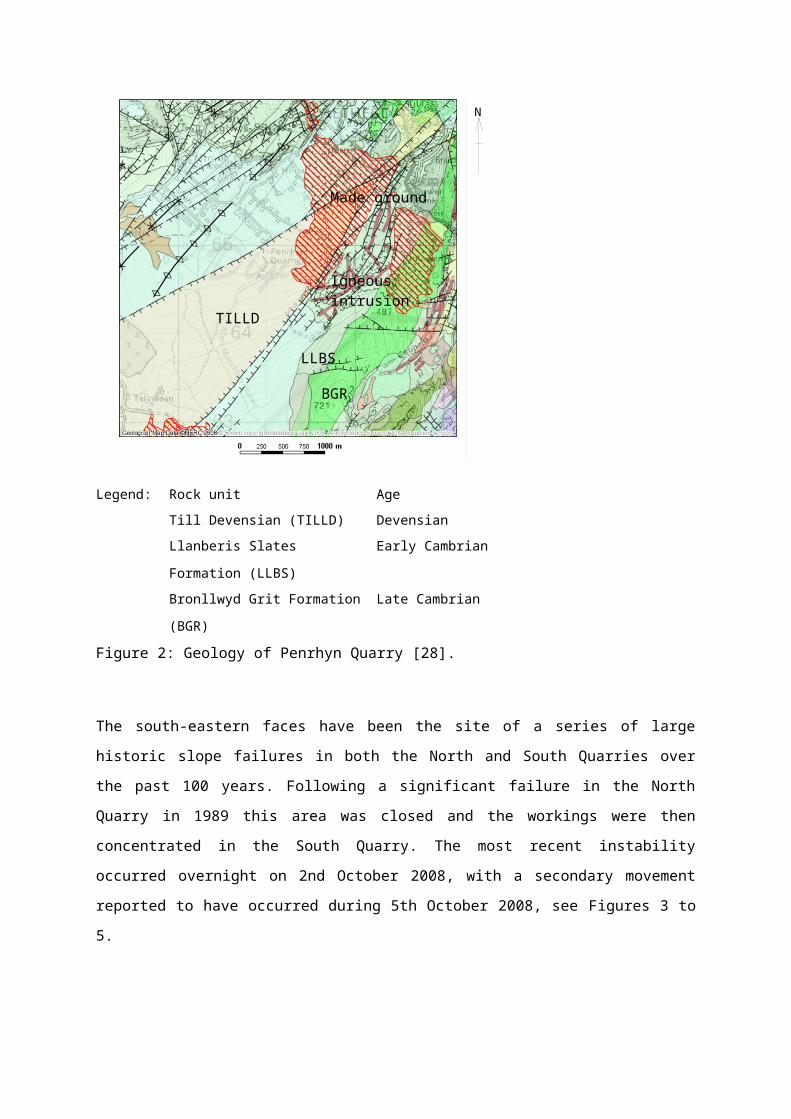
Figure 3: Failure, October 2008.
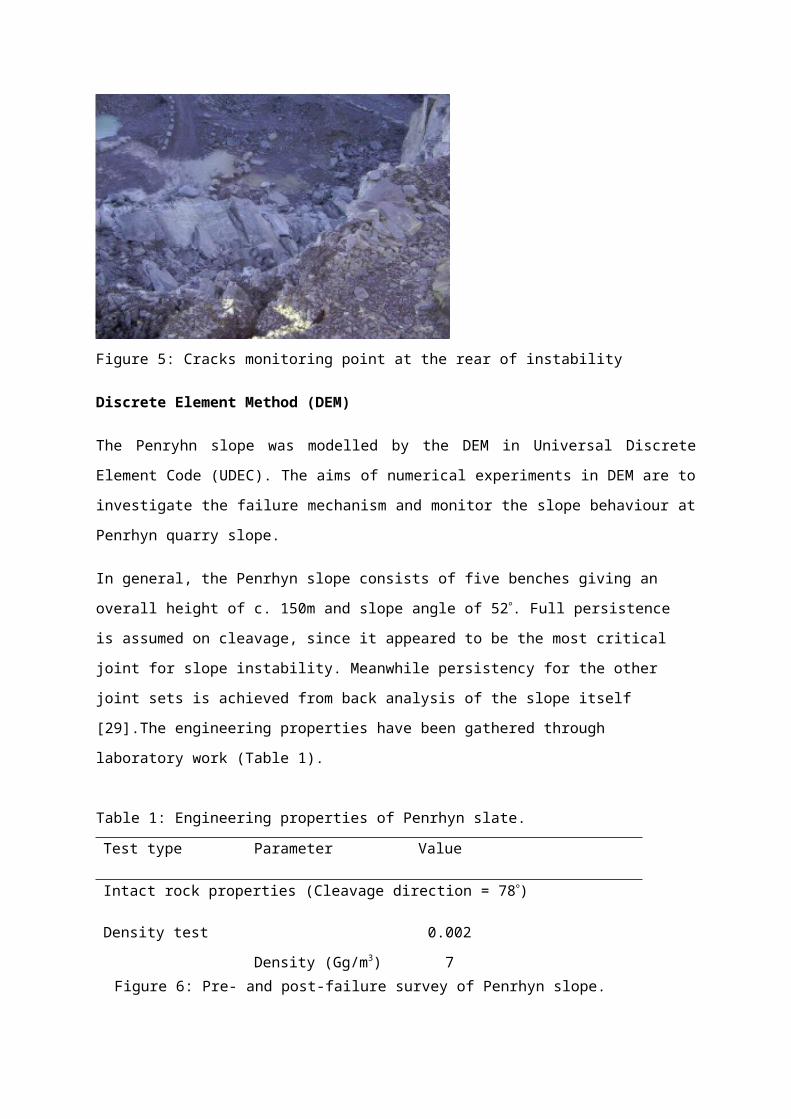
Figure 4: Flexural toppling and overturning at rear of failure.
Figure 5: Cracks monitoring point at the rear of instability
15m
Discrete Element Method (DEM)
The Penryhn slope was modelled by the DEM in Universal Discrete Element Code (UDEC). The aims
of numerical experiments in DEM are to investigate the failure mechanism and monitor the slope
behaviour at Penrhyn quarry slope.
In general, the Penrhyn slope consists of five benches giving an overall height of c. 150m and slope
angle of 52. Full persistence is assumed on cleavage, since it appeared to be the most critical joint for
slope instability. Meanwhile persistency for the other joint sets is achieved from back analysis of the
slope itself [29].The engineering properties have been gathered through laboratory work (Table 1).
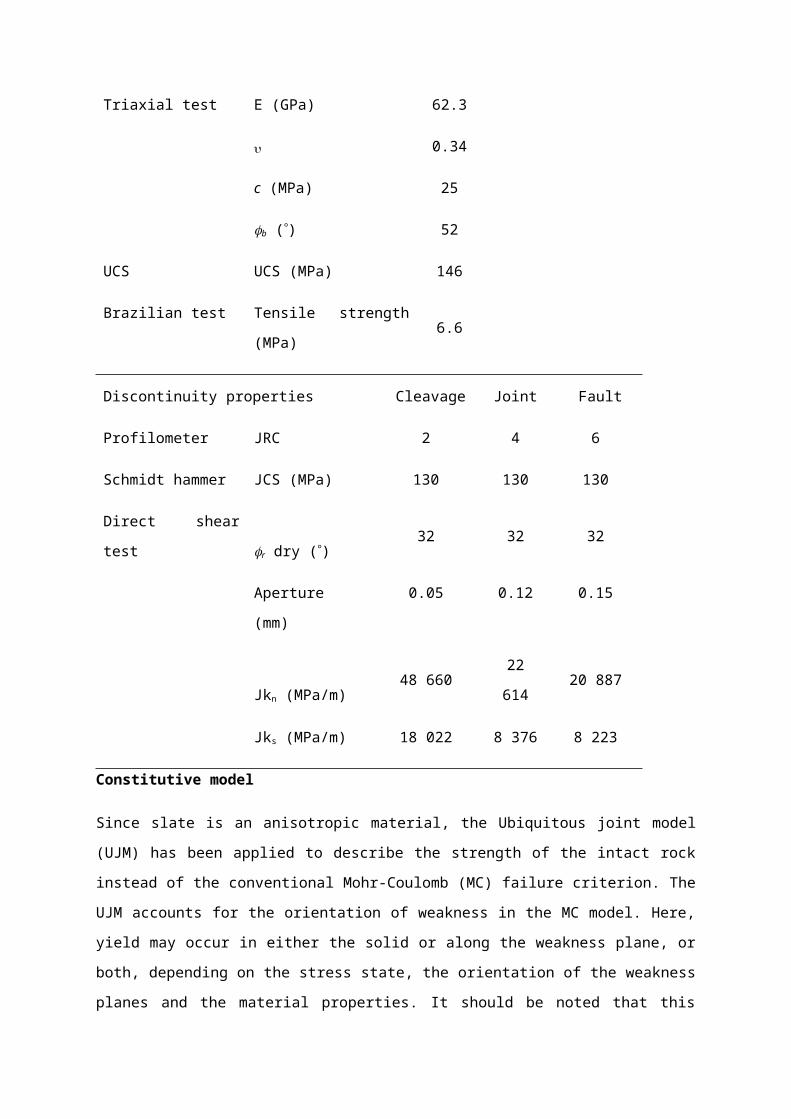
Table 1: Engineering properties of Penrhyn slate.
Test type Parameter Value
Intact rock properties (Cleavage direction = 78)
Density test Density (Gg/m3) 0.0027
Triaxial test E (GPa) 62.3
0.34
c (MPa) 25
b () 52
UCS UCS (MPa) 146
Brazilian test Tensile strength (MPa) 6.6
Discontinuity properties Cleavage Joint Fault
Profilometer JRC 2 4 6
Schmidt hammer JCS (MPa) 130 130 130
Direct shear test r dry () 32 32 32
Aperture (mm) 0.05 0.12 0.15
Jkn (MPa/m) 48 660 22 614 20 887
Jks (MPa/m) 18 022 8 376 8 223
Figure 6: Pre- and post-failure survey of Penrhyn slope.
Constitutive model
Since slate is an anisotropic material, the Ubiquitous joint model (UJM) has been applied to describe
the strength of the intact rock instead of the conventional Mohr-Coulomb (MC) failure criterion. The
UJM accounts for the orientation of weakness in the MC model. Here, yield may occur in either the
solid or along the weakness plane, or both, depending on the stress state, the orientation of the
weakness planes and the material properties. It should be noted that this model does not account for
the specific location of a weakness plane, only an orientation [30]. Additional input parameters should
be assigned in the model properties which are dip of the discontinuity (78) and discontinuity friction
angle (32).
The Barton-Bandis (BB) joint model has been applied to the discontinuity. This criterion describes the
strength of a discontinuity surface and it depends on the combined effects of the surface roughness,
rock strength at the surface, the applied normal stress and the amount of shear displacements. A series
of comparitive models between MC and BB joint models for the Penrhyn slope have been previously
published [29]. The BB criterion is also found to be better in describing the joint behaviour because of
its non-linearity [17, 21]. Data for the BB joint model has been given in Table 1.
Initial model
The initial model was built based on the pre-failure survey without considering of any tension crack
developed due to the presence of water. The excavation stage is simulated to generate the most
appropriate in situ stress condition. Five excavation stages have been performed on the model with
regards to the slope benches. Higher density of discontinuity was assigned around the slope face for
modelling purposes. Any small released rock block near the slope face will be also removed to avoid
a misleading result.
Adding complexity to the model
The complexities of the model are add-ons, i.e. by introducing the tension crack, increase in level of
the water table and applying water pressure in the tension crack; they are added subsequently into the
model. The tension crack is applied by increasing the aperture width [31]. Since there is no
information for the measurement of the water table, by referring to Figure 4, which shows water form
at the base of the slope, so, it is assumed that the water table to be at 1/3 and 2/3 of the slope height.
Therefore, the water table is applied to the slope at 50m and then increased to 100m from the toe by
using a command of the pore pressure boundary. The calculation of water pressure for the BB joint
model can be performed through the aperture properties assigned [31].
Penrhyn modelling results and discussions
The strain criterion approach has been considered as an additional means to assess the stability
performance of open pit slopes [32]. In real slopes, the strain approach is based on the correlation
value from target prism monitoring data, whereas in numerical modelling, the calculation of strain is
obtained from the given block deformation value. Slope strain is as in Equation 1. The suggested
strain threshold value is shown in Table 2[32].
ε= ΔχH
∗100Equation 1
where is the maximum deformation of the slope and H is the total height of the slope.
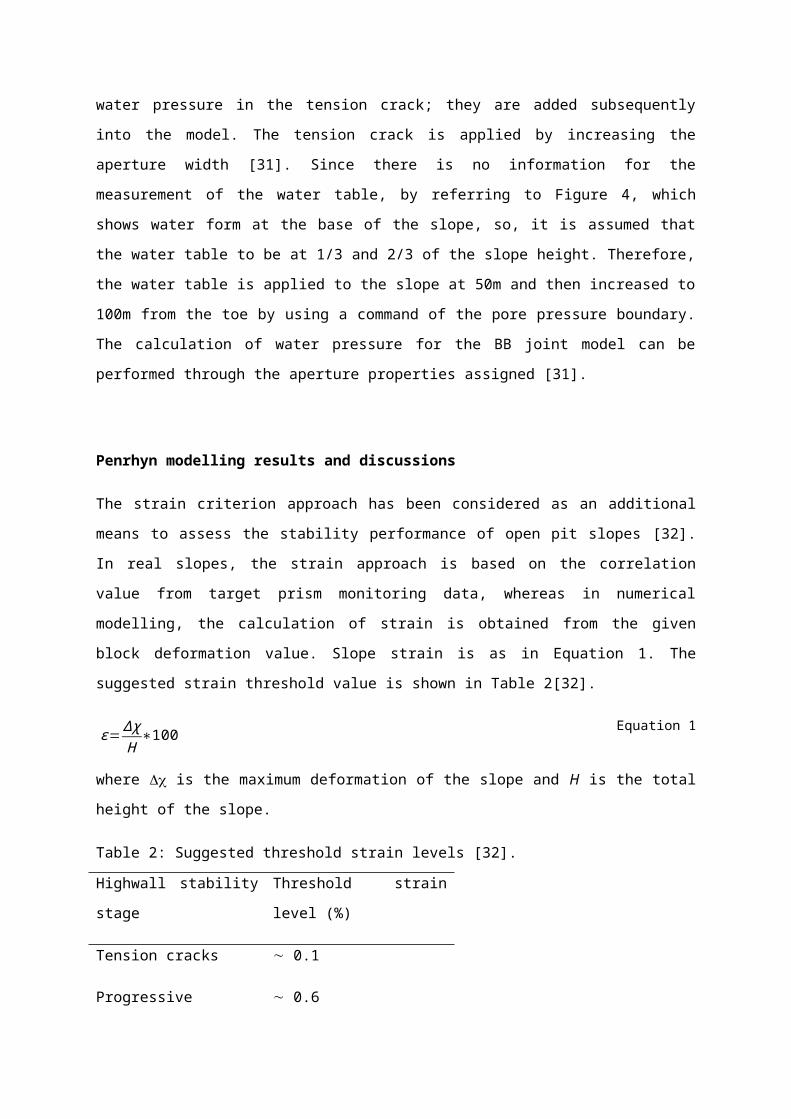
Table 2: Suggested threshold strain levels [32].
Highwall stability stage Threshold strain level (%)
Tension cracks 0.1
Progressive movements 0.6
Collapse > 2.0
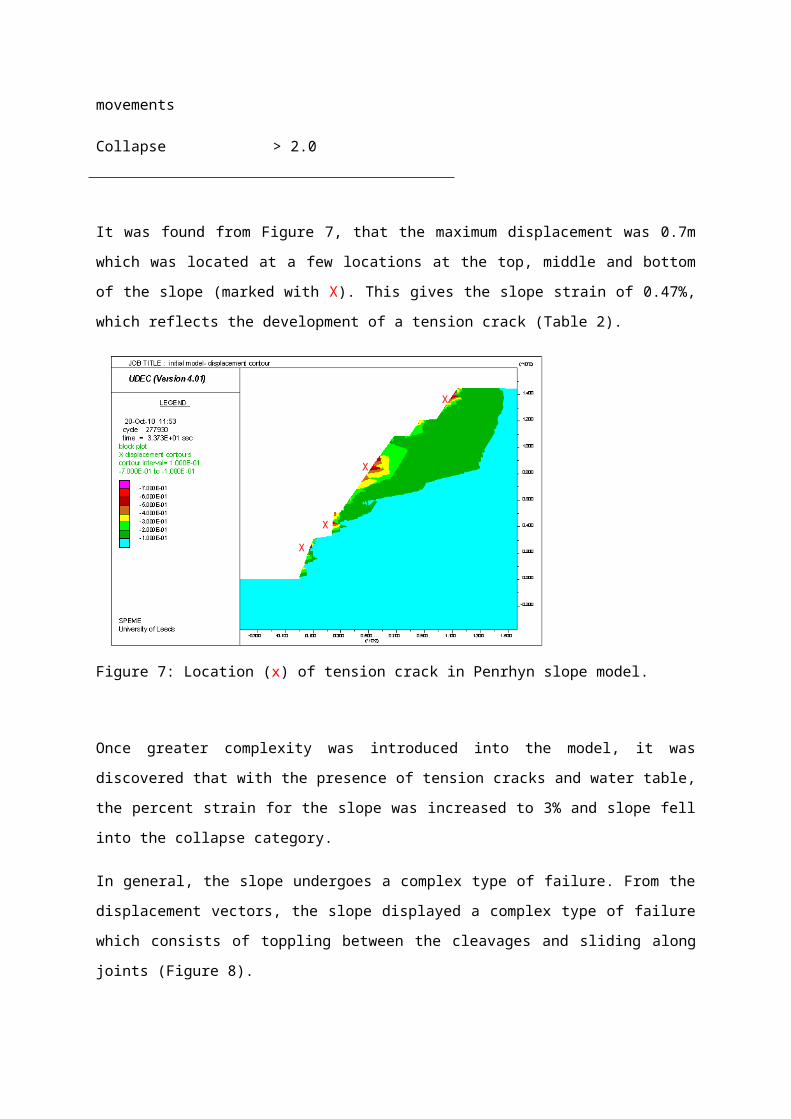
It was found from Figure 7, that the maximum displacement was 0.7m which was located at a few
locations at the top, middle and bottom of the slope (marked with X). This gives the slope strain of
0.47%, which reflects the development of a tension crack (Table 2).
X
X
X
X
toppling
sliding
Figure 7: Location (x) of tension crack in Penrhyn slope model.
Once greater complexity was introduced into the model, it was discovered that with the presence of
tension cracks and water table, the percent strain for the slope was increased to 3% and slope fell into
the collapse category.
In general, the slope undergoes a complex type of failure. From the displacement vectors, the slope
displayed a complex type of failure which consists of toppling between the cleavages and sliding
along joints (Figure 8).
Figure 8: Vectors show the direction of block movement.
Shearing along cleavageCompression and bending of the column
It is believed that block flexural toppling was the mode of failure. Block flexural toppling is bounded
by the basal failure plane and the movement is also influenced by displacement on the cross joint. As
can be seen in Figure 9, the failure depth is at about 15m. At the toe, joints start to slip and block
rotation can also be observed.
Further movement of the slope takes place when a water table was present at a depth of 100m. The
water that filled in the crack pushed the block further and the slope failed with a maximum
displacement of 3m. Shearing of blocks which involves the rotation is illustrated in Figure 10. It
shows that the larger block at (A) slides and rotated a higher degree thus acts as a chisel causing the
block at the front to slide along the daylighting joint. Further toppling also triggers the cleavage to
compress and bend. Opening up the cleavage is due to tensile failure.
UDEC output Description
UDEC (Version 4.01)
LEGEND
19-Nov-10 15:41 cycle 277930 time = 3.373E+01 sec flow time = 3.373E+01 secblock plot no. zones : total 1891at yield surface (*) 0yielded in past (X) 1265tensile failure (o) 0UB joint slip (+) 433UB tens. fail (v) 50
0.000
0.200
0.400
0.600
0.800
1.000
(*10^2)
0.100 0.300 0.500 0.700 0.900(*10^2)
JOB TITLE : Penrhyn_water at 100m_20000 cycle
SPEME University of Leeds
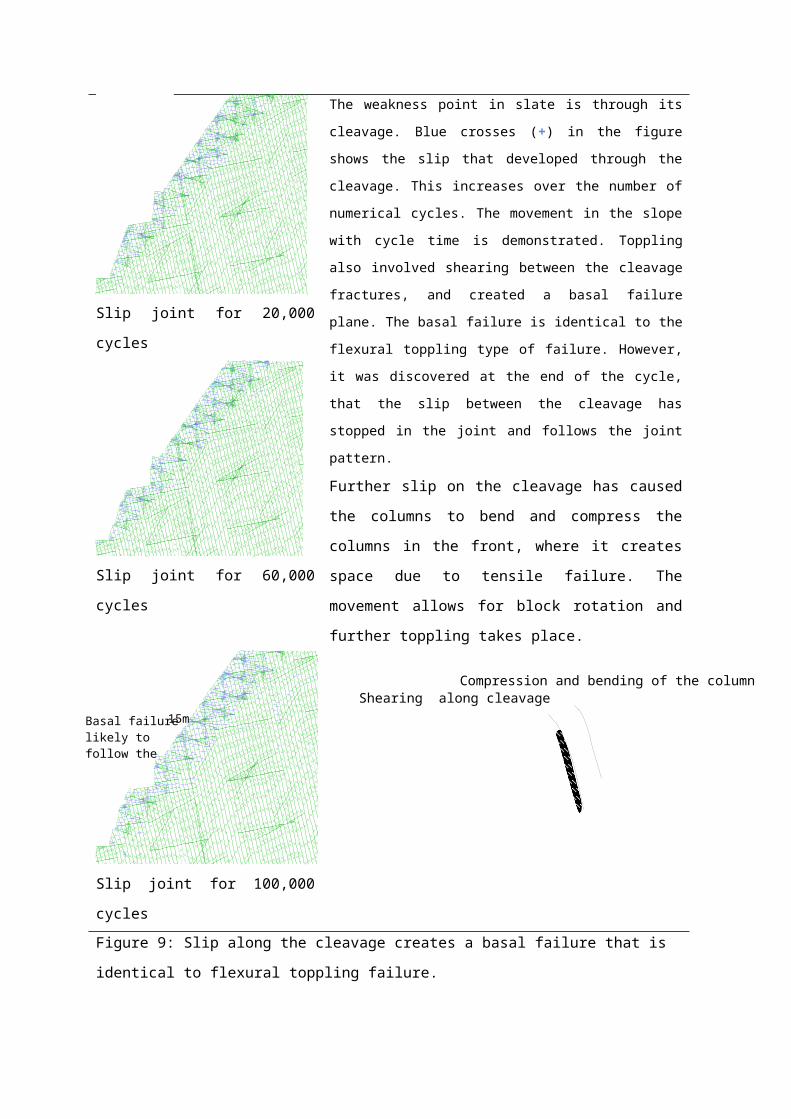
The weakness point in slate is through its cleavage. Blue crosses
(+) in the figure shows the slip that developed through the
cleavage. This increases over the number of numerical cycles.
The movement in the slope with cycle time is demonstrated.
Toppling also involved shearing between the cleavage fractures,
and created a basal failure plane. The basal failure is identical to
the flexural toppling type of failure. However, it was discovered
at the end of the cycle, that the slip between the cleavage has
stopped in the joint and follows the joint pattern.
Further slip on the cleavage has caused the columns to bend
and compress the columns in the front, where it creates
space due to tensile failure. The movement allows for block
rotation and further toppling takes place.
Slip joint for 20,000 cycles
UDEC (Version 4.01)
LEGEND
19-Nov-10 14:55 cycle 377930 time = 4.562E+01 sec flow time = 4.562E+01 secblock plot no. zones : total 1892at yield surface (*) 0yielded in past (X) 1210tensile failure (o) 0UB joint slip (+) 472UB tens. fail (v) 70
0.000
0.200
0.400
0.600
0.800
1.000
(*10 2̂)
0.100 0.300 0.500 0.700 0.900(*10 2̂)
JOB TITLE : Penrhyn_water at 100m_60000 cycle
SPEME University of Leeds
Slip joint for 60,000 cycles
(A) (A)
Due to sliding and rotation the block chiselled up the front block to move forward.(A)
UDEC (Version 4.01)
LEGEND
20-Oct-10 19:20 cycle 457930 time = 5.513E+01 sec flow time = 5.513E+01 secblock plot no. zones : total 1892at yield surface (*) 0yielded in past (X) 1151tensile failure (o) 0UB joint slip (+) 541UB tens. fail (v) 63
0.000
0.200
0.400
0.600
0.800
1.000
(*10^2)
0.100 0.300 0.500 0.700 0.900(*10^2)
JOB TITLE : Penrhyn_water at 100m_100000 cycle
SPEME University of Leeds
Slip joint for 100,000 cycles
Figure 9: Slip along the cleavage creates a basal failure that is identical to flexural toppling failure.
UDEC output Description
UDEC (Version 4.01)
LEGEND
19-Nov-10 15:41 cycle 277930 time = 3.373E+01 sec flow time = 3.373E+01 secblock plot block rotations maximum = 3.318E+00
0.000
1.000
2.000
3.000
4.000
5.000
6.000
(*10 1̂)
0.500 1.500 2.500 3.500 4.500 5.500 6.500(*10 1̂)
JOB TITLE : Penrhyn_water at 100m_20000 cycle
SPEME University of Leeds
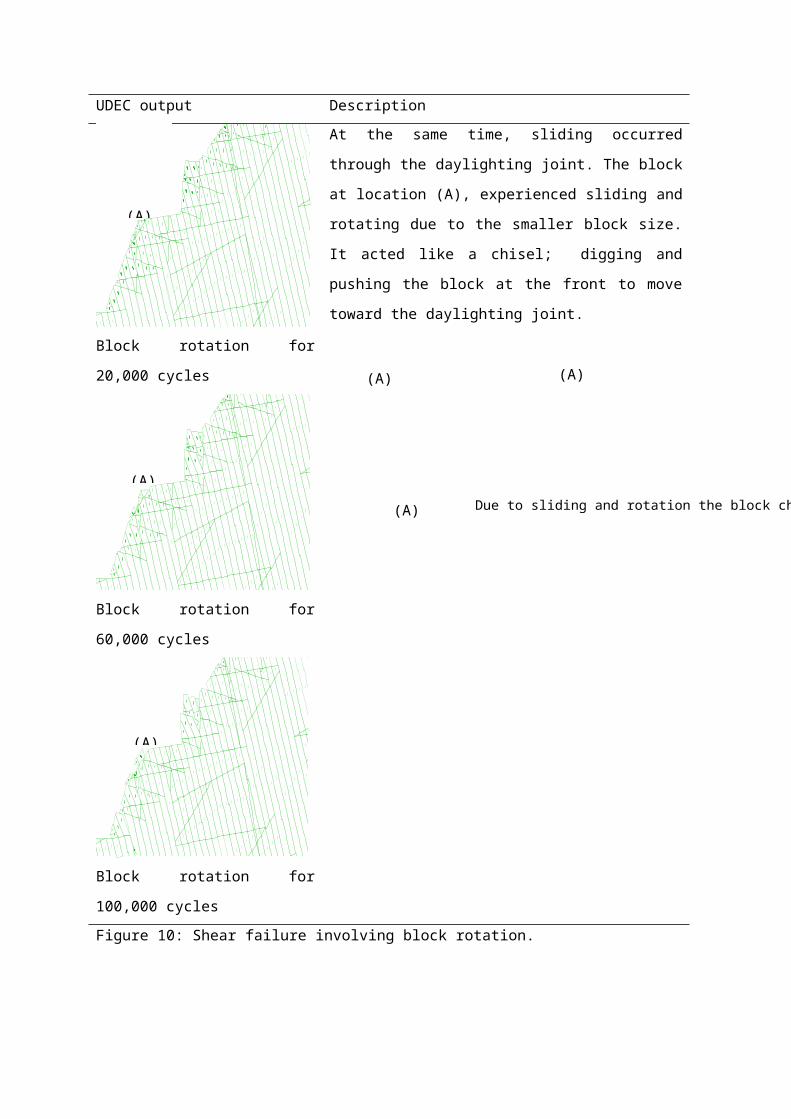
At the same time, sliding occurred through the daylighting
joint. The block at location (A), experienced sliding and
rotating due to the smaller block size. It acted like a chisel;
digging and pushing the block at the front to move toward
the daylighting joint.
Block rotation for 20,000 cycles UDEC (Version 4.01)
LEGEND
19-Nov-10 14:55 cycle 377930 time = 4.562E+01 sec flow time = 4.562E+01 secblock plot block rotations maximum = 1.436E+01
0.000
1.000
2.000
3.000
4.000
5.000
6.000
(*10^1)
0.500 1.500 2.500 3.500 4.500 5.500 6.500(*10^1)
JOB TITLE : Penrhyn_water at 100m_60000 cycle
SPEME University of Leeds
Block rotation for 60,000 cycles
Basal failure likely to follow the joint pattern
(A)
(A)
15m
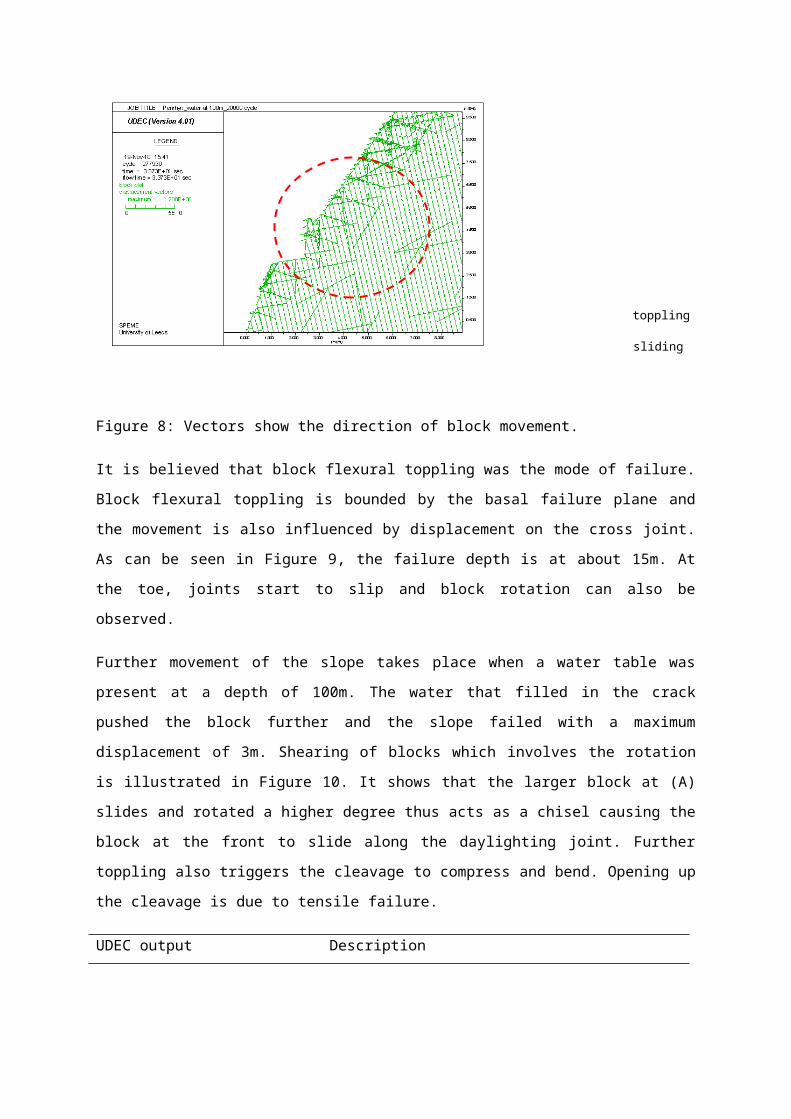
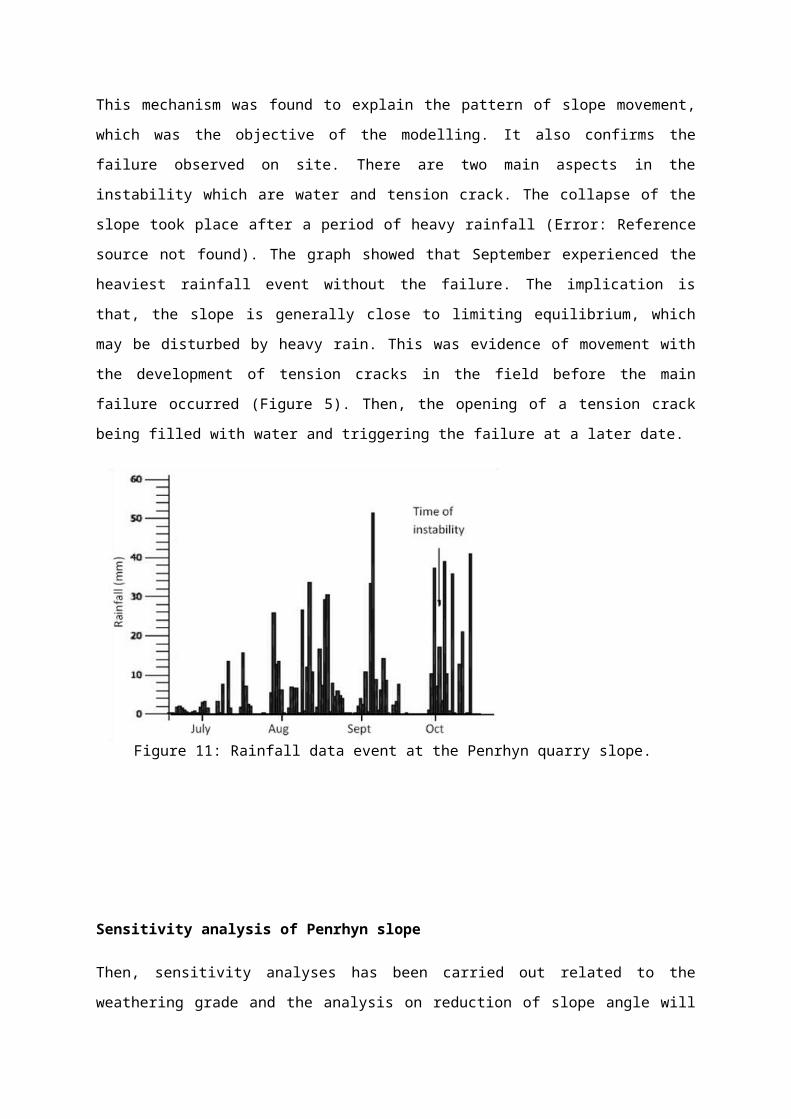
Figure 11: Rainfall data event at the Penrhyn quarry slope.
UDEC (Version 4.01)
LEGEND
20-Oct-10 19:20 cycle 457930 time = 5.513E+01 sec flow time = 5.513E+01 secblock plot block rotations maximum = 3.055E+01
0.000
1.000
2.000
3.000
4.000
5.000
6.000
(*10^1)
0.500 1.500 2.500 3.500 4.500 5.500 6.500(*10^1)
JOB TITLE : Penrhyn_water at 100m_100000 cycle
SPEME University of Leeds
Block rotation for 100,000 cycles
Figure 10: Shear failure involving block rotation.
This mechanism was found to explain the pattern of slope movement, which was the objective of the
modelling. It also confirms the failure observed on site. There are two main aspects in the instability
which are water and tension crack. The collapse of the slope took place after a period of heavy rainfall
(Error: Reference source not found). The graph showed that September experienced the heaviest
rainfall event without the failure. The implication is that, the slope is generally close to limiting
equilibrium, which may be disturbed by heavy rain. This was evidence of movement with the
development of tension cracks in the field before the main failure occurred (Figure 5). Then, the
opening of a tension crack being filled with water and triggering the failure at a later date.
(A)
Sensitivity analysis of Penrhyn slope
Then, sensitivity analyses has been carried out related to the weathering grade and the analysis on
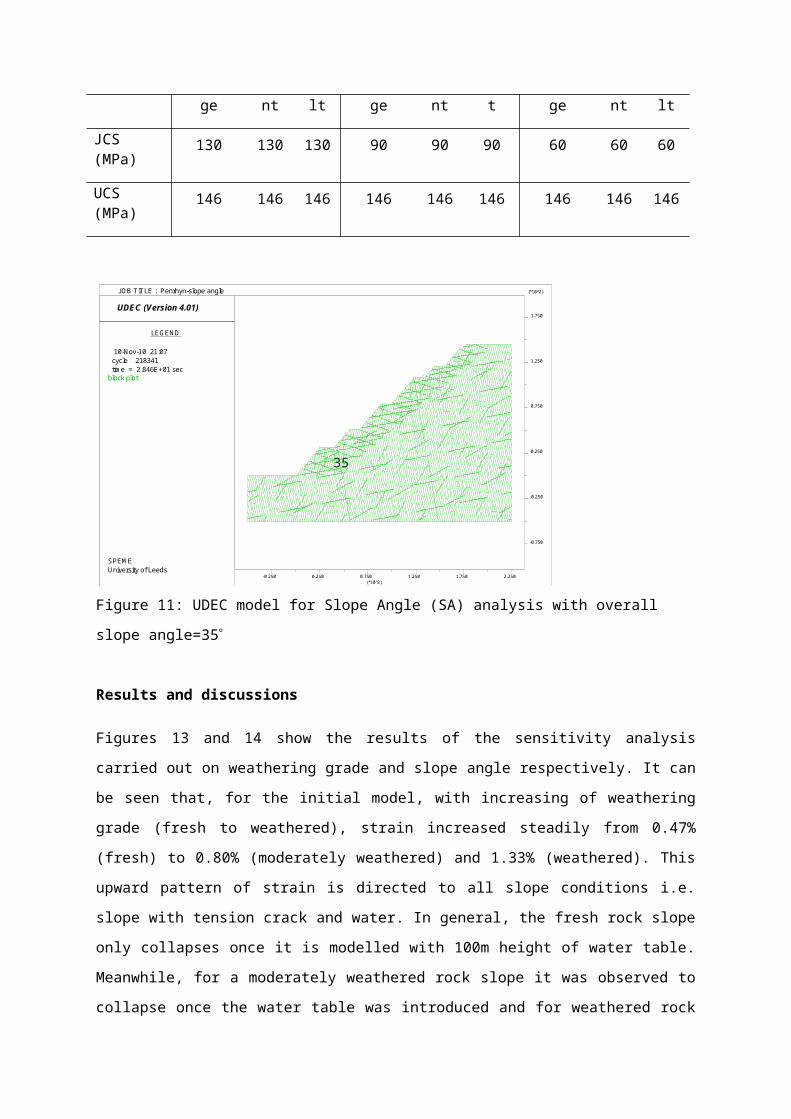
reduction of slope angle will also be carried out to see the effects of slope geometry on behaviour. The
analysis was performed by varying the value of one factor while all other factors remained constant.
The analyses were carried out to assess the slope behaviour when weathering takes place. The
weathering was assessed through the reduction of the JCS value () [33]. For simplification of analysis,
the weathering was assumed to be constant throughout the discontinuities (Table 4). In addition, the
assessment on the slope angle was also carried out to observe the effects of slope geometry
contributing to the instability of the slope. The overall slope angle was reduced from 52 to 35
(Figure 11). This includes flattening the individual slope at about 50 compared to initial individual
slope angle that range from 55 – 85. All the models were tested against four slope condition, i.e. 1)
initial model, 2) presence of tension crack, 3) presence of tension crack with water table at 50m and 4)
presence of tension crack with water table at 100m.
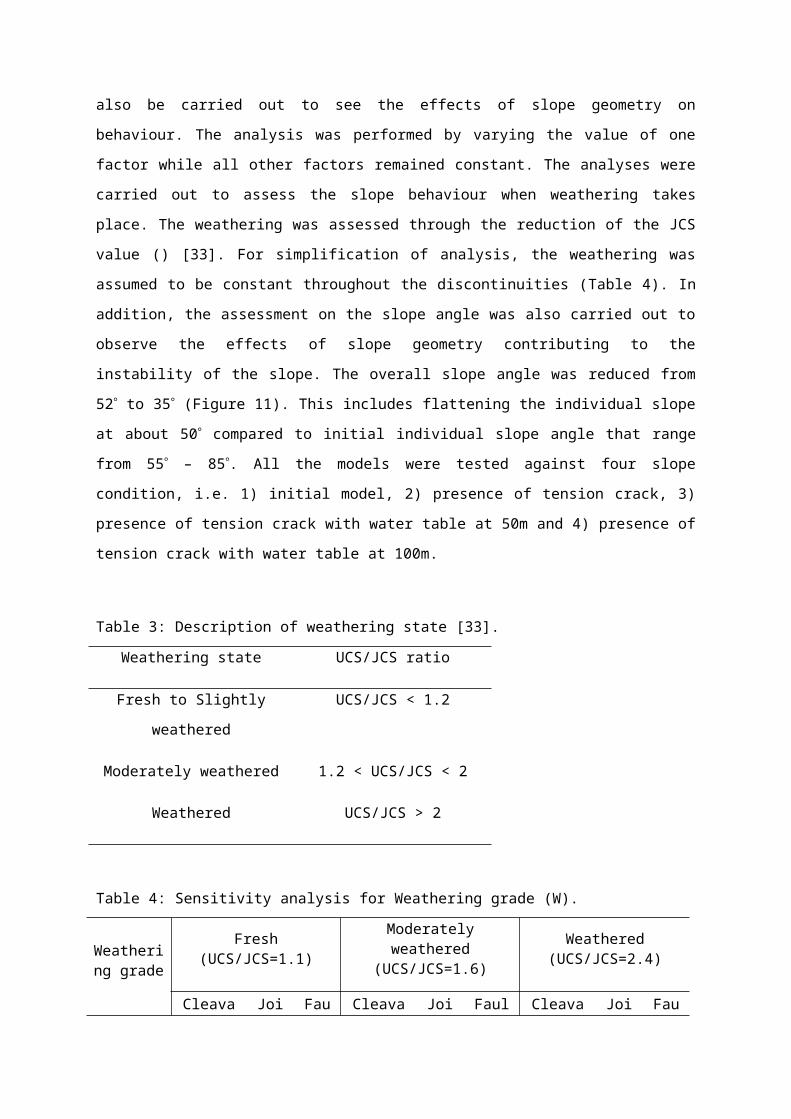
Table 3: Description of weathering state [33].
Weathering state UCS/JCS ratio
Fresh to Slightly weathered UCS/JCS < 1.2
Moderately weathered 1.2 < UCS/JCS < 2
Weathered UCS/JCS > 2
Table 4: Sensitivity analysis for Weathering grade (W).
Weathering grade
Fresh (UCS/JCS=1.1)
Moderately weathered (UCS/JCS=1.6)
Weathered (UCS/JCS=2.4)
Cleavage Joint Fault Cleavage Joint Fault Cleavage Joint Fault
JCS (MPa) 130 130 130 90 90 90 60 60 60
UCS (MPa) 146 146 146 146 146 146 146 146 146
35
UDEC (Version 4.01)
LEGEND
10-Nov-10 21:07 cycle 218341 time = 2.846E+01 secblock plot
-0.750
-0.250
0.250
0.750
1.250
1.750
(*10^2)
-0.250 0.250 0.750 1.250 1.750 2.250(*10^2)
JOB TITLE : Penrhyn-slope angle
SPEME University of Leeds
Figure 11: UDEC model for Slope Angle (SA) analysis with overall slope angle=35
Results and discussions
Figures 13 and 14 show the results of the sensitivity analysis carried out on weathering grade and
slope angle respectively. It can be seen that, for the initial model, with increasing of weathering grade
(fresh to weathered), strain increased steadily from 0.47% (fresh) to 0.80% (moderately weathered)
and 1.33% (weathered). This upward pattern of strain is directed to all slope conditions i.e. slope with
tension crack and water. In general, the fresh rock slope only collapses once it is modelled with 100m
height of water table. Meanwhile, for a moderately weathered rock slope it was observed to collapse
once the water table was introduced and for weathered rock slope, it was demonstrated that the slope
itself will collapse with only the presence of a tension crack in the slope.
It is evident that, the more weathered the rock mass, the more unstable the slope is. This can be
explained by changing the discontinuity strength. With lower JCS value, the asperities are more likely
to be sheared off and damaged rather than overriding. Unlike overriding the asperities, shearing of the
asperities will be encouraged by reduction of JCS and therefore promote movement.
With the presence of the tension crack, strain increased to almost double for all weathering states.
Opening the tension crack eliminates the rock to rock contact and reduces shear strength between the
discontinuities. Strain continues to increase when the water was introduced for 50m of the slope
height. Thus, with the presence of water at 100m, it does promote further movements of the slope.
What happened is, the water pressure reduces the shear strength, and this condition has been observed
from the laboratory tests [34]. The water also generates a force to push the block further. Water may
also wash away the filling material and left no rock to rock contact, and this will demolish the shear
strength and consequently, increased the instability.
Figure 12: Sensitivity analysis for weathering grade for the Penrhyn slope.
For the analysis of the effect on slope angle, the results show that by flattening the slope, the strain is
reduced for all slope conditions. In this case, the slope is found to be stable except that the tension
crack was developed for the slope that was modelled with a water table at 100m height.
Figure 13: Sensitivity analysis for the Penrhyn slope angle.
Conclusion
UDEC modelling provides a useful insight into the rock slope failure mechanism at Penrhyn slope,
where evidence of a complex failure mechanism has contributed to the instability. Generally, this
failure was dominant by a structurally dipping at 78 of cleavage in slate. The water then triggered the
failure when it fills in the crack and developed the water pressure that pushed the block movement.
This confirmed that dip of discontinuity and water are the significant parameter in controlling the rock
slope behaviour at Penrhyn. Further sensitivity analysis has confirmed the influence of water to the
rock slope instability. The analyses also demonstrate the effect of discontinuity orientation to the
slope behaviour. More study is needed to incorporate with other parameters that may contribute to the
rock slope behaviour such as block size and shape, joint roughness and excavation method.
References
1. Deere, D.U., et al. Design of surface and near surface construction in rock. in Proc. 8th U.S. Symp. Rock Mechanics, AIME. 1967. New York.
2. Wickham, G.E., H.R. Tiedemann, and E.H. Skinner. Support determination based on geological prediction. in Proc. Rapid ExcavationTunnelling Conference, AIME. 1972. New York.
3. Bieniawski, Z.T., Engineering rock mass classifications: a complete manual for engineers and geologists in mining, civil and petroleum engineering. 1989: John Wiley.
4. Barton, N., R. Lien, and J. Lunde, Engineering classification of rock masses for the design of tunnel support. Rock Mechanics, 1974. 6: p. 189 - 236.
5. Hoek, E. and E.T. Brown, Practical Estimates of rock mass strength. Int. J. Rock Mech. Min. Sci., 1997. 34(8): p. 1165-1186.
6. Palmstrom, A., Characterizing rock masses by RMi for use in practical rock engineering. Tunnelling and Underground Space Technology, 1996. 11(2): p. 175-188.
7. Romana, M., J.B. Seron, and E. Montalar, SMR Geomechanics classifcation: Application, experience and validation. ISRM 2003 - Technology Roadmap for Rock Mechanics, South African Institute of Mining and Metallurgy, 2003.
8. Laubscher, D.H., Geomechanics classification of jointed rock masses - mining application. Trans. Instn. Min. Metall. (Sect. A: Min. Industry), 1977. 86: p. A1 - A8.
9. Sonmez, H. and R. Ulusay, Modifications to the geological strength index (GSI) and their applicability to stability of slopes. Int. J. Rock Mech. Min. Sci., 1999. 36: p. 743-760.
10. Hudson, J.A. and J.P. Harrison, A new approach to studying complete rock engineering problems. Quarterly Journal of Engineering Geology, 1992. 25: p. 93-105.
11. Hack, R., D. Price, and N. Rengers, A new approached to rock slope stability - a probability classification (SSPC). Bulletin Engineering Geology Environment, 2003. 62: p. 167-184.
12. Nicholson, D.T., Rock Deterioration Assessment (RDA), in Department of Earth Science. 2000, University of Leeds. p. 367.
13. Pantelidis, L., An alternative rock mass classification system for rock slopes. Bulletin Engineering Geology Environment, 2010.
14. Li, X., Finite element analysis of slope stability using a nonlinear failure criterion. Computer and Geotechnics, 2007. 34: p. 127-136.
15. Alejano, L.R., et al., Comparison of limit equilibrium, numerical and physical models of wall slope stability. Inter. Journal of Rock Mechanics and Mining Sciences, 2011. 48: p. 16-26.
16. Cheng, Y.M., T. Lansivaara, and W.B. Wei, Two-dimensional slope stability analysis by limit equilibrium and strength reduction methods. Computers and Geotechnics, 2007. 34: p. 137-150.
17. Bhasin, R. and K. Hoeg, Parametric study for a large cavern in jointed rock using a distinct element model (UDEC - BB). Int. J. Rock Mech. Min. Sci., 1998. 35(1): p. 17-29.
18. Brideau, M.A., D. Stead, and R. Couture, Structural and engineering geology of East Gate Landslide, Purcell Mountains, British Columbia, Canada. Engineering Geology, 2006. 84: p. 183 - 206.
19. McCollough, M.F., Numerical modelling with UDEC of the footwall slope of Aznalcollar mine, Southern Spain., in Department of Mining & Mineral Engineering. 1993, University of Leeds. p. 143.
20. Preh, A. A UDEC model for "kink-band slumping" type failures of rock slopes. in Proc. of the 1st Int. UDEC/3DEC Symp.: Numerical Modelling of Discrete Materials in Geotechnical Engineering, Civil Eng. & Earth Sci. 2004: Taylor and Francis Group.
21. Choi, S.O. and S.K. Chung, Stability analysis of jointed rock slope with the Barton-Bandis constitutive model in UDEC. Int. J. Rock Mech. Min. Sci., 2004. 41(3): p. 1-6.
22. Allison, R.J. and O.G. Kimber, Modelling failure mechanism to explained rock slope change along the Isle of Purbeck Coast, UK. Earth Surface Processes and Landforms, 1998. 23: p. 731-750.
23. Mitani, Y., T. Esaki, and Y. Cai. A numerical study about flexure toppling phenomenon on rock slopes. in Proceedings of the 1st International UDEC/3DEC Symposium: Numerical Modelling of Discrete Materials in Geotechnical Engineering, Civil Engineering and Earth Science. 2004: Taylor & Francis Group.
24. Bhasin, R. and A.M. Kaynia, Static and dynamic simulation of a 700-m high rock slope in western Norway. Engineering Geology, 2004. 71: p. 213 - 226.
25. Tosney, J.R., et al., Verification of a large scale slope instability mechanism at Highland Valley Copper. International Journal of Mining, Reclamation and Environment, 2004. 18(4): p. 273 - 288.
26. Penrhyn Quarry. [cited 12 Nov 2010]; Available from: http://en.wikipedia.org/wiki/Penrhyn_Quarry.
27. Bell, F.G., Engineering Properties of Soils and Rocks. 1981, London: Butterworths. 149.28. Digimap. [cited 15th February 2009]; Available from: http://edina.ac.uk/digimap/.29. Abdullah, R.A., R.J. Fowell, and W. Murphy. Selecting shear strength models for joints -
experience with modelling of complex rock slope failure in UDEC . in EUROCK 2010. 2010. Switzerland: Taylor & Francis Group.
30. ITASCA, UDEC Version 4.01. 2004, Minnesota, USA: Itasca Consulting Group, Inc.31. Bhasin, R., Barton Bandis joint model in UDEC. 2008, Personal communication.32. Brox, D. and W. Newcomen, Utilizing strain criteria to predict highwall stability
performance. ISRM 2003 - Technology Roadmap for Rock Mechanics, South African Institute of Mining and Metallurgy, 2003: p. 157 - 161.
33. Bandis, S.C., A.C. Lumsden, and N.R. Barton, Fundamentals of rock joint deformation. Int. J. Rock Mech. Min. Sci., 1983. 20(6): p. 249-268.
34. Abdullah, R.A., Development of a slope classification system with particular reference to shallow rock slope failure, in School of Process, Environmental and Materials Engineering. 2011, University of Leeds: Leeds. p. 210.