Embed Size (px)
Citation preview
DiscreteProbability Distributions
Chapter 6
McGraw-Hill/Irwin Copyright © 2012 by The McGraw-Hill Companies, Inc. All rights reserved.
Binomial Probability DistributionA Widely occurring discrete probability distributionCharacteristics of a Binomial Probability Distribution
1. There are only two possible outcomes on a particular trial of an experiment.
2. The outcomes are mutually exclusive, 3. The random variable is the result of counts.4. Each trial is independent of any other trial
LO5 Describe and compute probabilities for a binomial distribution.
6-2
Binomial Probability Experiment1. An outcome on each trial of an experiment is
classified into one of two mutually exclusivecategories—a success or a failure.
2. The random variable counts the number of successes in a fixed number of trials.
3. The probability of success and failure stay the same for each trial.
4. The trials are independent, meaning that the outcome of one trial does not affect the outcome of any other trial.
LO5
6-3
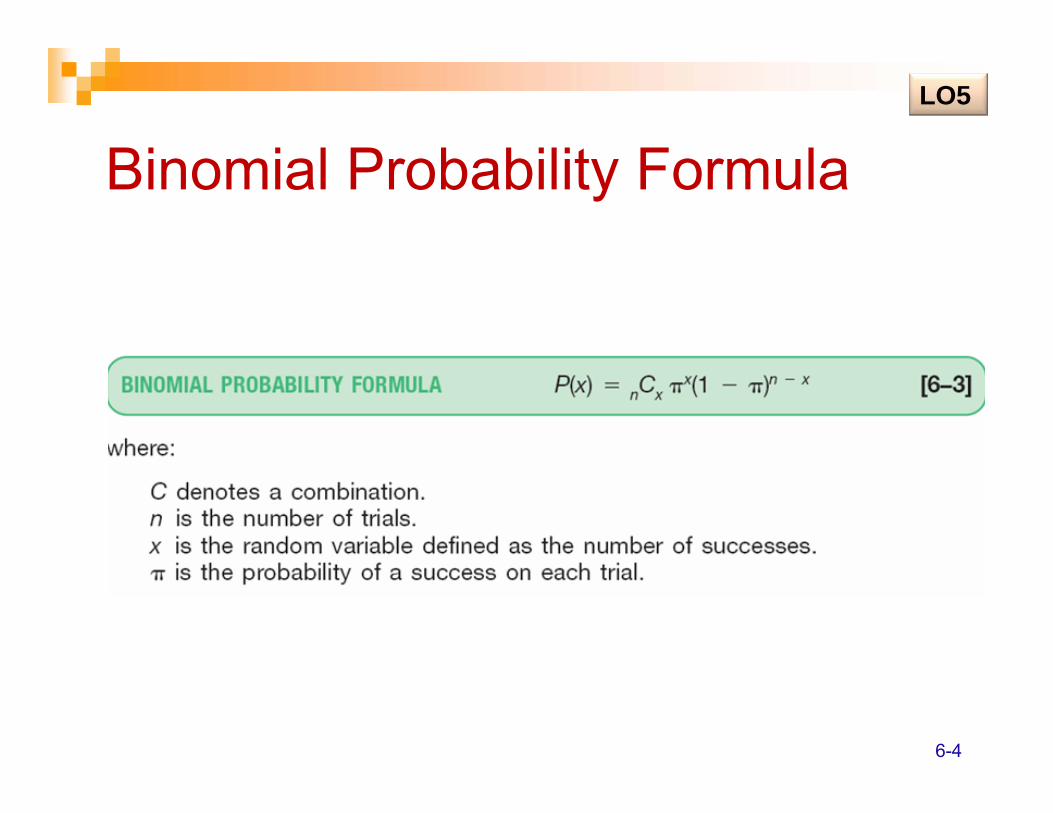
Binomial Probability FormulaLO5
6-4
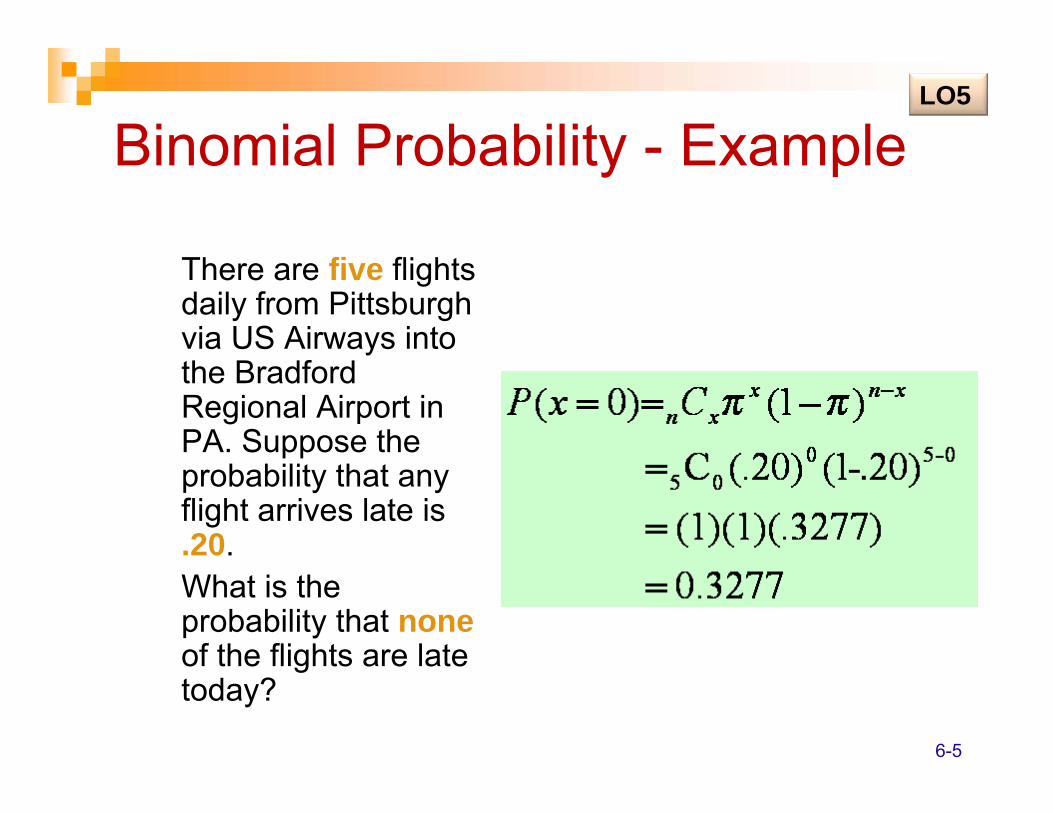
Binomial Probability - Example
There are five flights daily from Pittsburgh via US Airways into the Bradford Regional Airport in PA. Suppose the probability that any flight arrives late is .20. What is the probability that noneof the flights are late today?
LO5
6-5
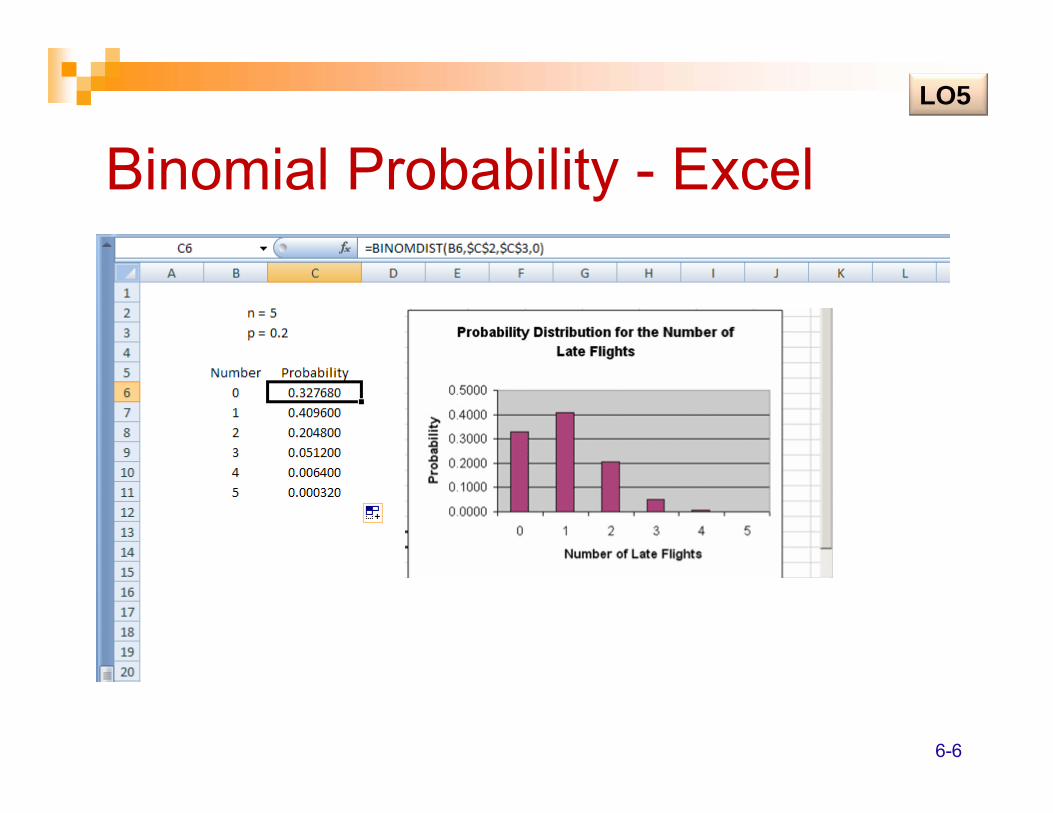
Binomial Probability - ExcelLO5
6-6
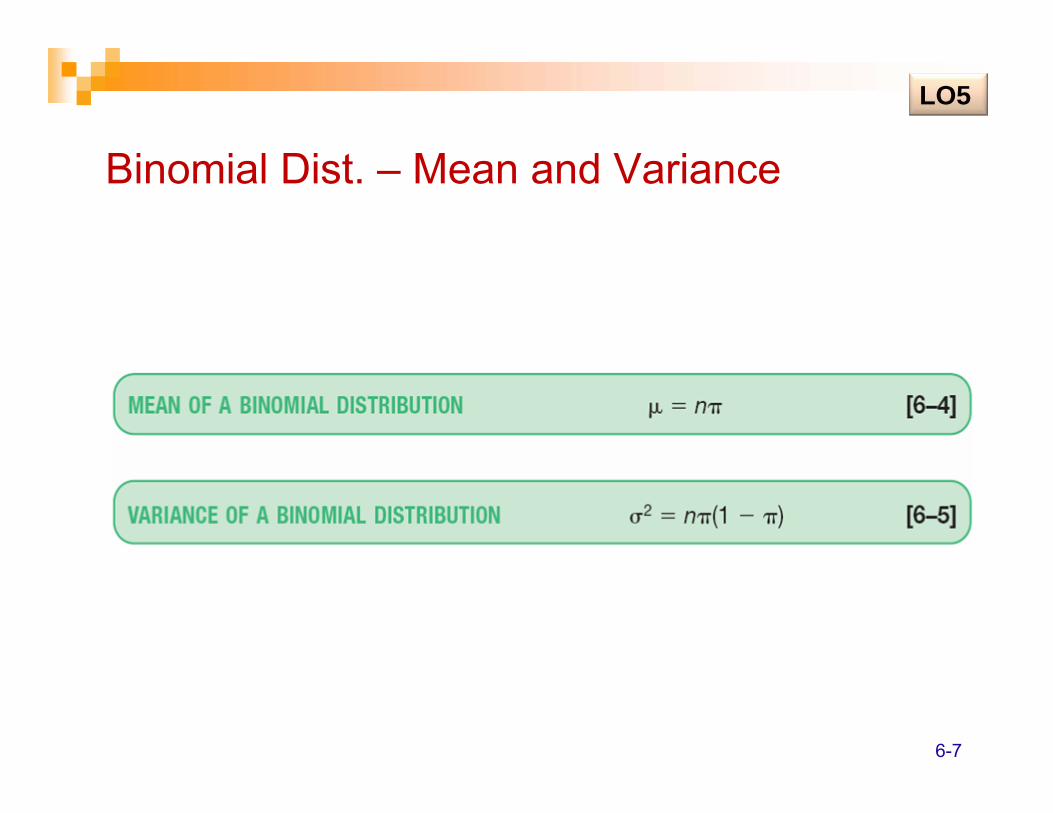
Binomial Dist. – Mean and Variance
LO5
6-7
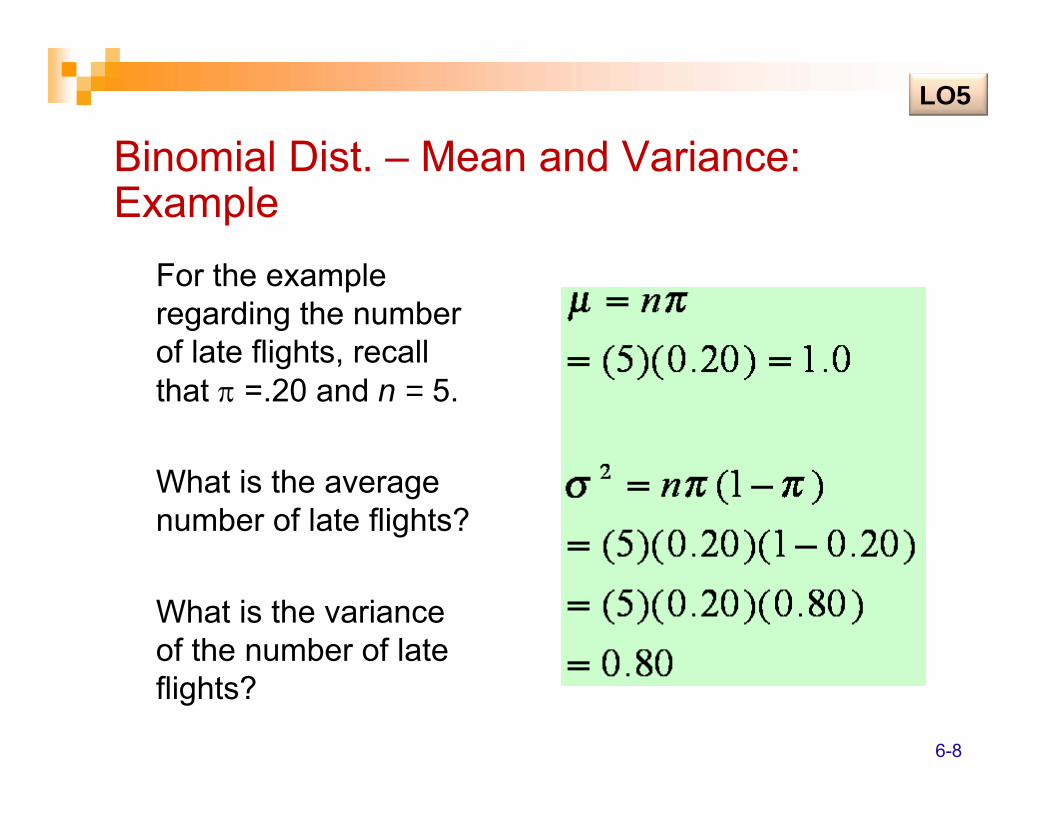
For the example regarding the number of late flights, recall that π =.20 and n = 5.
What is the average number of late flights?
What is the variance of the number of late flights?
Binomial Dist. – Mean and Variance: Example
LO5
6-8
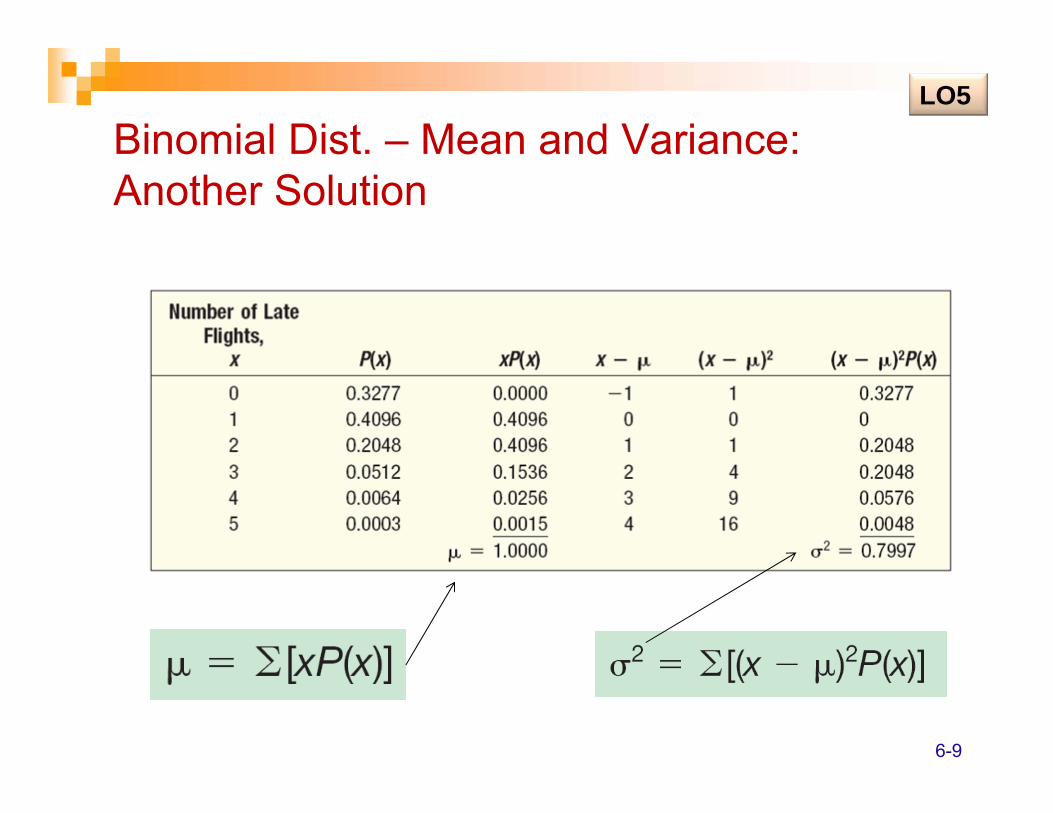
Binomial Dist. – Mean and Variance: Another Solution
LO5
6-9
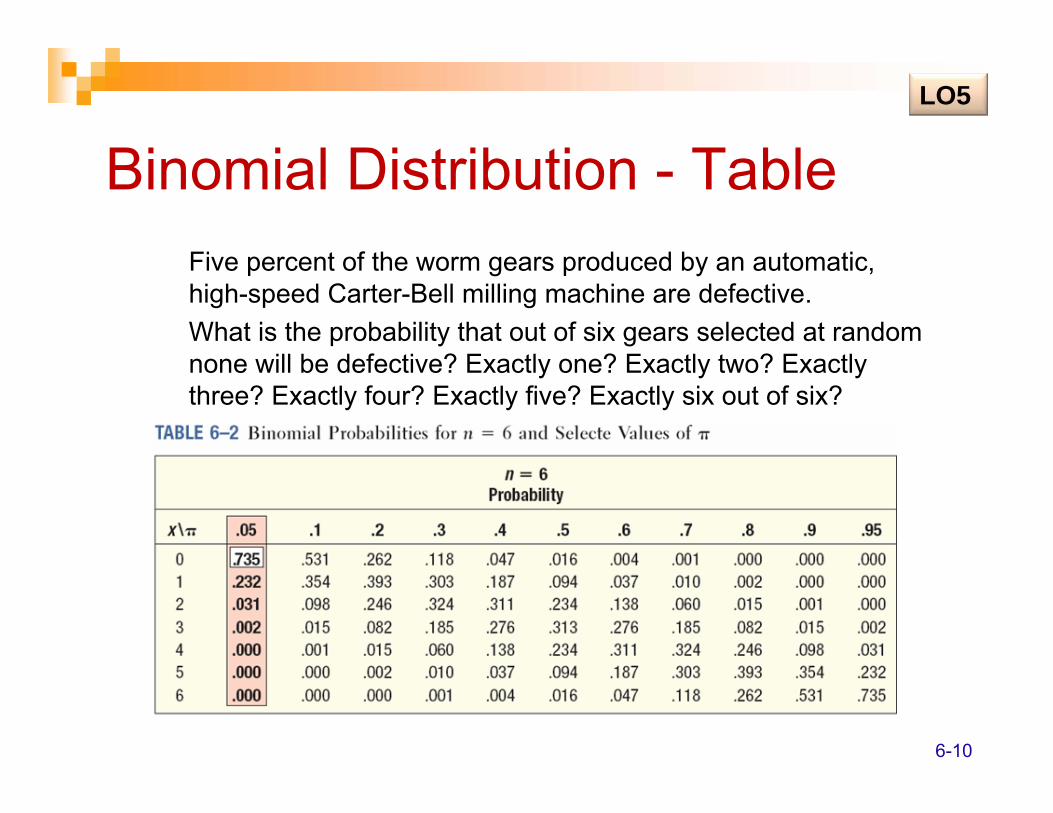
Binomial Distribution - TableFive percent of the worm gears produced by an automatic, high-speed Carter-Bell milling machine are defective. What is the probability that out of six gears selected at randomnone will be defective? Exactly one? Exactly two? Exactly three? Exactly four? Exactly five? Exactly six out of six?
LO5
6-10
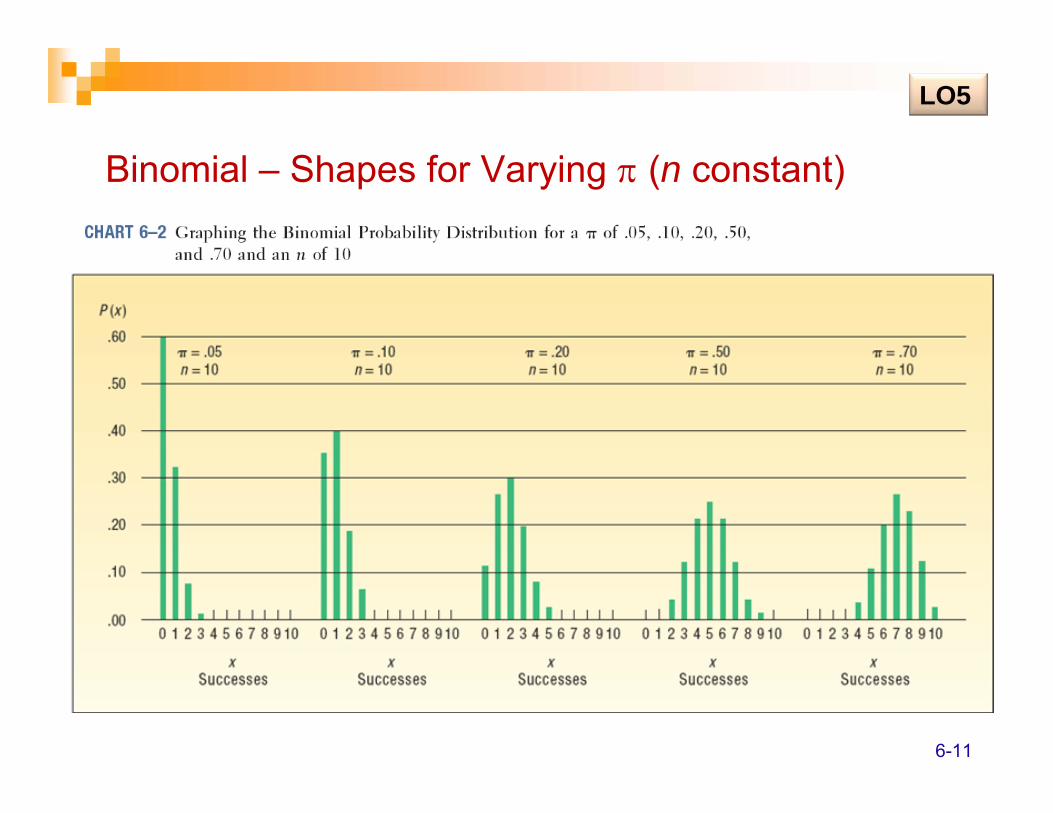
Binomial – Shapes for Varying π (n constant)
LO5
6-11
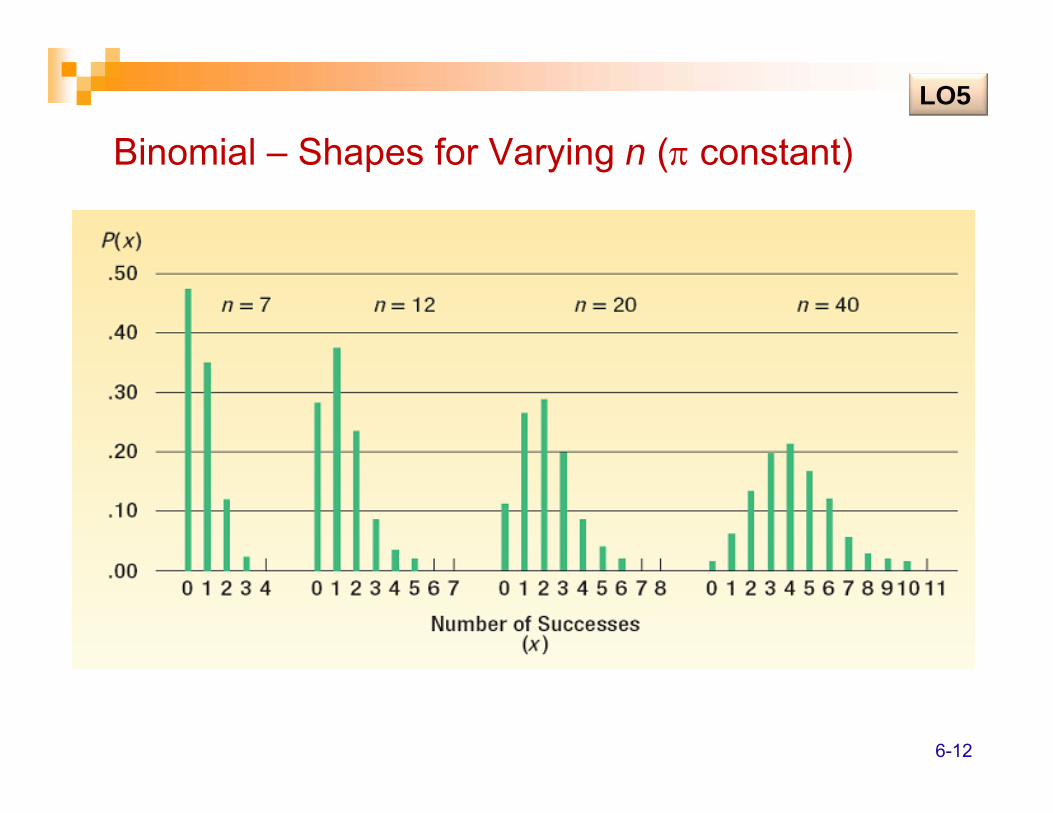
Binomial – Shapes for Varying n (π constant)LO5
6-12
Binomial Probability Distributions -Example
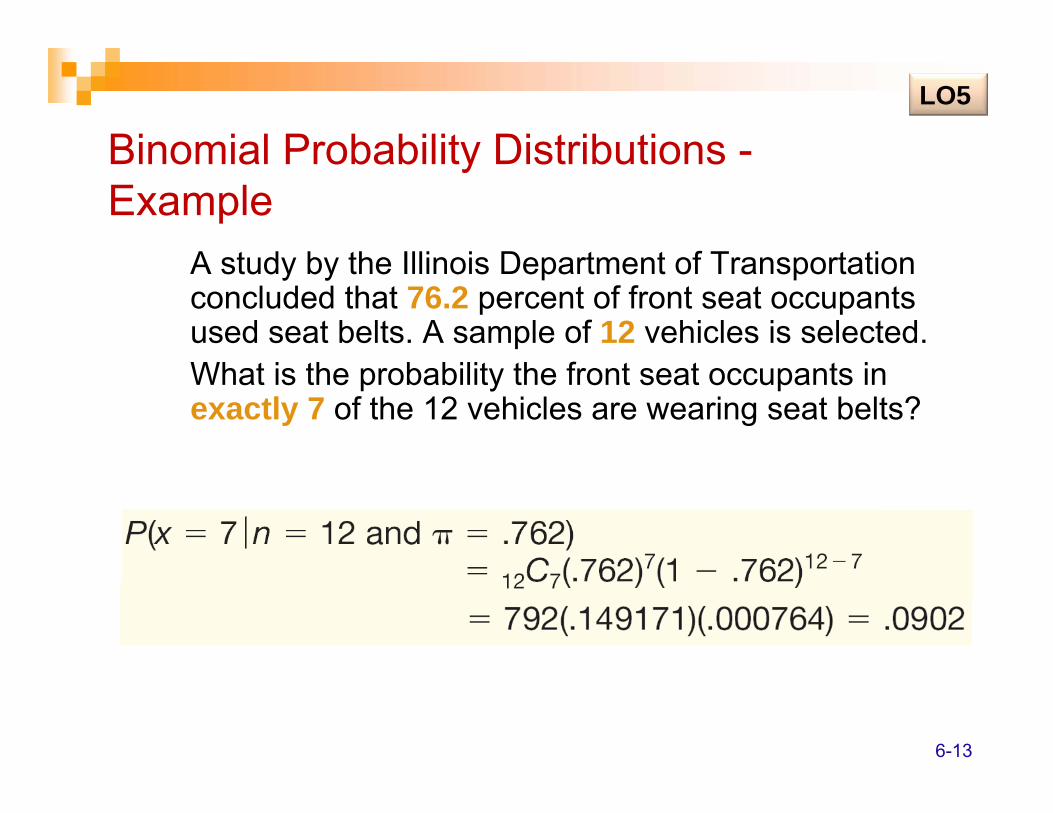
A study by the Illinois Department of Transportation concluded that 76.2 percent of front seat occupants used seat belts. A sample of 12 vehicles is selected.What is the probability the front seat occupants in exactly 7 of the 12 vehicles are wearing seat belts?
LO5
6-13
Binomial Probability Distributions -Example
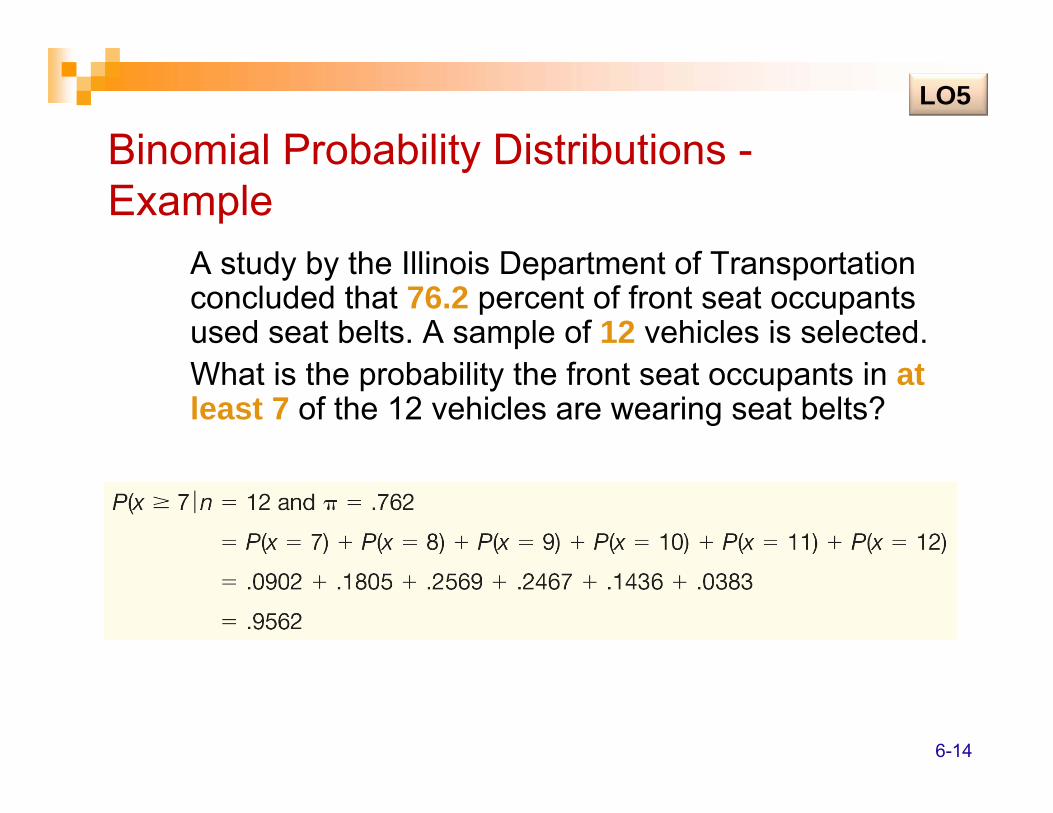
A study by the Illinois Department of Transportation concluded that 76.2 percent of front seat occupants used seat belts. A sample of 12 vehicles is selected.What is the probability the front seat occupants in at least 7 of the 12 vehicles are wearing seat belts?
LO5
6-14
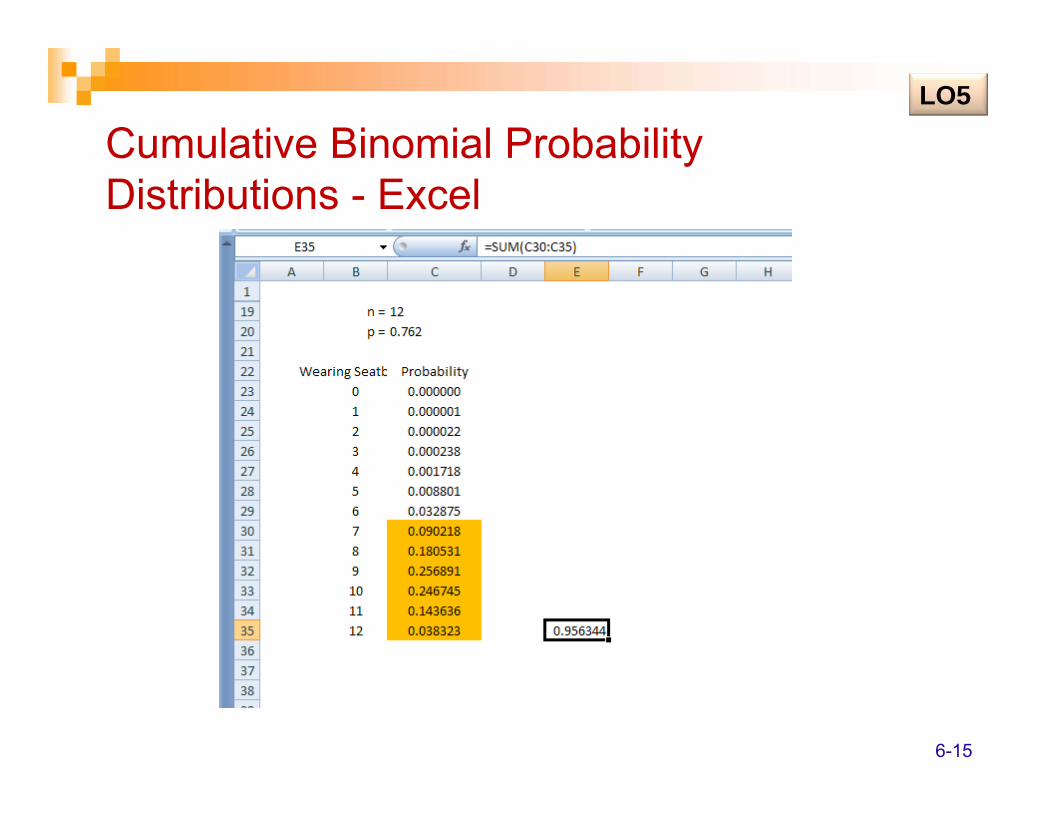
Cumulative Binomial Probability Distributions - Excel
LO5
6-15
Poisson Probability DistributionThe Poisson probability distribution describes the number of times some event occurs during a specified interval. The interval may be time, distance, area, or volume.
Assumptions of the Poisson DistributionThe probability is proportional to the length of the interval. The intervals are independent.
LO7 Describe and compute probabilities for a Poisson distribution.
6-16
Poisson Probability DistributionThe Poisson probability distribution is characterized by the number of times an event happens during some interval or continuum.
Examples include:• The number of misspelled words per page in a
newspaper.• The number of calls per hour received by Dyson
Vacuum Cleaner Company.• The number of vehicles sold per day at Hyatt Buick
GMC in Durham, North Carolina.• The number of goals scored in a college soccer game.
LO7
6-17
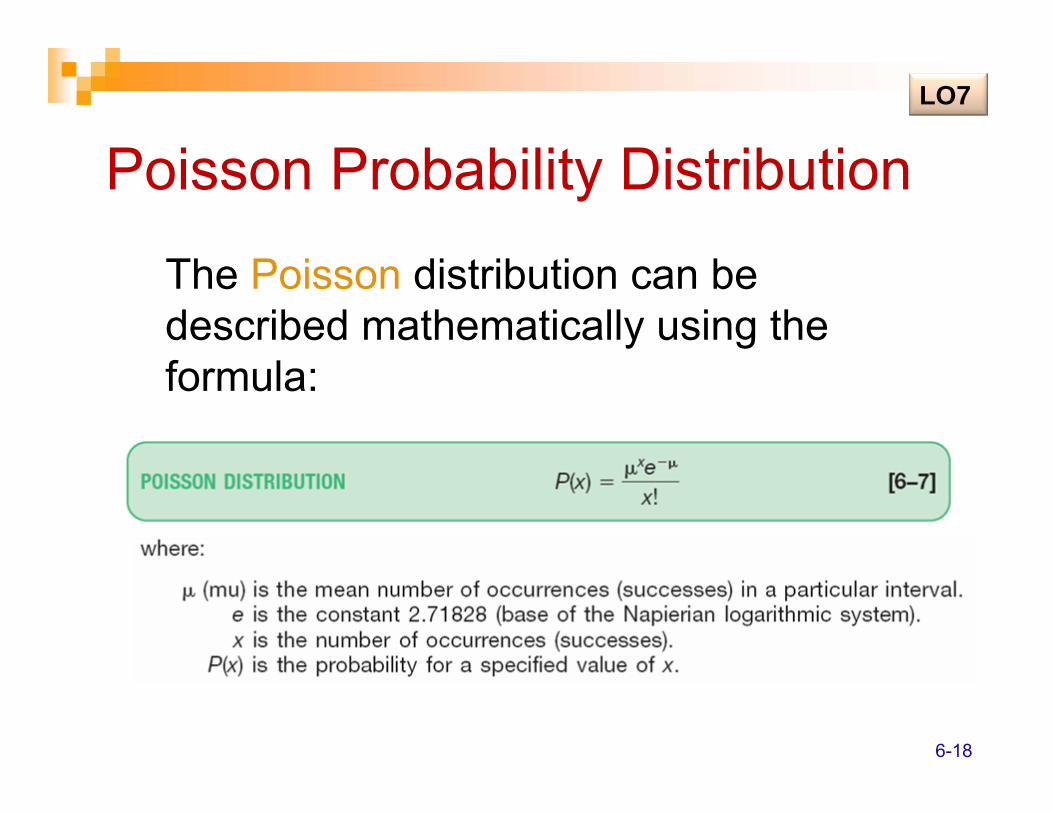
Poisson Probability Distribution
The Poisson distribution can be described mathematically using the formula:
LO7
6-18
Poisson Probability Distribution
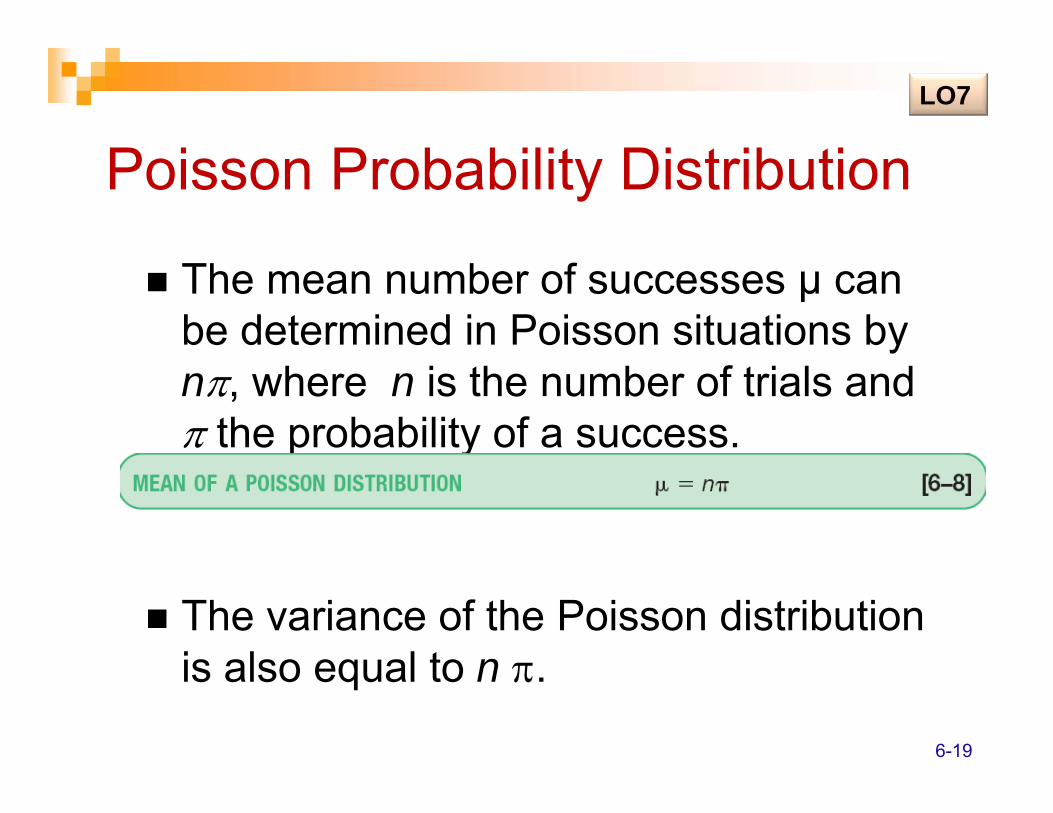
The mean number of successes μ can be determined in Poisson situations by nπ, where n is the number of trials and π the probability of a success.
The variance of the Poisson distribution is also equal to n π.
LO7
6-19
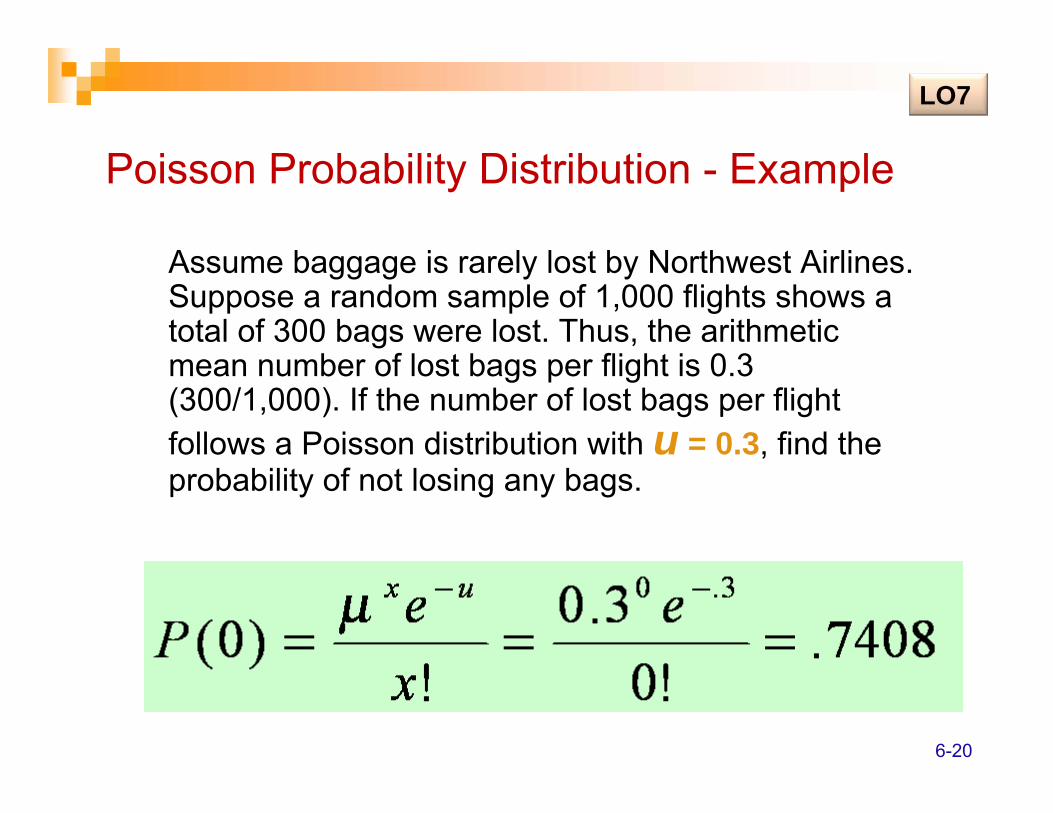
Poisson Probability Distribution - Example
Assume baggage is rarely lost by Northwest Airlines. Suppose a random sample of 1,000 flights shows a total of 300 bags were lost. Thus, the arithmetic mean number of lost bags per flight is 0.3 (300/1,000). If the number of lost bags per flight follows a Poisson distribution with u = 0.3, find the probability of not losing any bags.
LO7
6-20
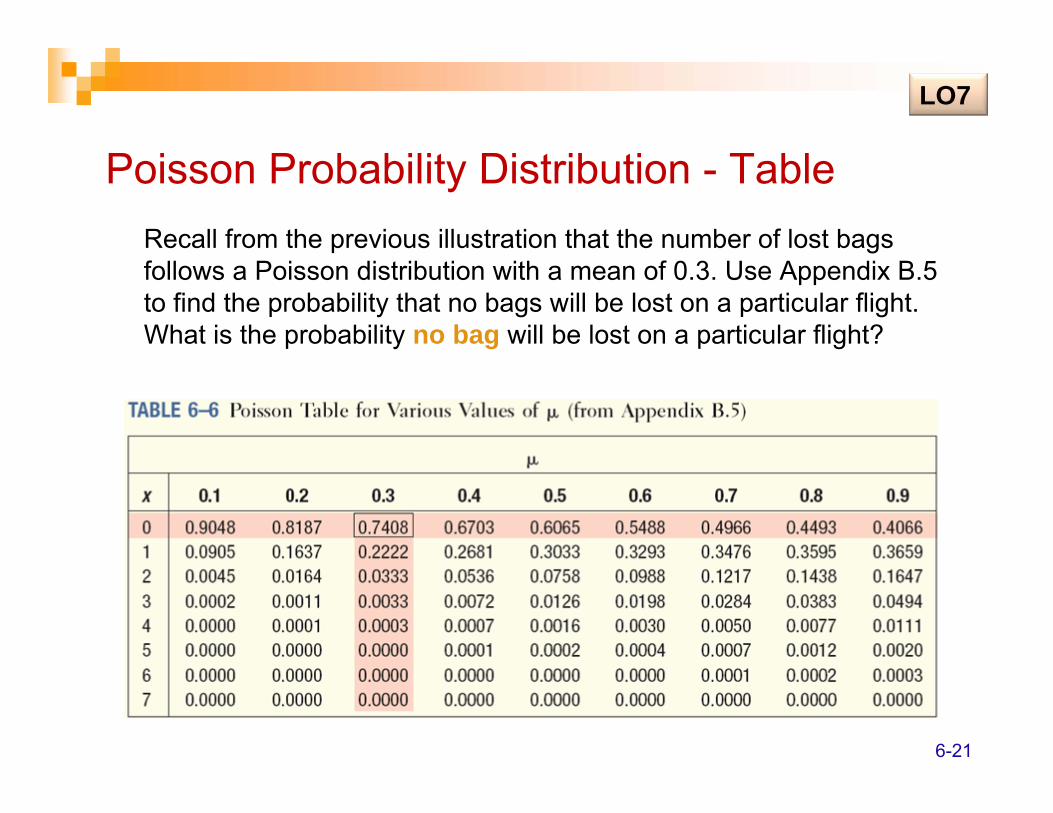
Poisson Probability Distribution - TableRecall from the previous illustration that the number of lost bags follows a Poisson distribution with a mean of 0.3. Use Appendix B.5 to find the probability that no bags will be lost on a particular flight. What is the probability no bag will be lost on a particular flight?
LO7
6-21
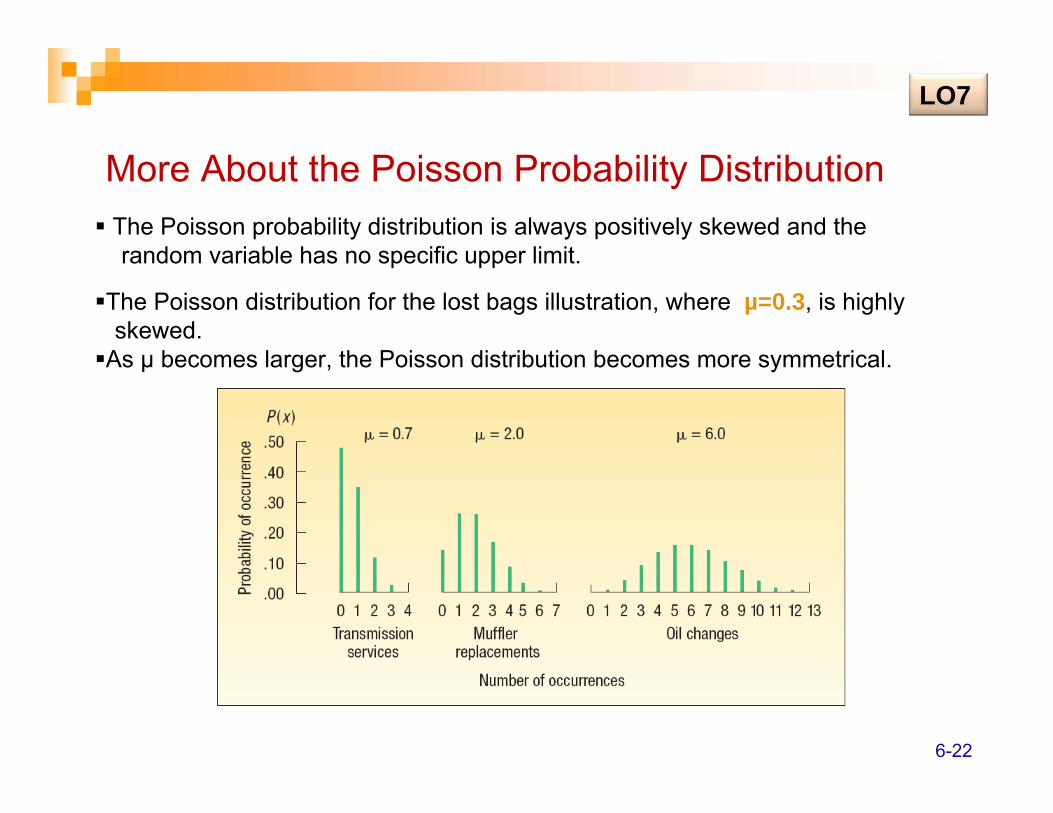
More About the Poisson Probability DistributionThe Poisson probability distribution is always positively skewed and therandom variable has no specific upper limit.
The Poisson distribution for the lost bags illustration, where µ=0.3, is highlyskewed.
As µ becomes larger, the Poisson distribution becomes more symmetrical.
LO7
6-22


![1 Probability (Ch. 6) ► Probability: “…the chance of occurrence of an event in an experiment.” [Wheeler & Ganji] ► Chance: “…3. The probability of anything](https://img.pdfslide.net/doc/110x75/56649f215503460f94c39766/1-probability-ch-6-probability-the-chance-of-occurrence-of-an.jpg)