Embed Size (px)
Citation preview
Discrimination of Fritillary according to geographical originwith Fourier transform infrared spectroscopy and
two-dimensional correlation IR spectroscopy
Rui Hua a, Su-Qin Sun a,*, Qun Zhou a, Isao Noda b, Bao-Qin Wang c
a Department of Chemistry, Tsinghua University, Beijing 100084, Chinab The Procter and Gamble Company, 8611 Beckett Road, West Chester, OH 45069, USA
c National Institute for the Control of Pharmaceutical and Biological Products, Beijing 100050, China
Received 22 January 2003; received in revised form 7 April 2003; accepted 9 April 2003
Abstract
Fritillaria is a traditional Chinese herbal medicine for eliminating phlegm and relieving a cough with a long history in
China and some other Asian countries. The objective of this study is to develop a nondestructive and accurate method
to discriminate Fritillaria of different geographical origins, which is a troublesome work by existing analytical methods.
We conducted a systematic study on five kinds of Fritillaria by Fourier transform infrared spectroscopy, second
derivative infrared spectroscopy, and two-dimensional (2D) correlation infrared spectroscopy under thermal
perturbation. Because Fritillaria consist of a large amount of starch, the conventional IR spectra of different Fritillaria
only have very limited spectral feature differences. Based on these differences, we can separate different Fritillaria to a
limited extent, but this method was deemed not very practical. The second derivative IR spectra of Fritillaria could
enhance spectrum resolution, amplify the differences between the IR spectra of different Fritillaria , and provide some
dissimilarity in their starch content, when compared with the spectrum of pure starch. Finally, we applied thermal
perturbation to Fritillaria and analyzed the resulting spectra by the 2D correlation method to distinguish different
Fritillaria easily and clearly. The distinction of very similar Fritillaria was possible because the spectral resolution was
greatly enhanced by the 2D correlation spectroscopy. In addition, with the dynamic information of molecular structure
provided by 2D correlation IR spectra, we studied the differences in the stability of active components of Fritillaria .
The differences embodied mainly on the intensity ratio of the auto-peak at 985 cm�1 and other auto-peaks. The 2D
correlation IR spectroscopy (2D IR) of Fritillaria can be a new and powerful method to discriminate Fritillaria .
# 2003 Elsevier B.V. All rights reserved.
Keywords: Fritillaria ; Fourier transform infrared spectroscopy; Two-dimensional correlation infrared spectroscopy; Alkaloid;
Saponin
* Corresponding author. Tel.: �/86-10-62781689; fax: �/86-10-62770327.
E-mail address: [email protected] (S.-Q. Sun).
Journal of Pharmaceutical and Biomedical Analysis
33 (2003) 199�/209 www.elsevier.com/locate/jpba
0731-7085/03/$ - see front matter # 2003 Elsevier B.V. All rights reserved.
doi:10.1016/S0731-7085(03)00253-X
1. Introduction
Fritillaria , the bulb of several kinds of
vegetables of Fritillaria category Liliaceae
section, has a long history of use in
Asian countries, such as China and Korea, and
is now classified as a traditional Chinese
herbal medicine in common use. Fritillaria
has been claimed to have remarkable curativeeffects in clearing heat, eliminating phlegm, moist-
ening the lungs and relieving a cough. The effective
components are mainly alkaloid and saponin
[1]. But due to the different climate and soil
regime of different regions, the differences
in composition and properties among
different Fritillaria are observed. Different
Fritillaria have discrepancies in flavor andproperty, as well as in their function [2].
China has a vast territory and many
Fritillaria growing areas. And for this
reason, Fritillaria of different geographical
origins have often been confused, and the
authenticity of Fritillaria -based medicine is
compromised. There are also some difficulties in
selecting specific Fritillaria for curing diseases.And even worse, there might be a potential for
drug poisoning when Fritillaria is misused. So it is
very important to establish a reliable and con-
venient method to distinguish Fritillaria from
different areas.
Currently, the main method for identifying
various Fritillaria is chromatography. Since there
are tens of major components, which are slightlydifferent according to growing conditions, such as
geographical origin, we cannot select only a
limited number of specific components as essential
screening criteria. Indeed there have been some
contradicting results concerning the contents of
some components of Fritillaria in the documents
[3,4]. We must thus conclude the Fritillaria
cannot be discriminated and identified verywell at this moment using only a conventional
method.
Two-dimensional correlation infrared (2D IR)
spectroscopy was proposed by Noda in 1986 [5].
The construction of 2D correlation IR spectra is
based on the detection of dynamic changes of a
system under an external perturbation. Such a
perturbation induces selective changes in molecu-
lar constituents associated with individual normal
modes of vibration in the system. The correlation
analysis is applied to a set of spectra taken during
the perturbation, so as to yield 2D correlation IR
spectra. There has been a rapid progress in the
technique of 2D correlation spectral analysis. The
external perturbations used to produce 2D corre-
lation IR spectra were sinusoids in early days [6].
Nowadays, however, arbitrary wave forms with
non-periodical perturbations are commonly used
[7]. The applied perturbations can be light, heat,
electricity, magnetism, chemistry, concentration
changes, or mechanical force [8�/10]. The 2D
correlation technique has been wildly used in
traditional spectroscopy, such as IR, Raman, UV
and fluorescence. There have been studies on
many aspects, including biologically important
systems like N -methylacetamide (NMA) and poly-
hydroxyalkanoates [10,11]. We have successfully
used the 2D correlation IR analysis to
discriminate traditional Chinese medicines and
analyze the deteriorative process of medicines
[12,13].
In the holistic theory of Chinese pharmacy,
medicinal materials take effects in curing diseases
as a whole. So any method or experiment, if it
destroys the wholeness of traditional Chinese
medicines, will not be fundamentally acceptable.
IR spectroscopy, a nondestructive, fast and integ-
rity-emphasized method, has important practical
utility in identifying and distinguishing the Chinese
medicines according to geographical origin. In this
study, we discriminated five kinds of common
Fritillaria of different geographical origins: Fritil-
laria walujewii , Fritillaria hupehensis , Fritillaria
thunbergii , Fritillaria ussuriensis and Fritillaria
cirrhosa , by FT-IR, second derivative IR, and
2D correlation IR spectroscopy (2D IR) By study-
ing the different behavior of their components
under thermal perturbation with 2D correlation
analysis, we analyzed the differences of the stabi-
lity of different Fritillaria components in the
thermal process. The objective of this study is to
search for a new method to effectively discriminate
Fritillaria according geographical origin.
R. Hua et al. / J. Pharm. Biomed. Anal. 33 (2003) 199�/209200
2. Experiment
2.1. Apparatus
Spectrum 2000 GX FT-IR spectrometer (Perkin
Elmer), equipped with a DTGS detector, in the
800�/4000 cm�1 range with a resolution of 4
cm�1. Spectra were calculated from a total of 32
scans.Love Control Corporation’s Portable program-
mable temperature Controller (Model 50-886).
Range: 50�/90 8C.
2.2. Samples
All Fritillaria were identified and provided by
National Institute for the Control of Pharmaceu-tical and Biological Products.
2.3. Procedure
First, all the Fritillaria were purified, commin-
uted, and desiccated. Then each sample of Fritil-
laria powder was blended with KBr powder,
ground again, and pressed into a tablet.Put the sample tablet in the sample pool of
temperature controller. A pre-established program
controlled the whole process of increasing tem-
perature. During the process of increasing tem-
perature from 50 to 90 8C, the spectra were
collected at intervals of 5 8C. The full temperature
scan took a total time of 30 min.
All the second derivative IR spectra were 13-point second derivative IR spectra after 13-point
smoothing of the original IR spectra taken at
room temperature.
2D IR correlation spectra were obtained by
analyzing the series of temperature-dependent
dynamic spectra with a 2D IR correlation analysis
software programmed by our group.
3. Results and discussion
3.1. Assignments and comparison of the IR spectra
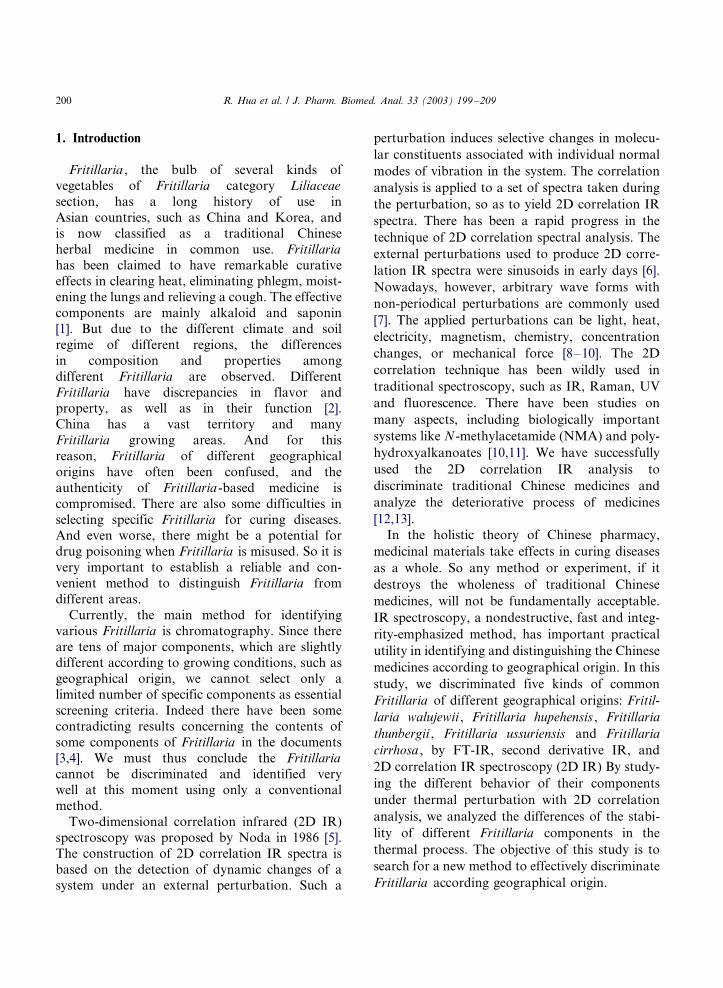
IR spectra, taken at room temperature, of the
five Fritillaria samples are shown in Fig. 1. The IR
spectra belong to F. walujewii , F. hupehensis , F.
thunbergii , F. ussuriensis and F. cirrhosa , respec-
tively, arranged from the top down.The IR spectra of five Fritillaria are rather
similar, except that some peaks at a given wave-
number have slight differences in shape or inten-
sity. The peak at 1515 cm�1 may be an example.
F. walujewii has a sharp peak, F. hupehensis has a
wider one, and others have no noticeable peak.
The peak at 1244 cm�1 is most obvious in the
Fig. 1. IR spectra of five Fritillaria at room temperature. (a) F.
walujewii , (b) F. hupehensis , (c) F. thunbergii , (d) F. ussuriensis ,
(e) F. cirrhosa .
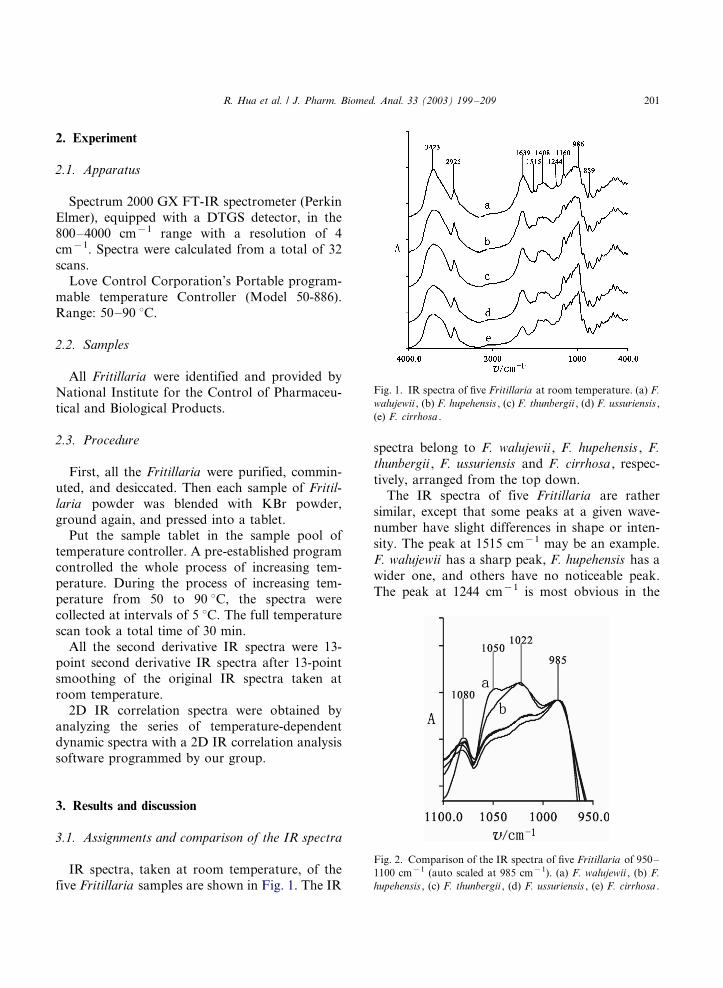
Fig. 2. Comparison of the IR spectra of five Fritillaria of 950�/
1100 cm�1 (auto scaled at 985 cm�1). (a) F. walujewii , (b) F.
hupehensis , (c) F. thunbergii , (d) F. ussuriensis , (e) F. cirrhosa .
R. Hua et al. / J. Pharm. Biomed. Anal. 33 (2003) 199�/209 201
spectrum of F. walujewii , followed by the spectra
of F. thunbergii and F. ussuriensis , but becomes
illegible in the spectra of F. hupehensis and F.
cirrhosa due to overlapping with other peaks.
There are also apparent differences in the IR
spectra of 950�/1100 and 1330�/1480 cm�1 regions,
which are enlarged, respectively, in Figs. 2 and 3.
In Fig. 2, the five spectra are auto scaled at the
peaks near 985 cm�1 to make it clear to observe
the differences among them. When spectra are
auto scaled at a wavenumber, the absorbance of
each spectrum at this wavenumber will be the same
so that the differences at other wavenumbers will
be more clearly to observe. All the five Fritillaria
have two apparent peaks at 985 and 1080 cm�1,
which match together, respectively, in Fig. 2
because the two peaks of each Fritillaria have
the similar intensity ratio. F. walujewii also has
two relatively strong peaks at 1022 and 1050 cm�1
of the same intensity. F. hupehensis has an notice-
able peak at 1022 cm�1, which overlaps with the
weak peak at 1050 cm�1. The other three Fritil-
laria have little difference in Fig. 2.
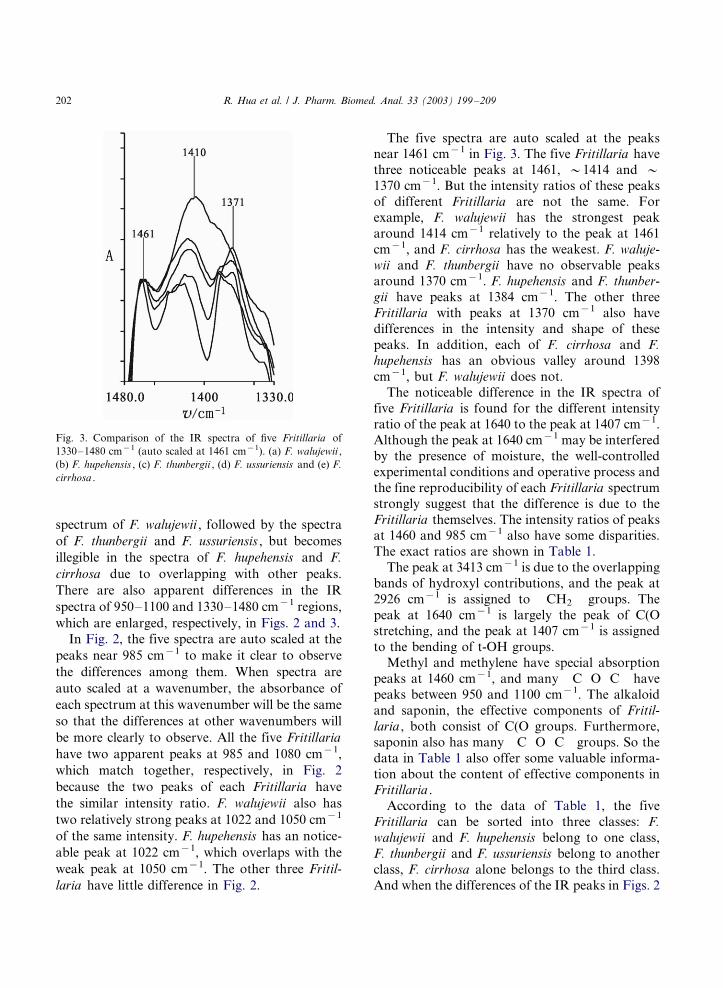
The five spectra are auto scaled at the peaksnear 1461 cm�1 in Fig. 3. The five Fritillaria have
three noticeable peaks at 1461, �/1414 and �/
1370 cm�1. But the intensity ratios of these peaks
of different Fritillaria are not the same. For
example, F. walujewii has the strongest peak
around 1414 cm�1 relatively to the peak at 1461
cm�1, and F. cirrhosa has the weakest. F. waluje-
wii and F. thunbergii have no observable peaksaround 1370 cm�1. F. hupehensis and F. thunber-
gii have peaks at 1384 cm�1. The other three
Fritillaria with peaks at 1370 cm�1 also have
differences in the intensity and shape of these
peaks. In addition, each of F. cirrhosa and F.
hupehensis has an obvious valley around 1398
cm�1, but F. walujewii does not.
The noticeable difference in the IR spectra offive Fritillaria is found for the different intensity
ratio of the peak at 1640 to the peak at 1407 cm�1.
Although the peak at 1640 cm�1 may be interfered
by the presence of moisture, the well-controlled
experimental conditions and operative process and
the fine reproducibility of each Fritillaria spectrum
strongly suggest that the difference is due to the
Fritillaria themselves. The intensity ratios of peaksat 1460 and 985 cm�1 also have some disparities.
The exact ratios are shown in Table 1.
The peak at 3413 cm�1 is due to the overlapping
bands of hydroxyl contributions, and the peak at
2926 cm�1 is assigned to �/CH2�/ groups. The
peak at 1640 cm�1 is largely the peak of C(O
stretching, and the peak at 1407 cm�1 is assigned
to the bending of t-OH groups.Methyl and methylene have special absorption
peaks at 1460 cm�1, and many �/C�/O�/C�/ have
peaks between 950 and 1100 cm�1. The alkaloid
and saponin, the effective components of Fritil-
laria , both consist of C(O groups. Furthermore,
saponin also has many �/C�/O�/C�/ groups. So the
data in Table 1 also offer some valuable informa-
tion about the content of effective components inFritillaria .
According to the data of Table 1, the five
Fritillaria can be sorted into three classes: F.
walujewii and F. hupehensis belong to one class,
F. thunbergii and F. ussuriensis belong to another
class, F. cirrhosa alone belongs to the third class.
And when the differences of the IR peaks in Figs. 2
Fig. 3. Comparison of the IR spectra of five Fritillaria of
1330�/1480 cm�1 (auto scaled at 1461 cm�1). (a) F. walujewii ,
(b) F. hupehensis , (c) F. thunbergii , (d) F. ussuriensis and (e) F.
cirrhosa .
R. Hua et al. / J. Pharm. Biomed. Anal. 33 (2003) 199�/209202
and 3 are taken into consideration, all the five
Fritillaria can be roughly separated.
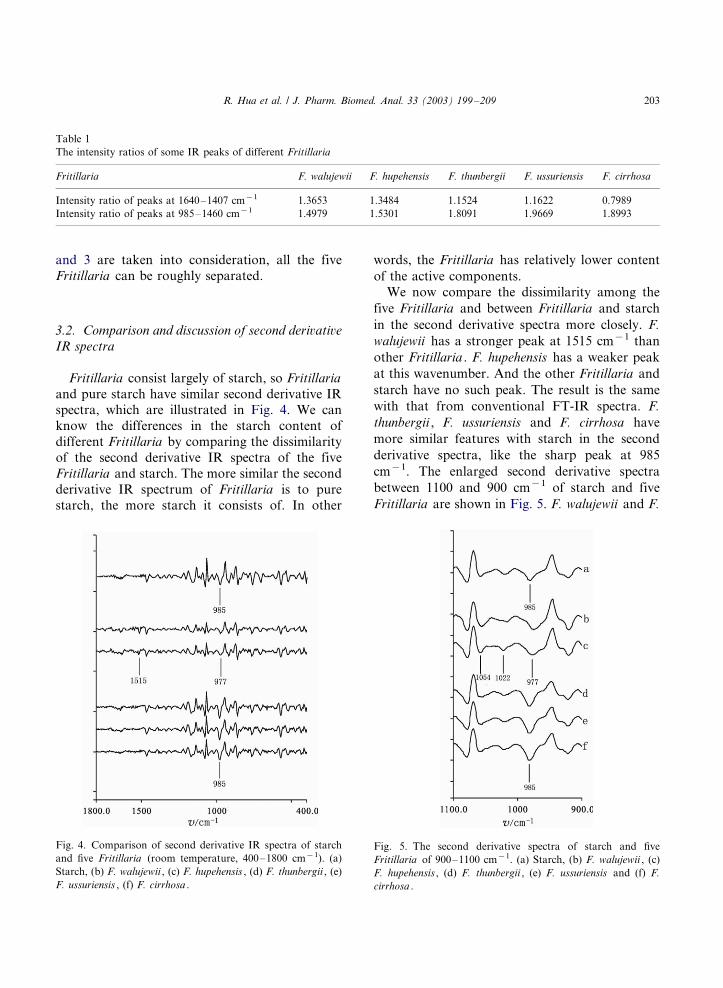
3.2. Comparison and discussion of second derivative
IR spectra
Fritillaria consist largely of starch, so Fritillaria
and pure starch have similar second derivative IRspectra, which are illustrated in Fig. 4. We can
know the differences in the starch content of
different Fritillaria by comparing the dissimilarity
of the second derivative IR spectra of the five
Fritillaria and starch. The more similar the second
derivative IR spectrum of Fritillaria is to pure
starch, the more starch it consists of. In other
words, the Fritillaria has relatively lower content
of the active components.
We now compare the dissimilarity among the
five Fritillaria and between Fritillaria and starch
in the second derivative spectra more closely. F.
walujewii has a stronger peak at 1515 cm�1 than
other Fritillaria . F. hupehensis has a weaker peak
at this wavenumber. And the other Fritillaria and
starch have no such peak. The result is the same
with that from conventional FT-IR spectra. F.
thunbergii , F. ussuriensis and F. cirrhosa have
more similar features with starch in the second
derivative spectra, like the sharp peak at 985
cm�1. The enlarged second derivative spectra
between 1100 and 900 cm�1 of starch and five
Fritillaria are shown in Fig. 5. F. walujewii and F.
Table 1
The intensity ratios of some IR peaks of different Fritillaria
Fritillaria F. walujewii F. hupehensis F. thunbergii F. ussuriensis F. cirrhosa
Intensity ratio of peaks at 1640�/1407 cm�1 1.3653 1.3484 1.1524 1.1622 0.7989
Intensity ratio of peaks at 985�/1460 cm�1 1.4979 1.5301 1.8091 1.9669 1.8993
Fig. 4. Comparison of second derivative IR spectra of starch
and five Fritillaria (room temperature, 400�/1800 cm�1). (a)
Starch, (b) F. walujewii , (c) F. hupehensis , (d) F. thunbergii , (e)
F. ussuriensis , (f) F. cirrhosa .
Fig. 5. The second derivative spectra of starch and five
Fritillaria of 900�/1100 cm�1. (a) Starch, (b) F. walujewii , (c)
F. hupehensis , (d) F. thunbergii , (e) F. ussuriensis and (f) F.
cirrhosa .
R. Hua et al. / J. Pharm. Biomed. Anal. 33 (2003) 199�/209 203
hupehensis have no peak at 985 cm�1 but have
broader peaks at 977 cm�1. The peak at 985 cm�1
is mainly attributed to the stretching of �/C�/O�/
C�/. Thus, saponin and other similar substances,
consisting of many �/C�/O�/C�/ groups, will affect
the IR spectra of this range greatly. So we can
deduce that F. walujewii and F. hupehensis may
have a higher content of saponin and other similar
substances.
We can see some additional information from
Fig. 5. F. walujewii and F. hupehensis each has a
peak at 1054 cm�1, and the peak of the former is
more noticeable. F. hupehensis also has a fairly
obvious peak at 1022 cm�1. The two peaks are not
featured by the other three Fritillaria and starch.
The results correspond well to the previous con-
clusion drawn from the analysis of Fig. 2.
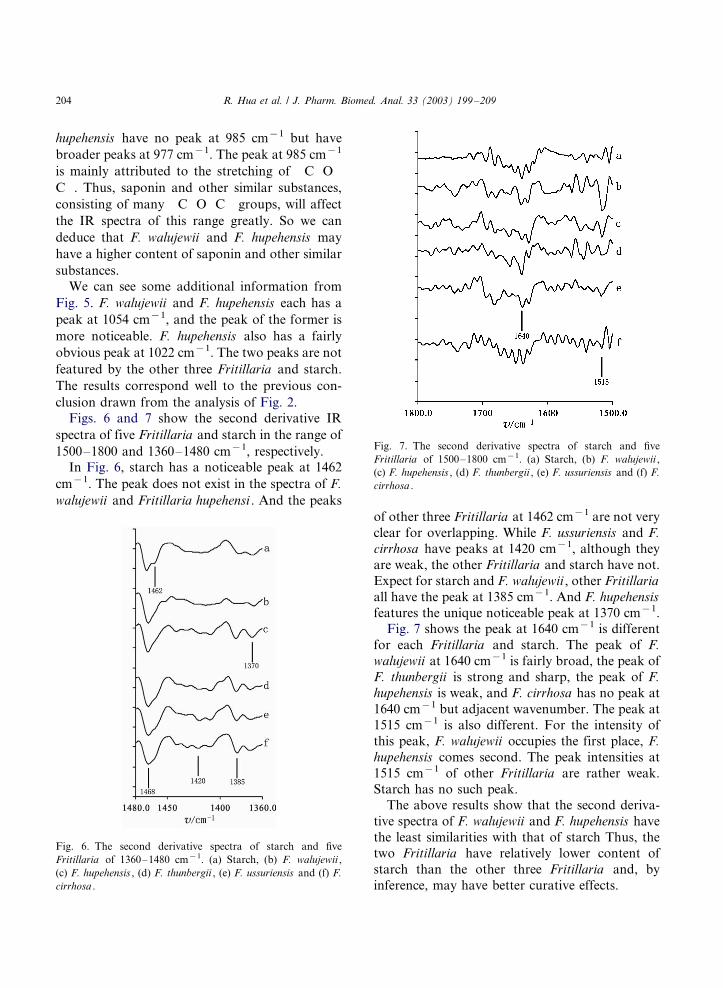
Figs. 6 and 7 show the second derivative IR
spectra of five Fritillaria and starch in the range of
1500�/1800 and 1360�/1480 cm�1, respectively.In Fig. 6, starch has a noticeable peak at 1462
cm�1. The peak does not exist in the spectra of F.
walujewii and Fritillaria hupehensi . And the peaks
of other three Fritillaria at 1462 cm�1 are not very
clear for overlapping. While F. ussuriensis and F.
cirrhosa have peaks at 1420 cm�1, although they
are weak, the other Fritillaria and starch have not.
Expect for starch and F. walujewii , other Fritillaria
all have the peak at 1385 cm�1. And F. hupehensis
features the unique noticeable peak at 1370 cm�1.
Fig. 7 shows the peak at 1640 cm�1 is different
for each Fritillaria and starch. The peak of F.
walujewii at 1640 cm�1 is fairly broad, the peak of
F. thunbergii is strong and sharp, the peak of F.
hupehensis is weak, and F. cirrhosa has no peak at
1640 cm�1 but adjacent wavenumber. The peak at
1515 cm�1 is also different. For the intensity of
this peak, F. walujewii occupies the first place, F.
hupehensis comes second. The peak intensities at
1515 cm�1 of other Fritillaria are rather weak.
Starch has no such peak.
The above results show that the second deriva-
tive spectra of F. walujewii and F. hupehensis have
the least similarities with that of starch Thus, the
two Fritillaria have relatively lower content of
starch than the other three Fritillaria and, by
inference, may have better curative effects.
Fig. 6. The second derivative spectra of starch and five
Fritillaria of 1360�/1480 cm�1. (a) Starch, (b) F. walujewii ,
(c) F. hupehensis , (d) F. thunbergii , (e) F. ussuriensis and (f) F.
cirrhosa .
Fig. 7. The second derivative spectra of starch and five
Fritillaria of 1500�/1800 cm�1. (a) Starch, (b) F. walujewii ,
(c) F. hupehensis , (d) F. thunbergii , (e) F. ussuriensis and (f) F.
cirrhosa .
R. Hua et al. / J. Pharm. Biomed. Anal. 33 (2003) 199�/209204
In brief, the second derivative spectra canillustrate the features of the IR spectra of Fritil-
laria more clearly, and provide some information
about the content of starch of Fritillaria .
3.3. Results and discussion of 2D correlation IR
spectra
The effective components of Fritillaria are
alkaloid and saponin, which mainly contain C(O,
�/CH2�/, �/C�/O�/C�/ and some rings containing N.
These groups are well suited for the 2D correlation
analysis of IR spectra of the corresponding
wavenumber. Due to the noises produced by the
tiny but non-negligible changes of moisture in the
light path during the experiment, especially whenthe perturbation applied on Fritillaria tablet was
very small, we could not use the spectra around
1640 cm�1 to make the reliable 2D correlation
spectra. We selected instead the wavenumber
range of 950�/1350 and 1350�/1600 cm�1 to take
the full advantage of the 2D correlation analysis.
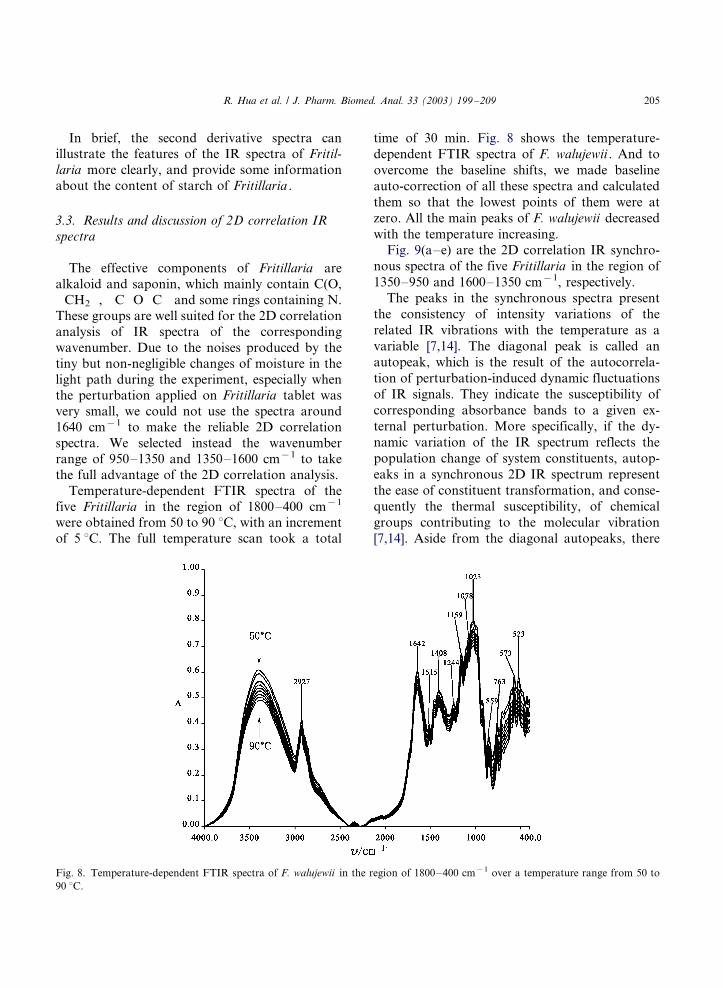
Temperature-dependent FTIR spectra of the
five Fritillaria in the region of 1800�/400 cm�1
were obtained from 50 to 90 8C, with an increment
of 5 8C. The full temperature scan took a total
time of 30 min. Fig. 8 shows the temperature-
dependent FTIR spectra of F. walujewii . And to
overcome the baseline shifts, we made baseline
auto-correction of all these spectra and calculated
them so that the lowest points of them were at
zero. All the main peaks of F. walujewii decreased
with the temperature increasing.
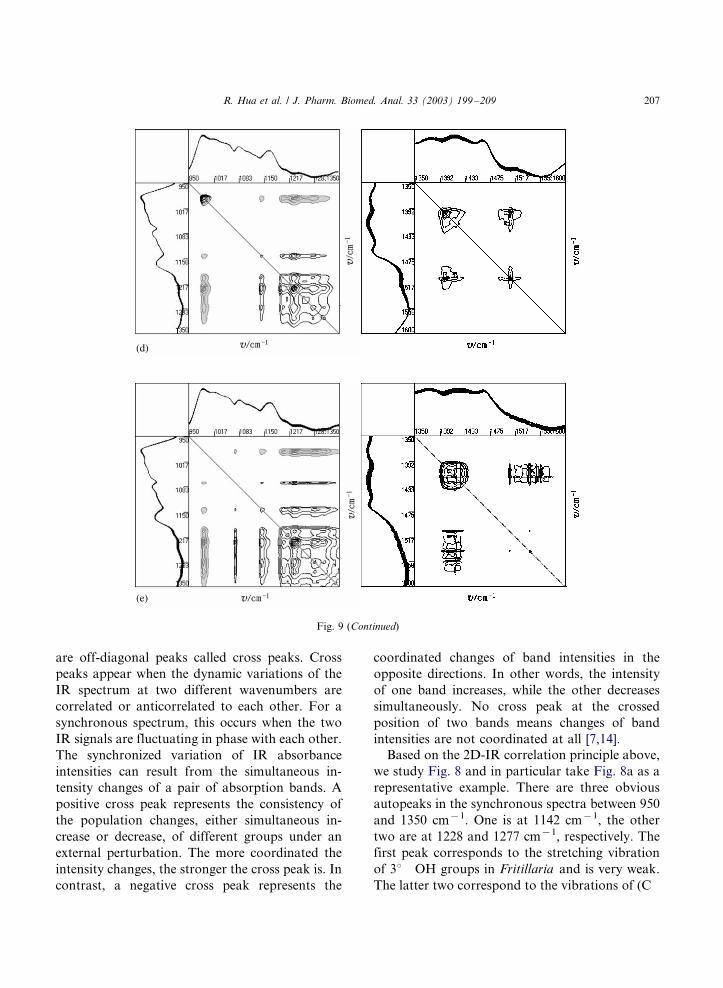
Fig. 9(a�/e) are the 2D correlation IR synchro-
nous spectra of the five Fritillaria in the region of
1350�/950 and 1600�/1350 cm�1, respectively.
The peaks in the synchronous spectra present
the consistency of intensity variations of the
related IR vibrations with the temperature as a
variable [7,14]. The diagonal peak is called an
autopeak, which is the result of the autocorrela-
tion of perturbation-induced dynamic fluctuations
of IR signals. They indicate the susceptibility of
corresponding absorbance bands to a given ex-
ternal perturbation. More specifically, if the dy-
namic variation of the IR spectrum reflects the
population change of system constituents, autop-
eaks in a synchronous 2D IR spectrum represent
the ease of constituent transformation, and conse-
quently the thermal susceptibility, of chemical
groups contributing to the molecular vibration
[7,14]. Aside from the diagonal autopeaks, there
Fig. 8. Temperature-dependent FTIR spectra of F. walujewii in the region of 1800�/400 cm�1 over a temperature range from 50 to
90 8C.
R. Hua et al. / J. Pharm. Biomed. Anal. 33 (2003) 199�/209 205
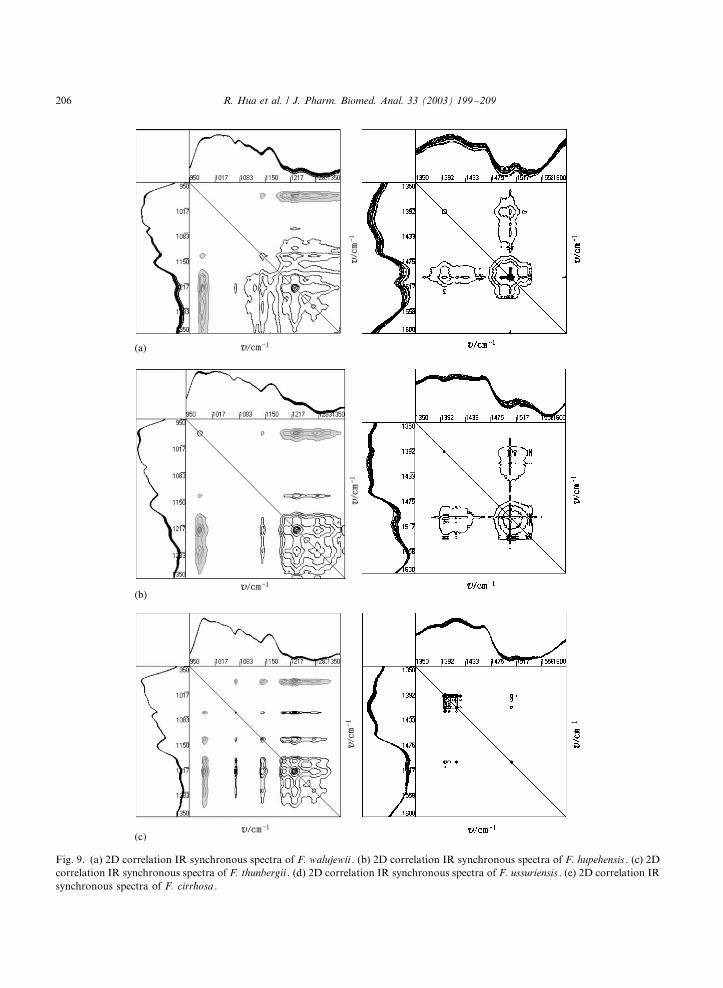
Fig. 9. (a) 2D correlation IR synchronous spectra of F. walujewii . (b) 2D correlation IR synchronous spectra of F. hupehensis . (c) 2D
correlation IR synchronous spectra of F. thunbergii . (d) 2D correlation IR synchronous spectra of F. ussuriensis . (e) 2D correlation IR
synchronous spectra of F. cirrhosa .
R. Hua et al. / J. Pharm. Biomed. Anal. 33 (2003) 199�/209206
are off-diagonal peaks called cross peaks. Cross
peaks appear when the dynamic variations of the
IR spectrum at two different wavenumbers are
correlated or anticorrelated to each other. For a
synchronous spectrum, this occurs when the two
IR signals are fluctuating in phase with each other.
The synchronized variation of IR absorbance
intensities can result from the simultaneous in-
tensity changes of a pair of absorption bands. A
positive cross peak represents the consistency of
the population changes, either simultaneous in-
crease or decrease, of different groups under an
external perturbation. The more coordinated the
intensity changes, the stronger the cross peak is. In
contrast, a negative cross peak represents the
coordinated changes of band intensities in the
opposite directions. In other words, the intensity
of one band increases, while the other decreases
simultaneously. No cross peak at the crossed
position of two bands means changes of band
intensities are not coordinated at all [7,14].
Based on the 2D-IR correlation principle above,
we study Fig. 8 and in particular take Fig. 8a as a
representative example. There are three obvious
autopeaks in the synchronous spectra between 950
and 1350 cm�1. One is at 1142 cm�1, the other
two are at 1228 and 1277 cm�1, respectively. The
first peak corresponds to the stretching vibration
of 38 �/OH groups in Fritillaria and is very weak.
The latter two correspond to the vibrations of (C�/
Fig. 9 (Continued)
R. Hua et al. / J. Pharm. Biomed. Anal. 33 (2003) 199�/209 207
O�/C�/ groups of Fritillaria constituents. The sign
of cross peaks among them are positive, suggesting
their intensity changes during the heating pro-
cesses are in the same directions. The autopeak at
985 cm�1 is mainly due to the changes of the
functional groups consisting of �/C�/O�/C�/, and it
has close relationship with the components of
saponin. F. walujewii does not have such an
autopeak. There are two noticeable autopeaks at
1402 and 1506 cm�1 in the synchronous spectra
between 1350 and 1600 cm�1. The former is weak
and assigned to the bending of 38 �/OH. The latter
is rather strong and assigned to the functional
groups of N-ring. The positive sign cross peaks
suggests the simultaneous decrease of band inten-
sities during the heating process. The 2D-IR
spectra of other Fritillaria can be analyzed in a
similar manner.
Because the auto-peaks in 2D synchronous
spectra have close relation with the intensity of
corresponding IR peaks, the 2D correlation spec-
tra and FT-IR spectra can be compared and
studied together. In the FT-IR spectra, F. waluje-
wii and F. hupehensis each has a distinct peak at
1515 cm�1, but other Fritillaria do not. The
discrepancy can be illustrated more clearly and
directly in the 2D correlation spectra between 1350
and 1600 cm�1, where the intensity ratio between
the auto peaks near 1510 and 1400 cm�1 are
different. The ratios of F. walujewii and F.
hupehensis are much greater than one. And the
ratios of F. thunbergii and F. ussuriensis are
approximately equal to one. But F. cirrhosa has
an autopeak not near 1510 cm�1 (or it is so weak
to be seen), but at 1541 cm�1 instead, and its
intensity is much weaker than the peak at 1417
cm�1.
We also noted that the intensity ratios of auto
peaks in 2D IR spectra were not always consistent
with the intensity ratios of peaks in FT-IR spectra.
The results can explain the differences in the
component content of Fritillaria , which result in
the differences of thermal sensitivity.
F. thunbergii and F. ussuriensis , which have
almost the same FT-IR spectra, have distinct 2D
IR spectra in the range of 950�/1350 cm�1. The
autopeak at 985 cm�1 of F. thunbergii , which is
assigned to saponin and related substances is
relatively weak in its 2D spectrum. On the other
hand, such a peak of F. ussuriensis is clearly the
strongest. The comparison shows the differences in
the composition and properties of saponin in the
two Fritillaria. The saponin and related substances
in F. ussuriensis apparently have poorer thermal
stability. F. hupehensis , like F. walujewii , has a
relatively weak peak at 985 cm�1 in FT-IR
spectrum. But it has a distinct peak at 985 cm�1
in the 2D spectrum, while F. walujewii has almost
no peak. The result shows the difference in the
composition and properties of saponin in the two
Fritillaria . The saponin and related substances in
F. hupehensis have a poorer thermal stability.
It can be concluded from the above discussion
that the 2D correlation IR spectra not only enlarge
the differences in the FT-IR spectra, but also
provide useful information for studying the stabi-
lity of effective components of Fritillaria . We can
see rather obvious differences in the 2D spectra of
different Fritillaria and 2D correlation IR spectra
have good reproducibility. So the 2D correlation
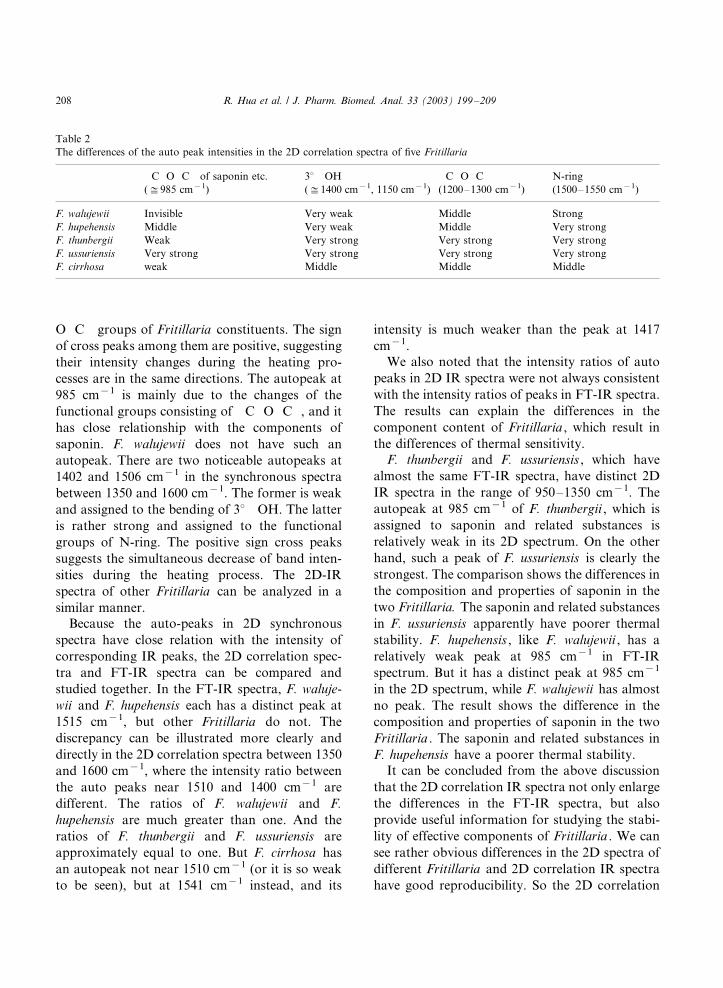
Table 2
The differences of the auto peak intensities in the 2D correlation spectra of five Fritillaria
�/C�/O�/C�/ of saponin etc.
($/985 cm�1)
38 �/OH
($/1400 cm�1, 1150 cm�1)
�/C�/O�/C�/
(1200�/1300 cm�1)
N-ring
(1500�/1550 cm�1)
F. walujewii Invisible Very weak Middle Strong
F. hupehensis Middle Very weak Middle Very strong
F. thunbergii Weak Very strong Very strong Very strong
F. ussuriensis Very strong Very strong Very strong Very strong
F. cirrhosa weak Middle Middle Middle
R. Hua et al. / J. Pharm. Biomed. Anal. 33 (2003) 199�/209208
spectra can be used as characteristic spectra ofFritillaria .
Table 2 summarized the differences of the auto
peak intensities in the 2D correlation spectra of
different Fritillaria between 950 and 1600 cm�1.
As mentioned above, the alkaloid and saponin
are the main active components of Fritillaria , so
the stability of the two classes of substances
directly determines the medicinal value of Fritil-
laria . These two substances have the similar effects
in eliminating phlegm and relieving the cough,
which has studied by some research [15,16]. The
results of this experiment showed that the alka-
loids of different Fritillaria have almost the same
thermal stability, but saponins do not. F. hupe-
hensis is poorer than F. walujewii and F. ussur-
iensis is poorer than F. thunbergii in thermalstability. So the differences of various Fritillaria
should be considered in the processing, mainte-
nance, and transportation in order to keep them
from deterioration.
4. Conclusions
This study showed the dissimilarities between
different Fritillaria of geographical origins. Based
on the peak shapes and intensities of Fritillaria in
FT-IR spectra, we can roughly separate the five
Fritillaria. With the help of second derivative
spectra, which enlarged the differences of Fritil-
laria , the information about the saponin contents
of different Fritillaria can be obtained. 2D corre-lation analysis was applied to the IR spectra of
Fritillaria observed under different temperatures.The dissimilarities between Fritillaria are most
clearly seen in the 2D correlation spectra. We
combined the information of peaks in FT-IR
spectra and autopeaks in 2D spectra, and deter-
mined the stability differences of active compo-
nents in Fritillaria . The results provided
theoretical basis for preserving Fritillaria in the
processing, maintenance, and transportation.
References
[1] D. Zhao, Chin. Med. Magazine 19 (2) (1994) 71�/72.
[2] P. Xiao, in: Modern Chinese Materia Medica, Chemistry
Industry Press, 2002, pp. 111�/116, 301�/303, 451�/455,
851�/855, 1002�/1004.
[3] P. Xiao, Modern Chinese Materia Medica, Chemistry
Industry Press, 2002, p. 114.
[4] F. Song, Q. Zhao, W. Xing, J. Huaxi Med. 12 (4) (1997)
259�/261.
[5] I. Noda, Bull. Am. Phys. Soc. 21 (1986) 520.
[6] I. Noda, J. Am. Chem. Soc. 111 (21) (1989) 8116�/8118.
[7] I. Noda, Appl. Spectrosc. 47 (1993) 1329.
[8] A. Nabet, M. Pezolet, Appl. Spectrosc. 51 (1997) 466�/469.
[9] G. Tian, Q. Wu, S. Sun, I. Noda, G. Guo, Appl. Spectrosc.
55 (7) (2000) 888�/893.
[10] Q. Wu, G. Tian, S. Sun, I. Noda, G. Chen, Appl. Polym.
Sci. 82 (4) (2001) 934�/940.
[11] Y. Ozaki, Y. Liu, I. Noda, Appl. Spectrosc. 51 (1997) 526�/
535.
[12] F. Cao, Q. Zhou, S. Sun, Mod. Instrum. 8 (4) (2002) 19.
[13] L. Zuo, S. Sun, Q. Zhou, J. Tao, I. Noda, J. Pharm.
Biomed. Anal. 30 (2003) 1491�/1498.
[14] I. Noda, Appl. Spectrosc. 54 (7) (2000) 236A�/248A.
[15] M.A. Czarnecki, Appl. Spectrosc. 52 (1998) 1583�/1590.
[16] S. Gao, Y. Xia, F. Tan, J. Plant Resour. Environ. 9 (1)
(2000) 4�/8.
R. Hua et al. / J. Pharm. Biomed. Anal. 33 (2003) 199�/209 209


![Regal Fritillary Petition - Wisconsin Public Radio · According to NatureServe (2012 at 14), “no butterfly anywhere in the world resembles this [the regal fritillary].” The species’](https://img.pdfslide.net/doc/110x75/607d062716bcd12054651245/regal-fritillary-petition-wisconsin-public-radio-according-to-natureserve-2012.jpg)