Embed Size (px)
Citation preview

Vol.:(0123456789)1 3
Journal of Medical Ultrasonics (2020) 47:3–11 https://doi.org/10.1007/s10396-019-00964-0
ORIGINAL ARTICLE–PHYSICS & ENGINEERING
Discrimination of thoracic spine from muscle based on their difference in ultrasound reflection and scattering characteristics
Tomohiro Yokoyama1 · Shohei Mori2 · Mototaka Arakawa1,2 · Eiko Onishi3 · Masanori Yamauchi3 · Hiroshi Kanai2,1
Received: 10 April 2019 / Accepted: 28 June 2019 / Published online: 21 August 2019 © The Japan Society of Ultrasonics in Medicine 2019
AbstractPurpose Medical ultrasound is often used to specify the puncture position during epidural anesthesia. However, visualization of the thoracic spine is difficult because of the complex structure, i.e., it is difficult to determine whether the thoracic spine or muscle is depicted. Therefore, this study aims to distinguish bone from muscle tissue using the differences in reflection and scattering characteristics of ultrasound.Methods We experimentally investigated the difference in signals received from bone and muscle. We proposed a new parameter utilizing the ratio of the amplitude of the received signals averaged in a wide range around the ideal delay line and that only along the ideal delay line, to emphasize the bone.Results First, we confirmed the difference in signals received from bone and muscle tissue by basic experiments. We also investi-gated the difference by in vitro experiments using chicken thigh and in vivo experiments in humans. In both experiments, the pro-posed method succeeded to clearly depict bone, suppressing the depiction of muscle, compared with conventional B-mode imaging.Conclusion Using the difference in the characteristics of reflection from bone and scattering from muscle tissue, we could distinguish bone from muscle tissue with the proposed method.
Keywords Ultrasound imaging · Epidural anesthesia · Bone · Muscle · Scattering · Reflection
Introduction
Epidural anesthesia is a local anesthesia. A needle is punc-tured from the spinal gap into the epidural space, and then an anesthetic is injected during surgery. It has the following three advantages compared to general anesthesia. First, the stress response is suppressed, and immunity is maintained during surgery for the lower limbs and lower abdomen. Sec-ond, pain after surgery can be drastically reduced by insert-ing a catheter that administers medication continuously. Third, the incidence of postoperative cardiovascular and
respiratory complications decreases [1]. Therefore, epidural anesthesia greatly contributes to analgesia during surgery and early recovery after surgery.
Gap identification is important for epidural anesthesia; however, it relies on the doctor’s experience and palpa-tion. The failure rate of epidural anesthesia was reported as 6–25% [2–4], and the proportion of patients who complained of back pain and mental distress was reported as 22% and 14%, respectively [5].
Before performing epidural anesthesia in clinical practice, practitioners often observe ultrasound images of the spine [6] to confirm the puncture position, but a clear image can-not be obtained [7]. Although various methods have been developed for using medical ultrasound in epidural anes-thesia [8, 9], puncture of the needle under real-time ultra-sonic guidance is still difficult due to the low capability of ultrasound imaging in bone. Automatic identification of the epidural space and extraction of vertebrae on epidural anes-thesia using ultrasound have been studied [10–12], but those studies involved the lumbar spine, which has a large gap and simple structure. In addition, ultrasound imaging related to
* Mototaka Arakawa [email protected]
1 Graduate School of Biomedical Engineering, Tohoku University, Sendai 980-8579, Japan
2 Graduate School of Engineering, Tohoku University, Sendai 980-8579, Japan
3 Department of Anesthesiology and Perioperative Medicine, Tohoku University School of Medicine, Sendai 980-8575, Japan

4 Journal of Medical Ultrasonics (2020) 47:3–11
1 3
bone has been increasingly used in the field of orthopedic surgery [13, 14], and methods using the distortion generated by the application of pressure [15, 16] or the phase symme-try [17] have been proposed. However, the spine, which has to be measured during the epidural anesthesia, is in a deeper position. In addition, the thoracic spine has a complicated structure and its visualization is difficult.
Therefore, to depict the surface of the thoracic spine, we proposed a method for improving the mismatch of the time-delay addition caused by the reflection of ultrasound at the surface of the thoracic spine [18] by applying the envelope method [19], in which the transmitted and received posi-tions of ultrasound signals are not regarded as the same, and the range point migration (RPM) method [20, 21]. As
Fig. 1 Schematic diagram of a the transmitted wave from each piezo-electric element of the ultrasound probe to form the focus beam and b–f reflected waves and received signals from various targets. The upper and lower figures in b–f show contour plots of envelope ampli-tudes of received signals at received elements and reflected waves
from the targets, respectively. Depth is calculated from the delay times of the received signals and the assumed sound velocity. Lower parts in the figures correspond to the deeper parts. b Point scatterer. c Muscle parallel to the probe. d Bone parallel to the probe. e Muscle tilted to the probe. f Bone tilted to the probe

5Journal of Medical Ultrasonics (2020) 47:3–11
1 3
a result, it was possible to depict the surface of the thoracic spine, which was unclear in B-mode images. However, there still remains the problem of muscle present in a shallower position than the thoracic spine also being depicted. In the present study, we investigate the difference in the reflection and scattering characteristics of ultrasound from the thoracic spine and muscle to depict the thoracic spine with the mus-cle suppressed. Then, we propose a method to identify the position of the thoracic spine utilizing the difference.
Principle
Difference in scattering and reflection between bone and muscle
Piezoelectric elements of an ultrasonic probe are usually used for the transmission and reception of ultrasound. Focused waves formed by a linear array probe are used to observe the thoracic spine. We examined differences in ultrasonic scattering and reflection characteristics at muscle and bone using the received signal at each receive element before delay addition for one transmission beam. To form the focused wave, ultrasound waves are transmitted from outer elements to the center element in order, as shown in the schematic diagram of Fig. 1a. Here, the arc drawn with the black line represents the wavefront of the transmitted wave from each element, and the yellow part represents the high-amplitude part caused by focusing, which is the main lobe. Usually, sidelobes are also formed around the main lobe, although they are not drawn in Fig. 1a.
Figures 1b–f are schematic diagrams of scattered or reflected waves from various targets (lower figures) and envelope amplitudes of the received waveforms at received elements by irradiating the usual focus wave in the ultra-sound diagnosis apparatus (upper figures). The delay time at each element for the transmission of the focused wave was corrected as the timing of the transmission from the center element became 0. The transmission delay time at each element and the distance from the target to the receiv-ing element were taken into account when drawing these schematic diagrams. The received signal at each element becomes a convolution between the transmitted wave and all scattered or reflected signals. Here, it was assumed that muscle tissue and bone were much larger than the wave-length of the ultrasound.
When the target is a point scatterer, a scattering wave is emitted from the scatterer and received at received ele-ments, as illustrated in Fig. 1b. Figure 1c illustrates the received waves from the muscle parallel to the probe. Fig-ure 1d illustrates the received waves from a bone paral-lel to the probe. Considering the scattering and reflection properties in the muscle tissues and bone surface, it is
thought that scatterers sparsely exist in muscle tissues and scatterers densely exist at the surface of bone. In the case of muscle tissue, each received wave is the same as that from the point scatterer, although the amplitude of the reflected waves except for the focal point is small owing to the low reflectance. On the other hand, in the case of bone, since the bone has a high reflectance, not only the main lobe of incident waves to the bone but also sidelobes of those are strongly reflected at the surface. As a result, a lot of reflected waves having high intensity reflected from different positions on the surface of the object are received at different times. Therefore, compared to the received sig-nals from the point scatterer and muscle, those from bone spread in the shallower region at the outer received ele-ments caused by the effect of the sidelobes.
Next, we consider cases where the targets are tilted to the probe. Figure 1e illustrates the received waves from muscle tilted to the probe. The received wave from the focal point is the same as that from the muscle parallel to the probe in Fig. 1c. The times that scattered waves are received from positions other than the focal position are different from those in the case of muscle tissue parallel to the probe, but the intensity of these scattered waves is much lower than that of the scattered waves from the focal point. Therefore, scattered waves from muscle are almost independent of the inclination of the target.
Figure 1f illustrates the received waves from a bone tilted to the probe. Ultrasound reflects specularly at the surface of the bone. Received waves with high amplitude are observed at the lateral position depending on the incli-nation of the bone and those widely spread in the depth direction at the opposite received elements.
In muscle tissue, received signals with high amplitude are always obtained around the center receiving element regardless of the tilt of the object. With bone, due to spec-ular reflection, received signals with high amplitude are received by the receiving element in the direction corre-sponding to the inclination of the object. These character-istics are useful to discriminate bone and muscle using the received waveforms at the received elements.
A new method to identify the position of bone
To identify the position of the thoracic spine, we utilize the characteristics that reflected waves from bone spread in the depth direction at the outer received elements and scattered waves from muscle follow the ideal delay-time distribution of the point scatterer. We use the received waveform obtained for each transmission beam i of the linear electronic opera-tion method [22], in which the multiple ultrasonic beams are transmitted while shifting the transmission positions. The B-mode image is obtained by summing the received wave-forms with the addition of a delay corresponding to the depth
6 Journal of Medical Ultrasonics (2020) 47:3–11
1 3
at each sampling point for each transmission beam i. This depicts all boundaries between media with different acous-tic impedances. Muscle tissue and bone, in particular, are depicted with high intensity. Here, we propose a new method to emphasize only the depiction of bone.
Figure 2 schematically shows the concept of the proposed method. Here, we explain using the schematic diagram of the received waveform obtained from bone. Figure 2a sketches contour plots of envelope amplitudes of received waves from bone and an ideal delay time from the point
scatterer to calculate Pline(d, i) . Pline(d, i) is the parameter indicating the sum of envelope signals Ai(t, j) along the ideal delay time �(d, j) from the point scatterer at the depth d for the transmitted beam number i at the n received elements.
where c is the sound speed. Ai(t, j) is obtained by the enve-lope detection of the rf signals.
(1)Pline(d, i) =
n−1∑
j=0
Ai{c�(d, j), j},
Fig. 2 Schematic diagram of the concept of the procedure in the proposed method. a The green line is the ideal delay-time distribution from the point scat-terer and Pline(d, i) is the sum of the amplitude on the line. b The zone within the blue frame is the region for calculation of Pzone(d, i) . w(j) is a window function. d means depth cal-culated from the delay time of received signals
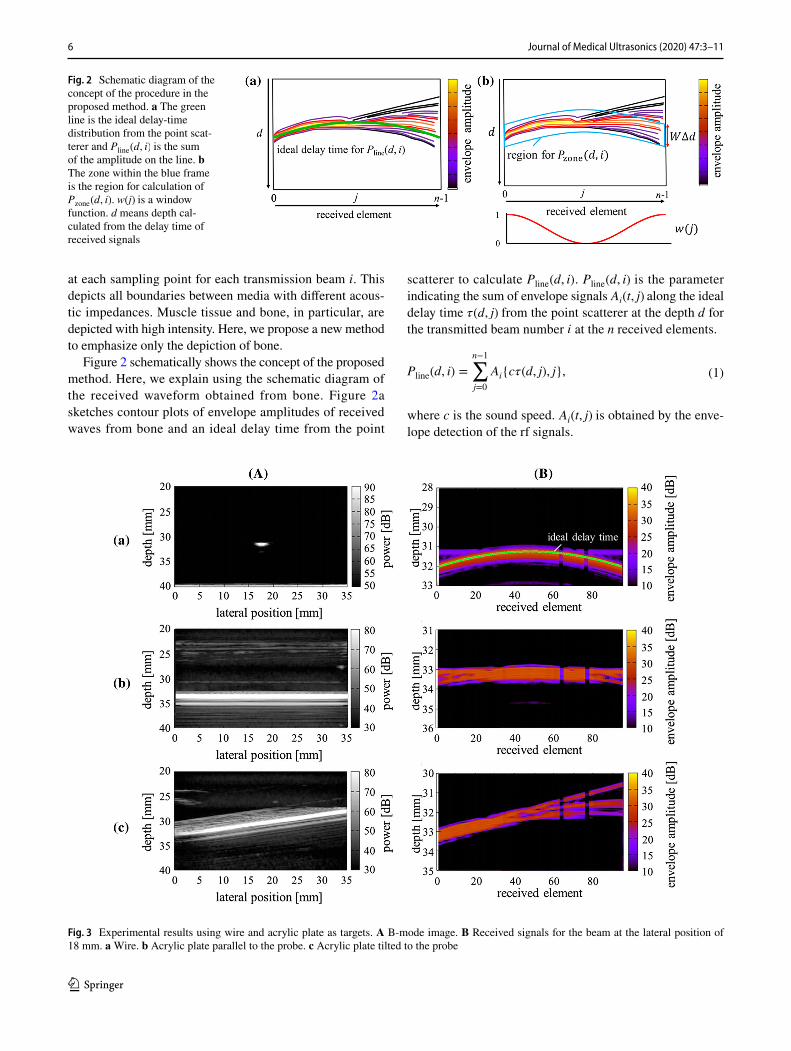
Fig. 3 Experimental results using wire and acrylic plate as targets. A B-mode image. B Received signals for the beam at the lateral position of 18 mm. a Wire. b Acrylic plate parallel to the probe. c Acrylic plate tilted to the probe

7Journal of Medical Ultrasonics (2020) 47:3–11
1 3
Figure 2b sketches contour plots of envelope ampli-tudes of received waves from bone and a region to calculate Pzone(d, i) as follows. Pzone(d, i) is the parameter indicating the average value of the sum of the envelope amplitude Ai(t, j) within the width WΔd at the center of the depth d for the transmitted beam number i. Here, W is the number of samplings and Δd is the sampling interval. A window function w(j) , as shown in Fig. 2, is multiplied to reduce the amplitudes obtained around the center receiving elements since the scattering waves from muscle tissues have high amplitude around center received elements, as shown in Fig. 1c and e.
Scattered waves from muscle follow the ideal delay-time distribution for scattered waves from the point scatterer. On the other hand, reflected waves from bone also contain the other components. Thus, Pline of muscle tissue and bone are almost the same, and Pzone of bone becomes larger than that of muscle tissue.
(2)
Pzone(d, i) =
∑n−1
j=0
�
w(j)1
W
∑ (W−1)∕2
k=−(W−1)∕2Ai{c�(d, j) + kΔd, j}
�
∑n−1
j=0w(j)
.
Fig. 4 Experimental results for chicken thigh with bone. A B-mode image. B Received signals for the beam at the lateral position of 18 mm. a Muscle parallel to the probe. b Bone parallel to the probe. c Muscle tilted 18° to the probe. d Bone tilted 7° to the probe

8 Journal of Medical Ultrasonics (2020) 47:3–11
1 3
In addition, we introduce the parameter Spower(d, i) . This parameter is Bpower(d, i) , which is the power of the B-mode image, multiplied by the ratio of Pzone(d, i) and Pline(d, i).
Spower(d, i) is large for bone and low for muscle tissue. There-fore, the bone can be emphasized and the muscle can be suppressed in the image composed by Spower(d, i) compared with the B-mode image.
Experimental conditions
We observed the received signals in fundamental experi-ments using a molybdenum wire and an acrylic plate, in in vitro experiments using chicken’s thigh, and in in vivo experiments with the human thoracic spine. Then, we applied the proposed method to in vitro experiments using chicken’s thigh and to in vivo experiments with the human thoracic spine.
First, we verified the difference in signals received from the wire and the acrylic plate as the point scatterer and the specularly reflecting object, respectively. The diameter of the wire was 0.2 mm, and the thickness of the plate was 40 mm.
Next, we examined the difference in the scattering and reflection characteristics of ultrasound from muscle and bone using a chicken thigh with bone. This chicken thigh with bone was wide compared with the probe, whose width was 36 mm. The chicken thigh was set at the depth of 30 mm in a water tank filled with physiological saline solution.
Finally, to compare the proposed method with the conven-tional B-mode image, we measured a paramedian image of the human thoracic spine centered on the thoracic gap, which should be depicted during the actual epidural anesthesia.
We used an ultrasound diagnosis apparatus (ProSound α-10, Aloka) and a linear array probe with 181 elements with a pitch of 0.2 mm. We used the focus beams by setting the number of transmit beams, the transmit frequency, the sampling frequency, and the focal distance as 181, 10 MHz, 40 MHz, and 30 mm, respectively, in the ultrasound diagno-sis apparatus. The temperature of the water was 23° C during the water tank experiment. Subjects A and B were healthy 23-year-old males, and subject C was a healthy 21-year-old male.
Results and discussion
Fundamental experiments
We examined the difference in the signals received from the wire and the acrylic plate. Figure 3 shows the results of
(3)Spower(d, i) = Bpower(d, i) ⋅
{
Pzone(d, i)
Pline(d, i)
}
,
(A) the B-mode images and (B) the received signals for the transmitted beam at the lateral position of 18 mm. Figure 3a shows the result for the wire. Only the waves along the ideal delay time from the point scatterer were acquired. Figure 3b shows the results for the acrylic plate parallel to the probe. Waves deviating from the ideal delay time from the point scatterer were also observed in the shallower region on the outer elements. Figure 3c shows the results for the acrylic plate tilted to the probe. Spread of the received waves to the shallower region was observed at the received elements on the right side. Waves with high amplitude were observed at the received elements on the left side. These were caused by the specular reflection at the surface of the acrylic plate. In the right side in Fig. 3B–c, three waves were observed in the depth direction. In principle, it must be continuous because the scattering points were densely distributed at the surface of bone. This might have been caused by the apodization of the transmitted wave in the ultrasound diagnosis apparatus.
In vitro experiment
The results for the chicken thigh with bone are shown in Fig. 4. Figure 4 shows the results of (A) the B-mode images and (B) the received signals for the transmitted beam at the lateral position of 18 mm. Figure 4a, b, c, and d show the results for muscle parallel to the probe, bone parallel to the probe, muscle tilted 18° to the probe, and bone tilted 7° to the probe, respectively.
Fig. 5 Depiction of chicken thigh with bone for the region including both muscle and bone. a B-mode image. b Image yielded by the pro-posed method

9Journal of Medical Ultrasonics (2020) 47:3–11
1 3
Similar received waves were observed for Fig. 4a and c because the transmitted waves were scattered at the sur-face of the muscle. In Fig. 4b and d, high-amplitude waves that deviated from the ideal delay-time distribution for the point scatterer were observed at the outer region of the received elements. The inclination of the wavefront was observed in Fig. 4d. The waves that scattered and reflected from muscle and bone were similar to those from the wire and the acrylic plate in Fig. 3, respectively. From these results, the scattering and reflection characteristics of mus-cle and bone were confirmed, respectively.
Figure 5 shows the measurement result for the region including both muscle and bone. Figure 5a shows the B-mode image and Fig. 5b shows the result for the pro-posed parameter Spower(d, i) . W was set at 50 in the present study based on the results in the fundamental experiment, as shown in Fig. 3. WΔd was 0.96 mm. Although WΔd was larger than the pulse width, the spatial resolution yielded by the proposed method was not inferior to that of the
conventional B-mode image. The spatial resolution of bone in the B-mode image was lowered by the widening of the reflection signals, as shown in Figs. 3B–b and B–c. From these results, it was demonstrated that bone was emphasized and muscle tissue was suppressed, although the surface of muscle was depicted, which is not a problem because the depth of the surface of tissues is 0 mm in vivo.
In vivo experiment
Figure 6 shows the results for the human thoracic spine in subject A. Figure 6a, b, and c show the B-mode image, the received waves from the muscle, and the received waves from the bone, respectively. Figure 6b and c were received beams for the transmitted beam at the lateral position of 9 mm. From Fig. 6b, the received waves from the muscle followed the ideal delay-time distribution from the point scatterer, and they had high amplitude from the 40th to 50th received elements at the depth of 17 mm. On the other hand,
Fig. 6 Results of in vivo experi-ment in subject A. a B-mode image. b Received signal from muscle. c Received signal from bone. d Pzone . e Pzone∕Pline . f Spower . g Bpower along yellow lines in (a) and (f). h Spower along yellow lines in (a) and (f)

10 Journal of Medical Ultrasonics (2020) 47:3–11
1 3
investigating the received waves from the bone in Fig. 6c, waves with high amplitude were observed from the 40th to 96th received elements at the depth of 27 mm, and waves that deviated from the ideal delay-time distribution of the point scatterer were also observed, especially around the 20th to 30th received elements. Therefore, the reflection and scattering properties of bone and muscle were also con-firmed, respectively, in the in vivo experiment.
We applied the proposed method to the measured data for subject A, as shown in Fig. 6. Figure 6a, d, e, and f show the results of Bpower , Pzone , Pzone∕Pline , and the pro-posed parameter Spower ( Pzone∕Pline × Bpower ), respectively.
The visualization of the thoracic spine with Pzone was bet-ter than that with Bpower ; however, the effect of muscle was still large. Using Pzone∕Pline , the thoracic spine was better emphasized than using Pzone . Figure 6g and h exhibit Bpower and Spower along the yellow lines, as shown in Fig. 6a and f. The proposed method suppressed the depiction of muscle and clearly depicted the shape of the thoracic spine.
Figure 7 shows the results for subjects B and C. In subject B, both the muscle tissue and the thoracic spine showed high intensity. In subject C, the thoracic spine was clearly visual-ized with the proposed method. For all subjects, Spower could obviously emphasize bone compared with Bpower.
Fig. 7 Results of in vivo experi-ment for (a)–(d) subject B and (e)–(h) subject C. a B-mode image. b Image yielded by the proposed method. c Bpower along yellow lines in (a) and (b). d Spower along yellow lines in (a) and (b). e B-mode image. f Image yielded by the proposed method. g Bpower along yellow lines in (e) and (f). h Spower along yellow lines in (e) and (f)
11Journal of Medical Ultrasonics (2020) 47:3–11
1 3
As for the reason why the proposed method could not distinguish between muscle tissue and bone in subject B, the fascia in subject B was denser than that in the other subjects, as seen in the B-mode image in Fig. 7a. Spower increased because reflection waves from other muscle might have been included in the calculation of Pzone.
Conclusions
In this paper, we developed a method of depicting the tho-racic spine utilizing the difference in reflection and scatter-ing characteristics of ultrasound from bone and muscle. The reflection and scattering characteristics were confirmed from the basic experiments and in vitro experiment. The proposed method was applied to the human thoracic spine, and bone was clearly depicted with suppression of the muscle pre-sent in the shallower region in three subjects. The proposed method should be useful for real-time monitoring during epidural anesthesia.
Compliance with ethical standards
Conflict of interest The authors have no conflicts of interest with re-gard to the presented research.
Informed consent Informed consent to the protocol was obtained from control subjects. The study was approved by our institutional ethics committee for human research.
References
1. Miller RD, Eriksson LI, Fleisher LA, Wiener-Kronish JP, Cohen NH, Young WL. Miller’s anesthesia. Philadelphia: Elsevier; 2015.
2. Konrad C, Schüpfer G, Wietlisbach M, Gerber H. Learning man-ual skills in anesthesiology: is there a recommended number of cases for anesthetic procedures? Anesth Analg. 1998;86:635–9.
3. Le Coq G, Le Ducot B, Benhamou D. Risk factors of inadequate pain relief during epidural analgesia for labour and delivery. Can J Anaesth. 1998;45:719–23.
4. Lewis MP, Thomas P, Wilson LF, Mulholland RC. The ‘whoosh’test. A clinical test to confirm correct needle placement in caudal epidural injections. Anaesthesia. 1992;47:57–8.
5. Finucane B. Complications of regional anesthesia. New York: Springer; 2009. p. 441.
6. Yamauchi M. Ultrasound-guided neuraxial block. Trends Anaesth. Crit. Care. 2012;2:234–43.
7. Grau T, Leipold RW, Delorme S, Martin E, Motsch J. Ultrasound imaging of the thoracic epidural space. Reg Anesth Pain Med. 2002;27:200–6.
8. Tiouririne M, Dixon AJ, Mauldin FW Jr, Scalzo D, Krishnaraj A. Imaging performance of a handheld ultrasound system with real-time computer-aided detection of lumbar spine anatomy: a feasibility study. Invest Radiol. 2017;52:447–55.
9. Rafii-Tari H, Lessoway VA, Kamani AA, Abolmaesumi P, Rohling R. Panorama ultrasound for navigation and guidance of epidural anesthesia. Ultrasound Med Biol. 2015;41:2220–31.
10. Yu S, Tan KK, Sng BL, Li S, Sia ATH. Automatic identification of needle insertion site in epidural anesthesia with a cascading classifier. Ultrasound Med Biol. 2014;40:1980–90.
11. Kerby B, Rohling R, Nair V, Abolmaesumi P. Conf. Proc. IEEE Eng Med Biol Soc. 2008; 2980.
12. Tran D, Rohling RN. Automatic detection of lumbar anatomy in ultrasound images of human subjects. IEEE Trans Biomed Eng. 2010;57:2248–56.
13. Quader N, Hodgson A, Abugharbieh R. Confidence weighted local phase features for robust bone surface segmentation in ultrasound. Conference Proceedings. Clinical image-based procedures. Trans-lational research in medical imaging. Cham: Springer; 2014. p. 76–83.
14. Ozdemir F, Ozkan E, Goksel O. Graphical modeling of ultrasound propagation in tissue for automatic bone segmentation. Conf. Proc Medl Image Comput Comput Assist Interv. Cham: Springer; 2016. p. 256–64.
15. Eby SF, Song P, Chen S, Chen Q, Greenleaf JF, An KN. Valida-tion of shear wave elastography in skeletal muscle. J Biomech. 2013;46:2381–7.
16. Hussain MA, Hodgson AJ, Abugharbieh R. Strain-initialized robust bone surface detection in 3-D ultrasound. Ultrasound Med Biol. 2017;43:648–61.
17. Hacihaliloglu I, Abugharbieh R, Hodgson AJ, Rohling RN. Bone surface localization in ultrasound using image phase-based fea-tures. Ultrasound Med Biol. 2009;35:1475–87.
18. Takahashi K, Taki H, Onishi E, Yamauchi M, Kanai H. Imaging of human vertebral surface using ultrasound RF data received at each element of probe for thoracic anesthesia. Jpn J Appl Phys. 2017;56:07JF01.
19. Sakamoto T, Taki H, Sato T. An experimental study of ultrasonic imaging with a reduced number of array elements using the enve-lope method. Acoust Sci Tech. 2011;32:143–50.
20. Kidera S, Sakamoto T, Sato T. Accurate UWB radar three-dimensional imaging algorithm for a complex boundary with-out range point connections. IEEE Trans Geosci Remote Sens. 2010;48:1993–2004.
21. Taki H, Tanimura S, Sakamoto T, Shiina T, Sato T. Accurate ultrasound imaging based on range point migration method for the depiction of fetal surface. Jpn J Appl Phys. 2015;42:51–8.
22. Nihon Denshi Kikai Kougyoukai. Handbook of ultrasonic diag-nostic equipments. Tokyo, Corona; 1997 (in Japanese).
Publisher’s Note Springer Nature remains neutral with regard to jurisdictional claims in published maps and institutional affiliations.