Embed Size (px)
Citation preview
ORIGINAL PAPER
Discrimination of TiO2 polymorphs in sedimentaryand metamorphic rocks
Silke Triebold • George Luiz Luvizotto •
Raimon Tolosana-Delgado • Thomas Zack •
Hilmar von Eynatten
Received: 10 February 2010 / Accepted: 29 June 2010 / Published online: 13 July 2010
� The Author(s) 2010. This article is published with open access at Springerlink.com
Abstract Investigation by Raman spectroscopy of sam-
ples from different geological settings shows that the
occurrence of TiO2 polymorphs other than rutile can hardly
be predicted, and furthermore, the occurrence of anatase is
more widespread than previously thought. Metamorphic
pressure and temperature, together with whole rock
chemistry, control the occurrence of anatase, whereas
variation of mineral assemblage characteristics and/or fluid
occurrence or composition takes influence on anatase trace
element characteristics and re-equilibration of relict rutiles.
Evaluation of trace element contents obtained by electron
microprobe in anatase, brookite, and rutile shows that these
vary significantly between the three TiO2 phases. There-
fore, on the one hand, an appropriation to source rock type
according to Nb and Cr contents, but as well application of
thermometry on the basis of Zr contents, would lead to
erroneous results if no phase specification is done before-
hand. For the elements Cr, V, Fe, and Nb, variation
between the polymorphs is systematic and can be used for
discrimination on the basis of a linear discriminant analy-
sis. Using phase group means and coefficients of linear
discriminants obtained from a compilation of analyses
from samples with well-defined phase information together
with prior probabilities of groupings from a natural sample
compilation, one is able to calculate phase grouping
probabilities of any TiO2 analysis containing at least the
critical elements Cr, V, Fe, and Nb. An application of this
calculation shows that for the appropriation to the phase
rutile, a correct-classification rate of 99.5% is obtained.
Hence, phase specification by trace elements proves to be a
valuable tool besides Raman spectroscopy.
Keywords TiO2 polymorph discrimination �Phase classification � Anatase � Brookite � Rutile �Erzgebirge � Zr-in-rutile thermometry
Introduction
In the last few years, the application of rutile trace element
systematics as tracer for metamorphic and sedimentary
processes (provenance analysis) received wide attention.
Zack et al. (2004b) and Watson et al. (2006), refined by
Tomkins et al. (2007) establish rutile thermometry based
on the increasing incorporation of Zr with rising
Communicated by T. L. Grove.
Electronic supplementary material The online version of thisarticle (doi:10.1007/s00410-010-0551-x) contains supplementarymaterial, which is available to authorized users.
S. Triebold (&) � H. von Eynatten
Abt. Sedimentologie und Umweltgeologie, GZG,
Universitat Gottingen, Goldschmidtstr. 3,
37077 Gottingen, Germany
e-mail: [email protected]
G. L. Luvizotto
Mineralogisches Institut, Universitat Heidelberg,
Im Neuenheimer Feld 236, 69120 Heidelberg, Germany
Present Address:G. L. Luvizotto
Max-Planck-Institut fur Chemie,
Joh.-Joachim-Becher Weg 27, 55128 Mainz, Germany
R. Tolosana-Delgado
Departament d’Enginyeria Hidraulica, Marıtima i Ambiental,
Universitat Politecnica de Catalunya, c/Jordi Girona, 1-3,
08034 Barcelona, Spain
T. Zack
Institut fur Geowissenschaften, Universitat Mainz,
Becher Weg 21, 55128 Mainz, Germany
123
Contrib Mineral Petrol (2011) 161:581–596
DOI 10.1007/s00410-010-0551-x
metamorphic temperature. Zack et al. (2004a) constrain
concentration ranges for Nb and Cr, which discriminate
rutile deriving from pelitic or mafic source rocks. High U
contents provide the opportunity to apply U/Pb- or (U-Th)/
He dating techniques (e.g., Mezger et al. 1989; Vry et al.
2003; Vry and Baker 2006; Stockli et al. 2007). Further
work addresses the applicability of the rutile thermometer
(Spear et al. 2006; Zack and Luvizotto 2006; Triebold
et al. 2007; Luvizotto and Zack 2009) and lithology dis-
crimination using Nb and Cr contents (Triebold et al. 2007;
Meinhold et al. 2008; Luvizotto and Zack 2009). It is
found in different studies, that by inclusion of rutile in
other mineral phases, Zr contents in rutile are inhibited
from re-equilibrating during prograde (Spear et al. 2006) or
retrograde (Zack et al. 2004b; Triebold et al. 2007) meta-
morphism and hence maximum Zr contents within a rock
or sand sample should be used for thermometry.
Additionally to rutile, both brookite and anatase are
likely to occur in any metamorphic and sedimentary
environment. Older experimental results (e.g., Dachille
et al. 1968; Jamieson and Olinger 1969) indicate that
anatase and brookite are the low-T and low-P TiO2 phases,
being stable up to about 600�C at air pressure and 100�C at
2 GPa (anatase) and up to about 700�C at air pressure and
ca. 475�C at 0.8 GPa (brookite). Above about 475�C, rutile
is the major stable phase. However, already Dachille et al.
(1968), supported by new work (Grzmil et al. 2007;
Sembaev et al. 2008) stress that whole rock composition
plays an important role in the variation of the transition to
rutile. Smith et al. (2009) found that the transition from
anatase to rutile is thermodynamically favorable at all
temperatures, and the formation of anatase requires low-
temperature aqueous conditions. At ultrahigh pressure
conditions, TiO2 (II) (a-PbO2 structure) is stable (Withers
et al. 2003). Hwang et al. (2000) find this phase included in
garnet in the Erzgebirge.
In their crystal structures, rutile and anatase are the most
similar TiO2 polymorphs, both crystallize in the tetragonal
crystal system. The brookite crystal structure is orthorhom-
bic. Common to all three polymorphs is their being built of
TiO6 octahedra, which are connected among each other in
different ways depending on the polymorph type: in rutile,
each octahedron is connected to two, in brookite to three, and
in anatase to four neighboring octahedra via its edges.
In this contribution, we will demonstrate that rutile Cr/
Nb systematics and Zr-in-rutile thermometry cannot be
applied to brookite or anatase. Thus, classification of TiO2
phases is necessary before applying these tools. This is
especially valid for sedimentary provenance studies, where
source rock paragenesis is usually not known, and thus,
petrological constraints derived from single grains are
important (e.g., Weltje and von Eynatten 2004). We will
evaluate and introduce various ways of TiO2 polymorph
discrimination of embedded single grains. Optical micro-
scopy and scanning-electron microscopy (SEM) imaging,
Raman spectroscopy and chemical composition by electron
microprobe (EMP) have been explored.
Sample description and geological setting
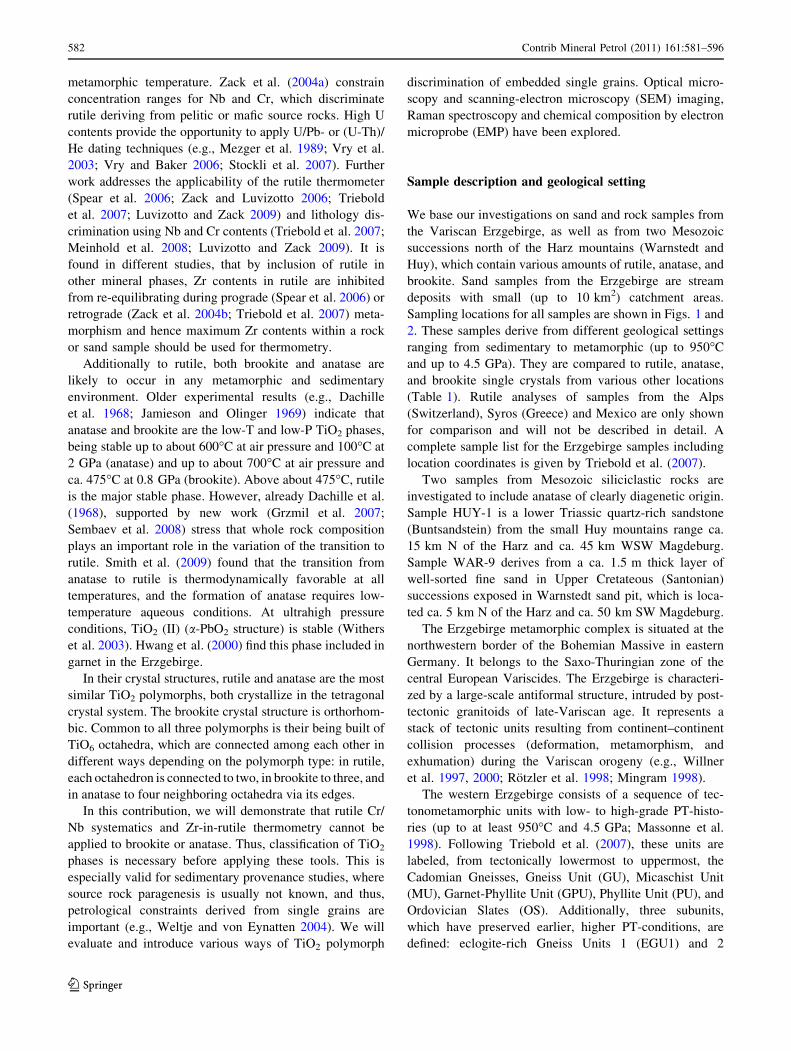
We base our investigations on sand and rock samples from
the Variscan Erzgebirge, as well as from two Mesozoic
successions north of the Harz mountains (Warnstedt and
Huy), which contain various amounts of rutile, anatase, and
brookite. Sand samples from the Erzgebirge are stream
deposits with small (up to 10 km2) catchment areas.
Sampling locations for all samples are shown in Figs. 1 and
2. These samples derive from different geological settings
ranging from sedimentary to metamorphic (up to 950�C
and up to 4.5 GPa). They are compared to rutile, anatase,
and brookite single crystals from various other locations
(Table 1). Rutile analyses of samples from the Alps
(Switzerland), Syros (Greece) and Mexico are only shown
for comparison and will not be described in detail. A
complete sample list for the Erzgebirge samples including
location coordinates is given by Triebold et al. (2007).
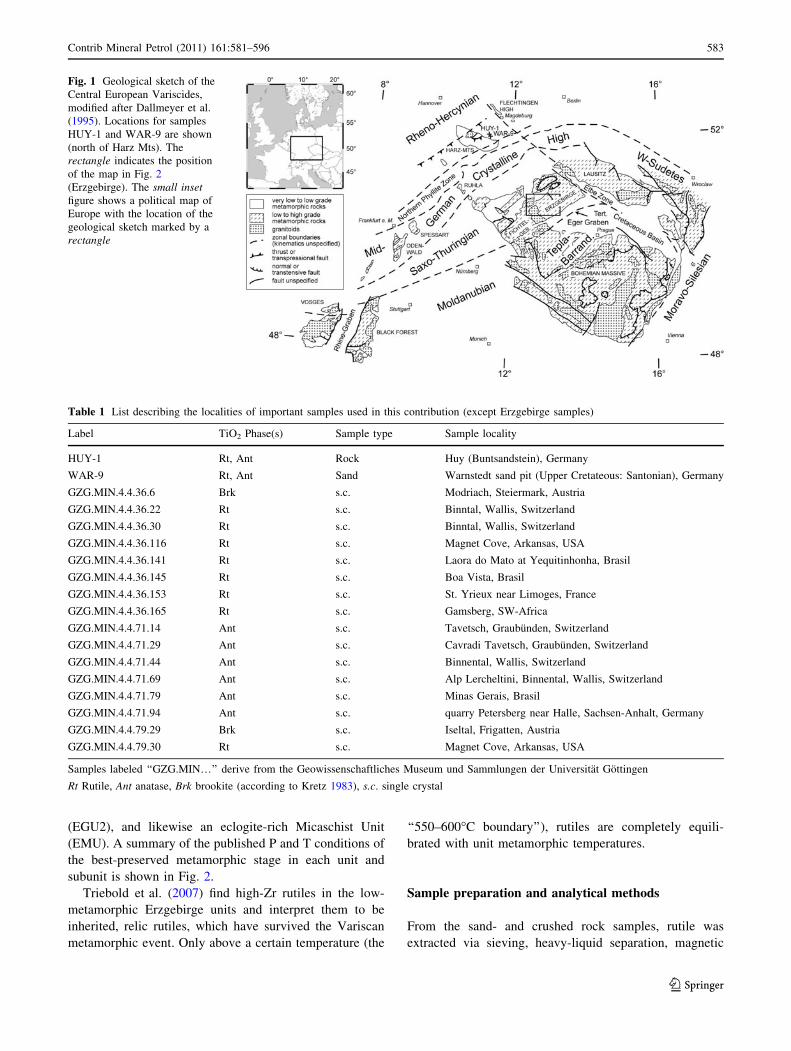
Two samples from Mesozoic siliciclastic rocks are
investigated to include anatase of clearly diagenetic origin.
Sample HUY-1 is a lower Triassic quartz-rich sandstone
(Buntsandstein) from the small Huy mountains range ca.
15 km N of the Harz and ca. 45 km WSW Magdeburg.
Sample WAR-9 derives from a ca. 1.5 m thick layer of
well-sorted fine sand in Upper Cretateous (Santonian)
successions exposed in Warnstedt sand pit, which is loca-
ted ca. 5 km N of the Harz and ca. 50 km SW Magdeburg.
The Erzgebirge metamorphic complex is situated at the
northwestern border of the Bohemian Massive in eastern
Germany. It belongs to the Saxo-Thuringian zone of the
central European Variscides. The Erzgebirge is characteri-
zed by a large-scale antiformal structure, intruded by post-
tectonic granitoids of late-Variscan age. It represents a
stack of tectonic units resulting from continent–continent
collision processes (deformation, metamorphism, and
exhumation) during the Variscan orogeny (e.g., Willner
et al. 1997, 2000; Rotzler et al. 1998; Mingram 1998).
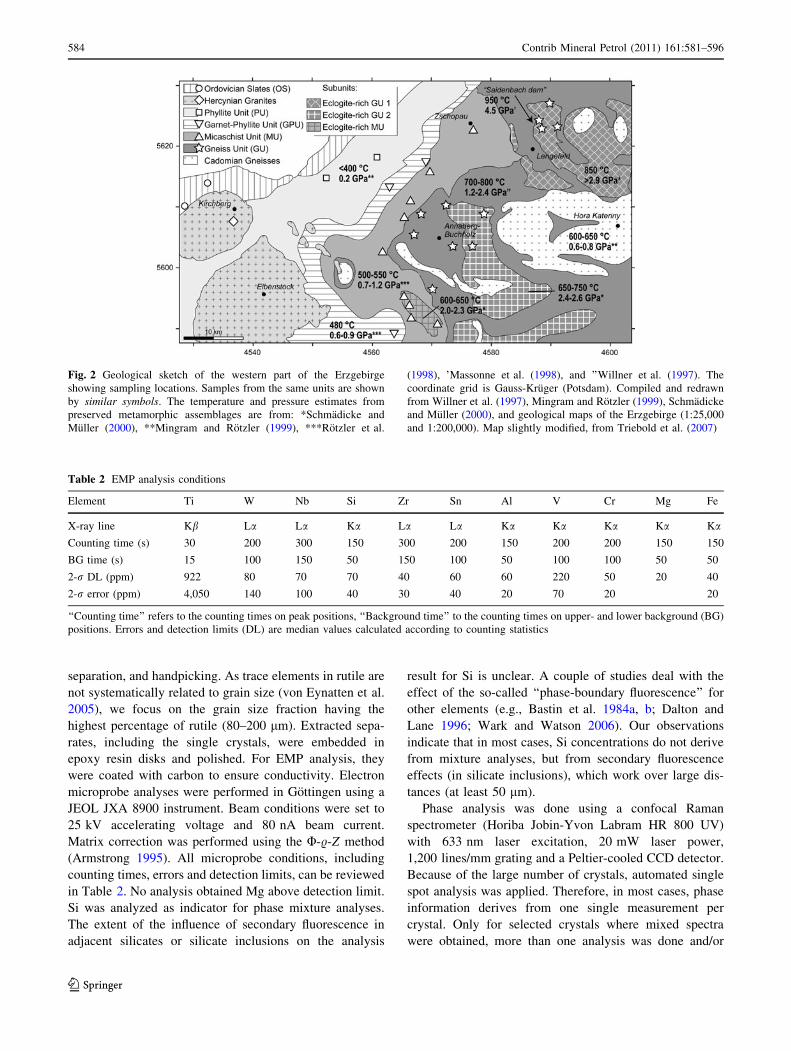
The western Erzgebirge consists of a sequence of tec-
tonometamorphic units with low- to high-grade PT-histo-
ries (up to at least 950�C and 4.5 GPa; Massonne et al.
1998). Following Triebold et al. (2007), these units are
labeled, from tectonically lowermost to uppermost, the
Cadomian Gneisses, Gneiss Unit (GU), Micaschist Unit
(MU), Garnet-Phyllite Unit (GPU), Phyllite Unit (PU), and
Ordovician Slates (OS). Additionally, three subunits,
which have preserved earlier, higher PT-conditions, are
defined: eclogite-rich Gneiss Units 1 (EGU1) and 2
582 Contrib Mineral Petrol (2011) 161:581–596
123
(EGU2), and likewise an eclogite-rich Micaschist Unit
(EMU). A summary of the published P and T conditions of
the best-preserved metamorphic stage in each unit and
subunit is shown in Fig. 2.
Triebold et al. (2007) find high-Zr rutiles in the low-
metamorphic Erzgebirge units and interpret them to be
inherited, relic rutiles, which have survived the Variscan
metamorphic event. Only above a certain temperature (the
‘‘550–600�C boundary’’), rutiles are completely equili-
brated with unit metamorphic temperatures.
Sample preparation and analytical methods
From the sand- and crushed rock samples, rutile was
extracted via sieving, heavy-liquid separation, magnetic
Fig. 1 Geological sketch of the
Central European Variscides,
modified after Dallmeyer et al.
(1995). Locations for samples
HUY-1 and WAR-9 are shown
(north of Harz Mts). The
rectangle indicates the position
of the map in Fig. 2
(Erzgebirge). The small insetfigure shows a political map of
Europe with the location of the
geological sketch marked by a
rectangle
Table 1 List describing the localities of important samples used in this contribution (except Erzgebirge samples)
Label TiO2 Phase(s) Sample type Sample locality
HUY-1 Rt, Ant Rock Huy (Buntsandstein), Germany
WAR-9 Rt, Ant Sand Warnstedt sand pit (Upper Cretateous: Santonian), Germany
GZG.MIN.4.4.36.6 Brk s.c. Modriach, Steiermark, Austria
GZG.MIN.4.4.36.22 Rt s.c. Binntal, Wallis, Switzerland
GZG.MIN.4.4.36.30 Rt s.c. Binntal, Wallis, Switzerland
GZG.MIN.4.4.36.116 Rt s.c. Magnet Cove, Arkansas, USA
GZG.MIN.4.4.36.141 Rt s.c. Laora do Mato at Yequitinhonha, Brasil
GZG.MIN.4.4.36.145 Rt s.c. Boa Vista, Brasil
GZG.MIN.4.4.36.153 Rt s.c. St. Yrieux near Limoges, France
GZG.MIN.4.4.36.165 Rt s.c. Gamsberg, SW-Africa
GZG.MIN.4.4.71.14 Ant s.c. Tavetsch, Graubunden, Switzerland
GZG.MIN.4.4.71.29 Ant s.c. Cavradi Tavetsch, Graubunden, Switzerland
GZG.MIN.4.4.71.44 Ant s.c. Binnental, Wallis, Switzerland
GZG.MIN.4.4.71.69 Ant s.c. Alp Lercheltini, Binnental, Wallis, Switzerland
GZG.MIN.4.4.71.79 Ant s.c. Minas Gerais, Brasil
GZG.MIN.4.4.71.94 Ant s.c. quarry Petersberg near Halle, Sachsen-Anhalt, Germany
GZG.MIN.4.4.79.29 Brk s.c. Iseltal, Frigatten, Austria
GZG.MIN.4.4.79.30 Rt s.c. Magnet Cove, Arkansas, USA
Samples labeled ‘‘GZG.MIN…’’ derive from the Geowissenschaftliches Museum und Sammlungen der Universitat Gottingen
Rt Rutile, Ant anatase, Brk brookite (according to Kretz 1983), s.c. single crystal
Contrib Mineral Petrol (2011) 161:581–596 583
123
separation, and handpicking. As trace elements in rutile are
not systematically related to grain size (von Eynatten et al.
2005), we focus on the grain size fraction having the
highest percentage of rutile (80–200 lm). Extracted sepa-
rates, including the single crystals, were embedded in
epoxy resin disks and polished. For EMP analysis, they
were coated with carbon to ensure conductivity. Electron
microprobe analyses were performed in Gottingen using a
JEOL JXA 8900 instrument. Beam conditions were set to
25 kV accelerating voltage and 80 nA beam current.
Matrix correction was performed using the U-.-Z method
(Armstrong 1995). All microprobe conditions, including
counting times, errors and detection limits, can be reviewed
in Table 2. No analysis obtained Mg above detection limit.
Si was analyzed as indicator for phase mixture analyses.
The extent of the influence of secondary fluorescence in
adjacent silicates or silicate inclusions on the analysis
result for Si is unclear. A couple of studies deal with the
effect of the so-called ‘‘phase-boundary fluorescence’’ for
other elements (e.g., Bastin et al. 1984a, b; Dalton and
Lane 1996; Wark and Watson 2006). Our observations
indicate that in most cases, Si concentrations do not derive
from mixture analyses, but from secondary fluorescence
effects (in silicate inclusions), which work over large dis-
tances (at least 50 lm).
Phase analysis was done using a confocal Raman
spectrometer (Horiba Jobin-Yvon Labram HR 800 UV)
with 633 nm laser excitation, 20 mW laser power,
1,200 lines/mm grating and a Peltier-cooled CCD detector.
Because of the large number of crystals, automated single
spot analysis was applied. Therefore, in most cases, phase
information derives from one single measurement per
crystal. Only for selected crystals where mixed spectra
were obtained, more than one analysis was done and/or
Fig. 2 Geological sketch of the western part of the Erzgebirge
showing sampling locations. Samples from the same units are shown
by similar symbols. The temperature and pressure estimates from
preserved metamorphic assemblages are from: *Schmadicke and
Muller (2000), **Mingram and Rotzler (1999), ***Rotzler et al.
(1998), ’Massonne et al. (1998), and ’’Willner et al. (1997). The
coordinate grid is Gauss-Kruger (Potsdam). Compiled and redrawn
from Willner et al. (1997), Mingram and Rotzler (1999), Schmadicke
and Muller (2000), and geological maps of the Erzgebirge (1:25,000
and 1:200,000). Map slightly modified, from Triebold et al. (2007)
Table 2 EMP analysis conditions
Element Ti W Nb Si Zr Sn Al V Cr Mg Fe
X-ray line Kb La La Ka La La Ka Ka Ka Ka Ka
Counting time (s) 30 200 300 150 300 200 150 200 200 150 150
BG time (s) 15 100 150 50 150 100 50 100 100 50 50
2-r DL (ppm) 922 80 70 70 40 60 60 220 50 20 40
2-r error (ppm) 4,050 140 100 40 30 40 20 70 20 20
‘‘Counting time’’ refers to the counting times on peak positions, ‘‘Background time’’ to the counting times on upper- and lower background (BG)
positions. Errors and detection limits (DL) are median values calculated according to counting statistics
584 Contrib Mineral Petrol (2011) 161:581–596
123
detailed mapping with 5 lm increments was applied. In
both single spot analyses and mappings, a 100 9 objective
and a confocal hole of 200 lm were used.
Results
Raman spectroscopy
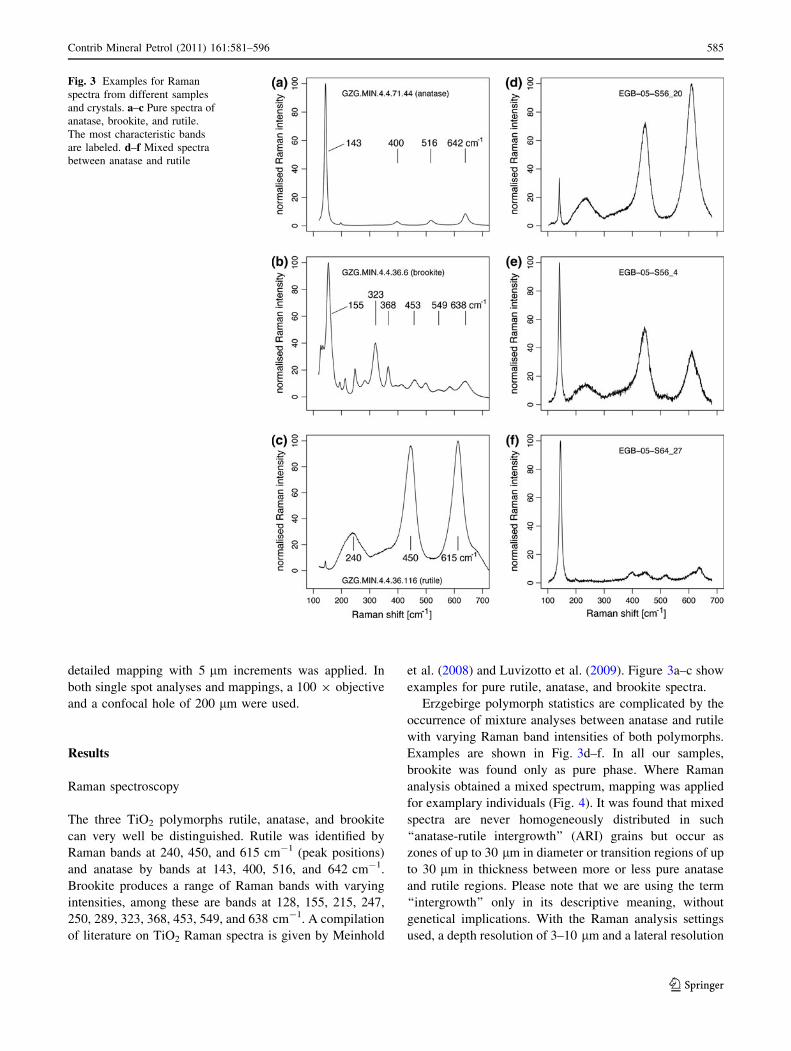
The three TiO2 polymorphs rutile, anatase, and brookite
can very well be distinguished. Rutile was identified by
Raman bands at 240, 450, and 615 cm-1 (peak positions)
and anatase by bands at 143, 400, 516, and 642 cm-1.
Brookite produces a range of Raman bands with varying
intensities, among these are bands at 128, 155, 215, 247,
250, 289, 323, 368, 453, 549, and 638 cm-1. A compilation
of literature on TiO2 Raman spectra is given by Meinhold
et al. (2008) and Luvizotto et al. (2009). Figure 3a–c show
examples for pure rutile, anatase, and brookite spectra.
Erzgebirge polymorph statistics are complicated by the
occurrence of mixture analyses between anatase and rutile
with varying Raman band intensities of both polymorphs.
Examples are shown in Fig. 3d–f. In all our samples,
brookite was found only as pure phase. Where Raman
analysis obtained a mixed spectrum, mapping was applied
for examplary individuals (Fig. 4). It was found that mixed
spectra are never homogeneously distributed in such
‘‘anatase-rutile intergrowth’’ (ARI) grains but occur as
zones of up to 30 lm in diameter or transition regions of up
to 30 lm in thickness between more or less pure anatase
and rutile regions. Please note that we are using the term
‘‘intergrowth’’ only in its descriptive meaning, without
genetical implications. With the Raman analysis settings
used, a depth resolution of 3–10 lm and a lateral resolution
Fig. 3 Examples for Raman
spectra from different samples
and crystals. a–c Pure spectra of
anatase, brookite, and rutile.
The most characteristic bands
are labeled. d–f Mixed spectra
between anatase and rutile
Contrib Mineral Petrol (2011) 161:581–596 585
123
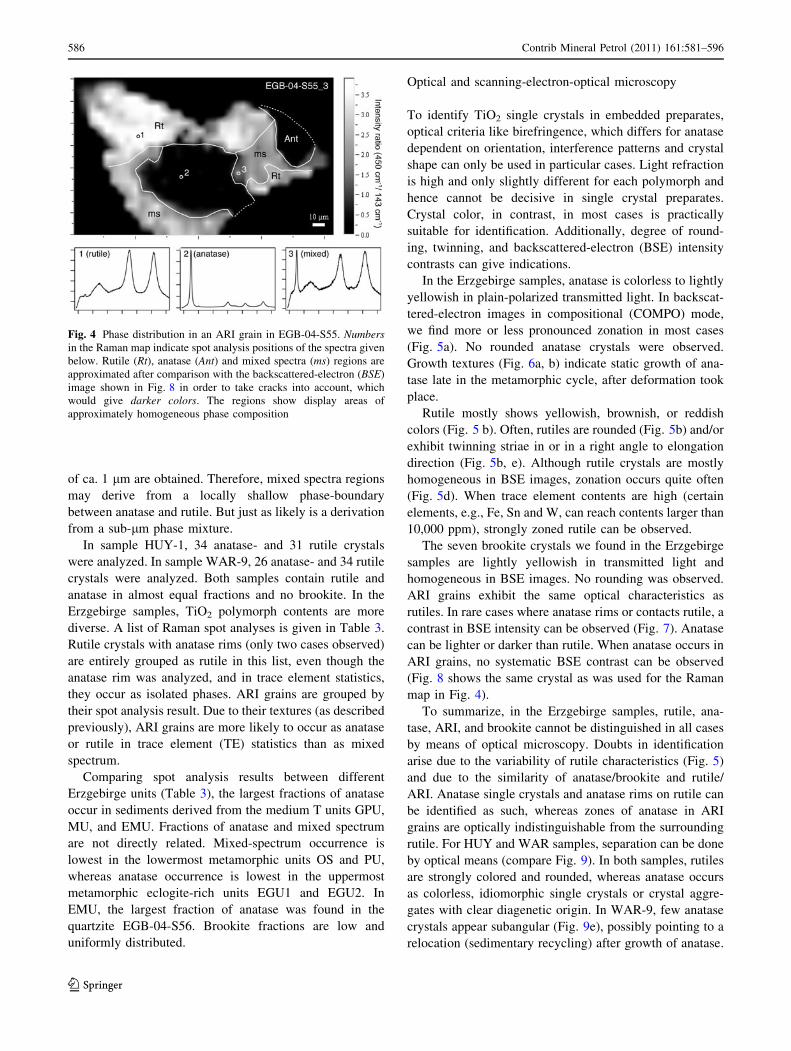
of ca. 1 lm are obtained. Therefore, mixed spectra regions
may derive from a locally shallow phase-boundary
between anatase and rutile. But just as likely is a derivation
from a sub-lm phase mixture.
In sample HUY-1, 34 anatase- and 31 rutile crystals
were analyzed. In sample WAR-9, 26 anatase- and 34 rutile
crystals were analyzed. Both samples contain rutile and
anatase in almost equal fractions and no brookite. In the
Erzgebirge samples, TiO2 polymorph contents are more
diverse. A list of Raman spot analyses is given in Table 3.
Rutile crystals with anatase rims (only two cases observed)
are entirely grouped as rutile in this list, even though the
anatase rim was analyzed, and in trace element statistics,
they occur as isolated phases. ARI grains are grouped by
their spot analysis result. Due to their textures (as described
previously), ARI grains are more likely to occur as anatase
or rutile in trace element (TE) statistics than as mixed
spectrum.
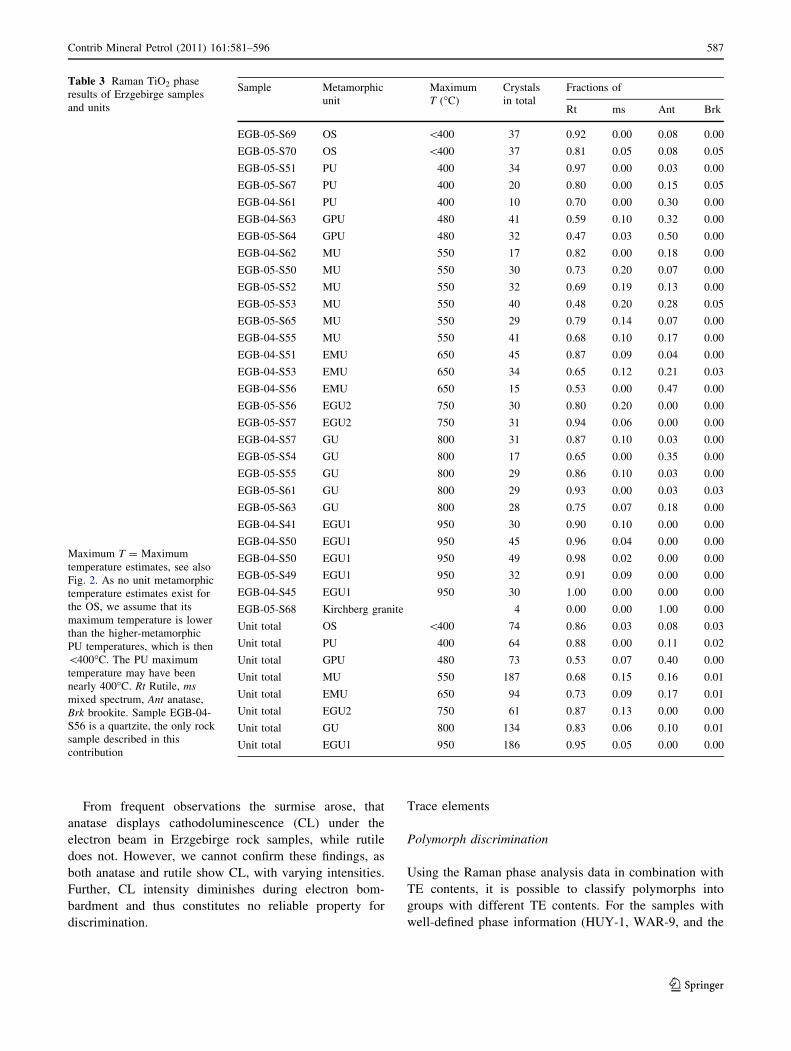
Comparing spot analysis results between different
Erzgebirge units (Table 3), the largest fractions of anatase
occur in sediments derived from the medium T units GPU,
MU, and EMU. Fractions of anatase and mixed spectrum
are not directly related. Mixed-spectrum occurrence is
lowest in the lowermost metamorphic units OS and PU,
whereas anatase occurrence is lowest in the uppermost
metamorphic eclogite-rich units EGU1 and EGU2. In
EMU, the largest fraction of anatase was found in the
quartzite EGB-04-S56. Brookite fractions are low and
uniformly distributed.
Optical and scanning-electron-optical microscopy
To identify TiO2 single crystals in embedded preparates,
optical criteria like birefringence, which differs for anatase
dependent on orientation, interference patterns and crystal
shape can only be used in particular cases. Light refraction
is high and only slightly different for each polymorph and
hence cannot be decisive in single crystal preparates.
Crystal color, in contrast, in most cases is practically
suitable for identification. Additionally, degree of round-
ing, twinning, and backscattered-electron (BSE) intensity
contrasts can give indications.
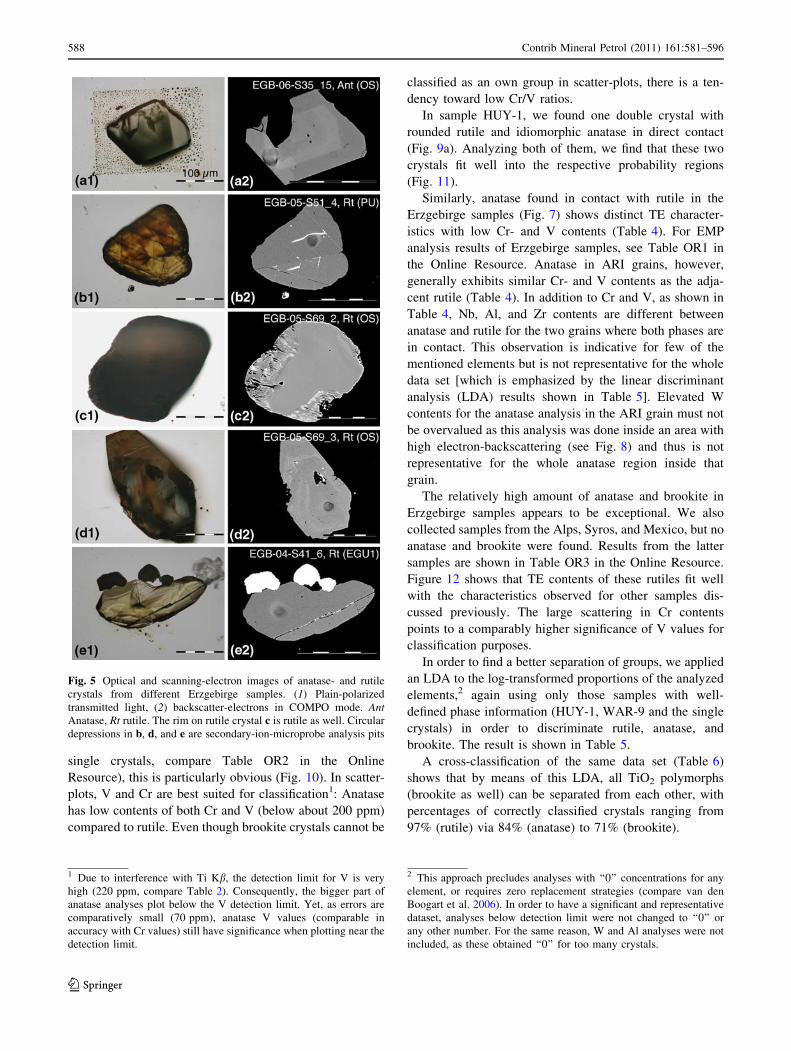
In the Erzgebirge samples, anatase is colorless to lightly
yellowish in plain-polarized transmitted light. In backscat-
tered-electron images in compositional (COMPO) mode,
we find more or less pronounced zonation in most cases
(Fig. 5a). No rounded anatase crystals were observed.
Growth textures (Fig. 6a, b) indicate static growth of ana-
tase late in the metamorphic cycle, after deformation took
place.
Rutile mostly shows yellowish, brownish, or reddish
colors (Fig. 5 b). Often, rutiles are rounded (Fig. 5b) and/or
exhibit twinning striae in or in a right angle to elongation
direction (Fig. 5b, e). Although rutile crystals are mostly
homogeneous in BSE images, zonation occurs quite often
(Fig. 5d). When trace element contents are high (certain
elements, e.g., Fe, Sn and W, can reach contents larger than
10,000 ppm), strongly zoned rutile can be observed.
The seven brookite crystals we found in the Erzgebirge
samples are lightly yellowish in transmitted light and
homogeneous in BSE images. No rounding was observed.
ARI grains exhibit the same optical characteristics as
rutiles. In rare cases where anatase rims or contacts rutile, a
contrast in BSE intensity can be observed (Fig. 7). Anatase
can be lighter or darker than rutile. When anatase occurs in
ARI grains, no systematic BSE contrast can be observed
(Fig. 8 shows the same crystal as was used for the Raman
map in Fig. 4).
To summarize, in the Erzgebirge samples, rutile, ana-
tase, ARI, and brookite cannot be distinguished in all cases
by means of optical microscopy. Doubts in identification
arise due to the variability of rutile characteristics (Fig. 5)
and due to the similarity of anatase/brookite and rutile/
ARI. Anatase single crystals and anatase rims on rutile can
be identified as such, whereas zones of anatase in ARI
grains are optically indistinguishable from the surrounding
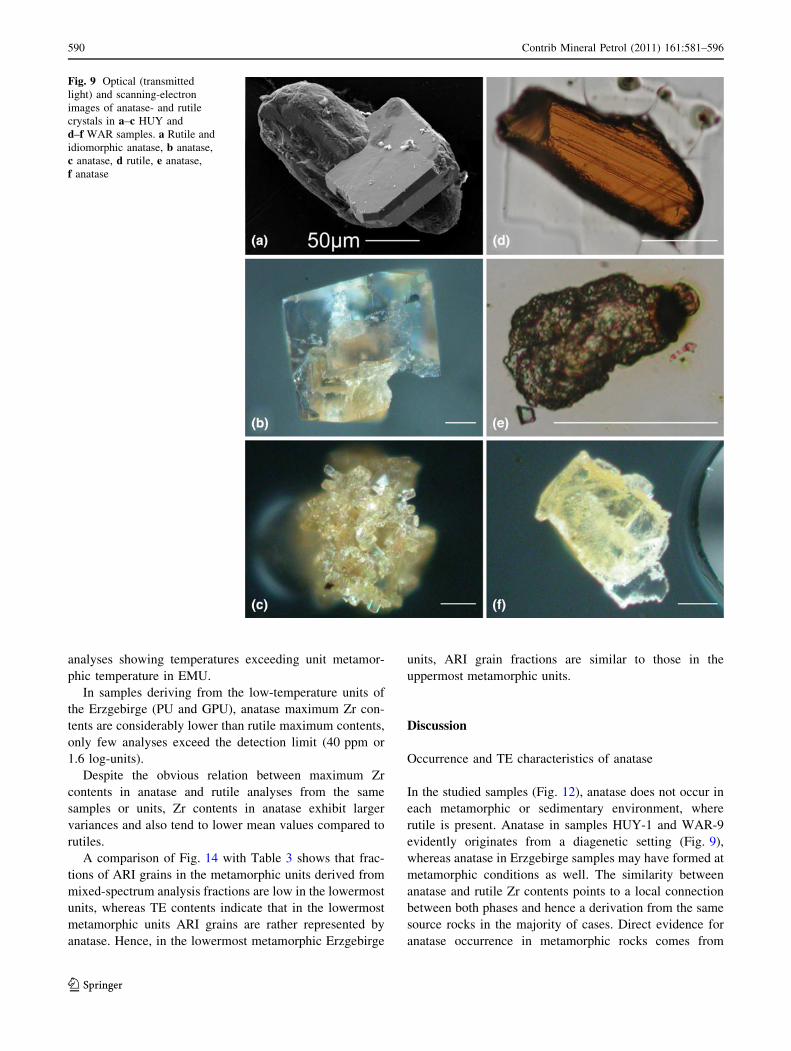
rutile. For HUY and WAR samples, separation can be done
by optical means (compare Fig. 9). In both samples, rutiles
are strongly colored and rounded, whereas anatase occurs
as colorless, idiomorphic single crystals or crystal aggre-
gates with clear diagenetic origin. In WAR-9, few anatase
crystals appear subangular (Fig. 9e), possibly pointing to a
relocation (sedimentary recycling) after growth of anatase.
Fig. 4 Phase distribution in an ARI grain in EGB-04-S55. Numbersin the Raman map indicate spot analysis positions of the spectra given
below. Rutile (Rt), anatase (Ant) and mixed spectra (ms) regions are
approximated after comparison with the backscattered-electron (BSE)
image shown in Fig. 8 in order to take cracks into account, which
would give darker colors. The regions show display areas of
approximately homogeneous phase composition
586 Contrib Mineral Petrol (2011) 161:581–596
123
From frequent observations the surmise arose, that
anatase displays cathodoluminescence (CL) under the
electron beam in Erzgebirge rock samples, while rutile
does not. However, we cannot confirm these findings, as
both anatase and rutile show CL, with varying intensities.
Further, CL intensity diminishes during electron bom-
bardment and thus constitutes no reliable property for
discrimination.
Trace elements
Polymorph discrimination
Using the Raman phase analysis data in combination with
TE contents, it is possible to classify polymorphs into
groups with different TE contents. For the samples with
well-defined phase information (HUY-1, WAR-9, and the
Table 3 Raman TiO2 phase
results of Erzgebirge samples
and units
Maximum T = Maximum
temperature estimates, see also
Fig. 2. As no unit metamorphic
temperature estimates exist for
the OS, we assume that its
maximum temperature is lower
than the higher-metamorphic
PU temperatures, which is then
\400�C. The PU maximum
temperature may have been
nearly 400�C. Rt Rutile, msmixed spectrum, Ant anatase,
Brk brookite. Sample EGB-04-
S56 is a quartzite, the only rock
sample described in this
contribution
Sample Metamorphic
unit
Maximum
T (�C)
Crystals
in total
Fractions of
Rt ms Ant Brk
EGB-05-S69 OS \400 37 0.92 0.00 0.08 0.00
EGB-05-S70 OS \400 37 0.81 0.05 0.08 0.05
EGB-05-S51 PU 400 34 0.97 0.00 0.03 0.00
EGB-05-S67 PU 400 20 0.80 0.00 0.15 0.05
EGB-04-S61 PU 400 10 0.70 0.00 0.30 0.00
EGB-04-S63 GPU 480 41 0.59 0.10 0.32 0.00
EGB-05-S64 GPU 480 32 0.47 0.03 0.50 0.00
EGB-04-S62 MU 550 17 0.82 0.00 0.18 0.00
EGB-05-S50 MU 550 30 0.73 0.20 0.07 0.00
EGB-05-S52 MU 550 32 0.69 0.19 0.13 0.00
EGB-05-S53 MU 550 40 0.48 0.20 0.28 0.05
EGB-05-S65 MU 550 29 0.79 0.14 0.07 0.00
EGB-04-S55 MU 550 41 0.68 0.10 0.17 0.00
EGB-04-S51 EMU 650 45 0.87 0.09 0.04 0.00
EGB-04-S53 EMU 650 34 0.65 0.12 0.21 0.03
EGB-04-S56 EMU 650 15 0.53 0.00 0.47 0.00
EGB-05-S56 EGU2 750 30 0.80 0.20 0.00 0.00
EGB-05-S57 EGU2 750 31 0.94 0.06 0.00 0.00
EGB-04-S57 GU 800 31 0.87 0.10 0.03 0.00
EGB-05-S54 GU 800 17 0.65 0.00 0.35 0.00
EGB-05-S55 GU 800 29 0.86 0.10 0.03 0.00
EGB-05-S61 GU 800 29 0.93 0.00 0.03 0.03
EGB-05-S63 GU 800 28 0.75 0.07 0.18 0.00
EGB-04-S41 EGU1 950 30 0.90 0.10 0.00 0.00
EGB-04-S50 EGU1 950 45 0.96 0.04 0.00 0.00
EGB-04-S50 EGU1 950 49 0.98 0.02 0.00 0.00
EGB-05-S49 EGU1 950 32 0.91 0.09 0.00 0.00
EGB-04-S45 EGU1 950 30 1.00 0.00 0.00 0.00
EGB-05-S68 Kirchberg granite 4 0.00 0.00 1.00 0.00
Unit total OS \400 74 0.86 0.03 0.08 0.03
Unit total PU 400 64 0.88 0.00 0.11 0.02
Unit total GPU 480 73 0.53 0.07 0.40 0.00
Unit total MU 550 187 0.68 0.15 0.16 0.01
Unit total EMU 650 94 0.73 0.09 0.17 0.01
Unit total EGU2 750 61 0.87 0.13 0.00 0.00
Unit total GU 800 134 0.83 0.06 0.10 0.01
Unit total EGU1 950 186 0.95 0.05 0.00 0.00
Contrib Mineral Petrol (2011) 161:581–596 587
123
single crystals, compare Table OR2 in the Online
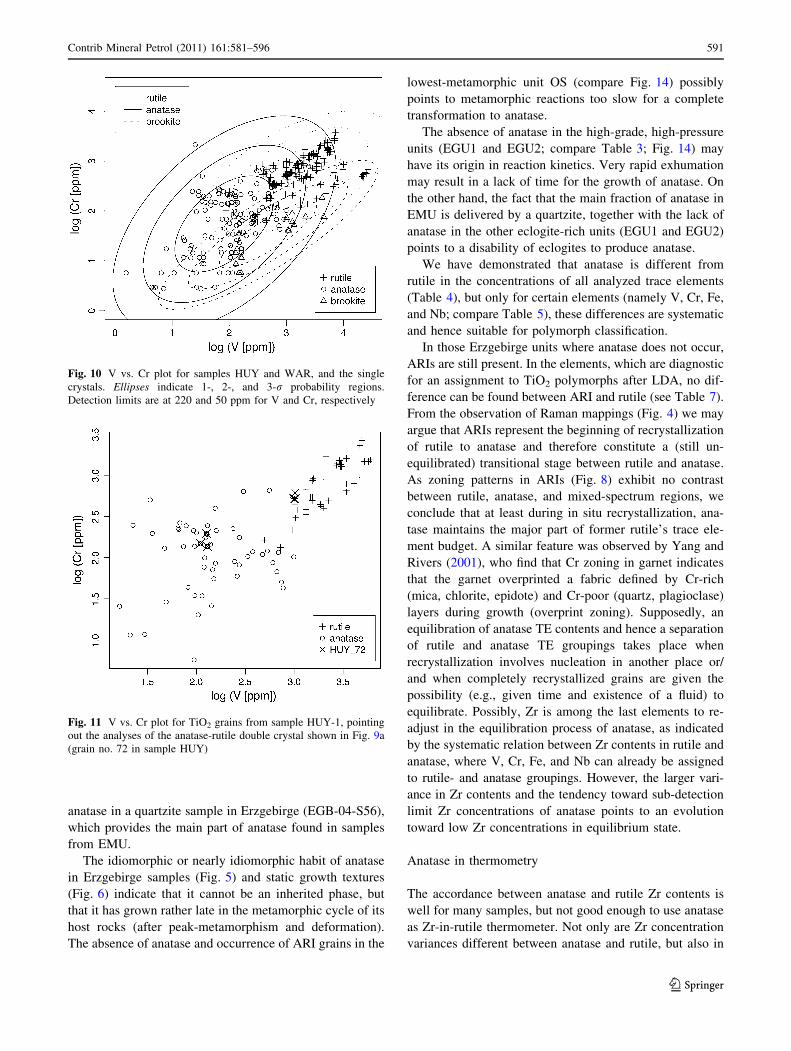
Resource), this is particularly obvious (Fig. 10). In scatter-
plots, V and Cr are best suited for classification1: Anatase
has low contents of both Cr and V (below about 200 ppm)
compared to rutile. Even though brookite crystals cannot be
classified as an own group in scatter-plots, there is a ten-
dency toward low Cr/V ratios.
In sample HUY-1, we found one double crystal with
rounded rutile and idiomorphic anatase in direct contact
(Fig. 9a). Analyzing both of them, we find that these two
crystals fit well into the respective probability regions
(Fig. 11).
Similarly, anatase found in contact with rutile in the
Erzgebirge samples (Fig. 7) shows distinct TE character-
istics with low Cr- and V contents (Table 4). For EMP
analysis results of Erzgebirge samples, see Table OR1 in
the Online Resource. Anatase in ARI grains, however,
generally exhibits similar Cr- and V contents as the adja-
cent rutile (Table 4). In addition to Cr and V, as shown in
Table 4, Nb, Al, and Zr contents are different between
anatase and rutile for the two grains where both phases are
in contact. This observation is indicative for few of the
mentioned elements but is not representative for the whole
data set [which is emphasized by the linear discriminant
analysis (LDA) results shown in Table 5]. Elevated W
contents for the anatase analysis in the ARI grain must not
be overvalued as this analysis was done inside an area with
high electron-backscattering (see Fig. 8) and thus is not
representative for the whole anatase region inside that
grain.
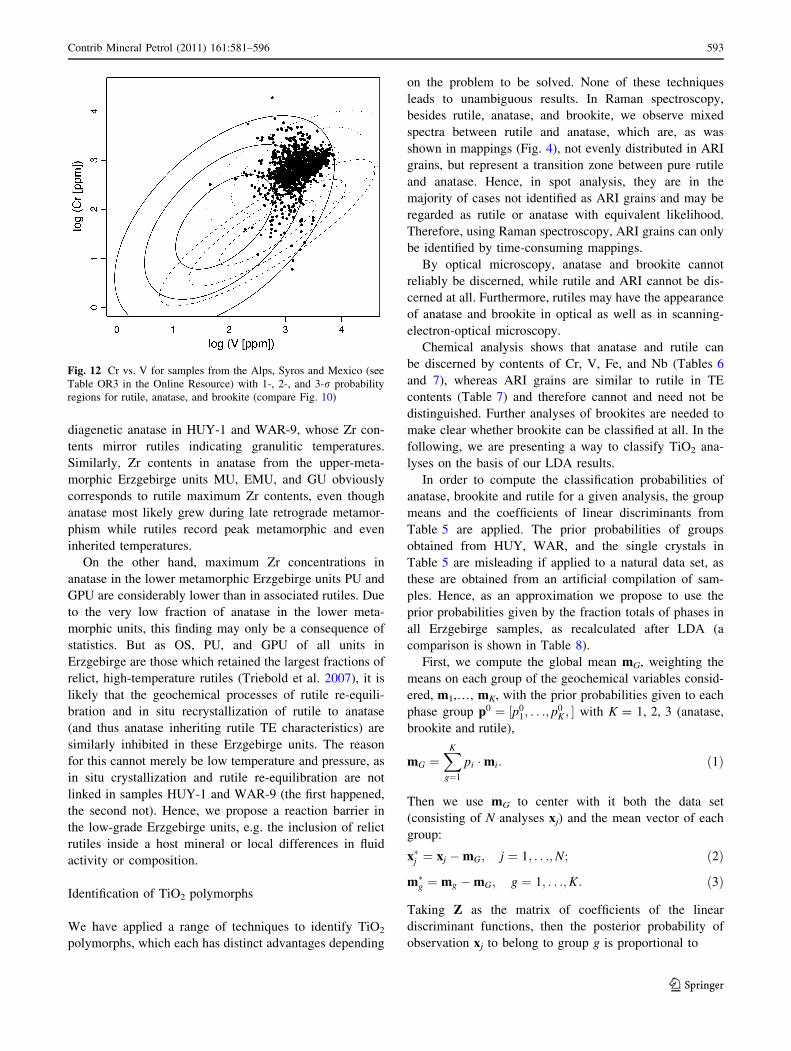
The relatively high amount of anatase and brookite in
Erzgebirge samples appears to be exceptional. We also
collected samples from the Alps, Syros, and Mexico, but no
anatase and brookite were found. Results from the latter
samples are shown in Table OR3 in the Online Resource.
Figure 12 shows that TE contents of these rutiles fit well
with the characteristics observed for other samples dis-
cussed previously. The large scattering in Cr contents
points to a comparably higher significance of V values for
classification purposes.
In order to find a better separation of groups, we applied
an LDA to the log-transformed proportions of the analyzed
elements,2 again using only those samples with well-
defined phase information (HUY-1, WAR-9 and the single
crystals) in order to discriminate rutile, anatase, and
brookite. The result is shown in Table 5.
A cross-classification of the same data set (Table 6)
shows that by means of this LDA, all TiO2 polymorphs
(brookite as well) can be separated from each other, with
percentages of correctly classified crystals ranging from
97% (rutile) via 84% (anatase) to 71% (brookite).
Fig. 5 Optical and scanning-electron images of anatase- and rutile
crystals from different Erzgebirge samples. (1) Plain-polarized
transmitted light, (2) backscatter-electrons in COMPO mode. AntAnatase, Rt rutile. The rim on rutile crystal c is rutile as well. Circular
depressions in b, d, and e are secondary-ion-microprobe analysis pits
1 Due to interference with Ti Kb, the detection limit for V is very
high (220 ppm, compare Table 2). Consequently, the bigger part of
anatase analyses plot below the V detection limit. Yet, as errors are
comparatively small (70 ppm), anatase V values (comparable in
accuracy with Cr values) still have significance when plotting near the
detection limit.
2 This approach precludes analyses with ‘‘0’’ concentrations for any
element, or requires zero replacement strategies (compare van den
Boogart et al. 2006). In order to have a significant and representative
dataset, analyses below detection limit were not changed to ‘‘0’’ or
any other number. For the same reason, W and Al analyses were not
included, as these obtained ‘‘0’’ for too many crystals.
588 Contrib Mineral Petrol (2011) 161:581–596
123
By reclassifying Erzgebirge analyses (Table 7) by
means of LDA results from HUY-1, WAR-9, and the single
crystals (which was shown in Table 5), we find that ana-
lyses formerly classified as rutile by Raman single spot
analysis are almost all ([99%) reclassified as rutile by
LDA, whereas analyses formerly classified as anatase are
reclassified as rutile in 49 of 92 cases (ca. 53%). This result
for anatase in the majority of cases must derive from ARI
grains classified as anatase in Raman spot analysis.
Similarly, we can show that mixed-spectrum analyses in
the majority (74 out of 76 analyses) are classified as rutile.
Brookite analyses are completely reclassified as rutile.
The LDA results indicate that we find mainly one linear
discriminant (LD1) suitable for separation. Besides Cr and
V, Fe and Nb play an important role for discrimination,
a fact that is obscured in simple scatter-plots.
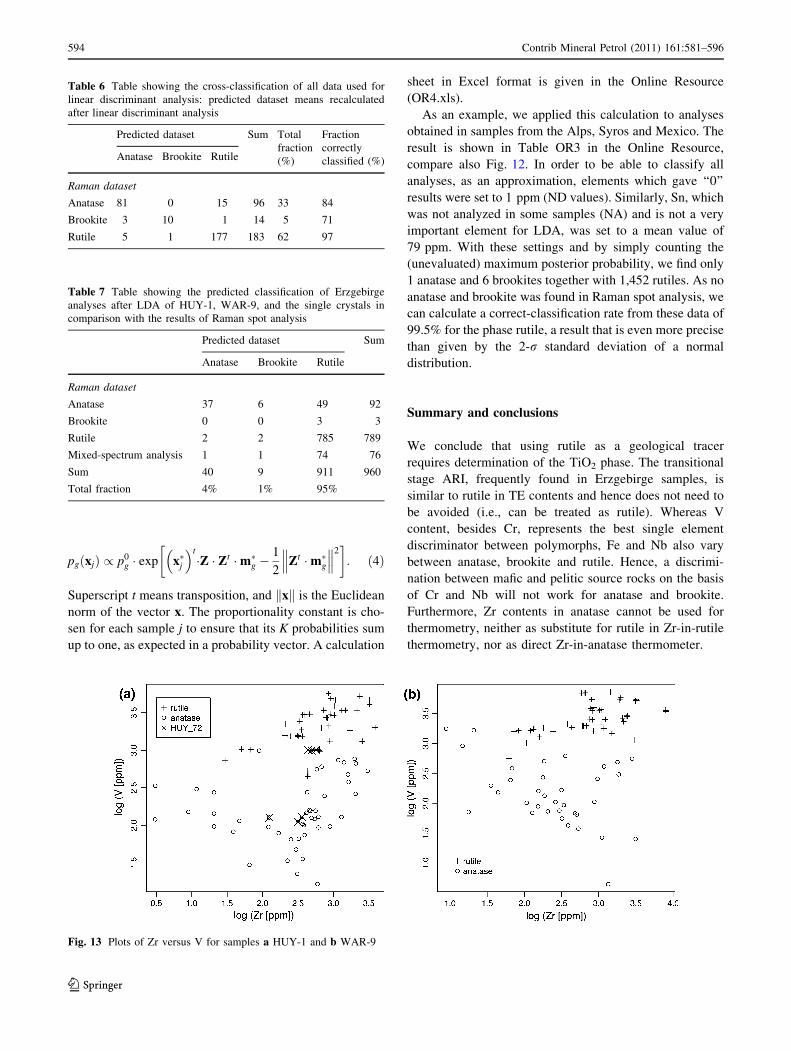
Thermometry
In order to further investigate the influence of polymorph
type on Zr contents (maximum values are used for ther-
mometry), we take a closer look on samples where a direct
comparison is possible: HUY-1 (Fig. 13a), WAR-9
(Fig. 13b), and the Erzgebirge samples sorted by their unit
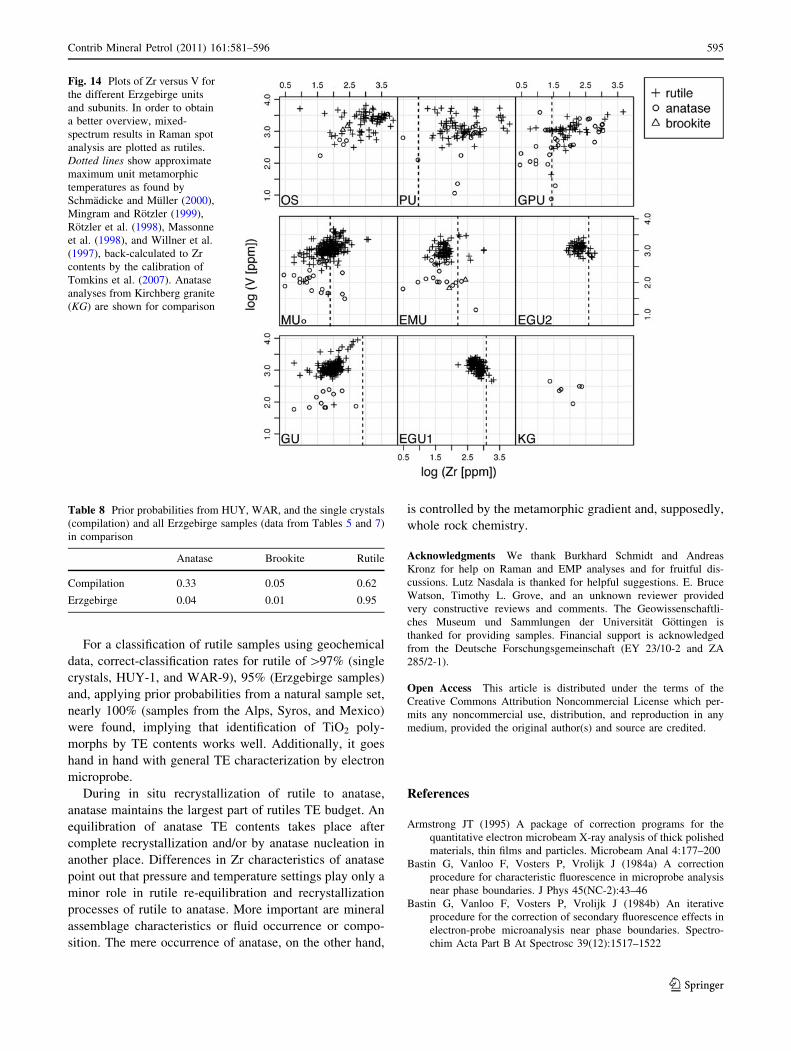
affiliation (Fig. 14). Even considering only those anatase
analyses, which would be grouped as anatase by their TE
contents (low V concentrations), in many cases (HUY-1,
WAR-9, and the Erzgebirge units MU, EMU, and GU),
anatase maximum Zr contents correspond very well to
rutile maximum Zr contents, which range from ca.
300 ppm (2.5 log-units; MU) via 1,000 ppm (3 log-units;
EMU and GU) to 3,000 ppm (3.5 log-units; HUY-1 and
WAR-9). The finding that Zr contents in anatase are sys-
tematically related to Zr contents in rutiles which are
locally and geochemically associated is strengthened by
Erzgebirge quartzite EGB-04-S56, which provides the
main part and the highest Zr contents of rutile and anatase
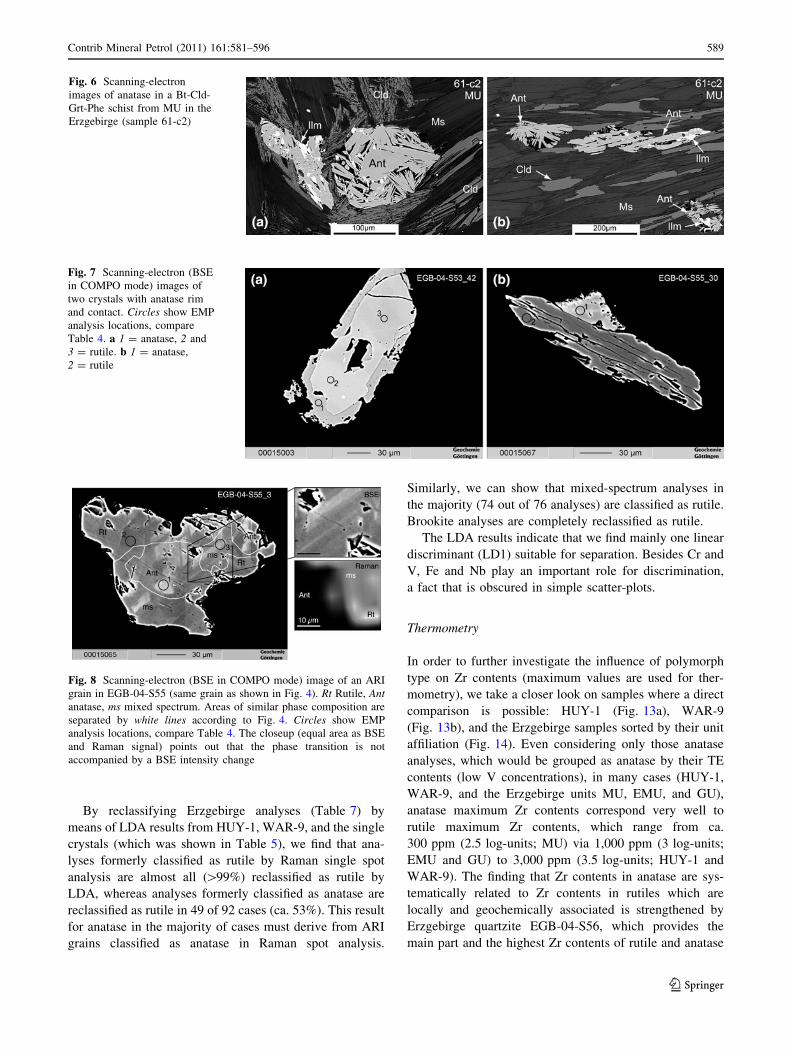
Fig. 6 Scanning-electron
images of anatase in a Bt-Cld-
Grt-Phe schist from MU in the
Erzgebirge (sample 61-c2)
Fig. 7 Scanning-electron (BSE
in COMPO mode) images of
two crystals with anatase rim
and contact. Circles show EMP
analysis locations, compare
Table 4. a 1 = anatase, 2 and
3 = rutile. b 1 = anatase,
2 = rutile
Fig. 8 Scanning-electron (BSE in COMPO mode) image of an ARI
grain in EGB-04-S55 (same grain as shown in Fig. 4). Rt Rutile, Antanatase, ms mixed spectrum. Areas of similar phase composition are
separated by white lines according to Fig. 4. Circles show EMP
analysis locations, compare Table 4. The closeup (equal area as BSE
and Raman signal) points out that the phase transition is not
accompanied by a BSE intensity change
Contrib Mineral Petrol (2011) 161:581–596 589
123
analyses showing temperatures exceeding unit metamor-
phic temperature in EMU.
In samples deriving from the low-temperature units of
the Erzgebirge (PU and GPU), anatase maximum Zr con-
tents are considerably lower than rutile maximum contents,
only few analyses exceed the detection limit (40 ppm or
1.6 log-units).
Despite the obvious relation between maximum Zr
contents in anatase and rutile analyses from the same
samples or units, Zr contents in anatase exhibit larger
variances and also tend to lower mean values compared to
rutiles.
A comparison of Fig. 14 with Table 3 shows that frac-
tions of ARI grains in the metamorphic units derived from
mixed-spectrum analysis fractions are low in the lowermost
units, whereas TE contents indicate that in the lowermost
metamorphic units ARI grains are rather represented by
anatase. Hence, in the lowermost metamorphic Erzgebirge
units, ARI grain fractions are similar to those in the
uppermost metamorphic units.
Discussion
Occurrence and TE characteristics of anatase
In the studied samples (Fig. 12), anatase does not occur in
each metamorphic or sedimentary environment, where
rutile is present. Anatase in samples HUY-1 and WAR-9
evidently originates from a diagenetic setting (Fig. 9),
whereas anatase in Erzgebirge samples may have formed at
metamorphic conditions as well. The similarity between
anatase and rutile Zr contents points to a local connection
between both phases and hence a derivation from the same
source rocks in the majority of cases. Direct evidence for
anatase occurrence in metamorphic rocks comes from
Fig. 9 Optical (transmitted
light) and scanning-electron
images of anatase- and rutile
crystals in a–c HUY and
d–f WAR samples. a Rutile and
idiomorphic anatase, b anatase,
c anatase, d rutile, e anatase,
f anatase
590 Contrib Mineral Petrol (2011) 161:581–596
123
anatase in a quartzite sample in Erzgebirge (EGB-04-S56),
which provides the main part of anatase found in samples
from EMU.
The idiomorphic or nearly idiomorphic habit of anatase
in Erzgebirge samples (Fig. 5) and static growth textures
(Fig. 6) indicate that it cannot be an inherited phase, but
that it has grown rather late in the metamorphic cycle of its
host rocks (after peak-metamorphism and deformation).
The absence of anatase and occurrence of ARI grains in the
lowest-metamorphic unit OS (compare Fig. 14) possibly
points to metamorphic reactions too slow for a complete
transformation to anatase.
The absence of anatase in the high-grade, high-pressure
units (EGU1 and EGU2; compare Table 3; Fig. 14) may
have its origin in reaction kinetics. Very rapid exhumation
may result in a lack of time for the growth of anatase. On
the other hand, the fact that the main fraction of anatase in
EMU is delivered by a quartzite, together with the lack of
anatase in the other eclogite-rich units (EGU1 and EGU2)
points to a disability of eclogites to produce anatase.
We have demonstrated that anatase is different from
rutile in the concentrations of all analyzed trace elements
(Table 4), but only for certain elements (namely V, Cr, Fe,
and Nb; compare Table 5), these differences are systematic
and hence suitable for polymorph classification.
In those Erzgebirge units where anatase does not occur,
ARIs are still present. In the elements, which are diagnostic
for an assignment to TiO2 polymorphs after LDA, no dif-
ference can be found between ARI and rutile (see Table 7).
From the observation of Raman mappings (Fig. 4) we may
argue that ARIs represent the beginning of recrystallization
of rutile to anatase and therefore constitute a (still un-
equilibrated) transitional stage between rutile and anatase.
As zoning patterns in ARIs (Fig. 8) exhibit no contrast
between rutile, anatase, and mixed-spectrum regions, we
conclude that at least during in situ recrystallization, ana-
tase maintains the major part of former rutile’s trace ele-
ment budget. A similar feature was observed by Yang and
Rivers (2001), who find that Cr zoning in garnet indicates
that the garnet overprinted a fabric defined by Cr-rich
(mica, chlorite, epidote) and Cr-poor (quartz, plagioclase)
layers during growth (overprint zoning). Supposedly, an
equilibration of anatase TE contents and hence a separation
of rutile and anatase TE groupings takes place when
recrystallization involves nucleation in another place or/
and when completely recrystallized grains are given the
possibility (e.g., given time and existence of a fluid) to
equilibrate. Possibly, Zr is among the last elements to re-
adjust in the equilibration process of anatase, as indicated
by the systematic relation between Zr contents in rutile and
anatase, where V, Cr, Fe, and Nb can already be assigned
to rutile- and anatase groupings. However, the larger vari-
ance in Zr contents and the tendency toward sub-detection
limit Zr concentrations of anatase points to an evolution
toward low Zr concentrations in equilibrium state.
Anatase in thermometry
The accordance between anatase and rutile Zr contents is
well for many samples, but not good enough to use anatase
as Zr-in-rutile thermometer. Not only are Zr concentration
variances different between anatase and rutile, but also in
Fig. 10 V vs. Cr plot for samples HUY and WAR, and the single
crystals. Ellipses indicate 1-, 2-, and 3-r probability regions.
Detection limits are at 220 and 50 ppm for V and Cr, respectively
Fig. 11 V vs. Cr plot for TiO2 grains from sample HUY-1, pointing
out the analyses of the anatase-rutile double crystal shown in Fig. 9a
(grain no. 72 in sample HUY)
Contrib Mineral Petrol (2011) 161:581–596 591
123

two Erzgebirge units (PU and GPU), maximum Zr contents
in anatase are different from rutile.
For similar reasons, Zr-in-anatase thermometry will not
work: Although Zr incorporation into anatase must follow
similar rules as Zr incorporation into rutile, the observed
accordance between both phases’ Zr contents is too well
and covers a too large concentration range (2.5–3.5 log-
units) to be coincidental. Hence, we conclude that Zr
contents in anatase cannot be used for direct thermometry,
as they do not mirror anatase growth conditions, but
obviously those of coexisting rutiles.
The petrological process behind the equilibration of Zr
contents in anatase (compare last paragraph in Sect.
‘‘Occurrence and TE characteristics of anatase’’) needs
further investigation. On the one hand, Zr contents in
anatase are comparable to rutile Zr contents, even when
these are not equilibrated at metamorphic conditions at the
time of anatase growth themselves. This is best shown for
Table 4 Table showing analysis results for the crystals and analysis spots shown in Figs. 7 and 8
Label Nb (ppm) Cr (ppm) W (ppm) Sn (ppm) Al (ppm) Fe (ppm) V (ppm) Zr (ppm) Si (ppm)
Rutile and anatase in contact
EGB-04-S53_42_1 792 110 0 16 247 285 20 0 129
EGB-04-S53_42_2 1,792 580 132 80 0 2,189 912 72 0
EGB-04-S53_42_3 1,801 554 57 109 0 2,258 952 65 0
EGB-04-S55_30_1 498 53 5,562 25 714 3,710 109 12 603
EGB-04-S55_30_2 2,991 150 79 45 40 2,644 1,433 35 14
ARI
EGB-04-S55_3_1 835 1,822 10,071 284 47 4,290 1,763 104 0
EGB-04-S55_3_2 1,125 1,235 2,262 164 11 2,278 1,217 141 0
EGB-04-S55_3_3 1,011 2,121 6,843 264 107 3,225 1,553 128 0
Analyses EGB…1 correspond to analysis spots (1) in Figs. 7 and 8 and are identified as anatase by Raman spectroscopy, analyses EGB…2 and
EGB…3, correspondingly, are identified as rutile
Table 5 Table showing details and result of the linear discriminant analysis for samples HUY-1, WAR-9, and the single crystals
Anatase Brookite Rutile
Prior probabilities of groups
0.32764505 0.04778157 0.62457338
log (element) Nb (ppm) Cr (ppm) Sn (ppm) Fe (ppm) V (ppm) Zr (ppm)
Group means
Anatase 3.195607 1.823492 1.516392 3.239008 2.043290 2.22702
Brookite 3.731985 1.530200 1.176514 3.497468 2.710993 1.353895
Rutile 3.258939 2.781853 1.935055 3.327488 3.217666 2.437146
LD1 LD2
Coefficients of linear discriminants
Nb (ppm) -0.6926381 -0.4400006
Cr (ppm) 1.0632667 1.1558577
Sn (ppm) 0.3895570 0.9713190
Fe (ppm) 0.7630163 -0.1888737
V (ppm) 1.3390162 -1.6312138
Zr (ppm) -0.1898791 0.8305665
LD1 LD2
Proportion of trace
0.8407 0.1593
592 Contrib Mineral Petrol (2011) 161:581–596
123
diagenetic anatase in HUY-1 and WAR-9, whose Zr con-
tents mirror rutiles indicating granulitic temperatures.
Similarly, Zr contents in anatase from the upper-meta-
morphic Erzgebirge units MU, EMU, and GU obviously
corresponds to rutile maximum Zr contents, even though
anatase most likely grew during late retrograde metamor-
phism while rutiles record peak metamorphic and even
inherited temperatures.
On the other hand, maximum Zr concentrations in
anatase in the lower metamorphic Erzgebirge units PU and
GPU are considerably lower than in associated rutiles. Due
to the very low fraction of anatase in the lower meta-
morphic units, this finding may only be a consequence of
statistics. But as OS, PU, and GPU of all units in
Erzgebirge are those which retained the largest fractions of
relict, high-temperature rutiles (Triebold et al. 2007), it is
likely that the geochemical processes of rutile re-equili-
bration and in situ recrystallization of rutile to anatase
(and thus anatase inheriting rutile TE characteristics) are
similarly inhibited in these Erzgebirge units. The reason
for this cannot merely be low temperature and pressure, as
in situ crystallization and rutile re-equilibration are not
linked in samples HUY-1 and WAR-9 (the first happened,
the second not). Hence, we propose a reaction barrier in
the low-grade Erzgebirge units, e.g. the inclusion of relict
rutiles inside a host mineral or local differences in fluid
activity or composition.
Identification of TiO2 polymorphs
We have applied a range of techniques to identify TiO2
polymorphs, which each has distinct advantages depending
on the problem to be solved. None of these techniques
leads to unambiguous results. In Raman spectroscopy,
besides rutile, anatase, and brookite, we observe mixed
spectra between rutile and anatase, which are, as was
shown in mappings (Fig. 4), not evenly distributed in ARI
grains, but represent a transition zone between pure rutile
and anatase. Hence, in spot analysis, they are in the
majority of cases not identified as ARI grains and may be
regarded as rutile or anatase with equivalent likelihood.
Therefore, using Raman spectroscopy, ARI grains can only
be identified by time-consuming mappings.
By optical microscopy, anatase and brookite cannot
reliably be discerned, while rutile and ARI cannot be dis-
cerned at all. Furthermore, rutiles may have the appearance
of anatase and brookite in optical as well as in scanning-
electron-optical microscopy.
Chemical analysis shows that anatase and rutile can
be discerned by contents of Cr, V, Fe, and Nb (Tables 6
and 7), whereas ARI grains are similar to rutile in TE
contents (Table 7) and therefore cannot and need not be
distinguished. Further analyses of brookites are needed to
make clear whether brookite can be classified at all. In the
following, we are presenting a way to classify TiO2 ana-
lyses on the basis of our LDA results.
In order to compute the classification probabilities of
anatase, brookite and rutile for a given analysis, the group
means and the coefficients of linear discriminants from
Table 5 are applied. The prior probabilities of groups
obtained from HUY, WAR, and the single crystals in
Table 5 are misleading if applied to a natural data set, as
these are obtained from an artificial compilation of sam-
ples. Hence, as an approximation we propose to use the
prior probabilities given by the fraction totals of phases in
all Erzgebirge samples, as recalculated after LDA (a
comparison is shown in Table 8).
First, we compute the global mean mG, weighting the
means on each group of the geochemical variables consid-
ered, m1,…, mK, with the prior probabilities given to each
phase group p0 ¼ ½p01; . . .; p0
K ; � with K = 1, 2, 3 (anatase,
brookite and rutile),
mG ¼XK
g¼1
pi �mi: ð1Þ
Then we use mG to center with it both the data set
(consisting of N analyses xj) and the mean vector of each
group:
x�j ¼ xj �mG; j ¼ 1; . . .;N; ð2Þ
m�g ¼ mg �mG; g ¼ 1; . . .;K: ð3Þ
Taking Z as the matrix of coefficients of the linear
discriminant functions, then the posterior probability of
observation xj to belong to group g is proportional to
Fig. 12 Cr vs. V for samples from the Alps, Syros and Mexico (see
Table OR3 in the Online Resource) with 1-, 2-, and 3-r probability
regions for rutile, anatase, and brookite (compare Fig. 10)
Contrib Mineral Petrol (2011) 161:581–596 593
123
pgðxjÞ / p0g � exp x�j
� �t
�Z � Zt �m�g �1
2Zt �m�g���
���2
� �: ð4Þ
Superscript t means transposition, and kxk is the Euclidean
norm of the vector x. The proportionality constant is cho-
sen for each sample j to ensure that its K probabilities sum
up to one, as expected in a probability vector. A calculation
sheet in Excel format is given in the Online Resource
(OR4.xls).
As an example, we applied this calculation to analyses
obtained in samples from the Alps, Syros and Mexico. The
result is shown in Table OR3 in the Online Resource,
compare also Fig. 12. In order to be able to classify all
analyses, as an approximation, elements which gave ‘‘0’’
results were set to 1 ppm (ND values). Similarly, Sn, which
was not analyzed in some samples (NA) and is not a very
important element for LDA, was set to a mean value of
79 ppm. With these settings and by simply counting the
(unevaluated) maximum posterior probability, we find only
1 anatase and 6 brookites together with 1,452 rutiles. As no
anatase and brookite was found in Raman spot analysis, we
can calculate a correct-classification rate from these data of
99.5% for the phase rutile, a result that is even more precise
than given by the 2-r standard deviation of a normal
distribution.
Summary and conclusions
We conclude that using rutile as a geological tracer
requires determination of the TiO2 phase. The transitional
stage ARI, frequently found in Erzgebirge samples, is
similar to rutile in TE contents and hence does not need to
be avoided (i.e., can be treated as rutile). Whereas V
content, besides Cr, represents the best single element
discriminator between polymorphs, Fe and Nb also vary
between anatase, brookite and rutile. Hence, a discrimi-
nation between mafic and pelitic source rocks on the basis
of Cr and Nb will not work for anatase and brookite.
Furthermore, Zr contents in anatase cannot be used for
thermometry, neither as substitute for rutile in Zr-in-rutile
thermometry, nor as direct Zr-in-anatase thermometer.
Table 6 Table showing the cross-classification of all data used for
linear discriminant analysis: predicted dataset means recalculated
after linear discriminant analysis
Predicted dataset Sum Total
fraction
(%)
Fraction
correctly
classified (%)Anatase Brookite Rutile
Raman dataset
Anatase 81 0 15 96 33 84
Brookite 3 10 1 14 5 71
Rutile 5 1 177 183 62 97
Table 7 Table showing the predicted classification of Erzgebirge
analyses after LDA of HUY-1, WAR-9, and the single crystals in
comparison with the results of Raman spot analysis
Predicted dataset Sum
Anatase Brookite Rutile
Raman dataset
Anatase 37 6 49 92
Brookite 0 0 3 3
Rutile 2 2 785 789
Mixed-spectrum analysis 1 1 74 76
Sum 40 9 911 960
Total fraction 4% 1% 95%
Fig. 13 Plots of Zr versus V for samples a HUY-1 and b WAR-9
594 Contrib Mineral Petrol (2011) 161:581–596
123
For a classification of rutile samples using geochemical
data, correct-classification rates for rutile of [97% (single
crystals, HUY-1, and WAR-9), 95% (Erzgebirge samples)
and, applying prior probabilities from a natural sample set,
nearly 100% (samples from the Alps, Syros, and Mexico)
were found, implying that identification of TiO2 poly-
morphs by TE contents works well. Additionally, it goes
hand in hand with general TE characterization by electron
microprobe.
During in situ recrystallization of rutile to anatase,
anatase maintains the largest part of rutiles TE budget. An
equilibration of anatase TE contents takes place after
complete recrystallization and/or by anatase nucleation in
another place. Differences in Zr characteristics of anatase
point out that pressure and temperature settings play only a
minor role in rutile re-equilibration and recrystallization
processes of rutile to anatase. More important are mineral
assemblage characteristics or fluid occurrence or compo-
sition. The mere occurrence of anatase, on the other hand,
is controlled by the metamorphic gradient and, supposedly,
whole rock chemistry.
Acknowledgments We thank Burkhard Schmidt and Andreas
Kronz for help on Raman and EMP analyses and for fruitful dis-
cussions. Lutz Nasdala is thanked for helpful suggestions. E. Bruce
Watson, Timothy L. Grove, and an unknown reviewer provided
very constructive reviews and comments. The Geowissenschaftli-
ches Museum und Sammlungen der Universitat Gottingen is
thanked for providing samples. Financial support is acknowledged
from the Deutsche Forschungsgemeinschaft (EY 23/10-2 and ZA
285/2-1).
Open Access This article is distributed under the terms of the
Creative Commons Attribution Noncommercial License which per-
mits any noncommercial use, distribution, and reproduction in any
medium, provided the original author(s) and source are credited.
References
Armstrong JT (1995) A package of correction programs for the
quantitative electron microbeam X-ray analysis of thick polished
materials, thin films and particles. Microbeam Anal 4:177–200
Bastin G, Vanloo F, Vosters P, Vrolijk J (1984a) A correction
procedure for characteristic fluorescence in microprobe analysis
near phase boundaries. J Phys 45(NC-2):43–46
Bastin G, Vanloo F, Vosters P, Vrolijk J (1984b) An iterative
procedure for the correction of secondary fluorescence effects in
electron-probe microanalysis near phase boundaries. Spectro-
chim Acta Part B At Spectrosc 39(12):1517–1522
Fig. 14 Plots of Zr versus V for
the different Erzgebirge units
and subunits. In order to obtain
a better overview, mixed-
spectrum results in Raman spot
analysis are plotted as rutiles.
Dotted lines show approximate
maximum unit metamorphic
temperatures as found by
Schmadicke and Muller (2000),
Mingram and Rotzler (1999),
Rotzler et al. (1998), Massonne
et al. (1998), and Willner et al.
(1997), back-calculated to Zr
contents by the calibration of
Tomkins et al. (2007). Anatase
analyses from Kirchberg granite
(KG) are shown for comparison
Table 8 Prior probabilities from HUY, WAR, and the single crystals
(compilation) and all Erzgebirge samples (data from Tables 5 and 7)
in comparison
Anatase Brookite Rutile
Compilation 0.33 0.05 0.62
Erzgebirge 0.04 0.01 0.95
Contrib Mineral Petrol (2011) 161:581–596 595
123
Dachille F, Simons PY, Roy R (1968) Pressure–temperature studies
of anatase, brookite, rutile and TiO2(II). Am Mineral
53:1929–1939
Dallmeyer RD, Franke W, Weber K (eds) (1995) Pre-permian
geology of Central and Eastern Europe. Springer, Berlin
Dalton J, Lane S (1996) Electron microprobe analysis of Ca in olivine
close to grain boundaries: the problem of secondary X-ray
fluorescence. Am Mineral 81(1–2):194–201
Grzmil B, Rabe M, Kic B, Lubkowski K (2007) Influence of
phosphate, potassium, lithium, and aluminium on the anatase-
rutile phase transformation. Ind Eng Chem Res 46(4):1018–1024
Hwang SL, Shen P, Chu HT, Yui TF (2000) Nanometer-size-PbO2-
type TiO2 in garnet: a thermobarometer for ultrahigh-pressure
metamorphism. Science 288(5464):321–324
Jamieson JC, Olinger B (1969) Pressure–temperature studies of
anatase, brookite, rutile and TiO2(II): a discussion. Am Mineral
54:1477–1481
Kretz R (1983) Symbols for rock forming minerals. Am Mineral
68(1–2):277–279
Luvizotto GL, Zack T (2009) Nb and Zr behavior in rutile during
high-grade metamorphism and retrogression: an example from
the Ivrea–Verbano Zone. Chem Geol 261(3–4):303–317
Luvizotto GL, Zack T, Triebold S, von Eynatten H (2009) Rutile
occurrence and trace element behavior in medium-grade me-
tasedimentary rocks: example from the Erzgebirge, Germany.
Mineral Petrol 97(3–4):233–249
Massonne HJ, Bernhardt HJ, Dettmar D, Kessler E, Medenbach O,
Westphal T (1998) Simple identification and quantification of
microdiamonds in rock thin-sections. Eur J Mineral
10(3):497–504
Meinhold G, Anders B, Kostopoulos D, Reischmann T (2008) Rutile
chemistry and thermometry as provenance indicator: an example
from Chios Island, Greece. Sediment Geol 203(1–2):98–111
Mezger K, Hanson GN, Bohlen SR (1989) High-precision U-Pb ages
of metamorphic rutile: application to the cooling history of high-
grade terranes. Earth Planet Sci Lett 96:106–118
Mingram B (1998) The Erzgebirge, Germany, a subducted part of
northern Gondwana: geochemical evidence for repetition of
early Paleozoic metasedimentary sequences in metamorphic
thrust units. Geol Mag 135(6):785–801
Mingram B, Rotzler K (1999) Geochemische, petrologische und
geochronologische Untersuchungen im Erzgebirgskristallin—
Rekonstruktion eines Krustenstapels. Schriftenreihe fuer Geo-
wissenschaften 9:80
Rotzler K, Schumacher R, Maresch WV, Willner AP (1998)
Characterization and geodynamic implications of contrasting
metamorphic evolution in juxtaposed high-pressure units of the
western Erzgebirge (Saxony, Germany). Eur J Mineral
10(2):261–280
Schmadicke E, Muller WF (2000) Unusual exsolution phenomena in
omphacite and partial replacement of phengite by phlogo-
pite ? kyanite in an eclogite from the Erzgebirge. Contrib
Mineral Petrol 139:629–642
Sembaev D, Ivanovskaya F, Saurambaeva L, Yugay O, Mikhailovs-
kaya T (2008) Effect of oxides of the IV and VI group metals on
the polymorphic transformation of anatase into rutile. React
Kinet Catal Lett 93(2):211–217
Smith SJ, Stevens R, Liu S, Li G, Navrotsky A, Boerio-Goates J,
Woodfield BF (2009) Heat capacities and thermodynamic
functions of TiO2 anatase and rutile: analysis of phase stability.
Am Mineral 94(2–3):236–243
Spear FS, Wark DA, Cheney JT, Schumacher JC, Watson EB (2006)
Zr-in-rutile thermometry in blueschists from Sifnos, Greece.
Contrib Mineral Petrol 152(3):375–385
Stockli DF, Wolfe MR, Blackburn TJ, Zack T, Walker JD, Luvizotto
GL (2007) He diffusion and (U-Th)/He thermochronology
of rutile. In: American geophysical union, Fall meeting,
pp V23C–1548
Tomkins HS, Powell R, Ellis DJ (2007) The pressure dependence of
the zirconium-in-rutile thermometer. J Metamorphic Geol
25(6):703–713
Triebold S, von Eynatten H, Luvizotto GL, Zack T (2007) Deducing
source rock lithology from detrital rutile geochemistry: an
example from the Erzgebirge, Germany. Chem Geol
244(3–4):421–436
van den Boogart KG, Tolosana-Delgado R, Bren M (2006) Concepts
for handling zeroes and missing values in compositional data. In:
Pirard E, Dassargues A, Havenith H (eds) Proceedings of
IAMG’06—the XI annual conference of the international
association for mathematical geology. University of Liege,
Belgium
von Eynatten H, Tolosana-Delgado R, Triebold S, Zack T (2005)
Interactions between grain size and composition of sediments:
two examples. In: Proceedings CoDaWork05—2nd composi-
tional data analysis workshop, Girona, 19–21 Oct 2005
Vry JK, Baker JA (2006) LA-MC-ICPMS Pb–Pb dating of rutile from
slowly cooled granulites: confirmation of the high closure
temperature for Pb diffusion in rutile. Geochim Cosmochim Acta
70(7):1807–1820
Vry J, Baker J, Waight T (2003) In situ Pb–Pb dating of rutile from
slowly cooled granulites by La-Mc-ICP-MS: confirmation of the
high closure temperature ([600�C) for Pb diffusion in rutile.
Geophys Res Abstr 5(10199)
Wark DA, Watson EB (2006) TitaniQ: a titanium-in-quartz geother-
mometer. Contrib Mineral Petrol 152:743–754
Watson E, Wark D, Thomas J (2006) Crystallization thermometers for
zircon and rutile. Contrib Mineral Petrol 151(4):413–433
Weltje G, von Eynatten H (2004) Quantitative provenance analysis of
sediments: review and outlook. Sediment Geol 171(1–4):1–11
Willner AP, Roetzler K, Maresch WV (1997) Pressure–temperature
and fluid evolution of quartzo-feldspathic metamorphic rocks
with a relic high-pressure, granulite-facies history from the
Central Erzgebirge (Saxony, Germany). J Petrol 38(3):307–336
Willner AP, Krohe A, Maresch MV (2000) Interrelated P-T-t-d paths
in the Variscan Erzgebirge dome (Saxony, Germany): con-
straints on the rapid exhumation of high-pressure rocks from the
root zone of a collisional orogen. Int Geol Rev 42(1):64–85
Withers AC, Essene EJ, Zhang YX (2003) Rutile/TiO2II phase
equilibria. Contrib Mineral Petrol 145(2):199–204
Yang P, Rivers T (2001) Chromium and manganese zoning in pelitic
garnet and kyanite: spiral, overprint, and oscillatory (?) zoning
patterns and the role of growth rate. J Metamorphic Geol
19:455–474
Zack T, Luvizotto GL (2006) Application of rutile thermometry to
eclogites. Mineral Petrol 88(1):69–85
Zack T, von Eynatten H, Kronz A (2004a) Rutile geochemistry and its
potential use in quantitative provenance studies. Sediment Geol
171:37–58
Zack T, Moraes R, Kronz A (2004b) Temperature dependence of Zr
in rutile: empirical calibration of a rutile thermometer. Contrib
Mineral Petrol 148(4):471–488
596 Contrib Mineral Petrol (2011) 161:581–596
123