Embed Size (px)
Citation preview

1
Discussion paper - Public hospital separations by urgency category and funding source
2007-08 to 2015-16
Background
At the 9 February COAG, First Ministers considered a Heads of Agreement on public hospital
funding and health system reform. As part of this agreement, the parties have agreed to
examine the impact of private patients in public hospitals. The text from the Heads of
Agreement is listed below.
Private patients in public hospitals
9. The Parties agree to ensure the information and process for patients electing to use
private health insurance in public hospital emergency departments is appropriate,
robust and best supports consumer choice.
10. In developing the NHA, the Parties will work together to:
a. examine the underlying drivers of growth of private patients in public
hospitals;
b. develop reform initiatives to improve admission policy and practices to support
patient choice, and to deliver comprehensive data provision and more
consistent financial reporting on private patients; and
c. examine the impact of historic changes to the original Medicare principles and
ensure the final agreement supports access to public hospital services by all
patients on the basis of clinical need.
This paper will present some key statistics from an examination of public hospital data. The
data presents public separations by urgency category and funding source for the years 2007-
08 to 2015-16. Illustrations of this data can be found in Attachment B.
It should be noted that an urgency category of “emergency” does not necessarily mean that
the patient was admitted through the emergency department. Attachment A1 sets out the
definitions of the different urgency categories.
This work has been prepared in the context of negotiations of the next National Health
Reform Agreement.
Summary of data analysis
National level data
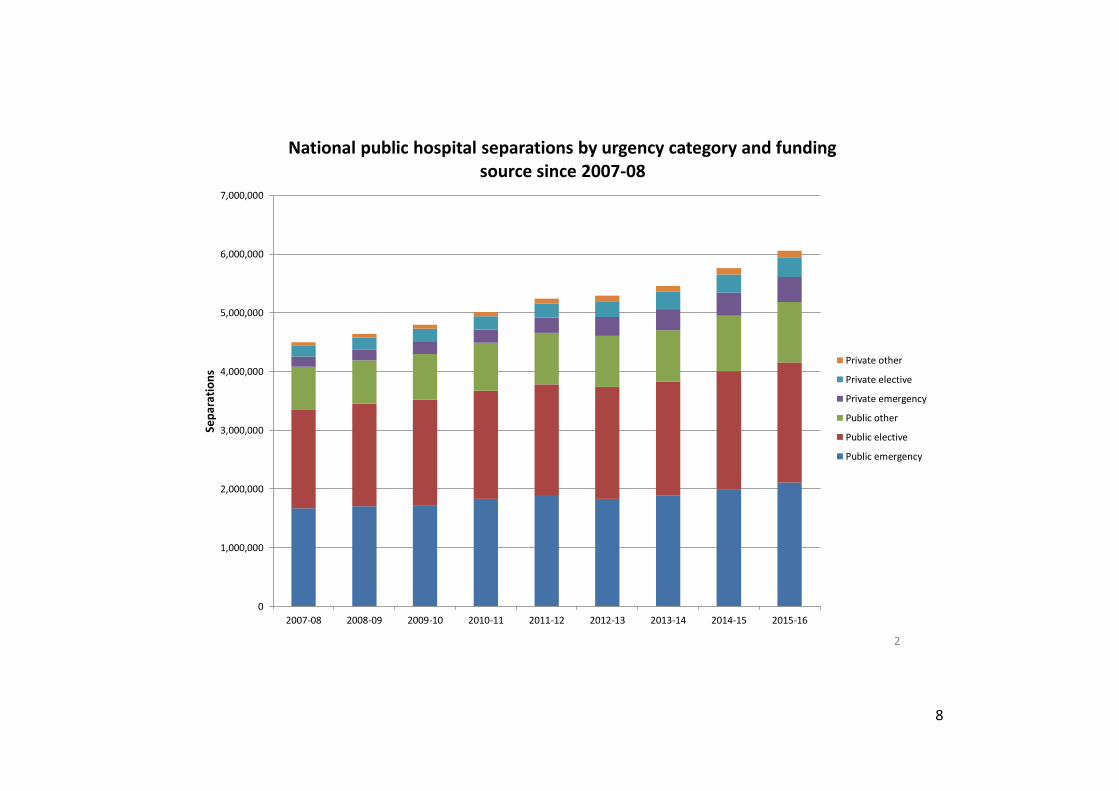
An examination of the data reveals that on a national level, the growth of privately insured
emergency separations has increased significantly for all urgency categories. Across each
urgency category, the rate of growth of private separations significantly exceeds public
separations. This data is illustrated on slide 1 of Attachment B.

2
Since 2007-08, on a national level:
Private emergency separations have increased by 144%, compared with 26% for
public emergency separations.
Private elective separations have increased by 78%, compared with 21% for public
elective separations.
Private ‘other’ separations (e.g. maternity and dialysis) have increased by 106%,
compared with 42% for public ‘other’ separations.
Overall, privately insured separations represent a small proportion of total hospital
separations, at 14% of all separations. However, this is a significant increase since 2007-08
when only 9% were privately insured. In that time, publicly funded separations have
decreased from 91% to 86%. This data is illustrated on slide 2 and 3 of Attachment B.
State-level data
There are instances of extreme levels of growth in the number of privately insured separations
in a number of states. The following section details findings from two states, Queensland and
New South Wales. For your reference, data from the other states and territories have been
included in Attachment B from slide 11 onwards.
Queensland
Queensland has seen the largest relative growth in the number of privately insured public
hospital separations out of any of the states. This data is illustrated on slide 4 of Attachment
B. Since 2007-08:
Private emergency separations have increased by 736%, compared with 50% for
public emergency separations.
Private elective separations have increased by 153%, compared with 24% for public
elective separations.
Private ‘other’ separations have increased by 345%, compared with 51% for public
‘other’ separations.
As demonstrated on slide 5, the total number of privately insured separations is still only a
small proportion of all public hospital separations in Queensland. However, when analysing
the growth in separations since 2007-08, slide 6 demonstrates that this growth has favoured
privately insured patients.
Of all additional separations compared with 2007-08 levels, privately funded activity
accounted for:
28% of new emergency separations;
22% of new elective separations; and
31% of new ‘other’ separations.

3
The funding split of new emergency separations in Queensland since 2007-08 has also been
illustrated on slide 7. While this graph demonstrates the significant shift towards privately
funded activity, it also demonstrates that this growth may have reached a saturation point.
This is perhaps due to hitting the ceiling on the number of privately-insured patients.
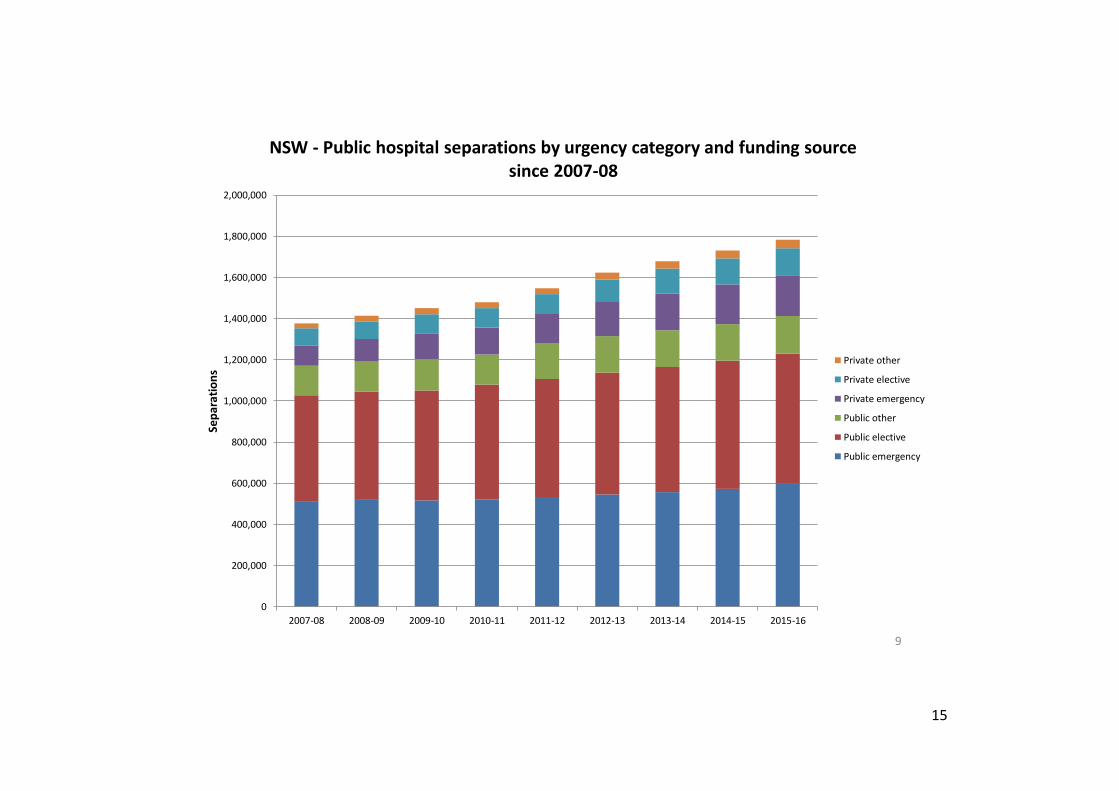
New South Wales
New South Wales has also seen significant growth in the number of privately insured
separations. This data is illustrated on slide 8.
Private emergency separations have increased by 99%, compared with 17% for public
emergency separations.
Private elective separations have increased by 59%, compared with 23% for public
elective separations.
Private ‘other’ separations have increased by 72%, compared with 27% for public
‘other’ separations.
As demonstrated on slide 9, the total number of privately insured separations is still only a
small proportion of all public hospital separations in New South Wales. However, when
analysing the growth in separations since 2007-08, slide 10 demonstrates that this growth has
favoured privately insured patients.
Of all additional separations compared with 2007-08 levels, privately funded activity
accounted for:
64% of new emergency separations;
27% of new elective separations; and
28% of new ‘other’ separations.

4
CODE 1 Urgency status assigned - emergency
Emergency admission:
The following guidelines may be used by health professionals, hospitals and health insurers in determining whether an emergency admission has occurred.
These guidelines should not be considered definitive.
An emergency admission occurs if one or more of the following clinical conditions are applicable such that the patient required admission within 24 hours.
Such a patient would be:
at risk of serious morbidity or mortality and requiring urgent assessment and/or resuscitation; or
suffering from suspected acute organ or system failure; or
suffering from an illness or injury where the viability or function of a body part or organ is acutely threatened; or
suffering from a drug overdose, toxic substance or toxin effect; or
experiencing severe psychiatric disturbance whereby the health of the patient or other people is at immediate risk; or
suffering severe pain where the viability or function of a body part or organ is suspected to be acutely threatened; or
suffering acute significant haemorrhage and requiring urgent assessment and treatment; or
suffering gynaecological or obstetric complications; or
suffering an acute condition which represents a significant threat to the patient's physical or psychological wellbeing; or
suffering a condition which represents a significant threat to public health.
If an admission meets the definition of emergency above, it is categorised as emergency, regardless of whether the admission occurred within 24 hours of such
a categorisation being made, or after 24 hours or more.
CODE 2 Urgency status assigned - Elective
Elective admissions:
If an admission meets the definition of elective above, it is categorised as elective, regardless of whether the admission actually occurred after 24 hours or
more, or it occurred within 24 hours. The distinguishing characteristic is that the admission could be delayed by at least 24 hours.
Scheduled admissions:

5
A patient who expects to have an elective admission will often have that admission scheduled in advance. Whether or not the admission has been scheduled
does not affect the categorisation of the admission as emergency or elective, which depends only on whether it meets the definitions above. That is, patients
both with and without a scheduled admission can be admitted on either an emergency or elective basis.
Admissions from elective surgery waiting lists:
Patients on waiting lists for elective surgery are assigned a Clinical urgency status which indicates the clinical assessment of the urgency with which a patient
requires elective hospital care. On admission, they will also be assigned an urgency of admission category, which may or may not be elective:
Patients who are removed from elective surgery waiting lists on admission as an elective patient for the procedure for which they were waiting (see
code 1 in metadata item Reason for removal from an elective surgery waiting list code N) will be assigned an Admission urgency status code N code of
2. In that case, their clinical urgency category could be regarded as further detail on how urgent their admission was.
Patients who are removed from elective surgery waiting lists on admission as an emergency patient for the procedure for which they were waiting (see
code 2 in metadata item Reason for removal from an elective surgery waiting list code N), will be assigned an Admission urgency status code N code
of 1.
CODE 3 Urgency status not assigned
Admissions for which an urgency status is usually not assigned are:
admissions for normal delivery (obstetric)
admissions which begin with the birth of the patient, or when it was intended that the birth occur in the hospital, commence shortly after the birth of
the patient
statistical admissions
planned readmissions for the patient to receive limited care or treatment for a current condition, for example dialysis or chemotherapy.
An urgency status can be assigned for admissions of the types listed above for which an urgency status is not usually assigned. For example, a patient who is to
have an obstetric admission may have one or more of the clinical conditions listed above and be admitted on an emergency basis.
CODE 9 Not known/not reported
This code is used when it is not known whether or not an urgency status has been assigned, or when an urgency status has been assigned but is not known.

6
PRIVATE HEALTH MINISTERIAL ADVISORY
COMMITTEE
Presentation – Public hospital separations by urgency
category and funding source
11 APRIL 2018

7
0%
20%
40%
60%
80%
100%
120%
140%
160%
2007-08 2008-09 2009-10 2010-11 2011-12 2012-13 2013-14 2014-15 2015-16
Gro
wth
ove
r 20
07-0
8
National - Growth since 2007-08 in public hospital separations by urgency category and funding source
Private emergency
Private other
Private elective
Public other
Public emergency
Public elective
1
8
0
1,000,000
2,000,000
3,000,000
4,000,000
5,000,000
6,000,000
7,000,000
2007-08 2008-09 2009-10 2010-11 2011-12 2012-13 2013-14 2014-15 2015-16
Sep
arat
ion
s
National public hospital separations by urgency category and funding source since 2007-08
Private other
Private elective
Private emergency
Public other
Public elective
Public emergency
2

9
2007-08 2008-09 2009-10 2010-11 2011-12 2012-13 2013-14 2014-15 2015-16
Private other 1% 1% 1% 1% 2% 2% 2% 2% 2%
Private elective 4% 4% 5% 5% 5% 5% 5% 5% 5%
Private emergency 4% 4% 4% 4% 5% 6% 7% 7% 7%
Public other 16% 16% 16% 16% 17% 16% 16% 16% 17%
Public elective 37% 38% 38% 37% 36% 36% 36% 35% 34%
Public emergency 37% 37% 36% 36% 36% 35% 35% 35% 35%
0%
10%
20%
30%
40%
50%
60%
70%
80%
90%
100%
Pro
po
rtio
n o
f to
tal s
ep
arat
ion
s
National public hospital separations by urgency category and funding source since 2007-08
3

10
0%
100%
200%
300%
400%
500%
600%
700%
800%
2007-08 2008-09 2009-10 2010-11 2011-12 2012-13 2013-14 2014-15 2015-16
Gro
wth
ove
r 20
07-0
8
Growth since 2007-08 in public hospital seps by urgency category and funding source, Queensland
Private emergency
Private other
Private elective
Public emergency
Public other
Public elective
4

11
-
200,000
400,000
600,000
800,000
1,000,000
1,200,000
1,400,000
2007-08 2008-09 2009-10 2010-11 2011-12 2012-13 2013-14 2014-15
Sep
arat
ion
s
QLD - Public hospital separations by urgency category and funding source since 2007-08
Private other
Private elective
Private emergency
Public other
Public elective
Public emergency
5

12
0%
10%
20%
30%
40%
50%
60%
70%
80%
90%
100%
Emergency Elective Other
Pro
po
rtio
n o
f n
ew s
epar
atio
ns
sin
ce 2
007
-08
QLD - Growth in the number of separations since 2007-08 according to funding source
Private
Public
6

13
7
0%
10%
20%
30%
40%
50%
60%
70%
80%
90%
100%
2008-09 2009-10 2010-11 2011-12 2012-13 2013-14 2014-15 2015-16
QLD - new emergency separations funding source since 2007-08 as a % of total
Private emergency
Public emergency

14
0.0%
20.0%
40.0%
60.0%
80.0%
100.0%
120.0%
2007-08 2008-09 2009-10 2010-11 2011-12 2012-13 2013-14 2014-15 2015-16
Gro
wth
ove
r 20
07-0
8
NSW - Growth since 2007-08 in public hospital seps by urgency category and funding source
Private emergency
Private other
Private elective
Public other
Public elective
Public emergency
8
15
0
200,000
400,000
600,000
800,000
1,000,000
1,200,000
1,400,000
1,600,000
1,800,000
2,000,000
2007-08 2008-09 2009-10 2010-11 2011-12 2012-13 2013-14 2014-15 2015-16
Sep
arat
ion
s
NSW - Public hospital separations by urgency category and funding source since 2007-08
Private other
Private elective
Private emergency
Public other
Public elective
Public emergency
9

16
0%
10%
20%
30%
40%
50%
60%
70%
80%
90%
100%
Emergency Elective Other
Pro
po
rtio
n o
f n
ew s
ep
arat
ion
s si
nce
200
7-0
8
NSW - Growth in the number of separations since 2007-08 according to funding source
Private
Public
10

17
11
-40.0%
-20.0%
0.0%
20.0%
40.0%
60.0%
80.0%
100.0%
120.0%
140.0%
160.0%
2007-08 2008-09 2009-10 2010-11 2011-12 2012-13 2013-14 2014-15 2015-16
Gro
wth
ove
r 20
07-0
8
VIC - Growth since 2007-08 in public hospital seps by urgency category and funding source
Private emergency
Private elective
Private other
Public elective
Public other
Public emergency

18
12
0
200,000
400,000
600,000
800,000
1,000,000
1,200,000
1,400,000
1,600,000
1,800,000
2007-08 2008-09 2009-10 2010-11 2011-12 2012-13 2013-14 2014-15 2015-16
Sep
arat
ion
s
VIC - Public hospital separations by urgency category and funding source since 2007-08
Private other
Private elective
Private emergency
Public other
Public elective
Public emergency

19
13
-40.0%
-20.0%
0.0%
20.0%
40.0%
60.0%
80.0%
100.0%
120.0%
2007-08 2008-09 2009-10 2010-11 2011-12 2012-13 2013-14 2014-15 2015-16
Gro
wth
ove
r 20
07-0
8
Growth since 2007-08 in public hospital seps by urgency category and funding source, WA
Private emergency
Public other
Private elective
Public emergency
Private other
Public elective

20
14
0
100,000
200,000
300,000
400,000
500,000
600,000
700,000
2007-08 2008-09 2009-10 2010-11 2011-12 2012-13 2013-14 2014-15 2015-16
Sep
arat
ion
s
WA - Public hospital separations by urgency category and funding source since 2007-08
Private other
Private elective
Private emergency
Public other
Public elective
Public emergency

21
15
-40.0%
-30.0%
-20.0%
-10.0%
0.0%
10.0%
20.0%
30.0%
40.0%
50.0%
60.0%
2007-08 2008-09 2009-10 2010-11 2011-12 2012-13 2013-14 2014-15 2015-16Gro
wth
ove
r 20
07-0
8
Growth since 2007-08 in public hospital seps by urgency category and funding source, SA
Private emergency
Public other
Public emergency
Private elective
Public elective
Private other

22
16
0
50,000
100,000
150,000
200,000
250,000
300,000
350,000
400,000
450,000
2007-08 2008-09 2009-10 2010-11 2011-12 2012-13 2013-14 2014-15 2015-16
Sep
arat
ion
s
South Australia - Public hospital separations by urgency category and funding source since 2007-08
Private other
Private elective
Private emergency
Public other
Public elective
Public emergency

23
17
-100.0%
-50.0%
0.0%
50.0%
100.0%
150.0%
200.0%
250.0%
2007-08 2008-09 2009-10 2010-11 2011-12 2012-13 2013-14 2014-15 2015-16
Gro
wth
ove
r 20
07-0
8
TAS - Growth since 2007-08 in public hospital separations by urgency category and funding source
Private elective
Private emergency
Public elective
Public emergency
Public other
Private other

24
18
0
20,000
40,000
60,000
80,000
100,000
120,000
140,000
2007-08 2008-09 2009-10 2010-11 2011-12 2012-13 2013-14 2014-15 2015-16
Sep
arat
ion
s
TAS - Public hospital separations by urgency category and funding source since 2007-08
Private other
Private elective
Private emergency
Public other
Public elective
Public emergency

25
19
-100.0%
0.0%
100.0%
200.0%
300.0%
400.0%
500.0%
2007-08 2008-09 2009-10 2010-11 2011-12 2012-13 2013-14 2014-15 2015-16
Gro
wth
ove
r 20
07-0
8
ACT - Growth since 2007-08 in public hospital separations by urgency category and funding source
Private other
Private elective
Private emergency
Public emergency
Public elective
Public other

26
20
0
20,000
40,000
60,000
80,000
100,000
120,000
2007-08 2008-09 2009-10 2010-11 2011-12 2012-13 2013-14 2014-15 2015-16
Sep
arat
ion
s
ACT - Public hospital separations by urgency category and funding source since 2007-08
Private other
Private elective
Private emergency
Public other
Public elective
Public emergency

27
21
-200.0%
0.0%
200.0%
400.0%
600.0%
800.0%
1000.0%
1200.0%
2007-08 2008-09 2009-10 2010-11 2011-12 2012-13 2013-14 2014-15 2015-16
Gro
wth
ove
r 20
07-0
8
NT - Growth since 2007-08 in public hospital separations by urgency category and funding source
Private emergency
Private elective
Public other
Private other
Public emergency
Public elective

28
22
0
20,000
40,000
60,000
80,000
100,000
120,000
140,000
160,000
2007-08 2008-09 2009-10 2010-11 2011-12 2012-13 2013-14 2014-15 2015-16
Sep
arat
ion
s
NT - Public hospital separations by urgency category and funding source since 2007-08
Private other
Private elective
Private emergency
Public other
Public elective
Public emergency