Embed Size (px)
Citation preview
UNITED NATIONS CONFERENCE ON TRADE AND DEVELOPMENT
DISCUSSION PAPERS
THE CHALLENGE OF GLOBALIZATION FORLARGE CHINESE FIRMS
Peter Nolan and Jin Zhang
No. 162
July 2002
THE CHALLENGE OFGLOBALIZATION FOR LARGE CHINESE FIRMS
Peter Nolan and Jin Zhang
No. 162July 2002
UNCTAD/OSG/DP/162
ii
The opinions expressed in this paper are those of the author and do not necessarily reflect theviews of UNCTAD. The designations and terminology employed are also those of the author.
UNCTAD Discussion Papers are read anonymously by at least one referee, whose commentsare taken into account before publication.
Comments on this paper are invited and may be addressed to the author, c/o the PublicationsAssistant,* Macroeconomic and Development Policies, GDS, United Nations Conference on Tradeand Development (UNCTAD), Palais des Nations, CH-1211 Geneva 10, Switzerland. Copies ofDiscussion Papers may also be obtained from this address. New Discussion Papers are available onthe website at: http.//www.unctad.org/en/pub/pubframe/htm
* Fax: (+41) (0)22.907.0274; E-mail: [email protected]
JEL classification: F2, L1, M2, O2, P2
iii
CONTENTS
Page
Abstract ................................................................................................................................ 1
I. CHINA AND THE GLOBAL BUSINESS REVOLUTION ........................................................... 1A. China’s reforms ................................................................................................. 2
1. Lessons from other countries ..................................................................... 22. China’s ambitions ..................................................................................... 23. China’s progress ....................................................................................... 34. China’s difficulties ................................................................................... 35. The challenge for China ............................................................................ 5
B. The global business revolution ............................................................................ 61. Liberalization of world trade and capital markets ........................................ 62. Explosive M&A and concentration ............................................................ 73. ‘Cascade effect’ ........................................................................................ 84. The ‘external firm’ .................................................................................... 85. Dominance of firms based in advanced economies ...................................... 8
C. Conclusion ........................................................................................................ 9
II. OIL AND PETROCHEMICALS .......................................................................................... 11A. The global setting ............................................................................................... 11
1. World oil and gas in the 1990s ................................................................... 112. National oil companies............................................................................... 143. Merger frenzy ........................................................................................... 154. Conclusion: Competitive obstacles for firms based in
developing countries ................................................................................. 20B. China’s response ................................................................................................ 20
1. The 1998 reorganization of China’s oil industry .......................................... 212. The year 2000 flotation of PetroChina and Sinopec ..................................... 213. Business capabilities ................................................................................. 224. Organizational structure ............................................................................ 275. The competitive landscape ........................................................................ 296. Conclusion ............................................................................................... 30
iv
III. AEROSPACE ................................................................................................................. 31A. Global trends ..................................................................................................... 31
1. Consolidation ........................................................................................... 312. Systems integration ................................................................................... 353. The ‘cascade’ effect .................................................................................. 364. Embraer ................................................................................................... 375. Conclusion: Competitive obstacles for firms based in
developing countries ................................................................................. 38B. China’s response ................................................................................................ 40
1. Ambitions and successes ........................................................................... 402. AVIC’s businesses and structure ............................................................... 413. Development setbacks .............................................................................. 444. 1999 Restructuring: splitting into two ......................................................... 465. Development plans ................................................................................... 476. Conclusion ............................................................................................... 49
IV. CONCLUSION ............................................................................................................... 51
REFERENCES ......................................................................................................................... 53
List of tables
1 Dominance of firms based in high-income countries of theglobal big business revolution ....................................................................................... 10
2 Geographical distribution of world oil and gas reserves,consumption and production, 2000 ............................................................................... 12
3 Top 15 national oil companies, 1999 ............................................................................. 134 Operating data compared: global majors vs PetroChina and Sinopec, 2000 ...................... 165 Financial indicators compared: global majors vs PetroChina and Sinopec, 2000 ............... 166 Top 10 ethylene producers vs PetroChina and Sinopec Corp. .......................................... 257 Market share of imported oil products and petrochemicals in China, 2000 ....................... 258 Proposed major Sino-foreign petrochemical joint ventures ............................................. 299 International arms deliveries within East Asia, 1987 and 1998 ........................................ 32
10 Principal mergers and acquisitions in the United States defence industry, 1994-1998 ....... 3311 Share of R&D spending financed by government for aerospace, 1970 and 1990 .............. 3812 World leading aerospace and defence company, 2000 .................................................... 3913 Relative size of selected aerospace companies, 1997 and 2000 ........................................ 42
THE CHALLENGE OF GLOBALIZATION FOR LARGE CHINESE FIRMS1
Peter Nolan and Jin Zhang
Judge Institute of Management Studies, University of Cambridge
Abstract
As China joins the World Trade Organization, the author questions whether China’s large firmswill be able to compete on the global level playing field. Over the past two decades, Chinese largeenterprises have undertaken extensive evolutionary change but, at the same time, the world’sleading firms have undergone a revolutionary transformation. Based on analysis of firms with theaerospace, oil and petrochemical industry, the authors conclude that China’s leading firms facecritical challenges, even in sectors in which China’s policy makers have scored significantsuccesses.
I. CHINA AND THE GLOBAL BUSINESS REVOLUTION
China’s entry to the World Trade Organization (WTO) is a historic milestone in the process of
China’s integration with the world economy and business system. Among the many important possible
effects is the impact on its large firms. In the course of two decades of struggle, China’s large
enterprises have undertaken large-scale evolutionary change. During the same period, the world’s
leading firms have undergone a revolutionary transformation. This poses a deep challenge for China’s
large firms at the point of entry to the WTO. During the global business revolution, in order to survive
and prosper, the nature of the large firm based in high-income countries altered greatly. The inter-
twining of China’s internal business system change with the revolution in large global firms has been a
protracted and complicated process.2 It is far from over.
1 This paper was originally prepared for the Third United Kingdom-China Forum in October 2001. Professor PeterNolan facilitated the discussions for the Industry Committee, Finance and Economy Committee of the Forum. Leadersof major firms from the United Kingdom and China participated in the discussion. Participants include BP, BAeSystem, Rolls-Royce, BOC, British Airways, Barclays, HSBC, Standard Chartered Bank, Prudential, Royal & SunAlliance Insurance, Standard Life Assurance, Citigroup Europe, CGNU plc., Pricewaterhouse Coopers, DresdnerKleinwort Wasserstein, Bank of England, China Petroleum & Chemical Corporation (Sinopec), China Ocean ShippingCorporation (COSCO), China Aviation Industry Corporation Group 1 (AVIC 1), China Aviation Industry CorporationGroup 2 (AVIC 2), China International Trust and Investment Corporation (CITIC), China State Development Bank,and Ministry of Finance.
2 Peter Nolan is Director of the China Big Business Programme, based in the Judge Institute of Management Studies inthe University of Cambridge. Since 1994, he and Dr. Wang Xiaoqiang have been engaged in research on thetransformation of the ‘commanding heights’ of China's industry, using in-depth case studies to attempt to analyzeChina’s policy of building a powerful 'national team' of big businesses that can challenge the global giant corporations.They have combined their research in China with case study-based research inside the United Kingdom and US-basedglobal corporations. This has attempted to provide a careful benchmarking of the progress and problems encounteredin the course of China’s industrial policy since the early 1980s. Their research has resulted in numerous books andarticles written individually (Wang, 1999, Nolan, 1996, 1999, 2000, 2001a, 2001b, 2002a, 2002b), jointly by them(Nolan and Wang, 1997, 1998a, 1998b, 1999a, and 1999b), and jointly with other members of the research team(Nolan and Yeung, 2001a, 2001b). This paper is a part of that continuing research effort, and the general conclusionsreached here draw heavily on these publications.
2
A. China’s reforms
1. Lessons from other countries
A succession of ‘late comer countries’ developed powerful indigenous firms through different
measures of industrial policy, including Britain during the Industrial Revolution, the United States and
Continental Europe in the nineteenth century, the Republic of Korea, Taiwan Province of China and
Singapore in the second half of the twentieth century. From the 1950s to the 1970s, Japan’s industrial
planners supported the growth of a series of oligopolistic companies that developed into globally
powerful firms. After two decades of industrial policy in Japan, the country possessed a whole corps
of globally competitive companies. Today, it still has over one hundred Fortune 500 companies and
83 of the world’s top 300 companies by R&D expenditure (DTI, 2000). In the light of these
experiences, it seemed reasonable for China to follow similar policies to support the growth of its own
indigenous large firms. The history of other fast-growing, late-industrializing countries suggested that
it was realistic to hope that Chinese large enterprises would be able to ‘catch-up’ rapidly with the
world’s leading firms.
2. China’s ambitions
China began liberalizing the post-Mao economy in the late 1970s. A consistently stated goal ofChina’s industrial policy has been to construct globally powerful companies that can compete on theglobal level playing field:
In our world today economic competition between nations is in fact between eachnation’s large enterprises and enterprise groups. A nation’s economic might isconcentrated and manifested in the economic power and international competitiveness ofits large enterprises and groups… Our nation’s position in the international economicorder will be to a large extent determined by the position of our nation’s large enterprisesand groups. (Wu Banguo, Chinese State Council, August 1998.)
China’s ‘national team’ of large industrial firms included: Aviation Industries of China (AVIC)
in the aerospace industry; Sinopec and CNPC in oil and petrochemicals; Sanjiu, Dongbei, and
Shandong Xinhua in pharmaceuticals; Harbin, Shanghai, and Dongfang in power equipment; Yiqi,
Erqi, and Shanghai in automobiles; Shougang, Angang, and Baogang in steel; and Datong, Yanzhou
and Shenhua in coal mining.
China’s chosen global giant corporations were supported through industrial policies, which
included: tariffs, which still were significant in many sectors at the end of the 1990s; non-tariff
barriers, including limitations on access to domestic marketing channels, requirements for technology
transfer and to sub-contract to selected domestic firms as the price for market access; government
3
procurement policy; government selection of the partners for major international joint ventures;
preferential loans from state banks; and privileged access to listings on international stock markets.
As the reform process progressed, the Chinese government made it increasingly clear that the
country intended also to be able to establish a group of globally competitive large firms in financial
services and telecommunications. China Mobile and China Unicom, with massive international
flotations, were at the forefront of this process. The Bank of China is scheduled to be the first major
international flotation from the Chinese financial services sector. As China prepares to enter the WTO,
the country’s commitment to building globally competitive large firms remains undiminished:
The state will encourage big state-owned businesses to become internationallycompetitive corporations by listing on domestic and overseas stock market, increasing
research and development expenditure, and acquiring other businesses. The country will
develop thirty to fifty large state-owned enterprises in the next five years through public
offerings, mergers and acquisitions, restructuring and co-operation. (Bai Rongchun,
Director General, Industrial Planning Department, State Economic and Trade
Commission, July 2001.)
3. China’s progress
China’s industrial policies to support large firms were successful in the following senses. Large
state-owned enterprises avoided the collapse that took place in the former USSR. Industrial output
grew at around 13 per cent per annum from the early 1980s to the late 1990s, with sustained rapid
growth for large firms. Major changes took place in the operational mechanism of large, state-owned
enterprises. They absorbed a great deal of modern technology; learned how to compete in the
marketplace; substantially upgraded the technical level of their employees; learned wide-ranging new
managerial skills; and gained substantial understanding of international financial markets. China’s
large firms became sought-after partners for multinational companies. China attracted huge amounts
of foreign direct investment. Increasingly, global corporations viewed China as a central element in
their long-term strategy. A group of large mainland firms was listed successfully on international
stock markets. By the year 2001, China had eleven firms listed in the Fortune 500.
4. China’s difficulties
Achieving gradual reform of China’s large state-owned enterprises and nurturing their
transformation into globally competitive large firms was a daunting task. It was a very different
challenge from that which faced the industrial planners in Japan, the Republic of Korea or Taiwan
Province of China. The path taken by China was radically different from that followed in other
planned economies, which abandoned industrial policy and attempted to achieve sweeping
4
privatization of the large-scale state sector, and allow the market to decide the outcome.3
Unsurprisingly, China encountered many difficulties during this long evolutionary process.
a) Policy inconsistency
As we shall see, within the same industry, radically different reform policies were pursued at
different times. For example, in oil and petrochemicals, for many years, the policy was to increase the
autonomy of large production units. Then policy shifted totally towards centralized control over large
production units. At the same time, completely different policies were pursued in different sectors. For
example, while control was being centralized in the oil and petrochemical industry, AVIC was,
incomprehensibly, being broken up into two separate entities, each of which was even less able than
before to compete with the global giants.
b) Where is the firm?
The foundation of China’s economic reform was to increase ‘enterprise’ autonomy. The core of
most large ‘enterprises’ was a single large production unit. This had many benefits, including the
development of a strong sense of corporate ambition at the enterprise level. However, it caused
difficulties in the subsequent attempts to build multi-plant firms with unified central control over
individual production units.
c) Impoverished economy
China is still a poor country, with a relatively tiny middle class. For example, the entire stock of
saloon cars is only around five million. A large fraction of domestic demand is for low price, low
value-added products for over one billion peasants, internal migrants and poor urban residents.
Indigenous firms have to fight a battle on two fronts, on the one hand with global giants in high value-
added products, and on the other hand, with domestic SMEs in low value-added products.
d) Local protectionism
China has a strong tradition of relatively autonomous local government. There has been
persistent local resistance to cross-regional mergers, due to fears of downsizing and/or loss of control
of a ‘local asset’.
3 In fact, as is now widely recognized, it did not prove as easy to privatize the large-scale state-owned sector aswas originally visualized.
5
e) Inheritance from the planned economy
Unlike the other ‘late-comer’ countries, China’s large enterprises inherited huge manning levels,which are extremely hard to reduce without causing social instability. This will remain a deep problem
for many years.
f) Incentive to diversify
The inability of China’s emerging large firms to compete in international markets, plus the factthat they each have a huge workforce, produced a high incentive for the individual enterprise to
diversify. A single large enterprise could easily have hundreds of ‘children’ and grandchildren’subsidiaries and related companies. This gives the ‘illusion of scale’, but beneath an apparently largefirm there are typically hundreds of uneconomically small firms and immense problems of corporate
governance.
g) Problems for China’s bureaucracy
China’s bureaucracy lacked the intense nationalist incentive to build large firms successfullythat drove Japanese (and the Republic of Korea) policy makers. Also, China’s leaders are engaged in
an intense drive to root out corruption from the country’s huge bureaucracy. Corruption underminesthe bureaucracy’s ability to lead industrial policy effectively.
h) Ideological commitment to state ownership
China remained for most of the reform period committed to state ownership as a goal in its own
right, rather than building powerful corporations by whatever means was suitable. It proved hard toachieve the separation of government and enterprise that has been advocated for many years.
5. The challenge for China
Case studies conducted in the late 1990s in a wide range of sectors (Nolan, 2001) show that
after two decades of reform in most sectors the competitive capability of China’s large firms is stillweak in relation to the global giants. By the simplest of measures of sales revenue, profits and R&D,China’s vanguard of leading firms that are intended to ‘compete on the global level playing field’, are
still significantly behind the global leaders. This was found to be extremely marked in the high-technology sectors, such as IT hardware, complex equipment such as power plants, andpharmaceuticals, as well as in ‘mid-technology’ sectors such as automobile assembly and automobile
components. However, even in sectors with apparently less advanced technology, such as steel andcoal, there was a significant gap with leading global companies in the high value-added segments ofthe market. In financial services, it is widely recognized that China’s leading commercial banks,
insurance companies and accountancy firms lag far behind the global leaders.
6
At the start of the 21st century, not one of China’s leading enterprises has become a globally
competitive giant corporation, with a global market, a global brand, and a global procurement system.
The Chinese companies included in the Fortune 500 all faced huge problems of downsizing. China
had no less than five of the top ten companies in the Fortune 500 in terms of numbers of employees
(Fortune Global 500, 2001). China had just two companies in the FT 500 which ranks firms by market
capitalization (FT, 11 May 2001). These were China Mobile and China Unicom, both of which operate
in a totally protected domestic environment. The vast bulk of their IT hardware equipment was
purchased from the global giants.4 China did not have one company in the world’s top 300 companies
by R&D expenditure (DTI, 2000). China did not have any representatives in Morgan Stanley Dean
Witter’s list of the world’s top 250 ‘competitive edge’ companies (MSDW, 2000). China did not have
a single company in Business Week’s list of the world’s top 100 brands (Business Week , 6 August
2001).
B. The global business revolution
China’s attempt to build large globally competitive firms coincided with the most revolutionary
epoch in world business history, possibly even including the Industrial Revolution. The global
business system was much more stable during the period during which Japan, the Republic of Korea
and Taiwan Province of China were putting into place their industrial policy. China’s effort to support
the growth of competitive global corporations has taken place at a time of unprecedented change in the
international business system, amounting to nothing less than a revolution. Moreover, the high-income
countries were willing to tolerate extensive state intervention in these countries, because they were
viewed as the front line in the fight against communism. China is regarded by the United States as a
‘strategic competitor’.
There were a number of aspects to the global business revolution.
1. Liberalization of world trade and capital markets
The period since the late 1980s has witnessed for the first time the opening up of a truly global
market place in goods, services, capital and skilled labour. The only market which still remains bound
firmly by nationality is the vast sea of unskilled labour. The world’s leading firms have massively
increased their production capabilities in fast-growing parts of developing countries. Foreign direct
investment (FDI) in developing countries grew from $24 billion in 1990 to $170 billion in 1998. China
4 In 1999, total IT hardware sales in China reached $20 billion, including mobile infrastructure and handsets;traditional fixed line and broadband switching equipment; optical cable/optical cable fibre; SD and DWDMproducts. It is estimated that 90 per cent of the IT hardware by value was supplied by the global giants(including Nokia, Motorola, Ericsson, Cisco, Siemens, Alcatel, and Lucent) either through imports or their largeproduction networks of within China.
7
was, by far, the main focus of attention, with FDI rising from $3.5 billion in 1990 to $44 billion in
1998 (World Bank, 2001: 315). The struggle among the world’s leading firms has now deeply
penetrated the most developed parts of the low and middle-income countries.
China is at the centre of this battle. The world’s giant firms are struggling intensely with each
other for a share of the China market: Boeing and Airbus in aerospace; Pfizer, GlaxoSmithKline,
Merck, and Astra Zeneca in pharmaceuticals; Shell, BP and Exxon in oil and petrochemicals; IBM,
Siemens, Nokia and Ericsson in IT hardware; Ford, GM, VW and Toyota in automobiles; Alstom,
Siemens and GE in power equipment; Coca-Cola and Pepsico in soft drinks; Philip Morris, Japan
Tobacco and BAT in tobacco; Nestlé and Unilever in FMCGs; Usinor, Posco and Nippon Steel in
steel; Rio Tinto, Billiton and Anglo-American in mining; Morgan Stanley, Goldman Sachs and Merrill
Lynch in investment banking; PwC, KPMG and De Loitte in accountancy; Axa, Allianz, AIG,
Prudential and CGNU in insurance; Citigroup, Deutsche Bank, J.P.Morgan Chase, and Credit Suisse
in banking; News Corps and AOL-Time Warner in the mass media.
2. Explosive M&A and concentration
The period since the 1980s witnessed by the world’s most explosive period of mergers and
acquisitions. Global M&A rose from $156 billion in 1992 to around $3,300 billion in 1999 (Nolan,
2001: 38). The size of the merger boom of the 1990s eclipses that of any previous epoch. It will leave
a long-lasting imprint on the global business structure. In almost every sector a small number of
focused global producers dominates the world market. Competitive capitalism’s inbuilt tendency to
concentration and oligopoly has finally flowered on a global scale.
Today, only two firms make large (over 100 seats) commercial aircraft.5 In pharmaceuticals, the
top ten firms account for 46 per cent of world sales. In oil and petrochemicals, a group of just three
‘super majors’ has emerged, occupying three of the top seven slots in the Fortune 500 list of the
world’s largest companies ranked by sales revenue. In power equipment, the top three firms account
for almost nine-tenths of the world total of gas turbines installed in the 1990s. In the automobile
sector, the top six automobile firms account for over 75 per cent of the global market. In IT hardware,
the top three firms account for 71 per cent of the global supply of servers, for two-fifths of the global
sales of PCs and three-fifths of global sales of mobile phones. In fast-moving consumer goods, just
two firms account for over 80 per cent of global sales of carbonated soft drinks; two firms account for
around 70 per cent of global sales of camera film; three firms account for almost one-half of global
sales of spirits; and four firms account for 60 per cent of global tobacco sales.
5 For sources of data used in this and the following paragraph, see Nolan, 2001a: chapter 2, ‘The challenge of theglobal business revolution’.

8
3. ‘Cascade effect’
Not only have the core ‘systems integrators’ experienced an explosive process of concentration.
The deepening interaction between core companies and supplier companies has created an explosive
‘cascade’ effect that is rapidly leading to concentration and focus among the first-tier suppliers andspilling over even into second and third-tier suppliers. Concentration among leading aircraft
assemblers has stimulated concentration among the main aerospace components suppliers: there are
now just three makers of large aircraft engines across the world. Concentration among automobileassemblers has stimulated concentration among automobile components makers: the top three tyre
makers account for almost two-thirds of global tyre sales; the top two manufacturers of automobile
brake systems account for 56 per cent of global sales and the top two firms account for almost one-halfof global sales of car air conditioning systems. Concentration among IT equipment makers has
stimulated concentration among IT suppliers. One firm accounts for 85 per cent of global sales of
micro-processors (‘intel inside’), another accounts for 80 per cent of high end routers, another suppliesaround one half of all optical fibres and another accounts for over nine-tenths of computer operating
systems.
In sector after sector, the ‘first-tier’ suppliers are themselves multi-billion dollar companies with
‘global reach’. This makes the competitive landscape even more challenging for firms from
developing countries.
4. The ‘external firm’
If we define the firm not by the entity which is the legal owner, but, rather, by the sphere over
which conscious co-ordination of resource allocation takes place, then, far from becoming ‘hollowed
out’ and much smaller in scope, the large firm can be seen to have enormously increased in size duringthe global business revolution. In a wide range of business activities, the organization of the value
chain has developed into a comprehensively planned and co-ordinated activity. At its centre is the core
systems integrator. Through the hugely increased planning function undertaken by systems integrators,facilitated by recent developments in information technology, the boundaries of the large corporation
have become blurred. In order to develop and maintain their competitive advantage, the systems
integrators deeply penetrate the value chain both upstream and downstream. They are closely involvedin business activities that range from long-term planning to meticulous control of day-to-day
production and delivery schedules. Competitive advantage for the systems integrator requires that it
must consider the interests of the whole value chain in order to minimize costs across the wholesystem. Far from becoming ‘hollowed out’ and much smaller in scope, the extent of control exercised
by the large firm has enormously increased during the global business revolution (Nolan, 1999).
5. Dominance of firms based in advanced economies
Firms headquartered in regions containing a small fraction of the world’s population havecomprehensively dominated the global business revolution (table 1). The high-income economies
9
contain just 16 per cent of the world’s total population. They account for 91 per cent of the world’stotal stock market capitalization, 95 per cent of Fortune 500 companies, 97 per cent of the FT 500
companies, 99 per cent of the world’s top brands and 100 per cent of the world’s top 300 companies
by value of R&D spending.
North America is by far, the world leader in this process. North America has just over 5 per cent
of the world’s population, but it accounts for 40 per cent of the Fortune 500 firms, 46 per cent of theworld’s top 300 firms by R&D expenditure (74 per cent of the top 300 IT hardware and software
firms, ranked by R&D spending), 50 per cent of the FT 500 firms, 54 per cent of Morgan Stanley’s list
of the top 250 ‘global competitive edge’ firms, and 61 per cent of the world’s top 100 brands.
Developing countries are massively disadvantaged in the race to compete on the global level
playing field of international big business. The starting points in the race to dominate global marketscould not be more uneven. The whole of the developing world, containing 84 per cent of the world’s
population, contains just 26 Fortune 500 companies, 16 FT 500 companies, 15 of Morgan Stanley’s
list of the 250 leading ‘competitive edge’ companies, one of the world’s top 100 brands and none ofthe world’s top 300 companies by R&D expenditure.
C. Conclusion
China’s rapid move towards ‘close’ integration with the world economy is occurring at a time ofrevolutionary change in the global business system. This presents an extreme challenge for China’s
industrial strategy. As China’s enters the WTO, there is a series of critical questions that need to be
answered both by Chinese and globally powerful firms seeking to penetrate the Chinese market. Thisraises numerous issues for China’s industrial policy makers. Would privatization of China’s large
enterprises be sufficient to make them competitive on the ‘global level playing field’ within the WTO?
At which level in the global value chain can any given large Chinese firm best compete: as a ‘coresystems integrator’, ‘first-tier supplier’, or lower down the value chain? What role will be permitted
for national industrial policy in China within the WTO? Does China’s bureaucracy have the capability
to administer industrial policy effectively? Does it matter whether China, or other developingcountries, have ‘national champions’ that can compete on the ‘global level playing field’? Does the
global corporation, with production bases and markets throughout large parts of the world, any longer
have a ‘national’ or a ‘regional’ identity?
Section II and III of this paper analyse the challenge of globalization in two very different
industries, oil and petrochemicals and aerospace. The purpose of this detailed examination of thesecontrasting sectors is to investigate the nature of the challenge facing large Chinese firms in ‘strategic’
sectors that have formed, and still do form, an important focus of industrial policy in high income
countries.
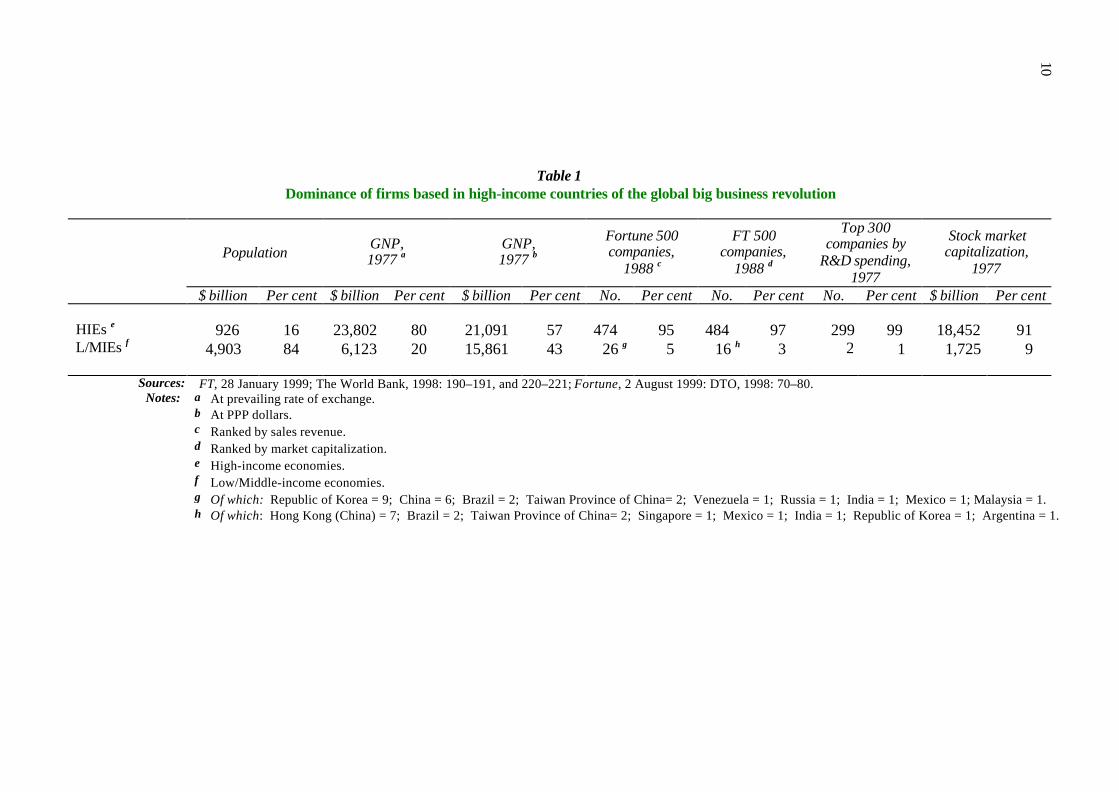
Table 1Dominance of firms based in high-income countries of the global big business revolution
PopulationGNP,1977 a
GNP,1977 b
Fortune 500companies,
1988 c
FT 500companies,
1988 d
Top 300companies by
R&D spending,1977
Stock marketcapitalization,
1977
$ billion Per cent $ billion Per cent $ billion Per cent No. Per cent No. Per cent No. Per cent $ billion Per cent
HIEs e 926 16 23,802 80 21,091 57 474 95 484 97 299 99 18,452 91L/MIEs f 4,903 84 6,123 20 15,861 43 26 g 5 16 h 3 2 1 1,725 9
Sources: FT, 28 January 1999; The World Bank, 1998: 190–191, and 220–221; Fortune, 2 August 1999: DTO, 1998: 70–80.Notes: a At prevailing rate of exchange.
b At PPP dollars.c Ranked by sales revenue.d Ranked by market capitalization.e High-income economies.f Low/Middle-income economies.g Of which: Republic of Korea = 9; China = 6; Brazil = 2; Taiwan Province of China= 2; Venezuela = 1; Russia = 1; India = 1; Mexico = 1; Malaysia = 1.h Of which: Hong Kong (China) = 7; Brazil = 2; Taiwan Province of China= 2; Singapore = 1; Mexico = 1; India = 1; Republic of Korea = 1; Argentina = 1.
10
11
II. OIL AND PETROCHEMICALS
A. The global setting
1. World oil and gas in the 1990s
Crude oil and natural gas remain central to global political economy. The contribution of oil to
the world primary energy consumption has remained stable at around 40 per cent. The share of natural
gas in the world primary energy consumption rose from 20.3 per cent in 1990 to 24.7 per cent in 2000.
The regional distribution of world oil and gas reserves, production and consumption are highly uneven
(table 2). This is of special importance for global political economy. The Middle East and the former
Soviet Union (FSU) account for 70 per cent of the world total oil reserves and 73 per cent of the world
total natural gas reserves. The five countries of Saudi Arabia, Kuwait, the Islamic Republic of Iran,
Iraq and United Arab Emirates between them account for over three-fifths of the world total oil
reserves. Russia alone accounts for more than one-third of the world total gas reserves. The Middle
East is the world’s most important oil supplier, accounting for 31 per cent of global production.
Seventy-five per cent of its output is exported. The FSU is the world’s largest gas producer,
accounting for 28 per cent of global production in 2000.
The United States is the world biggest oil and gas consumer (table 2). In 2000, the United States
accounted for over one quarter of the world total oil imports and nearly half of the country’s total
consumption. The United States’ share of the world gas production is 23 per cent, but still lags behind
its share of gas consumption, accounting for 27 per cent of the global total. More than 60 per cent of
Europe’s oil consumption is met by imports from outside the region. Japan relies totally on imports for
its oil and gas supplies (table 2).
China is poorly endowed with oil and gas. Its share of the world oil and gas reserves amount to
only 2.3 per cent and 0.9 per cent respectively (table 2). In contrast, China’s coal reserves are second
only to those of the United States. China was the world’s largest producer and consumer of coal in the
1990’s. Coal accounted for 67 per cent of China’s total primary energy consumption in 1999. It plans
to raise the share of gas in total primary energy consumption from the current 3 per cent to 8 per cent
in 2010, which will somewhat reduce the share of coal. Coal remains an abundant and cheap source of
primary energy for China. During the 1990s, oil and gas consumption increased at a compound annual
growth rate of 5.5 per cent and 5.7 per cent respectively. In 2000, China was the third largest oil
consuming country after the United States and Japan. After 1993, China became a net crude oil
importer. Oil imports reached 71 million tons in 2000 (BP, 2001), equivalent to 31 per cent of China’s
total oil consumption. It is predicted that by the year 2005, 40 per cent of China’s demand for oil will
be met by imports (China Petroleum, June 1999). The issue of oil supply security remains a major
concern for China’s policy makers.
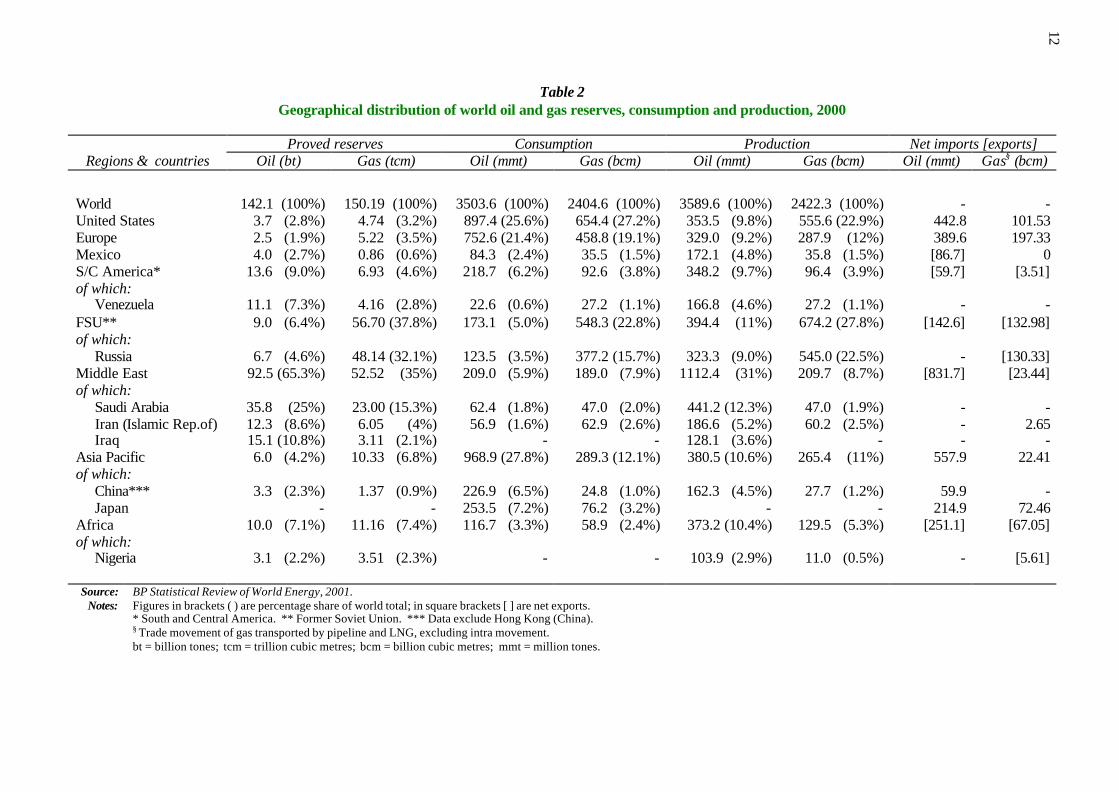
Table 2Geographical distribution of world oil and gas reserves, consumption and production, 2000
Proved reserves Consumption Production Net imports [exports]Regions & countries Oil (bt) Gas (tcm) Oil (mmt) Gas (bcm) Oil (mmt) Gas (bcm) Oil (mmt) Gas§ (bcm)
World 142.1 (100%) 150.19 (100%) 3503.6 (100%) 2404.6 (100%) 3589.6 (100%) 2422.3 (100%) - -United States 3.7 (2.8%) 4.74 (3.2%) 897.4 (25.6%) 654.4 (27.2%) 353.5 (9.8%) 555.6 (22.9%) 442.8 101.53Europe 2.5 (1.9%) 5.22 (3.5%) 752.6 (21.4%) 458.8 (19.1%) 329.0 (9.2%) 287.9 (12%) 389.6 197.33Mexico 4.0 (2.7%) 0.86 (0.6%) 84.3 (2.4%) 35.5 (1.5%) 172.1 (4.8%) 35.8 (1.5%) [86.7] 0S/C America*of which: Venezuela
13.6 (9.0%)
11.1 (7.3%)
6.93 (4.6%)
4.16 (2.8%)
218.7 (6.2%)
22.6 (0.6%)
92.6 (3.8%)
27.2 (1.1%)
348.2 (9.7%)
166.8 (4.6%)
96.4 (3.9%)
27.2 (1.1%)
[59.7]
-
[3.51]
-9.0 (6.4%) 56.70 (37.8%) 173.1 (5.0%) 548.3 (22.8%) 394.4 (11%) 674.2 (27.8%) [142.6] [132.98]FSU**
of which: Russia 6.7 (4.6%) 48.14 (32.1%) 123.5 (3.5%) 377.2 (15.7%) 323.3 (9.0%) 545.0 (22.5%) - [130.33]Middle Eastof which: Saudi Arabia Iran (Islamic Rep.of) Iraq
92.5 (65.3%)
35.8 (25%)12.3 (8.6%)15.1 (10.8%)
52.52 (35%)
23.00 (15.3%)6.05 (4%)3.11 (2.1%)
209.0 (5.9%)
62.4 (1.8%)56.9 (1.6%)
-
189.0 (7.9%)
47.0 (2.0%)62.9 (2.6%)
-
1112.4 (31%)
441.2 (12.3%)186.6 (5.2%)128.1 (3.6%)
209.7 (8.7%)
47.0 (1.9%)60.2 (2.5%)
-
[831.7]
---
[23.44]
-2.65
-Asia Pacificof which: China*** Japan
6.0 (4.2%)
3.3 (2.3%)-
10.33 (6.8%)
1.37 (0.9%)-
968.9 (27.8%)
226.9 (6.5%)253.5 (7.2%)
289.3 (12.1%)
24.8 (1.0%)76.2 (3.2%)
380.5 (10.6%)
162.3 (4.5%)-
265.4 (11%)
27.7 (1.2%)-
557.9
59.9214.9
22.41
-72.46
Africaof which: Nigeria
10.0 (7.1%)
3.1 (2.2%)
11.16 (7.4%)
3.51 (2.3%)
116.7 (3.3%)
-
58.9 (2.4%)
-
373.2 (10.4%)
103.9 (2.9%)
129.5 (5.3%)
11.0 (0.5%)
[251.1]
-
[67.05]
[5.61]
Source: BP Statistical Review of World Energy, 2001.Notes: Figures in brackets ( ) are percentage share of world total; in square brackets [ ] are net exports.
* South and Central America. ** Former Soviet Union. *** Data exclude Hong Kong (China).§ Trade movement of gas transported by pipeline and LNG, excluding intra movement.bt = billion tones; tcm = trillion cubic metres; bcm = billion cubic metres; mmt = million tones.
12
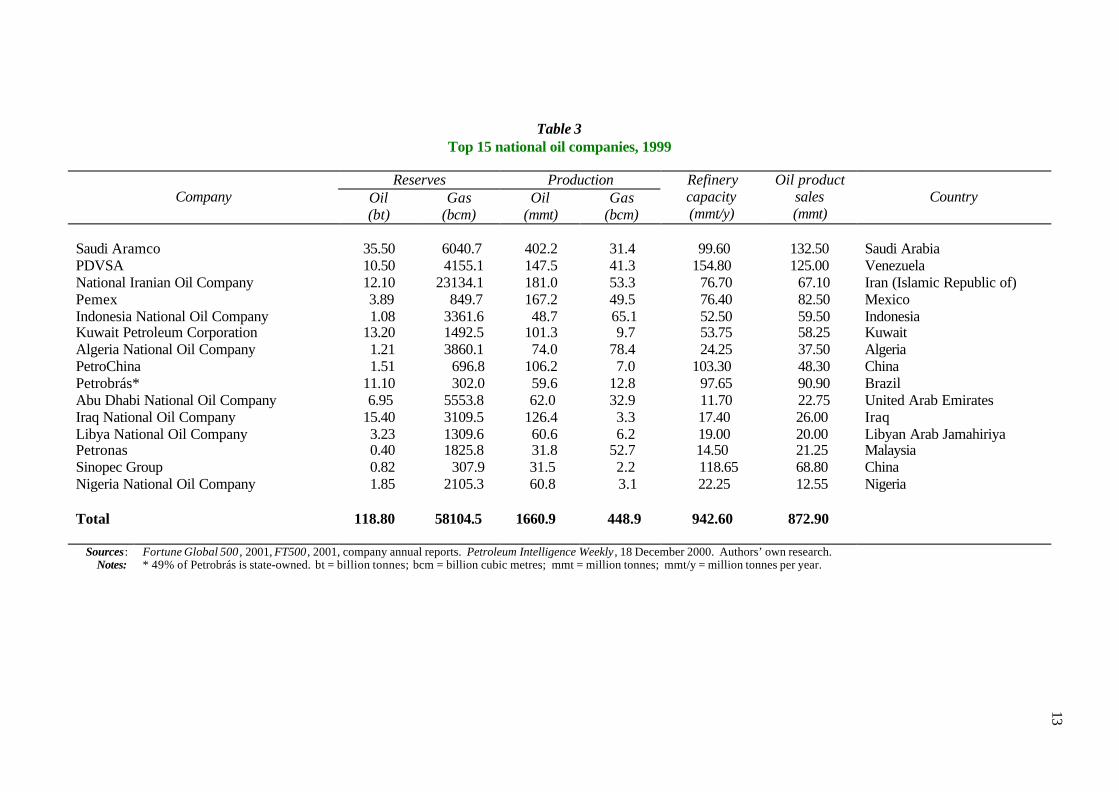
Table 3Top 15 national oil companies, 1999
Reserves ProductionCompany Oil
(bt)Gas
(bcm)Oil
(mmt)Gas
(bcm)
Refinerycapacity(mmt/y)
Oil productsales(mmt)
Country
Saudi Aramco 35.50 6040.7 402.2 31.4 99.60 132.50 Saudi ArabiaPDVSA 10.50 4155.1 147.5 41.3 154.80 125.00 VenezuelaNational Iranian Oil Company 12.10 23134.1 181.0 53.3 76.70 67.10 Iran (Islamic Republic of)Pemex 3.89 849.7 167.2 49.5 76.40 82.50 MexicoIndonesia National Oil Company 1.08 3361.6 48.7 65.1 52.50 59.50 IndonesiaKuwait Petroleum Corporation 13.20 1492.5 101.3 9.7 53.75 58.25 KuwaitAlgeria National Oil Company 1.21 3860.1 74.0 78.4 24.25 37.50 AlgeriaPetroChina 1.51 696.8 106.2 7.0 103.30 48.30 ChinaPetrobrás* 11.10 302.0 59.6 12.8 97.65 90.90 BrazilAbu Dhabi National Oil Company 6.95 5553.8 62.0 32.9 11.70 22.75 United Arab EmiratesIraq National Oil Company 15.40 3109.5 126.4 3.3 17.40 26.00 IraqLibya National Oil Company 3.23 1309.6 60.6 6.2 19.00 20.00 Libyan Arab JamahiriyaPetronas 0.40 1825.8 31.8 52.7 14.50 21.25 MalaysiaSinopec Group 0.82 307.9 31.5 2.2 118.65 68.80 ChinaNigeria National Oil Company 1.85 2105.3 60.8 3.1 22.25 12.55 Nigeria
Total 118.80 58104.5 1660.9 448.9 942.60 872.90
Sources: Fortune Global 500 , 2001, FT500 , 2001, company annual reports. Petroleum Intelligence Weekly , 18 December 2000. Authors’ own research.Notes: * 49% of Petrobrás is state-owned. bt = billion tonnes; bcm = billion cubic metres; mmt = million tonnes; mmt/y = million tonnes per year.
13
14
2. National oil companies
At the end of the 1990s, among the world top 25 oil companies ranked by operating performance,
fourteen (fifteen if Petrobrás is included) 6 were state-owned national champions, all based in developing
countries (table 3). These national oil companies (NOCs) own the majority of the world oil and gas reserves
and are the world’s largest oil producers. There have been no cross-border mergers among the NOCs. They
are regarded as national assets by their governments. In 1999, the combined oil and gas reserves of these oil
companies accounted for 77 per cent and 49 per cent of the total world oil and gas reserves respectively.
They produced 48 per cent of total world oil production, compared with 18 per accounted for by the global
oil majors (GOMs) based in the United States and Europe.7 Gas production of the NOCs was 449 billion
cubic metres in 1999, accounting for 19 per cent of total world gas production, compared with the 424 billion
cubic metres produced by GOMs in the same year.
The NOCs are relatively weak in downstream refining and marketing. Their total annual refinery
capacity in 1999 was 943 million tonnes per year (mmt/y), compared to the GOMs’ capacity of 1064 mmt/y
capacity. Refined product sales of the 15 NOCs were 873 mmt in 1999, less than the combined amount of
1063 mmt of refined products sold by Exxon Mobil, Royal Dutch/Shell and BP Amoco/Arco in the same
period.
Among the NOCs, PetroChina and Sinopec Group are at the bottom of the league in terms of oil and
gas reserves (table 3). Even their combined oil reserves were only 2.33 billion tons, just 6.6 per cent of those
of Saudi Aramco and substantially behind the 3.89 billion tons of oil reserves held by Pemex. Their
combined gas reserves of 1005 billion cubic metres were the smallest among the leading NOCs. Both
PetroChina and Sinopec entirely rely on domestic reserves for production. In 1999, PetroChina was ranked
the eighth largest oil producer in the world (Petroleum Intelligence Weekly, 18 December 2000). The
combined oil production of PetroChina and Sinopec Group would rank China as the fifth largest producer in
the world. In contrast, the combined gas production of PetroChina and the Sinopec Group was tiny, only
18 per cent of that of Petronas. Downstream, the annual refinery capacity of each of PetroChina and Sinopec
Group was above 100 mmt/y, but their combined oil product sales were 117 mmt, at the level of Chevron
alone.
6 Petrobrás (Brazil) is partially privatized.7 They are Exxon Mobil, Royal Dutch/Shell, BP Amoco/Arco, TotalFinaElf, Chevron, Texaco, Eni, Repsol YPF, andConoco.
15
3. Merger frenzy
In contrast to the NOCs, a frenzy of consolidation began to sweep through the global oil majors in the
late-1990s. In just two years from 1998 to 2000, the number of major western oil companies was reduced
from eleven to six. This fundamentally changed the competitive landscape in the industry.
a) BP/Amoco: August 1998
The consolidation process in the oil and petrochemical industry was initiated by BP’s trans-Atlantic
merger with Amoco in a $55 billion transaction in August 1998. The combined group placed itself close
behind the world leader Royal Dutch/Shell and Exxon in terms of market capitalization, oil and gas reserves
and production. The merger greatly strengthened BP’s position in downstream marketing in the Mid-West
and Eastern United States as well as in the petrochemicals production. The merger is highly significant in
that it was one of a series of major transatlantic mergers and acquisitions initiated by European-based
companies, including Daimler/Chrysler, Deutsche Bank/Bankers Trust, Siemens/Westinghouse (non-nuclear
power division) and Deutsche Telecom/Voice Stream.
b) Exxon/Mobil: November 1998
Just three months after the BP Amoco merger, Exxon, then the second largest western oil company,
announced that it was to merge with Mobil, the third largest, in an $86 billion transaction. The merged
company overtook Royal Dutch/Shell as the number one western oil company in terms of revenue, profit,
combined oil and gas reserves, oil and gas production, and refining capacity (tables 4 and 5). The new
company Exxon Mobil has a much wider global spread of assets. It possesses a significant share in some of
the world’s most important emerging oil areas, including offshore in West Africa and in the Caspian Sea. It
owns 60 per cent of the proved gas reserves in Europe and is exploring and developing gas fields in the Asia
Pacific Area. Downstream, Exxon Mobil has 33,000 service stations world-wide. Both Exxon and Mobil
have powerful global brand recognition. In the fast-growing and profitable lubricant market, Exxon is the
world’s top producer of lubricant base stocks while Mobil is the market leader in lubricants in both the
United States and Europe. Exxon and Mobil also had complementary assets in major petrochemicals such as
polyethylene and paraxylene. The merger enabled Exxon/Mobil to overtake Royal Dutch/Shell in financial
performance and almost every aspect of operating strength.
16
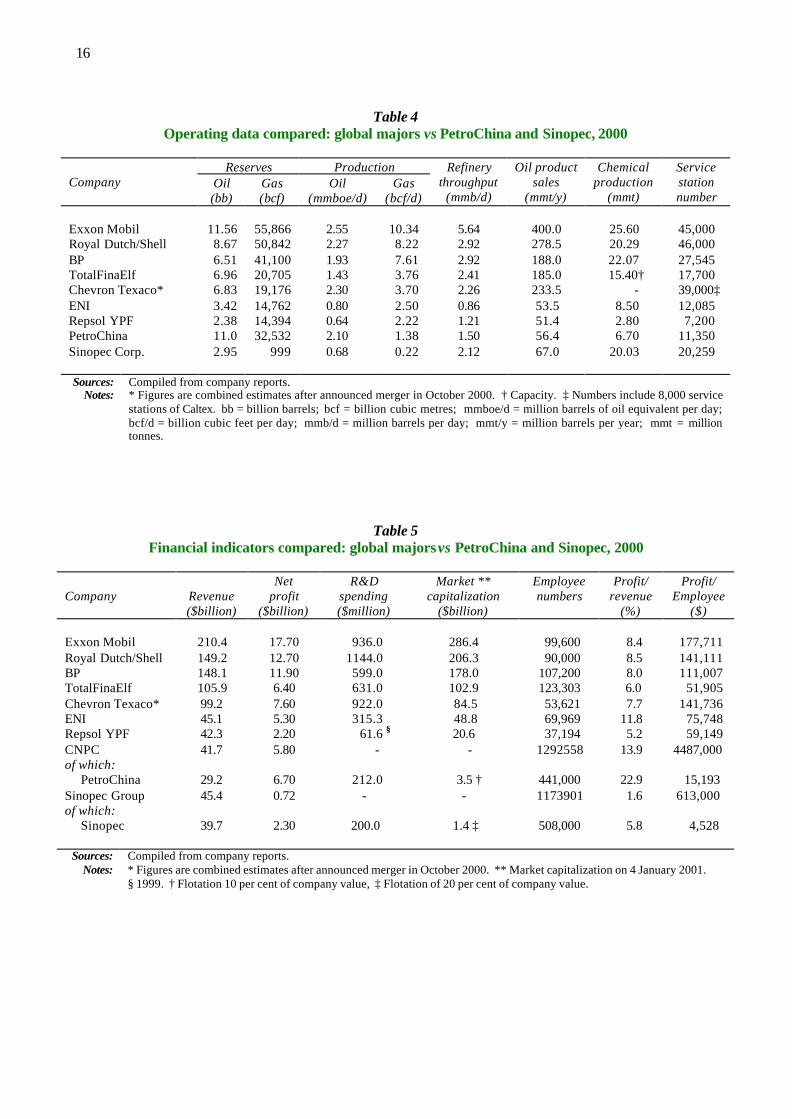
Table 4Operating data compared: global majors vs PetroChina and Sinopec, 2000
Reserves ProductionCompany Oil
(bb)Gas(bcf)
Oil(mmboe/d)
Gas(bcf/d)
Refinerythroughput
(mmb/d)
Oil productsales
(mmt/y)
Chemicalproduction
(mmt)
Servicestationnumber
Exxon Mobil 11.56 55,866 2.55 10.34 5.64 400.0 25.60 45,000Royal Dutch/Shell 8.67 50,842 2.27 8.22 2.92 278.5 20.29 46,000BP 6.51 41,100 1.93 7.61 2.92 188.0 22.07 27,545TotalFinaElf 6.96 20,705 1.43 3.76 2.41 185.0 15.40† 17,700Chevron Texaco* 6.83 19,176 2.30 3.70 2.26 233.5 - 39,000‡ENI 3.42 14,762 0.80 2.50 0.86 53.5 8.50 12,085Repsol YPF 2.38 14,394 0.64 2.22 1.21 51.4 2.80 7,200PetroChina 11.0 32,532 2.10 1.38 1.50 56.4 6.70 11,350Sinopec Corp. 2.95 999 0.68 0.22 2.12 67.0 20.03 20,259
Sources: Compiled from company reports.Notes: * Figures are combined estimates after announced merger in October 2000. † Capacity. ‡ Numbers include 8,000 service
stations of Caltex. bb = billion barrels; bcf = billion cubic metres; mmboe/d = million barrels of oil equivalent per day;bcf/d = billion cubic feet per day; mmb/d = million barrels per day; mmt/y = million barrels per year; mmt = milliontonnes.
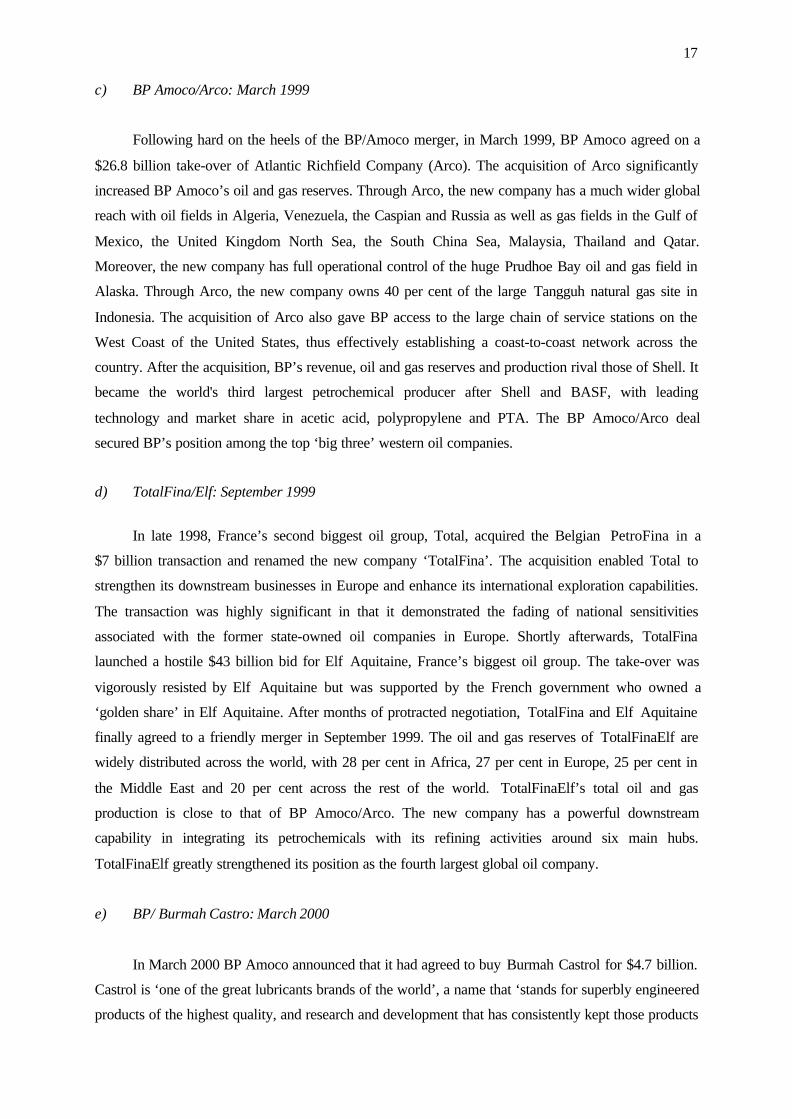
Table 5Financial indicators compared: global majors vs PetroChina and Sinopec, 2000
Company Revenue($billion)
Netprofit
($billion)
R&Dspending($million)
Market **capitalization
($billion)
Employeenumbers
Profit/revenue
(%)
Profit/Employee
($)
Exxon Mobil 210.4 17.70 936.0 286.4 99,600 8.4 177,711Royal Dutch/Shell 149.2 12.70 1144.0 206.3 90,000 8.5 141,111BP 148.1 11.90 599.0 178.0 107,200 8.0 111,007TotalFinaElf 105.9 6.40 631.0 102.9 123,303 6.0 51,905Chevron Texaco* 99.2 7.60 922.0 84.5 53,621 7.7 141,736ENI 45.1 5.30 315.3 48.8 69,969 11.8 75,748Repsol YPF 42.3 2.20 61.6 § 20.6 37,194 5.2 59,149CNPCof which: PetroChina
41.7
29.2
5.80
6.70
-
212.0
-
3.5 †
1292558
441,000
13.9
22.9
4487,000
15,193Sinopec Groupof which: Sinopec
45.4
39.7
0.72
2.30
-
200.0
-
1.4 ‡
1173901
508,000
1.6
5.8
613,000
4,528
Sources: Compiled from company reports.Notes: * Figures are combined estimates after announced merger in October 2000. ** Market capitalization on 4 January 2001.
§ 1999. † Flotation 10 per cent of company value, ‡ Flotation of 20 per cent of company value.
17
c) BP Amoco/Arco: March 1999
Following hard on the heels of the BP/Amoco merger, in March 1999, BP Amoco agreed on a
$26.8 billion take-over of Atlantic Richfield Company (Arco). The acquisition of Arco significantly
increased BP Amoco’s oil and gas reserves. Through Arco, the new company has a much wider global
reach with oil fields in Algeria, Venezuela, the Caspian and Russia as well as gas fields in the Gulf of
Mexico, the United Kingdom North Sea, the South China Sea, Malaysia, Thailand and Qatar.
Moreover, the new company has full operational control of the huge Prudhoe Bay oil and gas field in
Alaska. Through Arco, the new company owns 40 per cent of the large Tangguh natural gas site in
Indonesia. The acquisition of Arco also gave BP access to the large chain of service stations on the
West Coast of the United States, thus effectively establishing a coast-to-coast network across the
country. After the acquisition, BP’s revenue, oil and gas reserves and production rival those of Shell. It
became the world's third largest petrochemical producer after Shell and BASF, with leading
technology and market share in acetic acid, polypropylene and PTA. The BP Amoco/Arco deal
secured BP’s position among the top ‘big three’ western oil companies.
d) TotalFina/Elf: September 1999
In late 1998, France’s second biggest oil group, Total, acquired the Belgian PetroFina in a
$7 billion transaction and renamed the new company ‘TotalFina’. The acquisition enabled Total to
strengthen its downstream businesses in Europe and enhance its international exploration capabilities.
The transaction was highly significant in that it demonstrated the fading of national sensitivities
associated with the former state-owned oil companies in Europe. Shortly afterwards, TotalFina
launched a hostile $43 billion bid for Elf Aquitaine, France’s biggest oil group. The take-over was
vigorously resisted by Elf Aquitaine but was supported by the French government who owned a
‘golden share’ in Elf Aquitaine. After months of protracted negotiation, TotalFina and Elf Aquitaine
finally agreed to a friendly merger in September 1999. The oil and gas reserves of TotalFinaElf are
widely distributed across the world, with 28 per cent in Africa, 27 per cent in Europe, 25 per cent in
the Middle East and 20 per cent across the rest of the world. TotalFinaElf’s total oil and gas
production is close to that of BP Amoco/Arco. The new company has a powerful downstream
capability in integrating its petrochemicals with its refining activities around six main hubs.
TotalFinaElf greatly strengthened its position as the fourth largest global oil company.
e) BP/ Burmah Castro: March 2000
In March 2000 BP Amoco announced that it had agreed to buy Burmah Castrol for $4.7 billion.
Castrol is ‘one of the great lubricants brands of the world’, a name that ‘stands for superbly engineered
products of the highest quality, and research and development that has consistently kept those products
18
at the forefront of the marketplace’ (BP Website). It has become BP Amoco’s leading lubricants brand
with its products made available through the group's 28,000 retail sites and to BP Amoco’s massive
worldwide customer base.
f) Chevron/Texaco: October 2000
In October 2000, Chevron and Texaco announced they were to merge in a $42 billion
transaction. The new company became the world’s fourth largest producer. The combined company
has a strong position in most of the world’s major and emerging exploration and producing areas.
Chevron has low-cost international oil projects offshore Angola and Kazakstan and is a 50:50 equity
partner with Petrobrás in the Campos and Cumuruxatiba areas of Brazil. Texaco has made deep-water
discoveries offshore Nigeria and is an active explorer and developer in the Unites States Gulf of
Mexico, Kazakhstan, deep-water Brazil, Venezuela and the Philippines. The new company became the
third largest producer in the United States Gulf of Mexico next to BP and Exxon Mobil. Caltex, the
refining joint venture between Chevron and Texaco since 1936, will be integrated into the new
company, strengthening the new company’s downstream businesses in Asia, Africa and the Middle
East. Caltex runs 8,000 service stations. In the profitable lubricant business, the new company
accounts for 20–30 per cent of the lubricant additive market and 5–10 per cent of finished lubricant
sales in Europe.
g) Conoco/Phillips: November 2001
The consolidation process has been ‘cascading’ into the mid-sized integrated oil and
petrochemical companies. In November 2001, Conoco and Phillips announced a $35 billion merger.
Previous to this merger, each company has been making acquisitions fast. Conoco’s acquisition of
Gulf Canada Resources increased its natural gas reserves and production in North America by 50 per
cent. Phillips’ acquisition of Tosco increased its refining capacity in the United States by five times
and the company becomes the second largest refiner in the United States next to Exxon Mobil. Conoco
Phillips will become the world sixth largest energy company in terms of oil and gas reserves and
production and the fifth largest global refiner. The merger to grow bigger comes from the pressure to
compete with the industry’s ‘super-major’ groups that have an edge in highly capital-intensive projects
for the energy world in China, the Middle East and West Africa (FT, 20 November, 2001).
h) Repsol-YPF
During the period of large-scale mergers among the western major oil companies, Spain’s
Repsol launched a hostile, $13 billion all-cash bid for Argentina’s YPF in 1999. The deal is highly
significant in that it is the first time that a large privatized western oil company has taken over a major,
formerly state-owned oil and petrochemical company from a developing country.
19
Before it was privatized by the government in 1991, YPF had exclusive rights for oil
exploration and production in Argentina, though domestic and international private companies had
long been allowed to participate in the oil sector. YPF had accounted for around half of domestic oil
production. Following its privatization, YPF was restructured for international flotation. Separated
from the non-core businesses, the core businesses from upstream exploration and development to
downstream refining, marketing, and petrochemicals as well as electric power were grouped together
and formed a joint stock company. In 1993, the new YPF listed in the stock exchanges in Buenos
Aires and New York, the largest publicly-traded oil company in Latin America.
By 1998, YPF accounted for 51 per cent of Argentina’s total oil production. Its three refineries
accounted for 51 per cent of Argentina’s refining capacity. Its 2,500 service stations across Argentina
represented a 37 per cent market share. Under the strong leadership of its CEO, Roberto Monti, YPF
had the ambition to build itself from a strong regional player, mainly based within Argentina, into a
powerful international company. YPF pursued a series of international projects. In 1995, YPF
purchased the United States independent exploration and production company Maxus Energy. It
worked together with Petrobrás for a number of exploration blocks in Brazil and to develop gas
business in southern Brazil. It also had a joint venture with Petrobrás to develop service station chains
in Brazil. In addition, YPF had exploration interests in Bolivia, Ecuador and Venezuela. Through its
affiliated companies, YPF also held stake in upstream operations in Russia and in downstream
activities in Chile and Peru.
Repsol was the Spanish national champion in oil and petrochemicals. After its privatization in
late 1990s, it followed a strategy of international expansion, mainly in Latin America. With 64 per
cent of its assets in exploration and development, YPF is a strong upstream player and became an ideal
target for Repsol’s international expansion strategy, with a focus on Latin America. In January 1999,
Repsol acquired a 14.99 per cent stake in YPF from the Argentine government, which still owned
20 per cent of YPF. In April 1999, Repsol launched a $13 billion all-cash bid for all the YPF’s shares
that it did not already own. Repsol’s hostile bid was opposed by the board of YPF. However, the deal
was supported by the Argentine government, which had 5.3 per cent of the shares in the company,
three other provincial governments with smaller stakes and other private investors. Within only one
week, the board of YPF conceded defeat. Chairman Roberto Monti commented, ‘We have always
maintained a business philosophy based on value creation, and it is the board’s view, which I back,
that Repsol’s bid offers the best alternative for our shareholders in current market conditions’ (quoted
in the FT, 12 May 1999).
The new company Repsol YPF combined YPF’s powerful upstream businesses with Repsol’s
strong downstream capabilities. It became the world’s eighth largest publicly-traded oil company in
terms of oil and gas reserves. Repsol YPF’s reserves are close in size to those of ENI. Its assets are
20
spread across the world in Europe, North Africa, Latin America and the Unites States. It accounts for
59 per cent of refining capacity and 47 per cent of the retail market in Spain and 56 per cent of the
refining capacity and 49 per cent of the retail market in Argentina. It is uncertain if even the new
Repsol YPF will remain as an independent player in the new world of super-majors. Rumours have
circulated about a possible ‘southern European champion’, which merged Repsol YPF with ENI, and a
possible merger with Total Fina Elf.
4. Conclusion: Competitive obstacles for firms based in developing countries
The mergers in the world’s oil and petrochemical industry during the global business revolution
have created a group of new super-giants that stand in a position of greatly enhanced competitive
advantage compared to potential competitors from developing countries. These new super-giants
greatly increased their size and their assets base. They have constructed a portfolio of high quality oil
and gas reserves distributed around the world. They are able to invest large amounts in R&D to sustain
and extend their technical lead over other companies. They have the resources to invest in large-scale
information technology systems that can better integrate their extended internal value chain, stretching
from exploration to the petrol station. They have developed marketing systems with immensely
powerful global brands. They have built massive multi-billion dollar central procurement capabilities
with large consequent cost-savings. MSDW estimates that the super-majors, namely Exxon Mobil,
Shell and BP, have a capability to sustain their competitive edge in the industry for at least fifteen
years (MSDW, 1998).
On the global level playing field, even efficient, ambitious and well-run firms in this sector may
be unable to survive as independent entities in the face of the intense competition from the super-
majors. Not one integrated oil and petrochemical firm based in a developing country has been able to
challenge the global giants in this sector. By far the most successful example was YPF. However, as
that case vividly illustrated, privatization, liberalization and high quality management, are far from a
guarantee of independent survival. Integrated oil and petrochemical firms based in developing
countries face formidable obstacles in the ferocious competition with the global leaders. Indeed, in the
pursuit of shareholder value, it may be highly rational for the most successful firms in developing
countries to be acquired by the world leaders in the industry.
B. China’s response
In the same period that the merger frenzy swept through the global major oil companies,
China’s oil and petrochemical industry underwent massive restructuring. After an intense debate on
how to reform the oil and petrochemical industry, the Chinese government created two large
integrated oil companies through administrative measures.
21
1. The 1998 reorganization of China’s oil industry
In 1998, the State Council undertook a comprehensive restructuring program for China’s oil and
gas industry with the goal of creating internationally competitive large oil and petrochemical
companies. Three objectives were achieved in this asset reorganization. First, through a huge assets
swap, the new CNPC and Sinopec became two vertically integrated oil and petrochemical companies
with assets across the whole value chain from upstream to downstream. The new CNPC, which had
formerly been mainly concerned with the upstream side of the business, now accounted for 66 per cent
of both China’s oil and gas output, and 42 per cent of its refining capacity. The new Sinopec, which
had formerly focused on the downstream part of the business, now accounted for 23 per cent of oil
output, 11 per cent of gas output and 54 per cent of refining capacity. With sales revenue of $25–$30
billion each, both of the two groups would have been listed in the world’s top 500 companies. Second,
the administrative functions of CNPC and Sinopec were separated from their business management
functions. As part of the major governmental restructuring programme in the same year, the State
Petroleum and Chemical Industry Bureau under the State Economic and Trade Commission was
formed to take over the administration functions from CNPC and Sinopec. Third, starting from June
1998, China’s crude oil price was pegged to the Singapore FOB prices, which was a significant step in
the integration of China with the global oil industry. 8
2. The year 2000 flotation of PetroChina and Sinopec
Closely following the 1998 asset reorganization, CNPC and Sinopec each restructured the
company in preparation for international flotation. The businesses and structure of the two companies
were fundamentally changed. In each of the companies, core businesses covering oil and gas
exploration and development, storage and transportation, refining and marketing, petrochemicals were
separated from non-core businesses including enterprises that ran engineering, technical and
infrastructure services to core businesses as well as social functions such as schools and hospitals. On
5 November 1999, CNPC grouped together its core businesses and created PetroChina as a joint stock
company with limited liability. On 25 February 2000, China Petroleum and Chemical Corporation,
known as Sinopec, was established on the core businesses from the old Sinopec, now known as
Sinopec Group.
In April 2000, PetroChina listed in New York and Hong Kong (China) Stock Exchange. The
initial public offering (IPO) accounted for 10 per cent of the company’s total shares, and raised
$2.89 billion. Among the shares issued, 32.1 per cent were bought by strategic and corporate investors
8 Before that, the crude oil price in China was set by the government, which resulted in constant disputesbetween CNPC and Sinopec with each lobbying intensely for prices favourable to their own businesses. In linewith the restructuring, the State Development and Planning Commission (SDPC) publishes monthly abenchmark crude oil price based on the average Singapore FOB prices. CNPC and Sinopec negotiate a premiumrelative to the benchmark price.
22
including BP Amoco, Sing Hung Kai, Hong Kong Cheung Kong Enterprises, and Hutchison
Whampoa. After this global listing, CNPC held a 90 per cent of PetroChina’s total equity. Six months
later, in October 2000, Sinopec listed in the stock exchanges in New York, Hong Kong (China) and
London. The IPO accounted for 21.21 per cent of the company’s total shares, and raised $3.73 billion.
After the global flotation, 56.06 per cent of Sinopec’s equity was controlled by its parent company
Sinopec Group, 22.73 per cent by the State Development Bank and three asset management
companies, Cinda, Orient and Huarong, and 21.21 per cent by overseas investors including the three
largest global oil companies Exxon Mobil, Shell and BP. Exxon Mobil, Shell and BP promised to
purchase 20 per cent, 14 per cent and 13.5 per cent repectively of Sinopec’s IPO, involving share
purchases of up to $1 billion, $430 million and $400 million respectively. ABB Lummus also agreed
to purchase $100 million worth of shares. Other overseas corporate investors include Henderson
Investment Ltd., Hong Kong (China) and China Gas Company, Cheung Kong Enterprises and
Hutchison Whampoa. Both Cheung Kong and Hutchison Whampoa are part of the group of companies
owned by Li Ka-shing, whose business empire is based in Hong Kong (China).
3. Business capabilities
a) Reserves and output
Within China’s total estimated oil reserves in the year 2000 of around 24 billion barrels
(table 2), PetroChina owns 11.03 billion barrels, equivalent to those of Exxon Mobil and exceeding
those of Shell and BP (table 4). PetroChina’s natural gas reserves are 58 per cent those of Exxon
Mobil and around 10,000 billion cubic feet more than that owned by TotalFinaElf and Chevron
Texaco (table 4). In terms of oil output, PetroChina is already close to the level of the world’s leading
companies, with an oil output of around 2.1 million barrels per day, compared with 1.93 million at BP,
2.27 million at Shell and 2.55 million at Exxon Mobil. Sinopec is similar to Repsol YPF in terms of oil
reserves and oil production but on a much smaller scale in natural gas reserves and production.
However, in terms of natural gas output, even the combined production volume of PetroChina and
Sinopec lags considerably behind the global giants (table 4).
There are, however, crucial differences between the reserves and output of the two leading
Chinese oil companies and those of the global giants. First, the global distribution is strikingly
different. PetroChina and Sinopec produce entirely within China. CNPC has international operations
in Canada, Venezuela, Kazakhstan, Sudan, Thailand, Indonesia and Malaysia. In 2000, approximately
5.5 million tons of oil were obtained in 2000 from overseas operations, equivalent to just 7.8 per cent
of China’s total crude oil imports in the same year. CNPC itself retains ownership of these
international projects. PetroChina, the floated company, does not have any operations in foreign
countries. Sinopec has almost no overseas reserves and production. In the sharpest contrast, BP and
23
Exxon Mobil have production and exploration activities in 27 and 30 countries respectively. Second,
the quality of the portfolio of oil and gas assets is very different. China’s main onshore oil reserves are
declining seriously. Fifty per cent of PetroChina’s crude oil reserves are from the Daqing oil field, and
one-third of the natural gas reserves are in the Tarim Basin. However, 89 per cent of PetroChina’s
proved crude oil reserves have already been developed. Daqing is in the secondary recovery stage and
polymer flooding has been applied to about 14 per cent of its production. The Tarim Basin is in the
remote western part of the country. It will require advanced technology and will involve high
transportation costs to ship the gas to the main consuming areas in the eastern part of the country,
which raises serious doubts about the commercial viability of the project.9 Third, the global giants
have attempted to construct a global portfolio of oil and gas assets that can make a profit at as low as
$10 per barrel of oil. Less than five of PetroChina’s oil fields can make a profit when the oil price is at
$10–$15 per barrel due to costs induced by difficult nature of the reserves, technological problems and
cumbersome management structure.
b) Refining
PetroChina and Sinopec between them have a total of 49 refineries, among which 21 haveannual refining capacities greater than five million tonnes. None of PetroChina’s refineries and onlyfour of Sinopec’s refineries have capacities greater than 10 million tons. The utilization rate of
refineries owned by PetroChina and Sinopec rose from 61 per cent in 1998, the lowest in the 1990s, to80 per cent in 2000. This is due to the increasing amount of crude oil available for the two companies’refineries and, to some extent, to the government’s campaign to close down small refineries with
annual capacity less than 1 million tonnes and refineries out of the state crude oil allocation plan.Since 1999, the State Economic and Trade Commission (SETC) has ordered the closure of111 refineries over the country (SETC, 1999, 2000). However, the small refineries usually have the
support from local government for tax revenue and employment. Closing them down has proved acomplex task. Despite the government’s campaign, an investigation by SETC shows that smallrefineries in Sha’anxi, Shangdong and Henan that should have been closed are still active (Zhang
Zhigang, 2001).
China’s total refining capacity was 280 million tonnes at the end of 2000, exceeding the
country’s total oil consumption by 53 million tons in the same year. However, the refining sectorneeds revamping, upgrading and expanding. First, most of China’s refining facilities are equipped toprocess low-sulphur oil and unable to process high-sulphur crude oil from the Middle East except for a
few refineries on the east coast such as Maoming and Zhenhai. With more than half of the oil importsfrom the Middle East, refineries need to add capabilities to use sour crude oil. The effort of PetroChinaand Sinopec to increase the capabilities to process sour crude oil requires advanced technology and
heavy. Second, more stringent environmental regulations for refined products calls for high-conversion refineries. Third, China’s accession to the WTO will reduce the tariffs on refined products 9 The project would involve the construction of a pipeline 4,200 kilometres long and an estimated totalinvestment of RMB120 billion (approximately $14.5 billion).
24
from the current 6–12 per cent to a uniform rate of 6 per cent. Few of PetroChina’s refineries cansurvive in near-open competition with imported refined products. For Sinopec, the tariff reduction for
refined products will reduce its annual revenue by RMB3 billion (approximately US$360 million).
c) Marketing petroleum products
After 1999, both PetroChina and Sinopec aggressively expanded their network of servicestations all over China. By 2000, PetroChina and Sinopec were reported to have over 11,000 and owns
20,000 service stations respectively. Each has almost doubled the number that it had in 1999. This hasbeen strongly supported by the government, which granted the two companies exclusive licenses tooperate new service stations in China. However, the two companies have engaged in a ‘blind
competitive dash’ to acquire service stations, which led to ‘less than stringent evaluations of, andinflated price paid for, the service stations’ (Zhang Zhigang, Vice Minister of SETC, 2001). Aroundone quarter of each of the two companies’ service stations are franchised retail outlets bearing the
companies’ brands, ‘PetroChina’ and ‘Sinopec’ respectively, are still run as separate entities. Neitherrefined products supplies or the price of refined products are centrally controlled, nor are accountscentrally consolidated, even for the network of service stations owned and operated by the two
companies themselves. Between them, PetroChina and Sinopec have over 2,000 wholesale entities.These still have no effective co-ordination of supply, price or customers. Many of the storage facilitiesare obsolete. PetroChina and Sinopec still have a long way to go before they develop the logistics
expertise of the global giants or posses a comparable brand based on the safe and low-cost operationof a huge logistics system. This is a crucial part of the development of the brand for globallycompetitive oil and petrochemical company.
d) Petrochemicals
Ethylene crackers
By the end of the year 2000, China had a total ethylene capacity of 4.3 million tons, ranking the
eighth largest in the world and the third in Asia after Japan and the Republic of Korea (Oil and Gas
Journal, 23 April 2001). Of the total of 18 ethylene crackers in China, only seven have an annualcapacity above 400,000 tonnes (four owned by Sinopec and one by PetroChina) and the other eleven
have a capacity of less than 200,000 tonnes. The annual capacity of the largest cracker is 480,000tonnes, compared to the world’s largest at 2.8 million tonnes. Compared with the integrated large sitesof the global majors, the average capacity of each petrochemical complex is tiny (table 6). Instead of
having a small number of giant, low-cost integrated sites situated in a few concentrated areas, as theglobal giants do, these 18 ethylene crackers are located at 16 sites in 15 cities.
25
Table 6Top 10 ethylene producers* vs PetroChina and Sinopec Corp. **
Capacity(Million tons per year)
Ranking Company
No. of sites Entire
complexesCompanyinterests
Company interest(Per cent)
1 Dow Chemical Co. 16 12.467 10.076 80.82 Exxon Mobil Chemical Co. 14 10.609 7.071 66.73 Equistar Chemicals 7 5.265 5.265 1004 Shell Chemicals Ltd. 6 6.188 4.539 73.45 Chevron Phillips Chemical Co. 3 3.674 3.674 1006 Saudi Basic Industries Corp. 4 5.65 3.95 69.97 BP 5 4.151 3.036 73.18 Nova Chemicals Corp. 2 3.54 2.968 83.89 Atofina 7 3.725 2.378 63.810 Enichem SPA 7 3.005 2.196 73.1- Sinopec Corp. 5 1.99 1.99 100- PetroChina 2 ‡ 0.8 0.8 62 §
Sources: Oil and Gas Journal , 23 April 2001. Authors’ own research.Notes: * As of 1 April 2001. ** End of 2000. ‡ Sites of annual capacity over 350,000 tonnes.
§ Percentage of total capacity of company.
Product mix
A high proportion of China’s petrochemical and
refined products are low value-added products. High-
value added petrochemical production only accounts for
30 per cent of total petrochemical production. Only 73 per
cent of the diesel produced can be classified as the ‘first
class’ and 70 per cent of the lubricants are of middle or
high premium. By 1997, China could only produce 128
types of synthetic resins, compared to over 10,000 types
produced by Japan (Chen Yongkai, 2001). The total
petrochemical output and low value-added products has
not kept up with the rapid growth of China’s economy, which has led to large imports of
petrochemicals. By 2000, imports of refined products and major petrochemicals accounted for up-to-
half of the Chinese market (table 7) .. With further reductions in import tariffs after China’s accession
to WTO, even these low value-added petrochemical products will face intense competition not only
from global majors but also from low-cost producers in the Middle East and the South-East Asia.
Technology
Both PetroChina and Sinopec have made many important technical advances. However, both
companies are still far behind the global giants in their development of world-leading technologies.
Whereas the world’s leading oil and petrochemical companies each produce more than one thousand
Table 7Market share of imported oil products
and petrochemicals in China, 2000(Per cent)
Imported product Market share
Refined products 20Lubricants 25LPG 50Synthetic resins 48Synthetic fibres 30Synthetic rubbers 44
Source: Sinopec.
26
patents annually, Sinopec produces only around 300. In the year 2000, PetroChina and Sinopec spent
$212 million and $200 million respectively on research and development, about one-fifth to two-fifths
of that spent by the ‘big three’ (table 5). The R&D spending/revenue ratio of Sinopec and PetroChina
(0.5 and 0.7 per cent respectively) is no less than that of Shell and somewhat higher than that of Exxon
Mobil and BP (0.4-0.5 per cent). However, the global majors are able to spend more on research and
technological development in absolute terms due to the sheer size of their sales revenue. Moreover,
they are able to purchase greater amounts of the R&D ‘embedded’ in the products of specialist
suppliers to the oil and petrochemical industry. 10
The technological capabilities of PetroChina and Sinopec both upstream and downstream are
relatively backward. In exploration and production, their oilfield development equipment is at the
world level of the late 1980s and in exploration equipment it is equivalent to the world level in the
early 1990s. Oil extracting machinery and oil and gas treatment equipment are either imported
complete or assembled in China. Key electronic instruments and software for exploration and
production are imported. China’s own industrial experts have pointed out that China’s capability of
technological innovation in upstream oil and gas industry is still at the level of a ‘third world’ country,
which will be a great constraint on the industry’s competitiveness and efficiency (China Petroleum,
January 1999). The technological backwardness is reflected in the high level of energy consumption in
petrochemical production. In ethylene production, PetroChina consumed an average of 872 kilograms
of standard oil per ton in 2000 compared to the world average level of 500–690 kilograms. In addition,
the percentage loss of ethylene is high. The average ethylene percentage loss in PetroChina’s
production was 1.3 per cent compared with the world average of 1.0 per cent. The high energy
consumption level and high ethylene percentage loss contribute to the high cost of ethylene
production. In China energy consumption accounts for 76 per cent of the total cost of production
compared to the world average of 63 per cent. Moreover, only 55 per cent of the chemicals from the
cracking process in China are further processed and utilized, which is significantly below the level
achieved by the world’s leading firms in the sector (Chen Huai, 1998: 29).
e) Financial performance
Revenue
Their sales revenue places PetroChina and Sinopec alongside the leading second tier of global
oil and petrochemical companies, but far short of the industry leaders, Exxon Mobil, Shell and BP
(table 5).
10 For example, Schlumberger spends more on R&D than Shell (£324 million compared with £313 million),while Haliburton spends more than ENI (£160 million compared with £146 million) (DTI, 2000: 54).
27
Profit
In the year 2000 net profits at PetroChina and Sinopec dramatically improved to $6.67 billion
and $2.30 billion, compared with $0.33 billion and $0.56 billion respectively in 1999. The gap in net
profits with the global giants has narrowed considerably from being only a small fraction in 1999 to
almost one-third and one-half that of the ‘big three’. However, Ma Fucai, Chairman of PetroChina
cautioned that 80 per cent of the company’s increased operating profit in 2000 resulted from the rise in
crude and refined oil prices (FT, 23 April 2001). Most of Sinopec's revenue increase came from the
marketing and distribution of its oil products 'at a time of unusually robust prices' (FT, 17 April 2001).
The year 2000 may not provide a good guide to the two companies net profits in the medium-term.
Profits per worker at PetroChina and Sinopec are minuscule compared to those at the world’s
leading companies in the sector. PetroChina and Sinopec each has a workforce four to five times as
big as that of the top three global oil and petrochemicals giants (table 5). Downsizing these huge
institutions is a complicated and difficult task
Market capitalization
PetroChina and Sinopec have market capitalizations that are only a small fraction of that at the
leading global companies. If one assumed that the whole company was floated, then at the current
share price, the market capitalization of PetroChina and Sinopec would be $35 billion and $14 billion
respectively, compared with $286 billion for Exxon Mobil, $206 billion for Royal Dutch/Shell and
$178 billion for BP (table 5). Analysts estimate that PetroChina’s average annual revenue growth rate
in the next five years will be 4.9 per cent, only one-half of that of Exxon Mobil and only one-third of
that of the whole oil industry. Industry experts have voiced serious concerns about PetroChina’s level
of operational efficiency and about the high level of uncertainty in its performance after China’s
accession to the WTO. PetroChina’s P/E/G (price/equity/growth rate) ratio is predicted to be less than
1.0, compared to 1.7 of Exxon Mobil. The shortfall is attributed to the element of ‘institutional risk’
involved in China (Finance, April 2001).
4. Organizational structure
The organizational structure of PetroChina and Sinopec is superficially similar to that of an
international integrated oil company. They have established a board of directors, a senior management
team and core businesses segments from upstream to downstream. The superficial similarity conceals
important differences.
28
The global giants have a strong ‘one company’ corporate identity and culture. Within
PetroChina and Sinopec there exist powerful entities that over the years developed strong independentcorporate identities and ambitions. They struggled for autonomy in business management and aspired
to become independent competitive companies. Daqing is China’s largest oil field. It is now underPetroChina. Over a history of forty years, Daqing developed a strong corporate identity. Its employees
took great pride in being ‘Daqing people’ (Daqing ren). Daqing was in many ways like a smallcountry within China. Daqing had the corporate ambition to build itself into a leading oil company
able to compete on the world stage. Daqing strongly believed that it should be an independently-floated firm. In the 1990s, four companies under Sinopec, including Zhenhai, Shanghai
Petrochemicals (SPC), Yizheng and Yanhua listed separately in international stock markets. Zhenhaiand SPC each had a history of more than thirty years and developed strong, distinctive corporate
identities. Each devised plans and strategies for development through mergers and acquisitions. BothPetroChina and Sinopec took strong measures during the restructuring to integrate these powerful
subordinate companies by centralizing control over planning, personnel, investment and finance.
Nevertheless, establishing a unified corporate identity and culture remains a formidable challenge.
The relationship between the two listed companies and their parent companies remainsambiguous. As discussed above, CNPC controls 90 per cent of PetroChina and Sinopec Group
controls 56 per cent of Sinopec. A principle part of the annual income of CNPC and Sinopec Group isfrom the dividend payment of the two listed companies. In 2000, CNPC received an approximate
$3.1 billion dividend payment from PetroChina,11 accounting for 53 per cent of its net profit. CNPChas retained the non-core businesses as well as social functions employing more than 800,000 people,
a large fraction of whose activities are loss-making. The non-core businesses of Sinopec Groupemploy more than 600,000 people but none of the businesses in which they are employed made a
profit in 1999. To what extent PetroChina and Sinopec have autonomy in decision-making withrespect to business strategy, dividend payments and appointment of senior management remain
unclear. Of the thirteen directors on the board of PetroChina (including three independent non-executive directors), five concurrently hold top positions with CNPC. Of the ten directors of the board
of Sinopec (including three independent non-executive directors and one employee representative
director), two also have top positions with Sinopec Group. Ma Fucai, Chairman of PetroChina, and LiYizhong, Chairman of Sinopec, are each concurrently the president of the respective parent
companies. Such a structure has caused concern to be expressed about the respective companies’commitment to creating shareholder value and protecting the rights of minority shareholders.12
11 Based on PetroChina’s dividend payment of $0.02 per share and the weighted average number of 171,630million shares issued and outstanding in 2000.12 The issues of creating shareholder value and protecting minority shareholders are discussed in ChinaPetroleum, April 2000, p. 18-29 and an article ‘Oil industry: choices after flotation’ in Finance (Caijing),November 2000. The paper comments: ‘For the listed state-owned companies, this kind of structure involvesrisks that cannot be anticipated. It will affect the profits of a company and distort the behaviour of a company,which in fact jeopardizes the interest of shareholders. As a common problem, it will eventually damage thecredibility of the Chinese concept shares (zhong guo gai nian gu).
29
5. The competitive landscape
The global giants are deeply interested to develop their business in China from upstream to
downstream. In upstream exploration and development, there were 167 onshore blocks open to foreign
companies for exploration and development. By 1999, total foreign investment reached $1.1 billion in
onshore upstream and $6.45 billion in offshore upstream (SETC, 2001). There are altogether 70 oil
companies from 18 countries participating in upstream activities (SETC, 2001), including the global
giants Exxon Mobil, Shell, BP Amoco and other major players such as Texaco, and Phillips. In
petrochemicals, six global majors will set up six joint ventures in petrochemical complexes by 2005
(table 8) .. These projects each involve investment from $2.5 billion to $4.5 billion and all are located in
the coastal regions, which have the highest average income level in China. Demand for ethylene was
around 7.5 million tons in 2000 but total ethylene capacity in China was 4.3 million tons in the same
year. It is projected that demand for ethylene will reach 10 million tons in 2005 (Oil and Gas Journal,
10 January 2000). If we assume all the joint venture projects start production in 2005, they would
account for 42 per cent of total projected ethylene demand in China. In addition, the joint ventures
(JVs) will have major associated production capabilities in related petrochemical products, in which
the global giants are in most areas technologically far ahead of their Chinese counterparts. From the
perspective of the foreign partner in the JV, they each form a part of the respective global business
system, typically a single business unit. In this sense, they represent an important growth of the
multinational giants within the indigenous Chinese firm.
Table 8Proposed major Sino-foreign petrochemical joint ventures
Major partners
Ethylene capacity(Thousand tons
per year)
Investment($ billion) Location
Date ofcompletion
Sinopec SPC/BP* 900 2.7 Shanghai 2005Sinopec Yangzi/BASF* 650 2.7 Nanjing 2005Sinopec Fujian/Exxon Mobil/Saudi Aramco 600 2.5 Fujian 2005Sinopec Tianjin/Dow Chemical 600 - Tianjin -PetroChina Lanzhou/Phillips 600 - Lanzhou -CNOOC/Royal Dutch/Shell* 800 4.5 Guangdong 2005
Sources: Chemical Week , 13 October 1999, Oil and Gas Journal, 23 April 2001. Authors’ research.Note: * Under construction.
The global majors have become strategic investors in PetroChina and Sinopec. Equity
involvement by the global super-majors was crucial to their successful listing. Before its international
listing, Sinopec signed an agreement with each of its strategic investors to develop businesses both
upstream and downstream in China. In the upstream sector, Royal Dutch/Shell will partner Sinopec to
develop natural gas resources in Inner Mongolia, the Ordos and Tarim Basins. In refining and
marketing, Exxon Mobil will establish a joint venture with Sinopec for retail marketing in Guangdong
Province, which will involve setting up 500 service stations within three years. Exxon Mobil will
study the feasibility of doubling the current refining capacity of 150 thousand barrels per day at
30
Guangzhou Petrochemicals Company. Royal Dutch/Shell will have a joint venture with Sinopec
involving 500 service stations in Jiangsu Province. BP will set up a joint venture with Sinopec to
acquire, renovate or build 500 service stations in Zhejiang Province. These service stations will have
the logos of both BP and Sinopec and will sell petrol supplied by Sinopec and other refined products
supplied by both companies. For the three companies, this was ‘but the beginning of their attempts to
capture a share of the world’s largest retail market’ (Petroleum Economist, October 2000). In April
2001, PetroChina established a retail marketing joint venture with its strategic investor, BP, in
Guangdong Province, with PetroChina holding a 51 per cent equity share and BP holding the
remainder. The joint venture will consolidate the 366 service stations owned by PetroChina and the
43 service stations owned by BP in Guangdong. A further 100 service stations will be acquired in
2001. The strategy of the global giants to expand their downstream, high-margin business, each in a
different part of the China’s high-income coastal markets, is clear.
6. Conclusion
In the evolutionary reform of large state-owned enterprises in China’s ‘pillar industries’, the
creation and international listing of PetroChina and Sinopec marked a crucial step in the attempt to
create modern, internationally competitive firms. The process of restructuring and flotation was
achieved through administrative measures within just one year.13 This was an immense achievement.
Despite this achievement, substantial question marks remain. Across the whole value chain
from upstream to downstream, PetroChina and Sinopec are at disadvantage in terms of the quantity of
oil and gas reserves compared with the national oil companies, and in terms of global distribution and
quality of reserves compared with the super-majors. They are at disadvantage in technology and
financial strength compared with the global majors. There remains a deep internal battle to establish a
cohesive corporate culture to integrate their powerful subordinate companies and establish a truly
unified company. The relationship between the floated company and the parent remains unresolved.
Across the value chain, PetroChina and Sinopec have been actively forming ‘strategic alliances’ and
establishing joint ventures with global oil and petrochemical companies. How stable will these
partnerships be, especially after China’s accession to the WTO? Will PetroChina and Sinopec
eventually emerge as the ‘firm’ that is to compete globally? The institutional structure of PetroChina
and Sinopec remains in evolution.
The full extent of the challenges facing the Chinese oil and petrochemical industry on the verge
of China’s entry to the WTO was bluntly spelt out at a meeting convened by the State Planning
Commission at the end of September 2001 (Xinhuanet, 2001). The reports to the meeting stressed that
13 For a detailed description and analysis of the institutional evolution of CNPC and Sinopec prior to theirinternational listing in 2000, see Nolan (2001), Chapter 7.
31
this is a ‘pillar industry’ for China’s national economy. They emphasized that acceleration of the
trend of globalization and consolidation means that China’s petrochemical industry ‘faces critical
challenges from many aspects’. Experts at the meeting emphasized that China’s petrochemical
industry was a late-comer to the sector, and that it still had ‘low technological and management
standards’. The final verdict at the meeting on the state of the industry was blunt:
The overall technological level of the petrochemical industry of our country lags behindthe advanced countries about 10-15 years and has a fairly large gap compared with theworld’s advanced level. The energy and material consumption level of the majority of therefineries and ethylene crackers is higher than the average level in Asia. The capabilitiesof technological innovation are weak. Patented self-developed technologies are few.Development and introduction of high and new technologies and products is weak.Engineering capabilities are weak and lacking in potential for further development.
The institutional experiment in China’s oil and petrochemical sector is being closely watched by
all concerned to understand the future course of China’s industrial strategy regarding large firms and
their relationship with the global giants. This sector is held up as a beacon for other sectors to study in
restructuring to face the challenge of globalization and consolidation. PetroChina and Sinopec have
both successfully restructured and floated on international markets. However, everyone within the
Chinese industry is fully aware of the deep challenges posed by globalization and China’s deepening
integration with the global economy and business system. It remains an open question whether
PetroChina and Sinopec will succeed where YPF failed.
III. AEROSPACE
A. Global trends
1. Consolidation
The dramatic change in the demand side of the world’s aerospace industry in the 1990s has been
a powerful force to drive forward consolidation. After the Cold War, both the United States and
Europe drastically reduced their defence spending. In the United States, total defence expenditure fell
from a peak of $390 billion in 1986 to $253 billion in 1999, and in Europe (NATO) the total budget
fell from a peak of $191 billion in 1990 to $135 billion in 1999 (IISS, 1999, p. 37). Procurement
techniques rapidly moved towards those of the civil aerospace world as governments push contractors
to lower costs. Alongside the decline in defence procurement, European and United States military
aircraft manufacturers have been able to sell to markets that were inaccessible during the Cold War.
The fastest growing market for Western arms sales was the Far East, to which arms deliveries
increased by one-third in real terms from 1987 to 1998 (IISS, 1999, pp. 281–283). The countries
32
around China substantially increased their arms purchases from $9.1 billion in 1987 to $12.8 billion in
1998, compared with China’s purchases of $0.9 billion and $0.5 billion in the same years (table 9).
Table 9International arms deliveries within East Asia, 1987 and 1998
(Million of constant 1997 US dollars)
Total China Japan
TaiwanProvinceof China
Republicof Korea Thailand Malaysia Singapore Indonesia
1987 9,926 877 1,512 1,408 1,012 95 418 3511998 13,236 469 2,086 6,258 1,366
581313 334 887 365
Source: IISS, 1999, p. 283.
Until the events of 11 September 2001, the civilian aircraft market had been predicted to grow
substantially in the years ahead. Airbus had forecast that over the next two decades from 1997 to 2017,
the world-wide airline fleet would increase from the 1998 level of 9,700 to 17,900. Airlines were
predicted to buy 13,000–14,000 new and replacement aircraft over that period with a total value of
around $1,200 billion. The predicted market for aero-engines (including original sales and sales of
spare parts) was estimated to be around $500 billion in the next two decades (FT, 3 September 1998).
These forecasts now need to be radically revised. However, even if they are substantially reduced, the
market is still very large. Moreover, it is likely that a decline in commercial aircraft purchase will, to
some extent, be partially compensated by increased purchase of military aircraft and other military
equipment.
The nature of the market for civil aircraft has altered significantly since the 1980s. The
privatization as well as international alliances among the world’s airlines placed great pressure on
aircraft suppliers to reduce cost. One major effect of the events of 11 September 2001 may well be to
force national governments to end restrictions on foreign ownership of airlines. If so, the current
parlous financial state of most of the world’s airlines is likely to lead to large-scale global
consolidation in the world airline industry, mimicking that among the equipment makers.
a) United States of America
Initiated by the Pentagon, over $62 billion-worth of mergers and acquisitions occurred between
1994 and 1998 in the United States (table 10). The most significant event in this process was the
merger between Boeing and McDonnell-Douglas. The resulting extraordinarily high level of industrial
concentration received ‘strong support from the United States administration (FT, 23 September
1997). After the Boeing/McDonnell Douglas merger, Boeing and Lockheed Martin between them
accounted for close to one-half of United States defence department contracts, and almost completely
dominated military aircraft sales to the United States government (FT, 3 September 1998). The merger
also resulted in Boeing being the only producer of jet airliners in the United States, the world’s largest
33
airline market by far. Moreover, unlike Lockheed Martin, Boeing was now a colossus that spanned
both the military and civilian spheres of aerospace production. Boeing accounted for no less than
84 per cent of the world’s total commercial aircraft in service (FT, 23 September 1997). On
26 October 2001, the Pentagon made a ‘winner-take-all’ decision and awarded the $200 billion Joint
Strike Fighter (JSF) programme, the biggest ever defence procurement, to Lockheed Martin. The
procurement decision ‘catapults Lockheed into an unassailable position as the world’s top builder of
fighter aircraft’ (FT, 29 October 2001).
Table 10Principal mergers and acquisitions in the United States defence industry, 1994-1998
(Deals of over $500 million only)
Acquirer Acquiree Value ($ million) Date
Loral IBM Federal Systems 1,575 March 1994Northrop Grumman 2,100 April 1994Lockheed* Martin Marietta* >9,000 March 1995Rolls-Royce Allison Gas Turbine 525 March 1995Loral Unisys Defense Operation 862 May 1995E-Systems* Raytheon* 2,300 June 1995Northrop Grumman Westinghouse Electronic System 3,600 March 1996Lockheed Martin Loral 9,500 April 1996Boeing Rockwell Aerospace and Defence 3,025 Dec. 1996Boeing* McDonnell Douglas* 13,300 1997Raytheon Texas Instruments Defence Business 2,950 1997GM Hughes Defence Business* Raytheon* 9,500 1997GEC Tracor 1,400 1998
Source: FT, 3 September 1998.Note: * For mergers, acquiring and acquired company are shown in alphabetical order.
b) Europe
By the late-1990s, the defence industry had become much more concentrated in the United
States than in Europe. The level of government procurement in the United States is far above that in
Europe. In 1999, the total defence budget of the United States was more than twice the size of that of
the whole of NATO Europe (IISS, 1999, p. 37) and is certain to rise substantially in the wake of the
events of 11 September 2001. Also a large fraction of Europe’s procurement spending is still
conducted by individual countries.
The European military aerospace industry realized that it must unify or perish before the United
States challenge. In 1998, the ‘national champions’ of the United Kingdom, France and Germany,
namely BAe, Aerospatiale and Dasa, declared their intention to unify into a single company, the
European Aerospace and Defence Company (EADC), with a single management structure and quoted
on the stock market. It was intended to incorporate all sectors of the European aerospace industry from
military aircraft, guided weapons, space and defence electronics to large civil aircraft (including a
restructured Airbus). However, the merger of BAe with GEC-Marconi in January 1999 posed a serious
setback to the cause of European aerospace integration. Renamed BAe Systems, the new company
34
became the world’s second largest in terms of military revenues (FT, 20 January 1999). Despite the
serious setback to their plans, in October 1999, Dasa and Aerospatiale-Matra merged into a new giant
company called the European Aircraft, Defence and Space Company (‘EADS’, as opposed to
‘EADC’). However, EADS now has serious problems with its management structure leadership (FT,
16 November 2001). Moreover, BAe Systems, EADS’s partner in Airbus, Eurofighter, now is a full
partner with Lockheed Martin in the JSF programme. France is committed to its own Rafale fighter
through Dassault and compete for export orders with EADS’s Eurofighter. Italy has decided to quit the
European programme to build a large military transport aircraft A400M.
In civilian aircraft production, the competition between Airbus and Boeing became more
ferocious more than ever during the 1990s. Twice Airbus overtook Boeing in terms of new orders in
1994 and 1999. Moreover, in 2000, Airbus announced that it intended to proceed with plans to build a
super-large aircraft, the A380 to directly challenge Boeing in the most lucrative segment of the
market. The A380 is intended to carry more than 500 passengers. From 1996, Airbus began the
prolonged attempt to transform itself from a ‘Groupement d’intérêt économique’ into a limited
company floated on the stock market. EADS now holds 80 per cent of Airbus, compared with just
20 per cent for BAe Systems. This made it easier to turn Airbus into a single company. However, the
events of 11 September will put severe pressure on Airbus, especially given the large outlays already
undertaken on the A380, for which the market now looks much less optimistic than before
11 September. In sum, the final shape of the European aerospace industry is far from certain.
c) Transatlantic option
The United States has the world’s largest arms market by far. Leading European aerospace
companies are not only seeking to expand their roles as sub-contractors and risk-sharing partners for
the United States giants, they are also considering merging with leading companies across the Atlantic.
The possibilities for a ‘transatlantic solution’ seemed to be growing stronger in 1999. In an effort to
prevent the emergence of a ‘Fortress Europe’ in the arms industry, the United States government
moving towards relaxing its controls on foreign investment in the industry and greater technology
sharing with European-based defence firms. Jacques Gansler (Head of Procurement, Pentagon)
announced that the Pentagon was willing to allow European or Asian companies to ‘buy major United
States defence companies under certain conditions’, one of which was that other countries must
reciprocate, allowing similar access to their own markets (IHT, 8 July 1999). He believed that such
mergers would create ‘a huge new defense market’ and would make it easier for allies who are likely
to fight together in future wars to co-operate on developing common weapons (IHT, 8 July 1999). If
realized, such mergers would radically change the nature of the Euro-US defence industry relationship
and have a strong impact on the possible formation of the mooted EADC.
35
2. Systems integration
a) Integrating the supply chain
Modern aircraft and engines have become so complex, that a major aspect of competitive
advantage has become the ability to integrate the whole system of supply to produce the final product.
The surrounding system of suppliers today constitutes a veritable ‘external firm’, whose activities are
closely co-ordinated and planned by the core systems integrators who design and assemble the civilian
aircraft or are the prime contractors for defence industry contracts. For example, Rolls-Royce
purchases around 70 per cent of the value of the final product from outside the company. Airbus has
more than 1,500 suppliers in 27 countries. Its system of suppliers is truly global, including over
500 United States companies, and suppliers in Singapore, India, Australia, Indonesia, the Republic of
Korea, Japan and China. The size of the ‘external firm’ can greatly exceed that of the core companies.
Boeing’s ‘external firm’ employs around three-quarters of a million people across the world, including
sub-contractors in China. Rolls-Royce has around 20,000 people in its aerospace division in the United
Kingdom, and estimates that around 40,000 people work full-time to supply the company with goods
and services.
Organizing global supply networks has become an increasingly important part of the modern
aerospace industry. The large scale components purchase that system integrators make from
outsourced supply networks has necessitated large investments in IT systems to integrate the supplier
networks tightly with the core design and assembly location, and involves increasingly detailed,
instantaneous exchange of information. ‘Lean production’ techniques are essential to cost reduction
and control. Rolls-Royce believes that intensified inter-actions between the core company and the
network of over 1,500 first-tier suppliers are the main factors behind the sharp improvements in
system performance.
b) Building internal systems integration capabilities
Alongside the trend towards concentration among component and sub-system suppliers, the
leading systems integrators are themselves tending to become more vertically integrated. This enables
them to perform the increasingly complicated tasks involved in integrating complex sub-systems with
multiple interfaces (MSDW, 1999, p. 85). For example, Raytheon bought a succession of military
businesses in the 1990s, including the military electronics company, E-Systems, the military systems
and electronics business of Texas instruments, and the Hughes military electronics business from
General Motors. Through the purchase of Hughes, it established a ‘near monopoly in United States air
combat weapons’ (FT, 13 January 1997). By the late 1990s, Raytheon had become a huge company
with a $20 billion annual turnover, and a wide range of systems integration capabilities in missiles and
36
torpedoes. In Europe, BAe acquired Siemens Plessey in 1997 in order to strengthen its in-house
capability in information technology, central to electronics systems integration. BAe’s 1999 merger
with GEC-Marconi brought a major prime contractor in military equipment together with a major
aerospace electronics company. The acquisition dramatically enhanced BAe’s ability to develop its
systems integration capabilities and compete as a prime contractor for the largest defence programmes,
including aircraft carriers and combat aircraft.
3. The ‘cascade’ effect
The intense pressure from global systems integrators compelled the component supply industry
to undergo rapid change. In order to meet the demands of the systems integrators, the major
components suppliers themselves needed to invest heavily in R&D and to grow in order to benefit
from cost reduction through economies of scale. A powerful merger movement is taking place among
first-tier suppliers to the systems integrators: ‘More mergers among the smaller sub-scale components
and sub-systems manufacturers seem inevitable as the supplier base responds to the pressure being
applied by the prime contractors such as BAe, or original equipment manufacturers, such as Boeing’
(MSDW, 1999, p. 87). Indeed, leading first-tier systems integrators have themselves become ‘systems
integrators’ of major sub-sections of aircraft.
In the crucial aircraft engine sector, there are now only three engine makers left that have the
capability to produce large modern jet aircraft engines, namely Rolls-Royce, Pratt and Whitney of
United Technology and GE Engine of GE. In 1997, the market share of civil aero-engine orders in
terms of value between them was 34 per cent for Rolls-Royce, 53 per cent for GE and 13 per cent for
Pratt and Whitney (FT, 6 March 1998).
In 1999, Allied Signal, one of the world’s top five aerospace companies, strengthened its
already powerful position as a first-tier supplier still further when it announced that it was to merge
with Honeywell. The new company’s largest single business is aerospace, with about $10.5 billion in
annual revenues, ‘bringing together Honeywell’s focus on sophisticated avionics with Allied Signal’s
in-flight safety products and systems’ (FT, 7 June 1999). The new Allied Signal/Honeywell company
has ‘a strong position in everything from manufacturing cockpit controls to handling aircraft service
and maintenance’ (FT, 8 June 1999). The combined R&D expenditure of the two companies is almost
$800 million (DTI, 1998, pp. 60 and 63). Honeywell explicitly pointed to the consolidation of
customers as a major reason for the merger (FT, 11 June 1999). Only through merger and cost-cutting
can companies like Honeywell compete and establish long-run strategic partnerships with the giant
customers like Boeing, Lockheed Martin and BAe Systems.
37
The trend towards concentration is affecting smaller companies within the industry also. In June
1999, Meggitt acquired Whittaker Corporation for $380 million. The company supplies valves, ground
fuelling products and fire and smoke detectors to ‘virtually every aircraft maker in the West’ (FT,
10 June 1999). The merger was explicitly driven by the assemblers’ push to reduce the number of
parts suppliers. Without the necessary scale the two companies felt they would no longer be
competitive. Mike Stacey, Meggitt’s chief executive commented: ‘We are very conscious that bigger
suppliers is what it’s all about’ (quoted in FT, 10 June 1999).
4. Embraer
Alone among developing countries, Brazil may be on the verge of building a successful national
aerospace industry, though it is still too early to record a final verdict on the endeavour. Embraer
(Empresa Brasileira de Aeronautica) was established by the Brazilian government in 1969, as part of
its import-substitution-based industrial policy. Early strategies concentrated on aircraft designing,
assembling and fuselages production. Although strongly supported by procurement from the
government, the company focused on export markets which brought it longer production runs, new
ideas for technical change, and exacting performance standards (Goldstein, 2001). In 1994, the
company made a loss of $30 million. In the same year, the company was privatized. It was bought by
three domestic shareholders, who between them owned 89 per cent of the company’s shares. The
Brazilian state still retained a 7 per cent holding in the company.
Since then, Embraer has grown rapidly from a small regional manufacturer into a significant
global player in regional jets. Embraer rapidly developed the systems integration skills necessary to
assemble a modern airliner. It purchased all the key components from outside suppliers, including the
avionics, flight controls, engines, wings, tail units and fuselage segments. By the end of April 1999,
Embraer had achieved 373 firm orders for the ERJ-135 (37 seats) and ERJ-145 (30 seats), and
390 options for the planes. In 1999, the company delivered 97 regional jets, compared to 82 from
Bombardier, its main rival; 23 from BAe and 15 from Fairchild Dornier (HBS Case). The company
directly employs over 7,000 direct employees and has an estimate of further 3,000 employees working
in supplier industries in Brazil alone. Furthermore, in July 1999, Embraer announced the launch of a
new family of larger jets, the ERJ-170 (70 seats) and the ERJ-190-200 (90 seats). The launch order,
the largest ever for regional jets, was placed by Crossair of Switzerland and had a total of 200 aircraft
with a total value of $4.9 billion. In October 1999, Embraer announced that a consortium of French
aerospace companies including Aerospatiale/Matra, Dassault, Thomson-CSF and SNECMA would
acquire 20 per cent of its equity, which would reduce the Brazilian shareholder’s total stake to 69 per
cent. In July 2000, Embaer listed in the New York Stock Exchange.
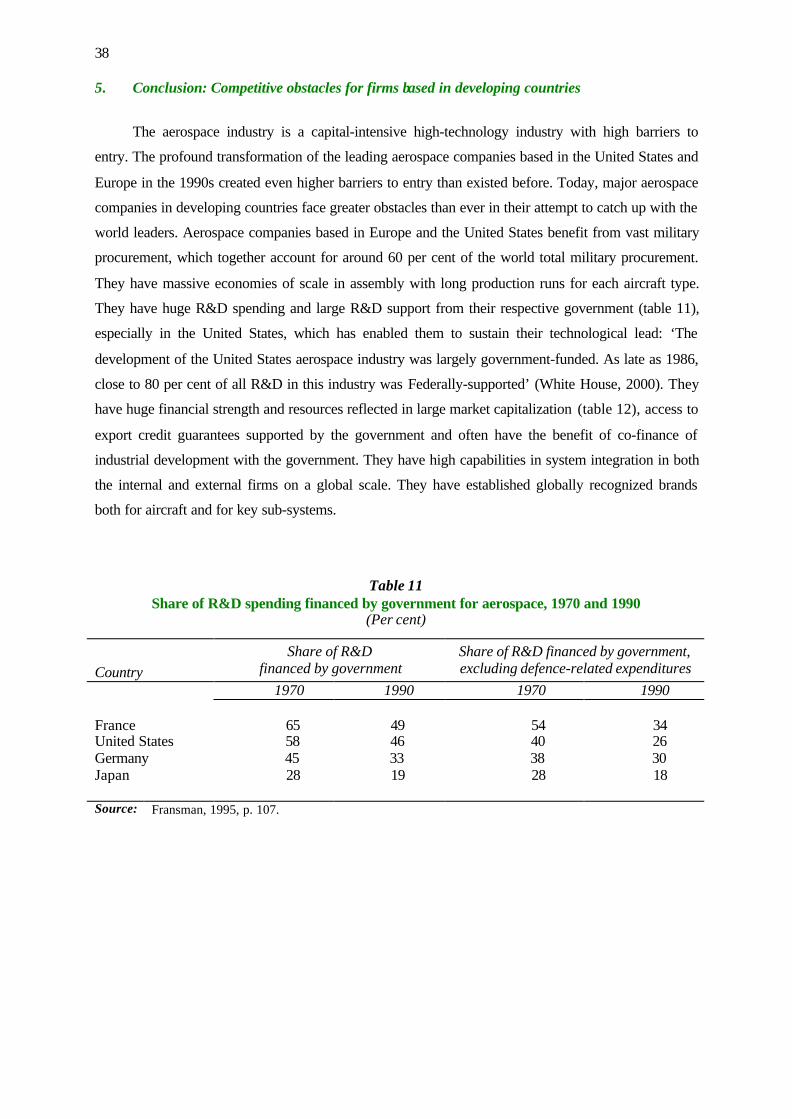
38
5. Conclusion: Competitive obstacles for firms based in developing countries
The aerospace industry is a capital-intensive high-technology industry with high barriers to
entry. The profound transformation of the leading aerospace companies based in the United States and
Europe in the 1990s created even higher barriers to entry than existed before. Today, major aerospace
companies in developing countries face greater obstacles than ever in their attempt to catch up with the
world leaders. Aerospace companies based in Europe and the United States benefit from vast military
procurement, which together account for around 60 per cent of the world total military procurement.
They have massive economies of scale in assembly with long production runs for each aircraft type.
They have huge R&D spending and large R&D support from their respective government (table 11),
especially in the United States, which has enabled them to sustain their technological lead: ‘The
development of the United States aerospace industry was largely government-funded. As late as 1986,
close to 80 per cent of all R&D in this industry was Federally-supported’ (White House, 2000). They
have huge financial strength and resources reflected in large market capitalization (table 12), access to
export credit guarantees supported by the government and often have the benefit of co-finance of
industrial development with the government. They have high capabilities in system integration in both
the internal and external firms on a global scale. They have established globally recognized brands
both for aircraft and for key sub-systems.
Table 11Share of R&D spending financed by government for aerospace, 1970 and 1990
(Per cent)
CountryShare of R&D
financed by governmentShare of R&D financed by government,excluding defence-related expenditures
1970 1990 1970 1990
France 65 49 54 34United States 58 46 40 26Germany 45 33 38 30Japan 28 19 28 18
Source: Fransman, 1995, p. 107.
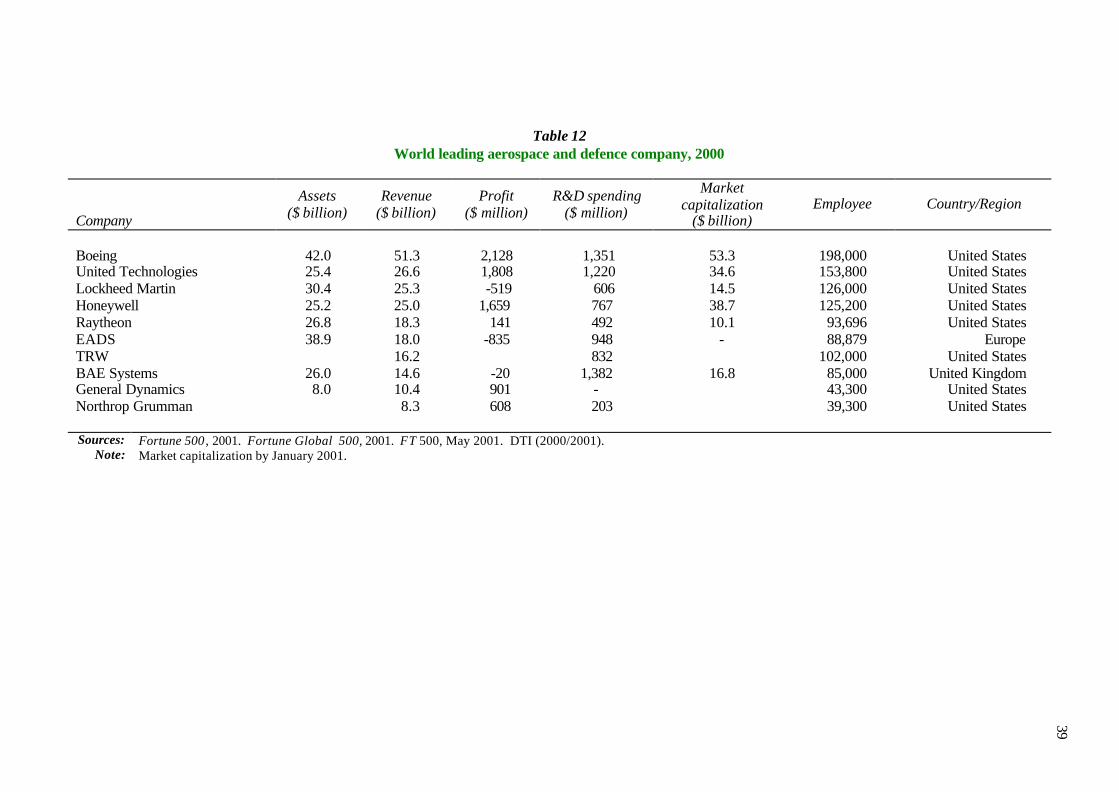
Table 12World leading aerospace and defence company, 2000
Company
Assets($ billion)
Revenue($ billion)
Profit($ million)
R&D spending($ million)
Marketcapitalization
($ billion)Employee Country/Region
Boeing 42.0 51.3 2,128 1,351 53.3 198,000 United StatesUnited Technologies 25.4 26.6 1,808 1,220 34.6 153,800 United StatesLockheed Martin 30.4 25.3 -519 606 14.5 126,000 United StatesHoneywell 25.2 25.0 1,659 767 38.7 125,200 United StatesRaytheon 26.8 18.3 141 492 10.1 93,696 United StatesEADS 38.9 18.0 -835 948 - 88,879 EuropeTRW 16.2 832 102,000 United StatesBAE Systems 26.0 14.6 -20 1,382 16.8 85,000 United KingdomGeneral Dynamics 8.0 10.4 901 - 43,300 United StatesNorthrop Grumman 8.3 608 203 39,300 United States
Sources: Fortune 500 , 2001. Fortune Global 500, 2001. FT 500, May 2001. DTI (2000/2001).Note: Market capitalization by January 2001.
39
40
Not one firm from a developing country has succeeded in challenging the aerospace giants of
the developed countries either as a systems integrator or a major first-tier supplier. Embraer represents
the highest achievements so far for developing countries in the field of commercial aerospace.
However, it is far from certain that in the foreseeable future it will be able to compete successfully
with the established giants in even the regional jet market, let alone in the market for larger aircraft.
Embraer is tiny compared with either Boeing or Airbus, and significantly smaller than Bombardier
(Canada), its main direct rival. Moreover, in each of these cases, the aerospace division of each of the
companies is part of a much larger group. In November 1999, the WTO ruled against both Brazil and
Canada for the subsidies they had given to Embraer and Bombardier. Embraer faces the serious risk of
‘head-on competition with Boeing and Airbus in the bottom end of the full-size jet market’ (Goldstein,
2001). To these risks are now added the projected general downturn in the civilian aircraft market,
with many analysts believing that for short journeys within high income countries, especially in North
America, which is Embraer’s main market, there will now be a large-scale switch to railways away
from regional jets.
B. China’s response
1. Ambitions and successes
The restructuring of China’s aerospace industry started at the same time when the world’s
leading aerospace companies entered a period of profound change. In 1993, Aviation Industries of
China (AVIC) was established, assuming responsibility for the management of all the aviation
industry assets formerly under the Ministry of Aviation Industry. It was formally turned into an
experimental state holding company in 1996. AVIC is directly responsible to the State Council, to
whom its senior managers report. It has the entire Chinese aviation industry under its control, with
formal responsibility for managing the industry’s assets, and formulating the industry’s business
strategy. The goal of the holding company was to transform the nationwide collection of enterprises
into an internationally competitive aviation company:
AVIC is promoting itself to become a gigantic enterprise group with worldwide fame and
influence… The aviation industry has itself become one of the key high-tech industries with intensive
technology and vast infrastructure. AVIC will become an ultra-large industrial group, which combines
military and civil aviation, is transnational in operation, high technology and export oriented (AVIC,
1998, pp. 2–4).
41
In the early 1980s, Deng Xiaoping gave powerful support to the attempt to build a large
indigenous jet passenger plane: ‘Henceforth, China’s domestic airlines should use only domestically-
produced airplanes’ (Deng Xiaoping, December 1981). By 1985, AVIC had achieved the
extraordinary success of building a large civilian airliner, the Y-10, based on reverse engineering of
the Boeing 707. It was produced by the Shanghai Aircraft Manufacturing Plant. Two planes were built
and underwent extensive flight testing. At this time, Airbus was still in its infancy. China also
developed its own turbo-prop regional aircraft, the Y-7, produced by Xian Aircraft Corporation
(XAC). The earlier, fifty-seat, version was developed in the 1960s. An upgraded sixty-seat version
entered commercial service in 1986.
Based on the foundation of assistance from the USSR, China built a large-scale military aircraft
industry. By the late 1990s, it had manufactured a total of several thousand military jet aircraft,
including large numbers of fighters and bombers. It has continued to build and technically upgrade
substantial numbers of military aircraft.
In the late 1980s, China and Pakistan jointly developed a relatively advanced jet trainer, the
K-8 Karakorum. In 2000, China for the first time exported an entire aircraft assembly line. It signed a
$345 million contract with Egypt to produce 80 K-8E (the export version of the K-8) jet trainers.
China will provide Egypt with parts and materials, technical training and service support for the
aircraft. In addition, China will help Egypt build five aircraft design and research institutes (Economic
Daily (Jingji Ri bao), 4 January 2000). Myanmar has also ordered thirty of the K-8Es.
These were significant successes for a developing country. However, AVIC faces massive
challenges.
2. AVIC’s businesses and structure
a) Size
In terms of employment AVIC is, indeed, a global giant. It employs over 500,000 people, more
than twice as many as Boeing and Lockheed Martin. However, if one looks at AVIC’s total sales and
profits, the company appears far from being a ‘global giant’. The combined total sales of AVIC 1 and
AVIC 2 are less than one-tenth of Boeing’s and one-fifth of Lockheed Martin’s. Moreover, the core
aerospace business of AVIC is extremely small, on a par with a medium-sized company such as
Vickers (United Kingdom). In 1997, sales of aviation businesses was just $650 million, only
accounted for 23 per cent of the total sales revenue and less than one-half the sales value of Vickers
(table 13). Even this small total aerospace revenue generated by AVIC was produced by over
100 production enterprises in all branches of aerospace activity (excluding extra-atmospheric rockets).
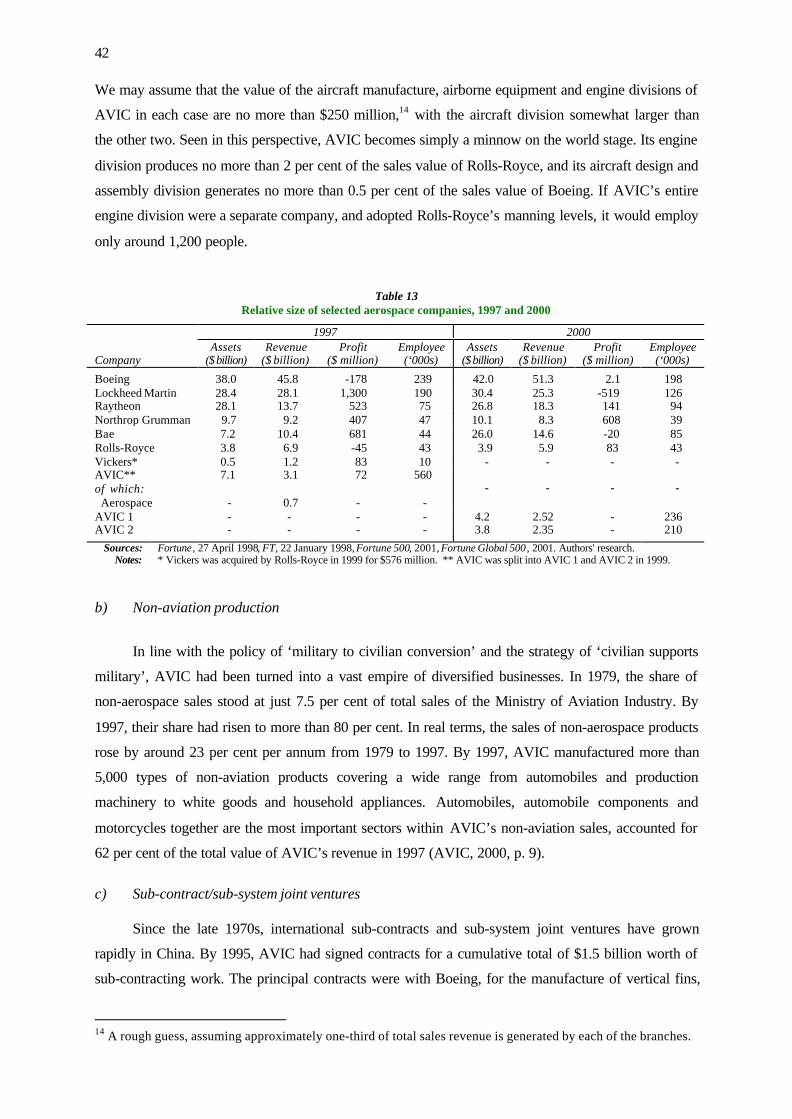
42
We may assume that the value of the aircraft manufacture, airborne equipment and engine divisions of
AVIC in each case are no more than $250 million,14 with the aircraft division somewhat larger than
the other two. Seen in this perspective, AVIC becomes simply a minnow on the world stage. Its engine
division produces no more than 2 per cent of the sales value of Rolls-Royce, and its aircraft design and
assembly division generates no more than 0.5 per cent of the sales value of Boeing. If AVIC’s entire
engine division were a separate company, and adopted Rolls-Royce’s manning levels, it would employ
only around 1,200 people.
Table 13Relative size of selected aerospace companies, 1997 and 2000
1997 2000
CompanyAssets
($ billion)Revenue
($ billion)Profit
($ million)Employee(‘000s)
Assets($ billion)
Revenue($ billion)
Profit($ million)
Employee(‘000s)
Boeing 38.0 45.8 -178 239 42.0 51.3 2.1 198Lockheed Martin 28.4 28.1 1,300 190 30.4 25.3 -519 126Raytheon 28.1 13.7 523 75 26.8 18.3 141 94Northrop Grumman 9.7 9.2 407 47 10.1 8.3 608 39Bae 7.2 10.4 681 44 26.0 14.6 -20 85Rolls-Royce 3.8 6.9 -45 43 3.9 5.9 83 43Vickers* 0.5 1.2 83 10 - - - -AVIC**of which: Aerospace
7.1
-
3.1
0.7
72
-
560
- - - - -
AVIC 1 - - - - 4.2 2.52 - 236AVIC 2 - - - - 3.8 2.35 - 210
Sources: Fortune, 27 April 1998, FT, 22 January 1998, Fortune 500, 2001, Fortune Global 500 , 2001. Authors' research.Notes: * Vickers was acquired by Rolls-Royce in 1999 for $576 million. ** AVIC was split into AVIC 1 and AVIC 2 in 1999.
b) Non-aviation production
In line with the policy of ‘military to civilian conversion’ and the strategy of ‘civilian supports
military’, AVIC had been turned into a vast empire of diversified businesses. In 1979, the share of
non-aerospace sales stood at just 7.5 per cent of total sales of the Ministry of Aviation Industry. By
1997, their share had risen to more than 80 per cent. In real terms, the sales of non-aerospace products
rose by around 23 per cent per annum from 1979 to 1997. By 1997, AVIC manufactured more than
5,000 types of non-aviation products covering a wide range from automobiles and production
machinery to white goods and household appliances. Automobiles, automobile components and
motorcycles together are the most important sectors within AVIC’s non-aviation sales, accounted for
62 per cent of the total value of AVIC’s revenue in 1997 (AVIC, 2000, p. 9).
c) Sub-contract/sub-system joint ventures
Since the late 1970s, international sub-contracts and sub-system joint ventures have grown
rapidly in China. By 1995, AVIC had signed contracts for a cumulative total of $1.5 billion worth of
sub-contracting work. The principal contracts were with Boeing, for the manufacture of vertical fins,
14 A rough guess, assuming approximately one-third of total sales revenue is generated by each of the branches.
43
horizontal stabilizers and rear fuselage and with McDonnell Douglas for the manufacture of the nose
section and horizontal stabilizers, for the MD-82 and MD-90. In addition there was a wide array of
smaller contracts, for aircraft doors, wing sections, turbine disks, blades, bores, rings, atmosphere
instruments, meteorological radar, general radar instruments, pumps and valves. AVIC had progressed
from purely compensation trade to becoming a competitive global supplier of components, including
being the sole suppliers of some items (B-747 wing rear ribs, B-737 maintenance doors, BAe 146
doors, Dash-8 cargo doors and LM2500 turbine disks).
China’s aero-engine companies have developed many sub-contracting and some joint venture
arrangements with the global industry leaders. Each of the big three engine makers, Rolls-Royce, Pratt
and Whitney and GE Engine, has become involved in the Chinese engine industry. However, the
arrangements are all still relatively small scale. Chengdu Aero-engine Company (CEC) is China’s
largest and was a key supplier of engines for China’s fighter force. Its largest contracts are with Pratt
and Whitney, but the total value of the export earnings from this contract was only $8 million in 1998,
amounting to just 2 per cent of the gross value of output at CEC. In 1997 it established sub-contracting
arrangements with Rolls-Royce, and is negotiating with GE to sub-contract engine parts. However,
neither of these promises to be as large even as the contract with Pratt and Whitney. Xian Aero-engine
Company (XAEC) has probably the largest international aero-engine partnerships of any Chinese
engine company. In the 1970s it was selected as the location for the manufacture of Spey engines
under licence from Rolls-Royce. In 1997 it started a relatively large-scale joint venture to manufacture
turbine blades for Rolls-Royce but total output value will be only around $30 million at full production
in the early 21st century (China Daily Business Weekly, 11 October 1998).
Despite their substantial growth, China’s sub-contracts with the global giants are small-scale.
For example, in 1997 sub-contracts were still a less important source of revenue for Xian Aircraft
Corporation than either the production of aluminum h-shapes for the construction industry or the
manufacture of Volvo buses. AVIC doesn’t participate in the decisions over aircraft purchase in
China. This limits its ability to place leverage on the global aircraft makers to sub-contract within
China. Moreover, the main Chinese aircraft manufacturers are competing with each other to obtain
sub-contract work, which weakens the overall industry’s bargaining power in obtaining sub-contracts,
and in settling the terms for the sub-contracts. In the meantime, China’s leading sub-contractors face
intense international competition from Israel in military sub-contracting, and from Japan and the
Republic of Korea in civil sub-contracting. Another key limitation for China’s sub-contractors is their
inability to co-finance on a large scale. China’s sub-contractors are generally only able to contract for
‘Level 3’ contracts, compared to the sub-contract of Japan and the Republic of Korea usually at Levels
4 or 5. The latter usually involves co-financing and co-designing.
44
d) Structure
Children and grandchildren
The business structure of AVIC is extremely complex with very limited monitoring and control
from the headquarters. Under the commercialization programme, AVIC’s subordinate enterprises
became substantially responsible for their own development, a dramatic transformation in their
method of business operation compared to the ‘planned economy’ epoch. AVIC has 116 subordinate
plants grouped under 56 ‘children’ enterprises. They construct their own business plans, retain profit
for reinvestment in state assets, control the way to distribute the wage fund and the size and nature of
the bonus, subject only to quite limited supervision from the headquarters of AVIC. The establishment
of new ‘grandchildren’ companies is formally approved by the AVIC headquarters, but the newly
established ‘grandchildren’ report to the ‘child’ company, not to AVIC headquarters. AVIC has no
rights over the income from the companies established by the ‘grandchildren’ companies. There is a
cascade of businesses each with investments in subordinate companies, from ‘children’, through
‘grandchildren’, ‘great grandchildren’, ‘great-great-grandchildren’ and ‘great-great-great-great
grandchildren’. The result is a typical East Asian diversified conglomerate, investing in any activity
that brings some short-term profit, but without a common focus. This structure raises deep problems
for corporate governance and central control over the operations of subsidiaries and related companies.
Flotation
The institutional structure of AVIC has changed gradually since the mid-1990s through the
flotation of different parts of the Company. By 1998, four subsidiaries of CATIC had floated,
including CATIC Shenzhen in Hong Kong (China), and Shenzhen FIYTA Group, Nanguang Group
and Shenzhen Tianma in Shenzhen. In addition, Liuyuan Hydraulic Company floated in Shanghai,
Nanfang Motor Company in Shenzhen, and XAC International in Shenzhen. The typical flotation is of
a minority share in the floated company, with the majority shareholding still held by AVIC through its
subsidiary company. For example, in the case of XAC International, XAC held 64.71 per cent of XAC
International.
3. Development setbacks
In military aircraft, it is likely that there was a real fall in the amount of resources allocated to
modernization of China’s indigenous industry during the economic reform period. The number of
military aircraft produced is reported to have fallen significantly (Nolan, 2001). The main thrust of the
indigenous military fighter production capability was reported to be the F-8II ‘Finback’. However,
international experts believe that this aircraft was ‘not comparable to contemporary Western or
Russian aircraft’. They concluded that ‘the failure of the Finback programme forced the PLAAF to
seek alternative aircraft’, with Russia as the supplier (Sergounin and Subbotin, 1999, p. 74). At the
45
time of the resumption of miltary cooperation with Russia in the mid-1990s, China had ‘a fleet of 5000
obsolete combat aircraft, most of them based on old Soviet designs such as the MiG-21 and MiG-19
fighter aircraft, and the Tu-16 bomber’ (Sergounin and Subbotin, 1999: 74).
In civilian aircraft, the Y-7 turboprop was able to win only a limited number of domestic orders.
In the year 2000, just 64 of the Y-7s were in service in thirteen domestic airlines. In addition, the
People’s Liberation Army used the Y-7 as a transporter. Export orders were negligible. By the late
1990s, a total of only 130 Y-7s had been produced, and new orders had dried up completely. To
compound matters, in the year 2000, a Y-7 exploded in mid-air. Following the conclusion of the crash
investigation, all Y-7s were taken out of service in June 2001.
China’s attempt to build its own indigenous large passenger aircraft, the Y-10, ultimately failed.
China’s domestic airlines refused to buy the plane. It was extremely heavy compared to the Boeing
707, with high fuel consumption and a very limited range. The test models were, reportedly, only able
to fly for around half an hour at a time. Only two of the Y-10s were built. The plane never entered
commercial production, and the Y-10 programme was halted in 1985.
After the conclusion of the Y-10 programme, the Ministry of Aviation devised a ‘three-step
take-off plan’, with the goal of building a 180-seater plane by 2010. The plan was to start with the
assembly of the McDonnell Douglas 80/90 series of planes, which would provide China with an
understanding of the skills needed to assemble a large modern aircraft. The second phase involved the
intention to co-operate with a leading manufacturer, in order to jointly design and manufacture a state-
of-the-art 100 seater plane, to go into service around 2005. This was the 100-seater Air Express 100
(AE-100) joint venture between AVIC and Airbus. The final phase involved self-design and
manufacture of 180-seater aircraft. One by one each of these objectives fell by the wayside.
By September 1998 China’s AE-100 programme was scrapped and the planned MD-90
programme was terminated. A year earlier, neither Airbus nor Boeing produced a 100-seater plane,
and China had hoped to produce one by 2005. Now Boeing would have a 100-seater aircraft in service
by 1999, and Airbus would have one in service by 2002. China would have nothing. The double blows
of the termination of the MD-90 programme and the AE-100 programme were perceived outside
China to ‘deal a severe blow to China’s nascent aviation industry’ and ‘throw into doubt its plans to
become a substantial aircraft manufacturer’ (FT, 5 August 1998 and 6 October 1998). The double
blow of the end of both the programmes left China’s aircraft industry reeling. Its development strategy
of ‘three stage take-off’ was in tatters. The coincidence of the double blow was remarkable. Many
people in the Chinese aircraft industry felt that it had been let down not only by Boeing and Airbus,
but also by CAAC, which had refused to order either the MD-90 or the planned AE-100.
46
4. 1999 Restructuring: splitting into two
We have seen that the rapid expansion of AVIC’s non-aviation business in the 1990s created a
company which consists of a relatively small aircraft firm, by all measures other than size of
workforce, within the shell of a vast diversified conglomerate. Moreover, the vast business structure
consists of powerful autonomous entities competing with each other for funds, investment, and sub-
contracting opportunities. The function of the headquarters in monitoring, control, co-ordination and
unifying the whole company to utilize resources and maximize returns is extremely weak. No one
within the industry believed this was a viable structure upon which to build either a successful aircraft
manufacturing industry or to construct a successful non-aerospace business. The succession of
development setbacks intensified the sense of crisis within AVIC. Debate over how to restructure it in
the light of its own internal problems and the explosive changes going on in the world industry outside
became increasingly intense by early 1999. China’s debate over the institutional structure of its aircraft
industry took place alongside the similarly intense debate within the European aerospace industry.
By autumn 1998, the strategy for China’s aerospace industry was at a critical conjuncture. In
early 1999, the Chinese government decided to split AVIC into two fully integrated parts, AVIC 1 and
AVIC 2. Each group contains the full range of production and sales of military and civilian aircraft,
airborne equipment as well as non-aeronautical products. The stated goal of the reform was the ‘break
up of monopoly and the fostering of fair market economy mechanism’ (China Daily Business Weekly,
31 January 1999). Zhu Yuli, AVIC president said: ‘The two groups will both compete and co-operate’
(quoted in FT, 2 February 1999). While the world’s leading aerospace corporations were in the midst
of an unprecedented epoch of merger and acquisition, the Chinese aerospace industry was being
divided into smaller segments. Compared to the global giants, each of China’s ‘competing aerospace
companies’ was now even more of a minnow than before the restructuring, each with aerospace
revenues of no more than $400 million, and each surrounded by a sea of unrelated businesses in the
non-aerospace industry sector.
Instead of one huge diversified conglomerate with no capability to compete with the
multinationals, the ‘reform’ of AVIC in 1999 created two smaller, and even less internationally
competitive conglomerates. The reform could have separated the vast civilian from the aerospace
business, but was unable to do so because this would have provoked such opposition from the
subordinate entities who stood to lose many of their most profitable activities. It could have separated
engines and avionics from the airframe business, but it didn’t. It could have separated military from
civilian aerospace, but it didn’t. If its main goal was to develop its capability as a sub-contractor, then
it might have allowed strong subordinate production units such as Xian, Chengdu and Shenyang to
become independent companies that could compete for business with the multinationals, but it didn’t.
In sum, the prospects for AVIC on the global level playing field were bleak.
47
Not only did the Chinese government decide to split AVIC into two, it simultaneously decided
to split into two the other main branches of the national defence industries, under the State Defence
Industries Commission (COSTIND). Thus, the China National Nuclear Industries General Company,
the China National Aerospace Industries General Company, the China National Shipbuilding General
Company, and the China National Armaments General Company, were each split into two segments in
order to ‘foster competition’. Instead of five aerospace and defence industry companies, China’s
‘restructuring’ has established ten much smaller companies.
5. Development plans
a) Regional airliner
New regional jet programme
At the end of 2000, it was apparent that China had abandoned the ambition to build a medium-
capacity, single-aisle airliner. Zhang Hongbiao, Vice Minister of the Committee of Scientific and
Technological Industries for National Defence (COSTIND), announced in November 2000 that China
would instead focus on development of a new regional jet. COSTIND will invest $600–$725 million
in research and development for the new regional jet programme aiming to build a new 50–70-seater
turbofan aircraft to international standards. It is expected to be delivered within six years and will
target both domestic and international market. The primary goal of this programme is a successful
business venture making full, ‘self-reliant’ use of all of China’s aviation manufacturing technology
while looking for international cooperation in investment, design, sub-contract production and
technical consultancy on the principle of ‘risk and benefit sharing’. It is argued that production of
regional airliners is the country’s ‘best bet’, frankly acknowledging that China cannot directly compete
with the multinational giants: ‘We cannot compete with aviation giants such as Boeing and Airbus in
financial clout and market share’ (Zhang Hongbiao, quoted in China Daily, 6 November 2000).
CAAC also expressed its support for the programme. ‘We specifically encourage the use of
domestically made aircraft for short regional flights’ (Bao Peide, Vice Minister of CAAC, quoted in
Air Transport World , January 2001, p. 57).
AVIC 1 has formed a programme management company to oversee resources, production,
certification and marketing of the new regional jet named ARJ21. Led by the President of Xian
Aircraft Co. and the chief designer of Shanghai Aircraft Design Institute, the company will become a
share-holding firm. ‘We are willing to form long-term and stable relationships with well-established
international companies to work jointly on the new regional jet programme’ (Liu Gaozhuo, President
of AVIC 1, quoted in Air Transport World , January 2001, p. 57, emphasis added).
The market prospect for regional jets in China is promising. Boeing has predicted that around
70 per cent of the total of the 1,800 new medium- and large-sized commercial aircraft purchased by
48
China over the next twenty years would be single-aisle regional jets, such as the Boeing 737 or 717
and the Airbus 319 or 320 (Keck, 2001). Although the prospects for the regional jet market in the
high-income countries must now be radically downwardly revised, the prospects for the Chinese
market are still bright, as China does not yet possess a high-speed train network that could readily
substitute for air travel. The competition for selling regional jets to China is intense, with extensive
substitution of regional jets for the fleet of turboprops. In December 1999, Shangdong Airlines placed
a firm order with Bombardier Aerospace for five CRJ200s, which are the first CRJs scheduled for
service in China. In 2000, the Xian-based Changan Airlines placed firm orders with Bombardier for
three 78-seat Q400s that are to replace its turboprop aircraft. In late 1999, Embraer signed a letter of
intent to supply ten 50-seat ERJ-145s to Sichuan Airlines (Air Transport World, February 2000,
p. 23). Hainan Airlines has placed an order with Fairchild Dornier for 39 328-JETs, with 12 aircraft
already delivered (Aviation Week & Space Technology, 13 November 2000, p. 35). Boeing and Airbus
continue to actively market their smallest aircraft to Chinese airlines in an effort to capture the
regional jet market. Price competition in all aircraft categories can be expected to intensify following
the collapse in the world aircraft market after 11 September 2001. This is good news for Chinese
airlines, but bad news for a potential regional jet produced in China. If China is, indeed, successful in
designing and building its own regional jet, it will be far behind in the race for its own national market
by the time that the first deliveries begin. This will be a huge disadvantage in an already intensely
competitive segment of the world aircraft market.
MA-60 (Xinzhou 60)
In 2000, Xian Aircraft Company (XAC) launched the MA-60, known as the Xinzhou 60 in
China. Developed from the Yun 7-200A, the MA-60 is a 56- to 60-seat turboprop with an extended
fuselage, longer range and lighter airframe weight. It is powered by Pratt & Whitney’s engines and
equipped with Collins avionics. It costs one-third less than comparable Western turboprops. A total of
26 MA-60s have been ordered by Chinese airlines. In 2000, the newly formed Shenzhen Financial
Leasing Co. signed an agreement with XAC for 60 MA-60s (Aviation Week & Space Technology,
13 November 2000, p. 36).
However, the market prospects for MA-60 are poor. First, there is already intense international
competition in the 50–70 seat turboprop market. Strong global market positions are already held by the
ATR 42 (produced by Aerospatiale and Alenia), the Dash 8 (produced by Bombardier), and the Saab
2000 as well as the Russian-built An-24 in former Soviet states. A powerful player in this market,
Fokker, with the F-50 turbo-prop, went out of business. China has already imported ATR 42s, five of
which were in operation by the late 1990s. Almost 600 ATR aircraft had been sold worldwide by
1998, enabling the company to benefit from economies of scale in a way that the Y-7 was unable to
do, and the MA-60 is most unlikely to do. Second, the whole future of turbo-prop feeder planes is in
49
doubt. In the developed countries, competition for small, local feeder aircraft has grown from high-
speed trains, a trend that will be accelerated by 11 September 2001. Moreover, there has been a
marked shift in airline preference towards jet-engine feeder aircraft. Jet aircraft are preferred for
safety, reliability and customer preference. Third, the history of the Y-7 in terms both of its lack of
commercial success and question marks about its safety, makes the task of marketing the MA-60 to
commercial airlines, that must respond to passenger perceptions and demands, extremely difficult,
even within China, let alone internationally.
b) Sub-contracting
Following the collapse of the proposed joint production plans for the AE31X and the MD-90,
Airbus and Boeing both responded with offers of considerably enhanced participation by AVIC in the
production of sub-systems. Boeing is leading in that strategy with 74 per cent of all parts built in
China going to Boeing (Aviation Week & Space Technology, 8 May 2000, p. 63). Boeing has offered
to make China the second supplier of the wing for the B-717, alongside the current supplier, Hyundai.
Airbus agreed that AVIC could participate in the development of its 107-seat A318 programme. In
addition, Shenyang Aircraft Manufacturing Co. and XAC will gain work on A320 wing components.
Shenyang will make the wing’s leading and trailing edge components and build up production levels
to four sub-assembly sets per month for all of the wing’s leading and trailing edge components. Airbus
has agreement with XAC for doors on the A300, A310, A330 and A340 and the fin fairing for the
A320 and a variety of components for the A300 and A310 programmes. BAe has discussed with XAC
its possible participation in wing manufacture for the A-320. Xian is also expected to become a source
for raw material for various components for Airbus aircraft (Aviation Week & Space Technology,
5 July 1999, p. 40). These provide the possibility for a significant increase in sales from sub-
contracting. However, in the foreseeable future this segment of the industry still seems likely to lag far
behind the level of sales and technological sophistication achieved by the sub-contracting industry in
Japan and the Republic of Korea.
6. Conclusion
Since the early 1990s, the world’s leading aerospace companies have achieved massive
competitive advantages through high-speed consolidation and through the development of systems
integration capabilities, hugely strengthening their already very powerful competitive position.
Moreover, this period witnessed the near-disintegration of the former Soviet Union’s civilian
aerospace industry and a serious weakening of its military aircraft industry. AVIC has failed to make
any inroads on the dominant position of the world’s leading corporations.
The institutional structure of AVIC is far removed from that of the global giants. Surrounding
the core aircraft business is a vast sea of unrelated non-core business, which raises fundamental
50
difficulties for corporate governance. None of the non-core businesses has achieved sufficient scale to
compete with globally successful firms in the respective sectors. In its core aerospace business AVIC
is a minnow, without any commercially successful aircraft in either the civilian or military market.
AVIC has painfully weak financial resources with which to support R&D and fund new aircraft
development programmes. It must support a huge workforce, but many of those with the highest levels
of skills in aerospace are leaving the company to work in relatively highly paid jobs outside the sector.
It is decisively loosing the ‘battle for talent’.
To meet its needs for advanced fighter planes, the Chinese military has been forced to rely
heavily on imports and domestic production under licence of Russian planes. In 1996, China ordered
200 Russian Su-27 (Sukhoi) fighters. The government has contracted to buy a further 50 Su-30 strike
aircraft from Russia (IISS, 1999: 175). China’s Central Military Commission is becoming ‘more and
more reliant on outside sources for new technology and support’ (Aviation Week & Space Technology,
29 November 1999, p. 33). Exports to China have been a crucial source of revenue for Sukhoi in
extremely difficult times for the company.
The Chinese civilian aircraft market is one of the largest and fast-growing in the world. Due to
the downturn in the global aircraft market after 11 September 2001, the relative importance of the
Chinese market may be even greater. The predicted 1,800 additions to China’s commercial aircraft
fleet by 2019 will be worth an estimated $137 billion (Aviation Week & Space Technology,
13 November 2000, p. 35). China’s capability to capture its own large domestic market for civilian
aircraft, let alone to penetrate the world market, has proved negligible. China was unsuccessful in its
attempt to build a commercially viable turboprop plane. China’s large and fast-growing regional jet
market is dominated by imports. China was unable to build a commercially successful large passenger
jet. China’s attempt to partner the multinationals in co-designing and building a large civilian aircraft
came to nothing. China’s entire civilian aircraft fleet of around 500 passenger aircraft is imported,
consisting mainly of Boeings (70 per cent) and an increasing number of Airbuses.
There is no sign that China is in the process of building large, globally competitive first-tier
suppliers to the world’s aircraft industry in sub-systems such as engines, avionics, airframes, wings,
lighting or landing gear.
Since the 1980s, in this, the most ‘strategic’ of all Chinese industries, the gap between China’s
‘national champions’ and the global giant companies has widened drastically. The Chinese market for
commercial aircraft and advanced military aircraft will be dominated by imported aircraft in the
foreseeable future.
51
IV. CONCLUSION
The period since the 1980s has seen dramatic changes in the structure of large capitalist
corporations. These changes have established the structure within which competition will take place
on the ‘global level playing field’ in the early part of the 21st century. The period saw an
unprecedented concentration of business power. Numerous firms in the high-income countries no
longer exist, having merged with or been acquired by the ‘winners’ in the battle for the global
marketplace. Numerous large ‘national champions’ have now been merged into even larger cross-
border firms, either ‘European champions’,15 ‘transatlantic firms’, or, even, European-Japanese or
United States-Japanese firms. Almost all of these firms remained headquartered within the high-
income countries, were owned mainly by shareholders from, and had senior management drawn
mainly from, the high-income countries.
Globalization has dramatically changed the competitive terrain for which developing countries’
governments must devise their industrial policies. Of all developing countries, China is the one with
the greatest possibility to support the growth of globally powerful corporations that might be able to
compete in this new environment. It has a potentially huge domestic market and a powerful and
relatively effective state through which to implement industrial policy. However, as this paper has
shown, even for China, the task has become far harder and more complex than could have been
imagined fifteen or twenty years ago when the country began its industrial reforms.
In the oil and petrochemical industry, the period saw the creation of a new breed of ‘super-
major’, with annual revenues of $150–$200 billion, and an unprecedented capability to integrate
activities across an extended internal value chain. This in turn challenged the existing middle-ranking
firms within the industry, provoking a cumulative process of merger and acquisition. These
developments drastically altered the benchmark against which China’s firms needed to evaluate their
progress in system reform. China’s planners responded to this revolution through an immense
restructuring, which represents a significant triumph for industrial policy in developing countries. In
2000, PetroChina and Sinopec successfully listed in the international stock market and rose into the
ranks of the top ten publicly-traded oil and petrochemical companies. Despite this success there
remain deep challenges posed by the revolutionary change among the world industry leaders in this
sector. For each of these firms growth within the Chinese market is a major strategic goal. They are
already making substantial progress in this objective, and can be expected to accelerate this progress
after China enters the WTO.
15 This term was increasingly used to describe firms such as Alstom, which was formed from the powerequipment divisions of Asea (Sweden), Brown Boveri (Switzerland), Alsthom (France), and GEC (UnitedKingdom).
52
In the aerospace industry, the 1990s saw an unprecedented process of high-speed global
consolidation. The process still has a long way to go before some kind of institutional equilibrium is
reached. It not only resulted in a new breed of immensely powerful ‘systems integrators’, but also
unprecedented business capability at lower levels of the value chain. Alongside these changes in the
world’s aerospace industry, China has had its own ‘restructuring’ in aerospace by splitting AVIC into
two entities. Chinese policy-makers are still groping for a strategy that will enable the country’s
aerospace industry to find its place within this business revolution.
As China is about to enter the WTO, it is crucial that global big businesses and government
policy makers in the high-income countries appreciate the severity of the challenges that confront
China’s policy makers and business leaders, even in key ‘strategic industries’. It is not enough to
repeat comforting phrases about the beneficial impact of privatization and the free market.
Privatization and liberalization are far from sufficient to enable China’s leading firms to compete on
the ‘global level playing field’. The ‘global level playing field’ is not an abstract concept. In the end
the marketplace involves a competitive struggle between firms, which, together with consumers, are
the building blocks of the economic system. For the leading systems integrators and first-tier suppliers
in each industrial sector, this is a competition between small numbers of identifiable large, often
oligopolistic, firms. The struggle is not between the innumerable nameless small firms of textbook
perfect competition.
The global business revolution has sharply changed the balance of power in market competition.
The ‘players’ on the playing field occupy far more unequal positions than they did prior to the
business revolution. China’s leading firms are in a highly vulnerable position, even in sectors in which
China’s policy makers have scored significant successes. Moreover, large Chinese firms operate in a
totally different political-economic environment from that of the world’s leading corporations. China’s
political leaders have to consider the huge difficulties that stem from the existence of around one
billion poor people within their boundaries, and the complexities involved in the reform of China’s
political system. If China’s large firms were to experience widespread defeat, especially in key
‘strategic industries’, in the battle on the global level playing field of the WTO, that would raise deep
issues not only for the Chinese government, but also for international relations, and, ultimately, for the
large firms headquartered in the high-income countries.
Coping with failure is a massive challenge. Coping with success can also be a challenge.
53
REFERENCES
AVIC Economic Research Centre (2000). Research on Economic Topics of the Aerospace Industry,AVIC Economic Research Centre. Beijing.
Chen Huai, et al (1998). ‘Assets restructuring of the Chinese oil and petrochemical industry’Economic Science Press. Beijing.
Chen Yongkai (2001). ‘Opportunities and challenges before Sinopec’, http://www.worldoilweb.com.
Department of Trade and Industry (DTI) (2000). Research and Development Scoreboard. Departmentof Trade and Industry. London.
Fransman M (1995). ‘Is industrial policy obsolete?’. Cambridge Journal of Economics, Vol. 19,Oxford University Press. Oxford.
Goldstein A (2001). ‘From national champion to global player: explaining the success of Embraer’.Working Paper CBS-17-2001, OECD Development Centre, Paris.
HBS Case 701-006 (2000). ‘Embraer: the global leader in regional jets’. Harvard Business School,Boston, MA 02163.
IISS (1999). Military Balance, 1999/2000, International Institute for Strategic Studies, London.
Keck E (2001). ‘Commercial Aviation Takes Off’, The China Business Review, March-April 2001.Washington, DC.
MSDW (1998). The Competitive Edge. Morgan Stanley Dean Witter. New York.
MSDW (2000). The Competitive Edge, April Update. Morgan Stanley Dean Witter. New York.
Nolan P (1996). ‘Large firms and industrial reform in the former planned economies: the case ofChina’. Cambridge Journal of Economics, Vol. 20, No. 1, pp. 1–31.
Nolan P (1998). ‘Indigenous large firms in China’s economic reform: the case of Shougang Iron andSteel Corporation’, Contemporary China Institute, SOAS, University of London.
Nolan P (1999). ‘Coca Cola and the Global Business Revolution: A Study with Special Reference tothe EU’. Polity Press, Cambridge.
Nolan P (2000). ‘Institutional reform of China’s oil and gas industry’ (in Chinese). Strategy andManagement (Zhanlue yu guanli), Vol. 9, No. 38, pp. 1–15.
Nolan P (2001a). ‘China and the Global Business Revolution’. Palgrave, Basingstoke.
Nolan P (2001b). ‘China and the global economy’. Palgrave, Basingstoke.
Nolan P (2002a). ‘Looking at China’s enterprises (Zhongguo qiye xing)’ (in Chinese). MetallurgicalIndustries Publishing House. Beijing.
Nolan P (2002b). ‘China and the global business revolution’. Cambridge Journal of Economics,Vol. 26, No. 1, pp. 119–137
54
Nolan P (2002c). ‘The challenge of globalisation for China’s large enterprises’, World Development,forthcoming.
Nolan P and Wang Xiaoqiang (1997). ‘US defence industry: comprehensive re-organisation withinfour years – enlightenment for China’, (in Chinese). Strategy and Management (Zhanlue yuguanli), Vol. 6, No. 25, pp. 60–67
Nolan P and Wang Xiaoqiang (1998). ‘The Chinese army’s firm in business: the case of Sanjiu’. TheDeveloping Economies, Vol. 36, No. 1, pp. 45–79. Tokyo.
Nolan P and Wang Xiaoqiang (1998). ‘Harbin Power Equipment Company and the battle for theChinese market’. Competition and Change, Vol. 3, pp. 417–448.
Nolan P and Wang Xiaoqiang (1999a). ‘Beyond privatisation: institutional innovation and growth inChina’s large state-owned enterprises’. World Development, Vol. 27, No. 1, pp. 169–200
Nolan P and Wang Xiaoqiang (1999b). Strategic Reorganisation (in Chinese). Wenhui PublishingHouse, Shanghai.
Nolan P and Yeung G (2001a). ‘Two paths to the reform of large firms in China’. Cambridge Journalof Economics, Vol. 25, No. 4, pp. 443–466.
Nolan P and Yeung G (2001b). ‘Large Firms and Catch-up in a Transitional Economy: The case of theShougang Group’, Economics of Planning, Vol. 34, pp. 159–178.
Sergounin AA and Subbotin SV (1999). Russian Arms Transfers to East Asia in the 1990s, OxfordUniversity Press, Oxford.
State Economic and Trade Commission (SETC). ‘Notification on distributing the list of the first batchof small refineries that should be closed down’. Oil and Petrochemical Section, No. 584, 1999.SETC, People's Republic of China.
SETC. ‘Notification on distributing the list of the second batch of small refineries that should beclosed down’. Oil and Petrochemical Section, No. 234, 2000.
SETC. The Tenth Five-Year Plan for Oil Industry, 2001.
Wang Xiaoqiang (1998). Industrial Restructuring. Wenhui Publishing House, Shanghai.
White House (2000), ‘Supporting R&D to promote economic growth’, White House website.
World Bank (1998, 2001). Global Economic Prospects forDeveloping Countries. Washington, DC.
Xinhuanet. ‘Our national petrochemical industry faces a severe situation’, 27 September 2001.
Zhang Zhigang (2001), ‘Proceed to regulating the market of refined products’, http://www.setc.gov.cn
55
UNCTAD Discussion Papers
No. Date Author(s) Title
94 January 1995 XIE Ping Financial services in China
95 January 1995 William W.F. Choa The derivation of trade matrices by commoditygroups in current and constant prices
96 February 1995 Alexandre R. Barros The role of wage stickiness in economic growth
97 February 1995 Ajit Singh How did East Asia grow so fast? Slow progresstowards an analytical consensus
98 April 1995 Zeljka Kozul-Wright The role of the firm in the innovation process
99 May 1995 Juan A. de Castro Trade and labour standards: Using the wronginstruments for the right cause
100 August 1995 Roberto Frenkel Macroeconomic sustainability and developmentprospects: Latin American performance in the1990s
101 August 1995 Richard Kozul-Wrightand Paul Rayment
Walking on two legs: Strengthening democracyand productive entrepreneurship in the transitioneconomies
102 August 1995 J.C. de Souza Braga,M.A. Macedo Cintra andSulamis Dain
Financing the public sector in Latin America
103 September 1995 Toni Haniotisand Sebastian Schich
Should governments subsidize exports throughexport credit insurance agencies?
104 September 1995 Robert Rowthorn A simulation model of North-South trade
105 October 1995 Giovanni N. De Vito Market distortions and competition: The particularcase of Malaysia
106 October 1995 John Eatwell Disguised unemployment: The G7 experience
107 November 1995 Luisa E. Sabater Multilateral debt of least developed countries
108 November 1995 David Felix Financial globalization versus free trade: The casefor the Tobin tax
109 December 1995 Urvashi Zutshi Aspects of the final outcome of the negotiations onfinancial services of the Uruguay Round
110 January 1996 H.A.C. Prasad Bilateral terms of trade of selected countries fromthe South with the North and the South
111 January 1996 Charles Gore Methodological nationalism and themisunderstanding of East Asian industrialization
56
112 March 1996 Djidiack Faye Aide publique au développement et detteextérieure: Quelles mesures opportunes pour lefinancement du secteur privé en Afrique?
113 March 1996 Paul Bairoch andRichard Kozul-Wright
Globalization myths: Some historical reflectionson integration, industrialization and growth in theworld economy
114 April 1996 Rameshwar Tandon Japanese financial deregulation since 1984
115 April 1996 E.V.K. Fitzgerald Intervention versus regulation: The role of the IMFin crisis prevention and management
116 June 1996 Jussi Lankoski Controlling agricultural nonpoint source pollution:The case of mineral balances
117 August 1996 José Ripoll Domestic insurance markets in developingcountries: Is there any life after GATS?
118 September 1996 Sunanda Sen Growth centres in South East Asia in the era ofglobalization
119 September 1996 Leena Alanen The impact of environmental cost internalizationon sectoral competitiveness: A new conceptualframework
120 October 1996 Sinan Al-Shabibi Structural adjustment for the transition todisarmament: An assessment of the role of themarket
121 October 1996 Jean-François Outreville Reinsurance in developing countries: Marketstructure and comparative advantage
122 December 1996 Jörg Mayer Implications of new trade and endogenous growththeories for diversification policies of commodity-dependent countries
123 December 1996 L. Rutten andL. Santana-Boado
Collateralized commodity financing with specialreference to the use of warehouse receipts
124 March 1997 Jörg Mayer Is having a rich natural-resource endowmentdetrimental to export diversification?
125 April 1997 Brigitte Bocoum The new mining legislation of Côte d'Ivoire: Somecomparative features
126 April 1997 Jussi Lankoski Environmental effects of agricultural tradeliberalization and domestic agricultural policyreforms
127 May 1997 Raju Jan Singh Banks, growth and geography
128 September 1997 Enrique Cosio-Pascal Debt sustainability and social and humandevelopment: The net transfer approach and acomment on the so-called "net" present valuecalculation for debt relief
57
129 September 1997 Andrew J. Cornford Selected features of financial sectors in Asia andtheir implications for services trade
130 March 1998 Matti Vainio The effect of unclear property rights onenvironmental degradation and increase in poverty
131 Feb./March 1998 Robert Rowthorn andRichard Kozul-Wright
Globalization and economic convergence: Anassessment
132 March 1998 Martin Brownbridge The causes of financial distress in local banks inAfrica and implications for prudential policy
133 March 1998 Rubens Lopes Braga Expanding developing countries' exports in aglobal economy: The need to emulate thestrategies used by transnational corporations forinternational business development
134 April 1998 A.V. Ganesan Strategic options available to developing countrieswith regard to a Multilateral Agreement onInvestment
135 May 1998 Jene K. Kwon The East Asian Model: An exploration of rapideconomic growth in the Republic of Korea andTaiwan Province of China
136 June 1998 Jomo K.S. and M. Rock Economic diversification and primary commodityprocessing in the second-tier South-East Asiannewly industrializing countries
137 June 1998 Rajah Rasiah The export manufacturing experience of Indonesia,Malaysia and Thailand: Lessons for Africa
138 October 1998 Zeljka Kozul-Wrightand Lloyds Stanbury
Becoming a globally competitive player: The caseof the music industry in Jamaica
139 December 1998 Mehdi Shafaeddin How did developed countries industrialize? Thehistory of trade and industrial policy: The cases ofGreat Britain and the USA
140 February 1999 M. Branchi, G. Gabrieleand V. Spiezia
Traditional agricultural exports, externaldependency and domestic prices policies: Africancoffee exports in a comparative perspective
141 May 1999 Lorenza Jachiaand Ethél Teljeur
Free trade between South Africa and the EuropeanUnion – A quantitative analysis
142 November 1999 Jean-François Outreville Financial development, human capital and politicalstability
143 November 1999 Yilmaz Akyüz andAndrew Cornford
Capital flows to developing countries and thereform of the international financial system
144 December 1999 Wei Ge The dynamics of export-processing zones
145 January 2000 B. Andersen, Z. Kozul-Wrightand R. Kozul-Wright
Copyrights, competition and development: Thecase of the music industry
58
146 February 2000 Manuel R. Agosinand Ricardo Mayer
Foreign investment in developing countries: Doesit crowd in domestic investment?
148 April 2000 Yilmaz Akyüz The debate on the international financialarchitecture: Reforming the reformers
149 July 2000 Mehdi Shafaeddin What did Frederick List actually say? Someclarifications on the infant industry argument
150 August 2000 Jörg Mayer Globalization, technology transfer and skillaccumulation in low-income countries
151 October 2000 Bernard Shull Financial modernization legislation in the UnitedStates – Background and implications
152 December 2000 Dilip K. Das Asian crisis: Distilling critical lessons
153 December 2000 Mehdi Shafaeddin Free trade or fair trade? Fallacies surrounding thetheories of trade liberalization and protection andcontradictions in international trade rules
154 June 2001 Jörg Mayer Technology diffusion, human capital andeconomic growth in developing countries
155 August 2001 Alberto Gabriele Science and technology policies, industrial reformand technical progress in China: Can socialistproperty rights be compatible with technologicalcatching up?
156 August 2001 Andrew J. Cornford The Basel Committee's proposals for revisedcapital standards: Mark 2 and the state of play
157 September 2001 Heiner Flassbeck The exchange rate: Economic policy tool ormarket price?
158 April 2002 Yilmaz Akyüz andKorkut Boratav
The making of the Turkish financial crisis
159 May 2002 Jörg Mayer, ArunasButkevicius and Ali Kadri
Dynamic products in world exports
160 June 2002 S.M. Shafaeddin The impact of China's accession to WTO onexports of developing countries
161 June 2002 Zheng Zhihai and Zhao Yumin China's terms of trade in manufactures, 1993–2000
Copies of UNCTAD Discussion Papers may be obtained from the Publications Assistant, Macroeconomic andDevelopment Policies Branch, GDS, UNCTAD, Palais des Nations, CH-1211 Geneva 10, Switzerland (Fax:(+41) (0)22.907.0274; E.mail: [email protected]). New Discussion Papers are available on thewebsite at: http://www.unctad.org/en/pub/pubframe.htm