Embed Size (px)
Citation preview

microorganisms
Article
Disinfectant, Soap or Probiotic Cleaning?Surface Microbiome Diversity and BiofilmCompetitive Exclusion
Wendy Stone 1,* , Janke Tolmay 1, Keira Tucker 1 and Gideon M. Wolfaardt 1,2
1 Environmental Microbiology Laboratory, Water Institute, Department of Microbiology,Stellenbosch University, 7602 Stellenbosch, South Africa; [email protected] (J.T.);[email protected] (K.T.); [email protected] (G.M.W.)
2 Environmental Microbiology Laboratory, Department of Chemistry and Biology, Ryerson University,Toronto, ON M5B 2K3, Canada
* Correspondence: [email protected]
Received: 3 October 2020; Accepted: 28 October 2020; Published: 4 November 2020�����������������
Abstract: This study extends probiotic cleaning research to a built environment. Through aneight-month cleaning trial, we compared the effect of three cleaning products (disinfectant, plain soap,and a probiotic cleaner containing a patented Bacillus spore consortium), and tap water as the control,on the resident microbiome of three common hospital surfaces (linoleum, ceramic, and stainless steel).Pathogens, Escherichia coli and Staphylococcus aureus, were deposited and desiccated, and competitiveexclusion was assessed for each microbiome. Cell survival was shown to be an incomplete toolfor measuring microbial competitive exclusion. Biofilm competition offered a fuller understandingof competitive dynamics. A test for culturable cell survival showed that both plain soap andprobiotic cleaner regimes established a surface microbiome that outcompeted the two pathogens.A different picture emerged when observing biofilms with a deposited and desiccated GFP-labeledpathogen, Pseudomonas aeruginosa. Competitive exclusion was again demonstrated. On surfacescleaned with disinfectant the pathogen outcompeted the microbiomes. On surfaces cleaned withplain soap, the microbiomes outcompeted the pathogen. However, on surfaces cleaned with probioticcleaner, despite the exponentially higher surface microbial loads, the microbiome did not completelyoutcompete the pathogen. Thus, the standard culturable cell test for survival on a surface confirmedthe competitive advantage that is typically reported for probiotic cleaners. However, observation ofcompetition in biofilms showed that the more diverse microbiome (according to alpha and betaindices) established on a surface cleaned with plain soap had a better competitive advantage thanthe monoculture established by the probiotic cleaner. Therefore, microbial diversity appears to beas critical to the competitive exclusion principle as cell numbers. The study showed that both plainsoap and probiotic cleaner fostered competitive exclusion far more effectively than disinfectant.Probiotic cleaners with microbial diversity could be worth considering for hospital cleaning.
Keywords: probiotic diversity; cleaning regime; species competition; surface communities;biofilm competition
1. Introduction
The link between ecological diversity and environmental balance is evident at all levels of life.In humans and animals, an imbalance of pathogens causes disease. On a global scale, such imbalanceslead to plagues and ecological collapse. Understanding the effects of pathogen proliferation can informapproaches to human health and can be applied to environmental health policy. Since human and
Microorganisms 2020, 8, 1726; doi:10.3390/microorganisms8111726 www.mdpi.com/journal/microorganisms
Microorganisms 2020, 8, 1726 2 of 19
ecological health are interconnected, not independent, good hygiene policy connects inwards withmicrobiome health and outwards with environmental health.
Hospitals are a particularly interesting biome, in terms of microbial diversity and homeostasis.Here, the built environment becomes a pathogen reservoir as a result of the heavy traffic ofpathogen-laden patients and the liberal use of antibiotics [1–3]. Research has explored the spatialand temporal patterns of nosocomial infections [4,5] and the way hospitals try to control them withincreasingly aggressive disinfection regimes and antimicrobial agents [6]. Since the advent of routineantimicrobial cleaning in the mid−20th century, attention has been focused on keeping hospitals asmicrobe free as possible. Antibiotics have lulled people into relying on medicine to rectify imbalances,hence the crisis of drug-resistant pathogens [7]. Too often today’s approach to ecology is a reaction tocatastrophe rather than the stewardship and harnessing of natural systems.
Approximately 7% of patients in developed countries and 10% of patients in developing countriespick up nosocomial infections in general hospital wards [8], with some studies reporting as manyas 15% of patients [9]. Developing countries are particularly susceptible because of HIV/AIDS,resource shortages, and poor education [10]. However, even with modern facilities and the highestconventional disinfection standards, hospitals in developed countries are not exempt [3]. Excessive andinefficient use of disinfectants, similar to excessive and inefficient use of antibiotics, may increase ahospital’s risk of becoming an incubator for resistant pathogens [6,11]. Antimicrobial surfaces are thenext popular frontier in the battle against nosocomial pathogen survival [12], with similar implications.In contrast, a diverse bacterial ecology can prevent pathogen proliferation by increasing competitionfor nutrients and space, or by secreting secondary metabolites that confer a survival advantage [13].When microbial cells are removed from a surface, the diversity is disturbed. If a pathogen moves in,then, as the competitive exclusion principle, Gause’s Law, states, the reduced competition may enableit to thrive and colonize the space [14].
This principle has leached into popular science as an awareness of the potential of probiotics,and has boosted the market for fermented foods such as kefir and kombucha [15]. In this study, we usethe term “probiotic” to mean harnessing living organisms to promote health not just in the digestivetract but also in a built environment, and in our case specifically in a hospital. The health benefitsof “dirt” have been discussed in both scientific and popular literature [16] and faecal transplants areincreasingly being used to treat gastrointestinal disease [17]. Given these indications of both scientificand popular awareness and acceptance of probiotics, it should not be difficult to facilitate shifts inpolicy and management if we can produce empirical evidence that using probiotics in cleanlinessregimes reduces the risk of pathogen transfer. This hypothesis has been tested [18], and appliedto, for example, buildings and air-conditioning [19], indoor plants [20] and cleaning products [3].International drives such as the Healthier Hospitals Initiative [21], Healthcare No Harm [22] andPractice Greenhealth [23] have been promoting ecological balance in the healthcare industry, motivating,in particular, more responsible use of disinfectants.
In this study we assessed competitive exclusion with the aim of fostering a better understandingof ecology in hospital cleaning regimes. The resident microbiomes established after an eight-monthcleaning regime (comparing disinfectant, plain soap, probiotic cleaner, and ambient tap water asa control) were assessed for their competitive interaction with introduced desiccated pathogens.Competitive exclusion was evaluated by observing cell survival and biofilm dynamics. The cleaningregimes were applied to samples of three kinds of surface, i.e., ceramic, linoleum, and stainless steel,that were selected to represent surfaces common in hospitals, and were placed both indoors andoutdoors to evaluate the effect of containment and to make the results representative of the widerhospital environment. In this paper, we use the term ”resident microbiome” to refer to the microbiomethat had become established on the surfaces after the eight months’ cleaning process, consisting of anyof the original microbes remaining, microbes that landed on the surface between the weekly cleanings,and microbes deposited via the cleaning process (from the water, the probiotic cleaner and the cloths).

Microorganisms 2020, 8, 1726 3 of 19
2. Materials and Methods
We explored the competitive exclusion of microbiomes established on three different surfacesexposed to indoor and outdoor air microbiomes and subjected, for eight months, to distinct cleaningregimes, using three cleaning products and a control. First, we measured the culturable survival ofpathogens desiccated on these surfaces, and then the competitive exclusion during the biofilm growthof the deposited pathogens, at physiological temperatures.
2.1. Strain Acquisition, Characterization and Maintenance
Clinical Escherichia coli and Staphylococcus aureus strains (Stellenbosch University MedicalMicrobiology, Tygerberg Hospital, Western Cape, South Africa) were inoculated in tryptic soy broth(3 g·L−1, 250 rpm, 37 ◦C, 24 h) within three days of isolation from a human host, and freeze cultureswere prepared for storage after two passages (40% v·v−1 glycerol, −80 ◦C). All strains were inoculateddirectly from freeze culture stocks and passaged twice prior to experimental inoculation onto surfaces,after eight months of surface cleaning (3 g·L−1 tryptic soy broth, 250 rpm, 37 ◦C, 24 h). The clinicalstrains were not maintained as bench cultures at ambient temperatures, to prevent adaptation tolaboratory conditions. Strains were characterized by plotting growth curves (3 g·L−1 tryptic soy broth,37 ◦C, 250 rpm, 45 h). MacConkey agar (Sigma-Aldrich, Cape Town, South Africa) was used for theidentification of E. coli. Mannitol salt agar (Sigma-Aldrich, Cape Town, South Africa) was used for theidentification of S. aureus.
2.2. Cleaning Regime and Surface Selection
The resident microbiomes on three surface materials were subjected to four cleaning regimes(Table 1), placed indoors and outdoors, informed by local hospital cleaning protocols and surfacematerials. The established impact of the air microbiome on indoor health, often studied in the contextof “sick building syndrome” [24,25], motivated the inclusion of both indoor and outdoor replicates.In this study, the indoor blocks were arranged in a soil sciences laboratory, selected as a clean butnon-clinical built environment. They were arranged on the floor, under the benches used by students.The outdoor samples were on a roof, situated near trees, exposed to sunshine, wind, and wildlife(birds and insects).
Each treatment, surface, and placement combination was assessed in triplicate, with 72 controlsamples and 72 experimental samples. For all culturing and biofilm studies, small blocks of ceramic(3 × 3 cm standard sized, smooth, glazed bathroom tiles), linoleum (1.5 × 1.5 cm) and stainless steel(1.5 × 1.5 cm) were arranged randomly, indoors (in the Stellenbosch University Soil Sciences laboratory)and outdoors (on an exposed roof). For DNA extraction and molecular analysis of the resident surfacemicrobiome diversity, large blocks of linoleum (45 × 30 cm) were arranged and cleaned according tothe same four regimes (larger blocks were used to increase DNA concentrations and were placed onlyindoors because of logistical limitations). Four indoor cloths and four outdoor cloths were dedicatedto each treatment (disinfectant, plain soap, probiotic cleaner and control, Table 1), air-dried betweenwashes and stored separately. The probiotic cleaner we used contained a consortium of species fromonly one genus, Bacillus spores. Probiotic cleaners generally contain only Bacillus spores, with somebrands claiming, at most, “a variety of species or strains”. The blocks to be treated with probiotic cleanerwere separated from the other blocks by at least 20 cm to prevent cross-contamination. Surfaces werecleaned twice a week for eight months, allowing a resident microbiome to become well established.The surfaces were thoroughly rinsed of disinfectant or soap after each cleaning, to prevent the residuehaving an impact on cell survival.
Microorganisms 2020, 8, 1726 4 of 19
Table 1. Cleaning products and procedures based on local hospital regimes.
Treatment Product Dilution Procedure
Control Tap water (Cold tap) - Rinse cloth, wring well,wipe once.
Plain soapEarthSap biodegradable soap. Active
ingredients: saponified vegetable extract,essential oils, natural gum
250 mL·500 mL−1Wipe with cloth soaked in
soap, rinse cloththoroughly, wipe (×3).
DisinfectantJik bleach.
Active ingredient: 3.5% m/v sodiumhypochlorite
50 mL·500 mL−1Wipe with disinfectant,
soak for 5 min. Rinse cloththoroughly, wipe (×3).
Probioticcleaner
Bacterrorist non-toxic all-purpose cleaner(8.6 × 10⁷ colony forming units (cfu)·mL−1
Bacillus spores, analyzed in-study)Undiluted Spray directly onto surface,
wipe with damp cloth.
2.3. Cleaning Regime Impact on Community Dynamics
2.3.1. Resident Surface Community Quantification
Four hours after the final cleaning at the end of the eight-month experiment, all the blocks weretransferred to the laboratory, where all subsequent work was done. The small blocks were vortexedto assess the baseline cell concentrations of the total cells (tryptic soy agar, 3 g·L−1 tryptic soy broth,15 g·L−1 agar), E. coli (MacConkey agar) and S. aureus (mannitol salt agar) of the resident microbiomeestablished at the end of the cleaning regimes. Baselines for each treatment, surface, and placement(indoors or outdoors) were assessed in triplicate. Each block was submerged face down in 5 mL sterilephysiological saline solution (9 g·L−1 NaCl, 50 mL conical tube), incubated at room temperature for tenminutes, and vortexed for one minute [26], as well as in-study optimization. The cell suspension wasquantified via dilution series (saline solution) on tryptic soy agar, MacConkey agar, and mannitol saltagar. Squares (1.5 × 1.5 cm) were cut from each cloth and the cell concentration similarly assessedin triplicate.
2.3.2. Resident Surface Community Diversity
Community diversity was assessed for each cleaning regime in quadruplicate, by isolating theDNA of the resident microbiome from the surface of the large linoleum blocks. These blocks weretransferred to the lab individually, and each surface sampled with a sterile gauze swab (5 × 5 cm,double layered) moistened with 1 mL sterile saline solution. Medium pressure was applied overthe entire surface, first wiping horizontally, and then turning the swab over and wiping vertically.The swabs were placed in separate sterile 50 mL conical centrifuge tubes containing 20 mL phosphatebuffered saline (pH 7.4) with 0.1% (v/v) Tween® 20 detergent (PBST). Various cell disruption methods(vortexing, sonication, and combinations of these methods, as well as increasing intervals of both)were evaluated for separation of the cells from the swabs. The method finally selected was as follows.The centrifuge tubes were vortexed (1 min), the swabs were removed from the tubes and excess bufferwas wrung out into the tube. Then, the swabs were placed in separate Petri dishes and an extra 5 mLPBST was added. Then, the swabs were rubbed and wrung out into the centrifuge tubes, the wayone would wring out a dishcloth (this was established as a critical step for improving cell removalfrom the swabs during this study), bringing the PBST in each centrifuge tube close to a total of 25 mL.The swabs were then discarded. The tubes were centrifuged (5000 × g for 15 min), the supernatantcarefully decanted, and the cell pellet resuspended in 500 µL saline solution.
The concentrations of the cell pellets were quantified by a dilution series on tryptic soy agar.Various DNA extraction methods (phenol/chloroform/isoamyl alcohol, Zymo kits or Qiagen kits) wereevaluated prior to selection. The method finally chosen was extraction using the QIAamp® DNA MicroKit (Qiagen, Germany). The manufacturer’s protocol for blood samples was followed, with adjustmentsfor low cell concentrations and high proportions of particulate matter to cells. The maximum initial
Microorganisms 2020, 8, 1726 5 of 19
cell suspension volume (100 µL) was used, adding carrier DNA to all samples and doubling the waterbath incubation time (20 min) for enhanced cell lysis. When transferring the lysate to the column,care was taken to avoid the precipitated dirt, as earlier optimization demonstrated interference withthe extraction procedure. The DNA was eluted in 25 µL distilled H2O and stored at 4 ◦C for subsequentmolecular analyses within two days.
Automated ribosomal intergenic spatial analysis (ARISA) was commercially performed by Sporatec,Stellenbosch, South Africa. Eubacterial specific primers, ITSReub and FAM (carboxy-fluorescein)-labeledITSF, were used to determine bacterial diversity [27]. The fungal diversity was determined with fungalprimers ITS4 and FAM-labeled ITS5 [28]. The study focused on the bacterial microbiome, but geneticanalysis included fungi for a fuller picture. ARISA sequencing and data processing methods aredescribed in Appendix A.1.
2.3.3. Competitive Exclusion: Cell Survival
Clinical E. coli and S. aureus strains were desiccated on blocks of each cleaning treatment,surface type, and placement (indoor or outdoor), and the competitive impact of each of the residentmicrobiomes on the survival of the desiccated pathogens was assessed. After eight months of cleaning,the small blocks were transferred to the laboratory, and the clinical pathogens were deposited to assesscompetitive exclusion.
A preliminary screening determined the most effective desiccation and disruption methodsfor consistent cell recovery (ambient vs. laminar flow desiccation, saline vs. tap water suspension,vortexing vs. sonication, optimizing cell concentrations, disruption rigor, and desiccation periods).The method selected was as follows: E. coli and S. aureus were grown well into their stationary phase, intriplicate (3 g·L−1 tryptic soy broth, 37 ◦C, 250 rpm, 36 h agitation, 12 h standing). Cells were harvestedby centrifugation (2× 2 mL, 7500 × g, 3 min), washed in 2 mL sterile tap water, centrifuged (7500× g,3 min) and re-suspended in 2 mL saline solution. Two separate 50 µL droplets, one of each strainsuspension (E. coli and S. aureus, 106 cfu/mL), were deposited next to each other on each small block(four treatments, three surface materials, and two placements). The blocks were air dried under laminarflow (ambient temperature, ±24 ◦C) for two and a half to three hours, and subsequently stored in Petridishes on a benchtop (at ambient temperatures, 24 h). Un-inoculated control blocks were subjected tosimilar drying, for subtraction of false positives to compensate for some of the limitations associatedwith culturing methods. Post-desiccation viable cell survival was evaluated with a dilution series ontryptic soy agar, MacConkey agar, and mannitol salt agar. Each block was placed face down in 5 mLsaline solution in a 50 mL conical tube, incubated at ambient temperature for ten minutes, and vortexed(1 min) before dilutions. The percentage cell survival was compared for E. coli (MacConkey agar) andS. aureus (mannitol salt agar) according to Equation (1):
[x] − [x]O[I]
∗ 100 = % cell suvival (1)
where [x] is the final cell concentration per block (cfu·block−1), [x]O is the final cell concentration perun-inoculated block (cfu·block−1), and [I] is the inoculum concentration per block (cfu·50 µL−1).
2.3.4. Competitive Exclusion: Biofilm Proliferation
Indoor linoleum blocks reserved for this experiment were subjected to each cleaning regime foreight months, and then removed to the laboratory. The pathogen Pseudomonas aeruginosa (PAO1-GFP)was grown under physiological conditions and deposited in saline (representing sputum) on the blocksand desiccated overnight. Competitive population dynamics were assessed with subsequent biofilmregrowth of the linoleum block microbiome and the desiccated pathogen, at a temperature simulatinghuman physiology and favoring the adaptation of the pathogen (37 ◦C). The total microbiome was
Microorganisms 2020, 8, 1726 6 of 19
stained with a universal fluorescent dye, and the competitive survival of the deposited pathogen wasvisualized with GFP using fluorescence microscopy.
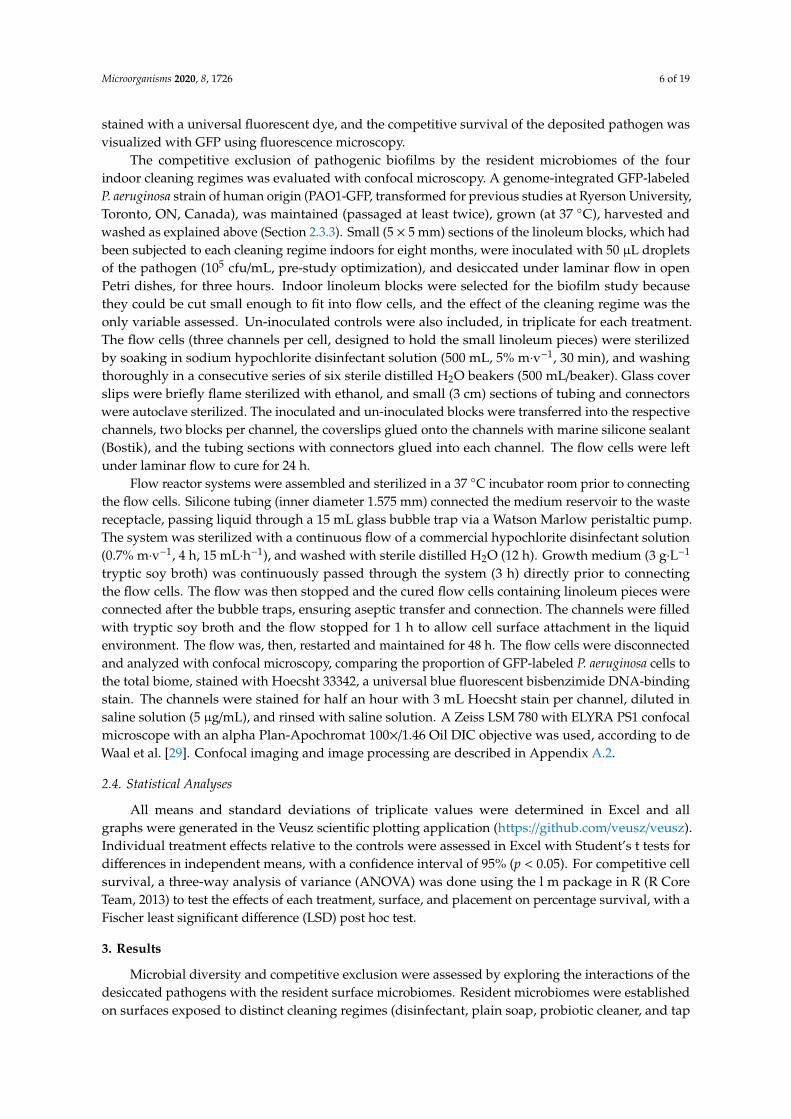
The competitive exclusion of pathogenic biofilms by the resident microbiomes of the fourindoor cleaning regimes was evaluated with confocal microscopy. A genome-integrated GFP-labeledP. aeruginosa strain of human origin (PAO1-GFP, transformed for previous studies at Ryerson University,Toronto, ON, Canada), was maintained (passaged at least twice), grown (at 37 ◦C), harvested andwashed as explained above (Section 2.3.3). Small (5 × 5 mm) sections of the linoleum blocks, which hadbeen subjected to each cleaning regime indoors for eight months, were inoculated with 50 µL dropletsof the pathogen (105 cfu/mL, pre-study optimization), and desiccated under laminar flow in openPetri dishes, for three hours. Indoor linoleum blocks were selected for the biofilm study becausethey could be cut small enough to fit into flow cells, and the effect of the cleaning regime was theonly variable assessed. Un-inoculated controls were also included, in triplicate for each treatment.The flow cells (three channels per cell, designed to hold the small linoleum pieces) were sterilizedby soaking in sodium hypochlorite disinfectant solution (500 mL, 5% m·v−1, 30 min), and washingthoroughly in a consecutive series of six sterile distilled H2O beakers (500 mL/beaker). Glass coverslips were briefly flame sterilized with ethanol, and small (3 cm) sections of tubing and connectorswere autoclave sterilized. The inoculated and un-inoculated blocks were transferred into the respectivechannels, two blocks per channel, the coverslips glued onto the channels with marine silicone sealant(Bostik), and the tubing sections with connectors glued into each channel. The flow cells were leftunder laminar flow to cure for 24 h.
Flow reactor systems were assembled and sterilized in a 37 ◦C incubator room prior to connectingthe flow cells. Silicone tubing (inner diameter 1.575 mm) connected the medium reservoir to the wastereceptacle, passing liquid through a 15 mL glass bubble trap via a Watson Marlow peristaltic pump.The system was sterilized with a continuous flow of a commercial hypochlorite disinfectant solution(0.7% m·v−1, 4 h, 15 mL·h−1), and washed with sterile distilled H2O (12 h). Growth medium (3 g·L−1
tryptic soy broth) was continuously passed through the system (3 h) directly prior to connectingthe flow cells. The flow was then stopped and the cured flow cells containing linoleum pieces wereconnected after the bubble traps, ensuring aseptic transfer and connection. The channels were filledwith tryptic soy broth and the flow stopped for 1 h to allow cell surface attachment in the liquidenvironment. The flow was, then, restarted and maintained for 48 h. The flow cells were disconnectedand analyzed with confocal microscopy, comparing the proportion of GFP-labeled P. aeruginosa cells tothe total biome, stained with Hoecsht 33342, a universal blue fluorescent bisbenzimide DNA-bindingstain. The channels were stained for half an hour with 3 mL Hoecsht stain per channel, diluted insaline solution (5 µg/mL), and rinsed with saline solution. A Zeiss LSM 780 with ELYRA PS1 confocalmicroscope with an alpha Plan-Apochromat 100×/1.46 Oil DIC objective was used, according to deWaal et al. [29]. Confocal imaging and image processing are described in Appendix A.2.
2.4. Statistical Analyses
All means and standard deviations of triplicate values were determined in Excel and allgraphs were generated in the Veusz scientific plotting application (https://github.com/veusz/veusz).Individual treatment effects relative to the controls were assessed in Excel with Student’s t tests fordifferences in independent means, with a confidence interval of 95% (p < 0.05). For competitive cellsurvival, a three-way analysis of variance (ANOVA) was done using the l m package in R (R CoreTeam, 2013) to test the effects of each treatment, surface, and placement on percentage survival, with aFischer least significant difference (LSD) post hoc test.
3. Results
Microbial diversity and competitive exclusion were assessed by exploring the interactions of thedesiccated pathogens with the resident surface microbiomes. Resident microbiomes were establishedon surfaces exposed to distinct cleaning regimes (disinfectant, plain soap, probiotic cleaner, and tap

Microorganisms 2020, 8, 1726 7 of 19
water control), on three surface materials (ceramic, linoleum, and stainless steel), placed indoors andoutdoors. After eight months of cleaning, the resident microbiome of each surface was assessed forcell concentration and diversity. Subsequently, the clinical pathogens were deposited on each surfaceand desiccated, and the competitive dynamics were quantified in terms of culturable cell survival andbiofilm proliferation. Because surface-air interfaces are considered to be extreme environments [30] itis necessary to optimize all techniques at the low end of detection thresholds.
3.1. Resident Populations: Impact of Cleaning Regimes
To understand the competitive survival of pathogens deposited and desiccated on a surface,we first needed to understand the resident surface microbiome of each eight-month cleaning regime.Therefore, we compared the cell concentrations (culturing) and the diversity (ARISA) of the residentmicrobiomes. The impact of a cleaning regime on competitive exclusion was the primary focus;however, we also compared the effects of the surface materials and of indoor and outdoor placement.
Intuitively, total cell numbers followed an increasing trend, with the lowest cell numbers foundfor cleaning with disinfectant, followed by plain soap, the control, and the probiotic cleaner. Total cellnumbers per block were consistently higher outdoors than indoors for all cleaning regimes except theprobiotic cleaner (p < 0.05, Student’s t-test of independent means). Probiotic cleaning established asurface cell population per block that was exponentially higher than for the other cleaning regimes,with the probiotic loads being much the same for indoor and outdoor placement. Probiotic cell numberswere lower on stainless steel (104 < 105 cfu/block) than on linoleum and ceramic (both 105 < 106 cfu/block)(p < 0.05, Student’s t-test of independent means). The E. coli and S. aureus concentrations in the residentmicrobiome population on the surface materials were quantified as a baseline, for subtraction duringinoculation and desiccation experiments. Baseline concentrations were sporadic, not higher than101 < 102 cfu/block (Figure 1). The cloths, being rough, had higher total E. coli and S. aureus cellconcentrations per square than any of the surface materials. The resident E. coli cell concentrationswere higher than the S. aureus cell concentrations on the cloths, for both indoor and outdoor cleaning(p < 0.05, Student’s t-test for independent means).
Microorganisms 2020, 8, x 7 of 19
cell concentration and diversity. Subsequently, the clinical pathogens were deposited on each surface and desiccated, and the competitive dynamics were quantified in terms of culturable cell survival and biofilm proliferation. Because surface-air interfaces are considered to be extreme environments [30] it is necessary to optimize all techniques at the low end of detection thresholds.
3.1. Resident Populations: Impact of Cleaning Regimes
To understand the competitive survival of pathogens deposited and desiccated on a surface, we first needed to understand the resident surface microbiome of each eight-month cleaning regime. Therefore, we compared the cell concentrations (culturing) and the diversity (ARISA) of the resident microbiomes. The impact of a cleaning regime on competitive exclusion was the primary focus; however, we also compared the effects of the surface materials and of indoor and outdoor placement.
Intuitively, total cell numbers followed an increasing trend, with the lowest cell numbers found for cleaning with disinfectant, followed by plain soap, the control, and the probiotic cleaner. Total cell numbers per block were consistently higher outdoors than indoors for all cleaning regimes except the probiotic cleaner (p < 0.05, Student’s t-test of independent means). Probiotic cleaning established a surface cell population per block that was exponentially higher than for the other cleaning regimes, with the probiotic loads being much the same for indoor and outdoor placement. Probiotic cell numbers were lower on stainless steel (104 < 105 cfu/block) than on linoleum and ceramic (both 105 < 106 cfu/block) (p < 0.05, Student’s t-test of independent means). The E. coli and S. aureus concentrations in the resident microbiome population on the surface materials were quantified as a baseline, for subtraction during inoculation and desiccation experiments. Baseline concentrations were sporadic, not higher than 101 < 102 cfu/block (Figure 1). The cloths, being rough, had higher total E. coli and S. aureus cell concentrations per square than any of the surface materials. The resident E. coli cell concentrations were higher than the S. aureus cell concentrations on the cloths, for both indoor and outdoor cleaning (p < 0.05, Student’s t-test for independent means).
Figure 1. Impact of an eight-month cleaning regime (tap water control, plain soap, disinfectant, and probiotic cleaner) on microbial numbers of microbiomes on three surfaces, i.e., ceramic, linoleum and stainless steel, and on cloths used to wipe surfaces. Indoors (A) and outdoors (B) microbiomes are compared. The microbiome was assessed on tryptic soy agar (TSA, total), MacConkey agar (MA, Escherichia coli), mannitol salt agar (MSA, Staphylococcus aureus). Results are expressed as mean ± SD of four swab samples.
The microbiome alpha diversity (the species diversity within a sample) on the indoor linoleum blocks followed an unexpected trend in response to the cleaning regimes. The exponential Shannon
Figure 1. Impact of an eight-month cleaning regime (tap water control, plain soap, disinfectant,and probiotic cleaner) on microbial numbers of microbiomes on three surfaces, i.e., ceramic, linoleum andstainless steel, and on cloths used to wipe surfaces. Indoors (A) and outdoors (B) microbiomesare compared. The microbiome was assessed on tryptic soy agar (TSA, total), MacConkey agar(MA, Escherichia coli), mannitol salt agar (MSA, Staphylococcus aureus). Results are expressed asmean ± SD of four swab samples.
Microorganisms 2020, 8, 1726 8 of 19
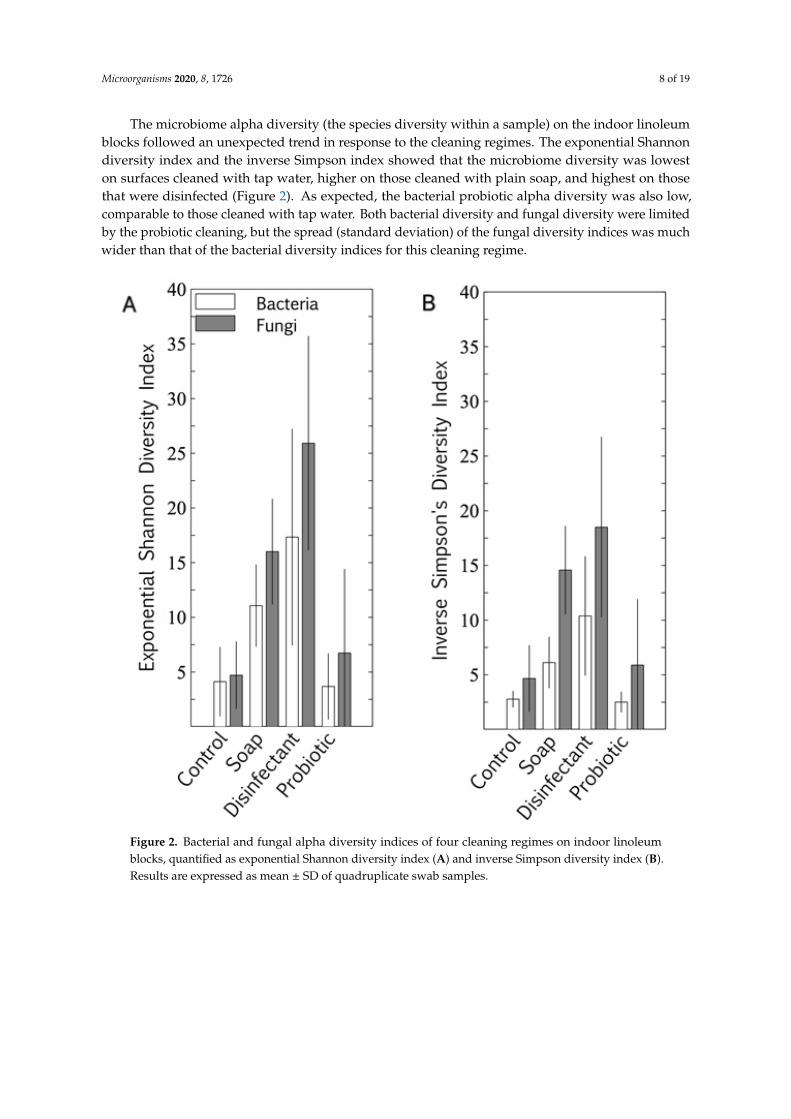
The microbiome alpha diversity (the species diversity within a sample) on the indoor linoleumblocks followed an unexpected trend in response to the cleaning regimes. The exponential Shannondiversity index and the inverse Simpson index showed that the microbiome diversity was loweston surfaces cleaned with tap water, higher on those cleaned with plain soap, and highest on thosethat were disinfected (Figure 2). As expected, the bacterial probiotic alpha diversity was also low,comparable to those cleaned with tap water. Both bacterial diversity and fungal diversity were limitedby the probiotic cleaning, but the spread (standard deviation) of the fungal diversity indices was muchwider than that of the bacterial diversity indices for this cleaning regime.
Microorganisms 2020, 8, x 8 of 19
diversity index and the inverse Simpson index showed that the microbiome diversity was lowest on surfaces cleaned with tap water, higher on those cleaned with plain soap, and highest on those that were disinfected (Figure 2). As expected, the bacterial probiotic alpha diversity was also low, comparable to those cleaned with tap water. Both bacterial diversity and fungal diversity were limited by the probiotic cleaning, but the spread (standard deviation) of the fungal diversity indices was much wider than that of the bacterial diversity indices for this cleaning regime.
Figure 2. Bacterial and fungal alpha diversity indices of four cleaning regimes on indoor linoleum blocks, quantified as exponential Shannon diversity index (A) and inverse Simpson diversity index (B). Results are expressed as mean ± SD of quadruplicate swab samples.
The prokaryotic and eukaryotic beta diversity (differences in species diversity between ecosystems) also provided comparative information on the diversity of the surfaces, with tightly associated points on the graph representing lower diversity. Eukaryotic diversity was higher than prokaryotic diversity, as is evident in both the alpha (Figure 2) and beta (Figure 3) diversity plots. The beta diversity indices showed less resolution than the alpha diversity indices. All four cleaning regimes had distinct yet generally overlapping beta diversity plots, with only the probiotic cleaning regime indicating a notably tight and unique bacterial diversity footprint (Figure 3A). The predominance of morphologically uniform Bacillus spores was clearly visible on the linoleum surfaces, both indoor and outdoor, cleaned with probiotic cleaner (see Appendix B and Figure A1).
Figure 2. Bacterial and fungal alpha diversity indices of four cleaning regimes on indoor linoleumblocks, quantified as exponential Shannon diversity index (A) and inverse Simpson diversity index (B).Results are expressed as mean ± SD of quadruplicate swab samples.

Microorganisms 2020, 8, 1726 9 of 19
The prokaryotic and eukaryotic beta diversity (differences in species diversity between ecosystems)also provided comparative information on the diversity of the surfaces, with tightly associated points onthe graph representing lower diversity. Eukaryotic diversity was higher than prokaryotic diversity, as isevident in both the alpha (Figure 2) and beta (Figure 3) diversity plots. The beta diversity indices showedless resolution than the alpha diversity indices. All four cleaning regimes had distinct yet generallyoverlapping beta diversity plots, with only the probiotic cleaning regime indicating a notably tightand unique bacterial diversity footprint (Figure 3A). The predominance of morphologically uniformBacillus spores was clearly visible on the linoleum surfaces, both indoor and outdoor, cleaned withprobiotic cleaner (see Appendix B and Figure A1).Microorganisms 2020, 8, x 9 of 19
Figure 3. Bacterial (A) and fungal (B) beta diversity plots comparing community composition impacts of four cleaning regimes on indoor linoleum blocks. Each dot represents one of four swabs per cleaning regime, each plotted separately.
3.2. Pathogen Persistence: Impact of Cleaning Regimes
We used a multivariate ANOVA with Fischer LSD post hoc analysis to compare the competitive survival of clinical E. coli and S. aureus strains in the four cleaning regime microbiomes. These pathogens were deposited and desiccated on the surfaces (ceramic, linoleum, and stainless steel), indoors and outdoors, which had been cleaned for eight months with distinct regimes (control, plain soap, disinfectant, and probiotic cleaner). This made it possible to differentiate between the viable survival responses of the clinical strains, adapted to physiological conditions, and those of the resident surface microbiome, adapted to ambient conditions. The results suggested that surface type had an impact on the pathogens’ tolerance of desiccation at the air-surface interface. E. coli survived best when desiccated on ceramic and S. aureus on stainless steel. The desiccation persistence of both the deposited pathogens was most pronounced on the control and disinfected surfaces (the latter thoroughly rinsed of disinfectant residue). The plain soap and the probiotic cleaner both limited the survival of the pathogens more than the disinfectant and tap water controls (Figure 4).
Figure 3. Bacterial (A) and fungal (B) beta diversity plots comparing community composition impactsof four cleaning regimes on indoor linoleum blocks. Each dot represents one of four swabs per cleaningregime, each plotted separately.
3.2. Pathogen Persistence: Impact of Cleaning Regimes
We used a multivariate ANOVA with Fischer LSD post hoc analysis to compare the competitivesurvival of clinical E. coli and S. aureus strains in the four cleaning regime microbiomes. These pathogenswere deposited and desiccated on the surfaces (ceramic, linoleum, and stainless steel), indoors andoutdoors, which had been cleaned for eight months with distinct regimes (control, plain soap,disinfectant, and probiotic cleaner). This made it possible to differentiate between the viable survivalresponses of the clinical strains, adapted to physiological conditions, and those of the resident surfacemicrobiome, adapted to ambient conditions. The results suggested that surface type had an impacton the pathogens’ tolerance of desiccation at the air-surface interface. E. coli survived best whendesiccated on ceramic and S. aureus on stainless steel. The desiccation persistence of both the depositedpathogens was most pronounced on the control and disinfected surfaces (the latter thoroughly rinsedof disinfectant residue). The plain soap and the probiotic cleaner both limited the survival of thepathogens more than the disinfectant and tap water controls (Figure 4).
Microorganisms 2020, 8, 1726 10 of 19Microorganisms 2020, 8, x 10 of 19
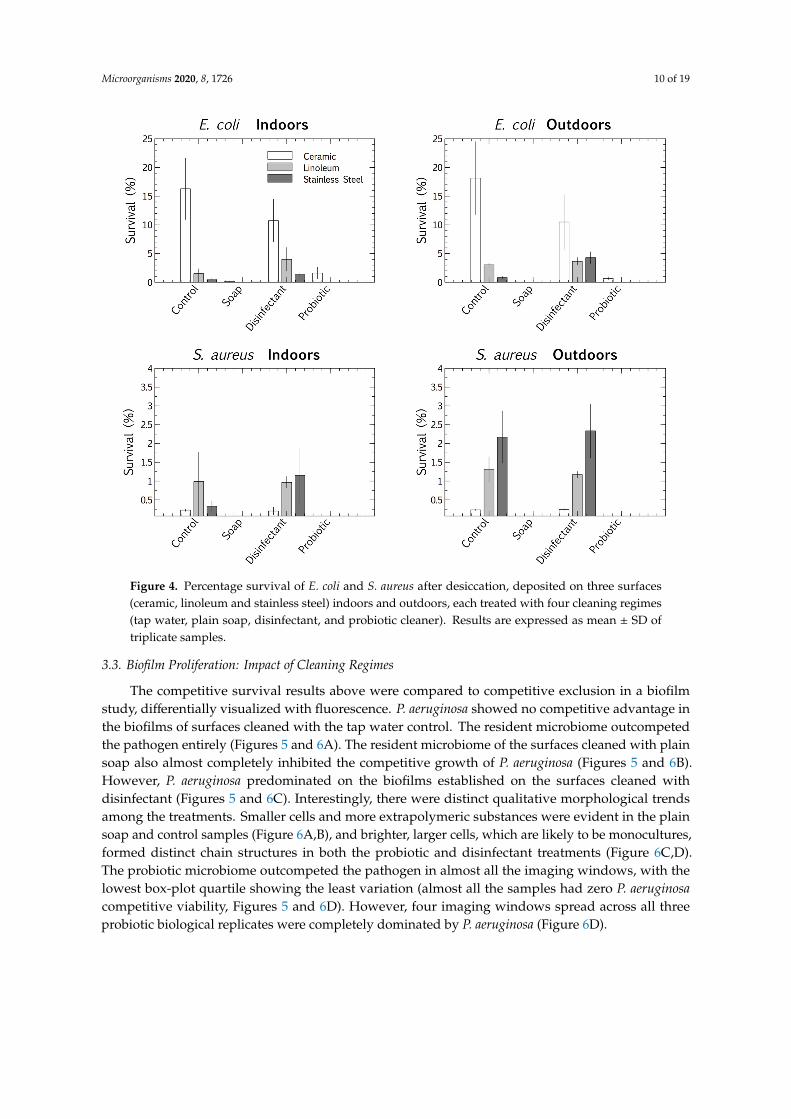
Figure 4. Percentage survival of E. coli and S. aureus after desiccation, deposited on three surfaces (ceramic, linoleum and stainless steel) indoors and outdoors, each treated with four cleaning regimes (tap water, plain soap, disinfectant, and probiotic cleaner). Results are expressed as mean ± SD of triplicate samples.
3.3. Biofilm Proliferation: Impact of Cleaning Regimes
The competitive survival results above were compared to competitive exclusion in a biofilm study, differentially visualized with fluorescence. P. aeruginosa showed no competitive advantage in the biofilms of surfaces cleaned with the tap water control. The resident microbiome outcompeted the pathogen entirely (Figure 5 and Figure 6A). The resident microbiome of the surfaces cleaned with plain soap also almost completely inhibited the competitive growth of P. aeruginosa (Figure 5 and Figure 6B). However, P. aeruginosa predominated on the biofilms established on the surfaces cleaned with disinfectant (Figure 5 and Figure 6C). Interestingly, there were distinct qualitative morphological trends among the treatments. Smaller cells and more extrapolymeric substances were evident in the plain soap and control samples (Figure 6A,B), and brighter, larger cells, which are likely to be monocultures, formed distinct chain structures in both the probiotic and disinfectant treatments (Figure 6C,D). The probiotic microbiome outcompeted the pathogen in almost all the imaging windows, with the lowest box-plot quartile showing the least variation (almost all the samples had zero P. aeruginosa competitive viability, Figure 5 and Figure 6D). However, four imaging windows spread across all three probiotic biological replicates were completely dominated by P. aeruginosa (Figure 6D).
Figure 4. Percentage survival of E. coli and S. aureus after desiccation, deposited on three surfaces(ceramic, linoleum and stainless steel) indoors and outdoors, each treated with four cleaning regimes(tap water, plain soap, disinfectant, and probiotic cleaner). Results are expressed as mean ± SD oftriplicate samples.
3.3. Biofilm Proliferation: Impact of Cleaning Regimes
The competitive survival results above were compared to competitive exclusion in a biofilmstudy, differentially visualized with fluorescence. P. aeruginosa showed no competitive advantage inthe biofilms of surfaces cleaned with the tap water control. The resident microbiome outcompetedthe pathogen entirely (Figures 5 and 6A). The resident microbiome of the surfaces cleaned with plainsoap also almost completely inhibited the competitive growth of P. aeruginosa (Figures 5 and 6B).However, P. aeruginosa predominated on the biofilms established on the surfaces cleaned withdisinfectant (Figures 5 and 6C). Interestingly, there were distinct qualitative morphological trendsamong the treatments. Smaller cells and more extrapolymeric substances were evident in the plainsoap and control samples (Figure 6A,B), and brighter, larger cells, which are likely to be monocultures,formed distinct chain structures in both the probiotic and disinfectant treatments (Figure 6C,D).The probiotic microbiome outcompeted the pathogen in almost all the imaging windows, with thelowest box-plot quartile showing the least variation (almost all the samples had zero P. aeruginosacompetitive viability, Figures 5 and 6D). However, four imaging windows spread across all threeprobiotic biological replicates were completely dominated by P. aeruginosa (Figure 6D).

Microorganisms 2020, 8, 1726 11 of 19Microorganisms 2020, 8, x 11 of 19
Figure 5. Biofilm proliferation of Pseudomonas aeruginosa-GFP in competition with the resident surface microbiome assessed between cleaning regimes (tap water, plain soap, disinfectant, and probiotic cleaner) using confocal microscopy. Post-desiccation competitive biofilm growth was calculated as % pathogen (green, P. aeruginosa) over the total microbiome (blue, Hoescht 537). Box and whisker plots represent averages of three flow cells, three images per flow cell (nine images per treatment, three biological replicates, all images at least 1 cm distant from each other).
Figure 5. Biofilm proliferation of Pseudomonas aeruginosa-GFP in competition with the resident surfacemicrobiome assessed between cleaning regimes (tap water, plain soap, disinfectant, and probioticcleaner) using confocal microscopy. Post-desiccation competitive biofilm growth was calculated as% pathogen (green, P. aeruginosa) over the total microbiome (blue, Hoescht 537). Box and whiskerplots represent averages of three flow cells, three images per flow cell (nine images per treatment,three biological replicates, all images at least 1 cm distant from each other).
Microorganisms 2020, 8, x 11 of 19
Figure 5. Biofilm proliferation of Pseudomonas aeruginosa-GFP in competition with the resident surface microbiome assessed between cleaning regimes (tap water, plain soap, disinfectant, and probiotic cleaner) using confocal microscopy. Post-desiccation competitive biofilm growth was calculated as % pathogen (green, P. aeruginosa) over the total microbiome (blue, Hoescht 537). Box and whisker plots represent averages of three flow cells, three images per flow cell (nine images per treatment, three biological replicates, all images at least 1 cm distant from each other).
Figure 6. Direct visualization, using confocal microscopy, of the total microbiome (top panel of eachimage, blue) and P. aeruginosa (bottom panel of each image, green). Abundance on indoor linoleumsquares was compared for tap water control (A), plain soap (B), disinfectant (C) and probiotic cleaner(D) treatments. The left and right sections of each panel (A–D) represent biological replicates, images oftwo separate flow cells per treatment. The 20 µm scale bar applies to all 16 panels.

Microorganisms 2020, 8, 1726 12 of 19
4. Discussion
4.1. Placement and Materials
As expected, outdoor placement resulted in higher baseline cell concentrations than indoors forall test conditions except those treated with the probiotic cleaner (Figure 1, p < 0.05, Student’s t-testof independent means). In the probiotic case, the cell numbers were between one and five ordersof magnitude higher than the surfaces treated with tap water, plain soap, or disinfectant, and hada relatively consistent microbial load (Figure 1). Despite the inherent and unavoidable variation inenvironmental studies, the statistical significance throughout the study is encouraging. This suggeststhat the treatment effects (the load of probiotic spores and the elimination of the surface microbiome withdisinfection) supersede the impact of natural environmental variation. However, the reproducibilityof this study, similar to many applied studies, is fundamentally limited due to the wide variation ofenvironmental factors.
In the case of the resident microbiomes, measured as surface microbial load, stainless steel had amore negative effect outdoors than indoors on the efficacy of the probiotic cleaner (Figure 1, p < 0.05,Student’s t-test for independent means). The surface microbial load was 10-fold lower on outdoorstainless-steel surfaces. This may have been due to metal ions on stainless steel surfaces influencingsurface attachment, particularly with the added stress of ambient UV exposure and wind outdoors.It has been shown that spores such as Bacillus have a net negative charge similar to the net negativesurface charge of stainless steel [31]. These repulsive forces may influence the surface attachment ofthe probiotic spores, making these dried surface communities more sensitive to wind disturbance orUV stress than they would be on linoleum or ceramic.
Surface material plays a role in pathogen survival, and surface roughness is an importantfactor [32,33]. Cloths hosted a higher cellular concentration per square than any of the smoothsurfaces (Figure 1), supporting the idea that surface roughness, and thus porosity, promotes cellularattachment [32], and also supporting studies warning that fibrous cleaning materials can act as apathogen reservoir for recontamination [34].
Surface materials also had a species-specific impact on the competitive desiccation toleranceof the pathogens (Figure 4). E. coli was most persistent on ceramic surfaces, whereas the moredesiccation-tolerant Gram-positive species, S. aureus, was most persistent on stainless steel. The ionicsurface charge and reflective nature of stainless steel, which probably increases UV exposure, may havestimulated dormancy desiccation responses in S. aureus. Oxidative, radiation, and desiccation stressstimulate effective dormancy responses and thus may promote survival [35]. Therefore, the surfacecharge and reflective nature of stainless steel may stimulate a stress response during desiccation,promoting dormancy, and thus survival.
4.2. Resident Microbiome
Cleaning with plain soap and disinfectant increased resident surface-microbiome diversity morethan cleaning with water (Figures 2 and 3) and cell concentrations were decreased (Figure 1). A studyhas shown that using disinfectant to clean can increase diversity because it removes the predominantspecies, increasing the relative abundance of species usually masked in richer environments by fastergrowers [36]. However, another study has shown the opposite, that disinfectant decreases microbialdiversity [37]. Thus, the change in diversity may depend on the diversity of the pre-disinfectionmicrobiome, the efficiency of the disinfection, and the underlying diversity of the populations maskedby high cell numbers. In our study, beta diversity plots showed relatively weak distinction betweentreatments, only clearly highlighting the low prokaryotic diversity of probiotic surfaces (Figure 3A).Alpha diversity plots indicated lower diversity in both the control and probiotic samples, and thecombination of the alpha and beta diversity plots indicated that probiotic cleaner markedly inhibitedthe total prokaryotic surface diversity (Figures 2 and 3), despite exponentially higher microbial loadson the surfaces treated with probiotic cleaner (Figure 1).
Microorganisms 2020, 8, 1726 13 of 19
4.3. Competitive Exclusion: Survival and Biofilm Growth
These microbiomes left on surfaces cleaned with the four cleaning regimes had distinct influenceson the persistence of pathogens, measured by culturable survival (E. coli and S. aureus, Figure 4).However, a different story emerged in the competitive biofilms, after a clinical pathogen (P. aeruginosa)was desiccated on the surfaces, and the total surface microbiomes were grown with the desiccatedpathogen under biofilm conditions (37 ◦C).
The microbiomes on the surfaces cleaned with tap water promoted the quantifiable desiccationtolerance of clinical E. coli and S. aureus strains better than those on the surfaces cleaned with plain soapor probiotic cleaner (Figure 4), probably because of the protective particulate matter on these surfaces,which were visibly dirtier than those cleaned by the other methods. Scanning electron microscopydemonstrated the association of cells with particulate matter on control surfaces, such as soil, threads,and pollen (see Appendix B and Figure A1). This protective association with particulate matter isa commonly reported occurrence, especially for desiccation tolerant Gram-positive organisms [38].However, in contrast to culturable cell survival, the desiccated P. aeruginosa clinical pathogen wascompletely outcompeted in a biofilm by the resident control surface microbiome (Figures 5 and 6A),which had high cell numbers (Figure 1), supporting the competitive exclusion principle.
The microbiomes on the surfaces cleaned with disinfectant also promoted the quantifiabledesiccation survival of E. coli and S. aureus better than those on the surfaces cleaned with plain soapand probiotic cleaner (Figure 4), but unlike the situation on the control surfaces, this was probablydue to low resident cell numbers, and thus low competitive pressure (Figure 1). This hypothesiswas supported, as biofilms grown post-desiccation were completely dominated by the desiccatedclinical pathogen P. aeruginosa (Figures 5 and 6C). Scanning electron microscopy also revealed that thedisinfectant had damaged the linoleum surface, which did not happen with the probiotic cleaner orplain soap, another reason to shift from heavy reliance on disinfectants (Appendix B and Figure A1).
Cleaning surfaces with plain soap did not limit the resident microbial load as much as thedisinfectant (Figure 1), and the resident microbiome demonstrated more diversity than was thecase with probiotic cleaner (Figures 2 and 3). This microbiome limited both the culturable survivaland the competitive biofilm growth of all the desiccated clinical pathogens (Figures 4, 5 and 6B).Cleaning with probiotic cleaner resulted in a resident microbiome cell concentration exponentiallyhigher than was the case with the other three treatments (Figure 1), which limited the culturablesurvival of desiccated pathogens (Figure 4), as predicted by the competitive exclusion principle.However, the crux of these results is that, when grown under biofilm conditions after pathogendesiccation, the probiotic monoculture had a lower competitive advantage against the pathogen thanthe plain soap surface microbiomes (Figures 5 and 6). Most of the samples were outcompeted by theprobiotic cells (low box-plot quartile, Figure 5), again supporting the competitive exclusion principle,but there were a few localized areas across all three probiotic biofilms where P. aeruginosa outcompetedthe probiotic spores (Figure 6D).
The probiotic and the plain soap microbiomes both reduced the number of culturable pathogensthat survived; however, when grown under biofilm conditions, the plain soap microbiome was moreeffective against P. aeruginosa than the probiotic microbiome. The combined alpha and beta diversityindices of the probiotic microbiome showed a drastic limitation in diversity as compared with theother three treatments. Although the control and the probiotic sample had a similar alpha diversity,the beta diversity revealed that diversity was more limited in the probiotic samples. According to thecompetitive exclusion principle, the exponentially higher probiotic cell numbers should outcompetethe pathogen more effectively than the microbiome of the surfaces treated with plain soap. Our resultsshowed the opposite, suggesting that both diversity and cell numbers were important for competitiveexclusion. The natural diversity and the cell concentrations established by a plain soap cleaning regimeproved to be the most effective cleaning strategy within the limitations of this study. Although diversityhas been proven to contribute to the competitive exclusion principle [39], this has not leached intopopular practice or industrial probiotic cleaner composition. Most probiotic cleaners consist of a
Microorganisms 2020, 8, 1726 14 of 19
patented Bacillus spore consortium or lactic acid bacteria [40–43]. This study raises practical awarenessabout diversity in the built environment. It has the potential to inform the diversity engineering inprobiotic cleaners, and it raises questions about the quantitative extent to which diversity influencesthe competitive exclusion of opportunistic pathogens. For instance, PROBAC© has engineereddiversity into their product [44], including photosynthetic bacteria, yeast, and lactic acid bacteria.However, we know of no studies exploring the quantitative thresholds of diversity that have ameasurable impact on competitive exclusion.
5. Conclusions
This study showed that, by inhibiting the resident microbiome on surfaces, disinfectants stronglypromote the survival of deposited pathogens. The use of probiotic cleaners to limit nosocomial infectionsis gaining interest and commercial traction, with numerous reports of their efficacy in forming stablesurface biofilms, and thus excluding pathogens [3,45].
Our cell survival results support these studies. We found that plain soap and probiotic cleanerwere equally effective in excluding pathogens (Figure 4). Our probiotic cleaner, like most such products,contained only a patented Bacillus spore consortium. Such a heavy predominance of one genus in anatural environment is rare. Studies have shown that Bacillus spores, even at high concentrations,are not an infection risk [46]. The primary benefit of probiotic cleaning systems is the externalstrains they introduce into hospitals, demonstrably lowering the antimicrobial resistance of surfacemicrobiomes [9,42,47]. Nevertheless, there is little natural precedent for this skewed monoculturebiomimicry, and the ecological impacts of the probiotic approach are not yet understood.
We found that cleaning with plain soap promoted greater surface microbiome diversity thancleaning with the probiotic cleaner, which suggests that plain soap cleaning is better for promotingbiofilm regrowth. To overcome the probiotic cleaner’s tendency to limit microbiome diversity, and toovercome antimicrobial resistance in hospitals, we suggest that diversity in probiotic cleanersshould be investigated as a contributor to competitive exclusion. For general household cleaning,where antimicrobial resistance is not a factor, our study suggests it is best to use plain soaps, rather thandisinfectants or probiotic cleaners.
This study suggests a shift away from reliance on disinfectants, to plain or probiotic soaps ingeneral hospital cleaning protocols. However, cleaning protocols are specific to national regulations,and hospital areas. Operating theatres must be disinfected. General waiting areas, bathrooms, walls,and floors all have distinct cleaning protocols, with unique disinfection frequencies. We selected acleaning frequency to represent the general areas, walls, etc. This also reflects more general householdand business cleaning regimes, widening the impact of the results. However, a more frequent cleaningregime might impact these conclusions. Thus, a controlled in situ study in general hospital areas,using in situ cleaning regimes, would add weight to these conclusions. We also conclude that a widertoolbox than culturable survival is necessary to assess the competitive exclusion of pathogens.
Our measurements of the culturable survival of desiccated pathogens after our eight-monthcleaning regimes supported the competitive exclusion principle, i.e., the resident microbiome hadoutcompeted the pathogens. Both the plain soap and the probiotic cleaner fostered competitiveexclusion far more effectively than the disinfectant. However, when we looked at biofilm growth tomeasure the competitive exclusion of desiccated pathogens by the resident surface microbiomes, thepicture that emerged showed that both microbial numbers and diversity were important for competitiveexclusion. Although cleaning with the probiotic cleaner resulted in exponentially higher surfacemicrobial loads than cleaning with the plain soap, the biofilm competitive exclusion was lower for thismonoculture probiotic application. Therefore, we conclude that microbial diversity is as important ascell numbers for competitive exclusion, which is an important consideration when assessing methodsfor improving the microbial ecological health of the built environment, especially a hospital.
Microorganisms 2020, 8, 1726 15 of 19
Author Contributions: W.S. obtained funding, conceptualized, and designed the study, led collaborations,performed experiments and wrote the bulk of the manuscript; J.T. carried out the first half of the laboratory basedexperiments, assisted with collaborations, and wrote a significant part of the paper; K.T. assisted with the geneticanalyses in the study; G.M.W. hosted the research; K.T. and G.M.W. edited the paper, providing valuable insightsand ideas. All authors have read and agreed to the published version of the manuscript.
Funding: W.S. gratefully received funding from the Claude Leon Foundation of South Africa. The study reflectsonly the authors’ views and is independent of the Foundation.
Acknowledgments: The authors gratefully acknowledge Casper Brink (Sporatec, South Africa), for help inquantifying molecular community composition (ARISA); Lize Engelbrecht (Fluorescence Microscopy Unit,Central Analytical Facilities, Stellenbosch University), for invaluable assistance with confocal microscopy;Lydia Marie Joubert (Electron Microscopy Unit, Central Analytical Facility, Stellenbosch University), for expertsupport in scanning electron microscopy; Martin Kidd (Stellenbosch University Centre for Statistical Consultation),for assistance with multivariate statistical analyses; Mae Newton-Foot (Stellenbosch University MedicalMicrobiology), for facilitating the provision of strains; and the coordinating staff at the Unit for Infection Controland Prevention at Tygerberg Hospital (Western Cape, South Africa), for providing hospital cleaning protocols.
Conflicts of Interest: The authors declare no conflict of interest and the funders had no role in the design of thestudy; in the collection, analyses, or interpretation of data; in the writing of the manuscript, or in the decision topublish the results.
Appendix A
Appendix A.1. Methods 1. ARISA Sequencing and Data Processing
Amplicons were run on an ABI 2010XL genetic analyzer, generating electropherograms quantifyingfragment length and fluorescent intensity. ARISA PCR samples were run with the LIZ1200 sizestandard. Genemapper 5 software converted the fluorescence data to peaks of different fragmentlengths, termed operational taxonomic units (OTUs). The peak heights indicated the relative abundanceof the fragments in the sample. The fragment lengths were calculated by using a best-fit curve of thesize standards [48]. The OTUs were defined by fragment sizes from 100 to 1000 base pairs and peakheights above 150 fluorescent units. A bin size of 3 bp minimized the ARISA profile inaccuracies [48].Data was analyzed using the Vegan package in R [49].
Appendix A.2. Methods 2. Confocal Microscopy Imaging and Image Processing
For Hoecsht, the 405 nm excitation laser was used, with the emission measured at 451 nm,detected between 415 and 487 nm. For GFP, the 488 nm excitation laser was used, with emissionmeasured at 546 nm, detected between 493 and 598 nm. Z-stacks were acquired with a 2.5 µmstep width, and processed with the ZEN 2012 software (Zeiss, Germany, 3D composite images,no adjustment of intensity). JPEG images were processed by cropping directly inside the axes of thecomposite images, and cells per image were quantified in Image J [50]. Background was subtractedand thresholds were adjusted according to the cell sizes, which differed considerably depending onthe treatment. Downstream image processing corrected for clumped individual cells, by convertingimages to masks and subsequent binary watershed. Particle analysis excluded background lowerthan 10 pixels and circularity was limited to 0, since many cells were rod shaped. Outlines weregenerated for quality control comparison with original images, and settings adjusted accordingly.Each treatment was analyzed as a biological triplicate (three separate flow channels per treatment,three per un-inoculated control, randomly arranged in the flow cells). Three images were capturedper channel, each image at a distance of at least 1 cm from any other image, resulting in nine imagesper treatment. Approximately 200 to 900 cells per image (0.03 mm3 biofilm section) were counted.P. aeruginosa competitive viability was quantified as the percentage of GFP over Hoecsht (total) cellsper treatment.
Microorganisms 2020, 8, 1726 16 of 19
Appendix B. Surface and Microbiome Visualization: Scanning Electron Microscopy
Appendix B.1. Materials and Methods
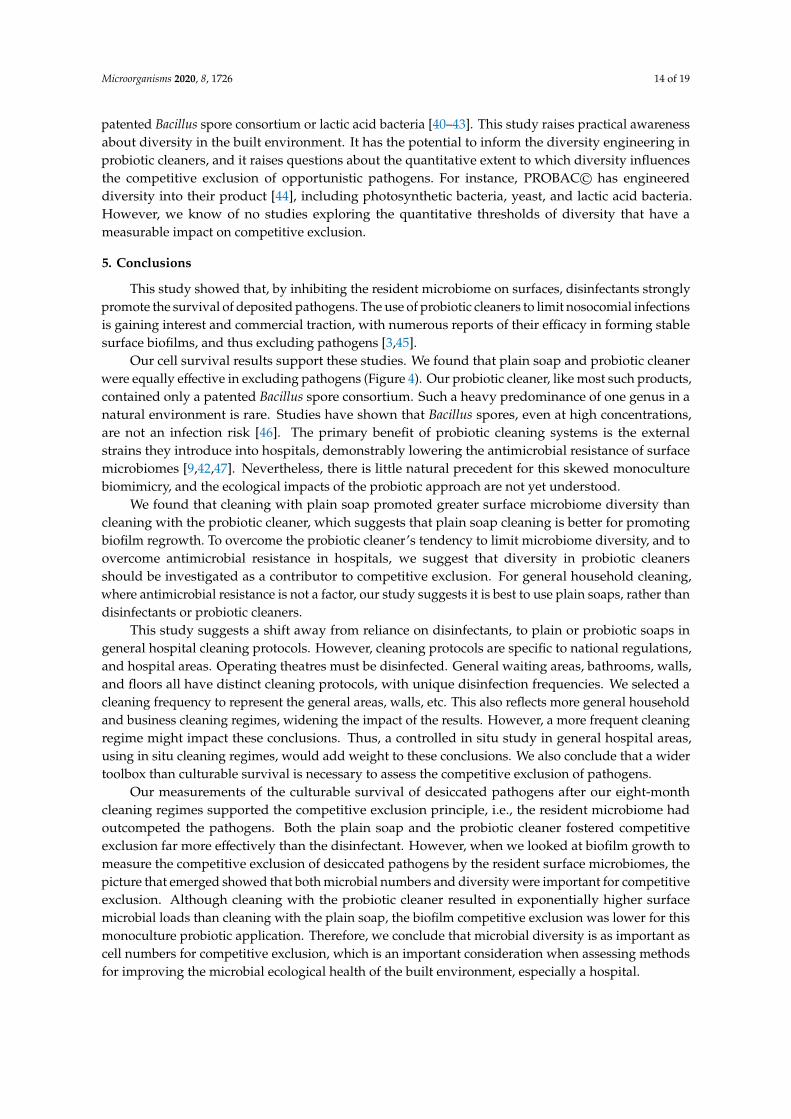
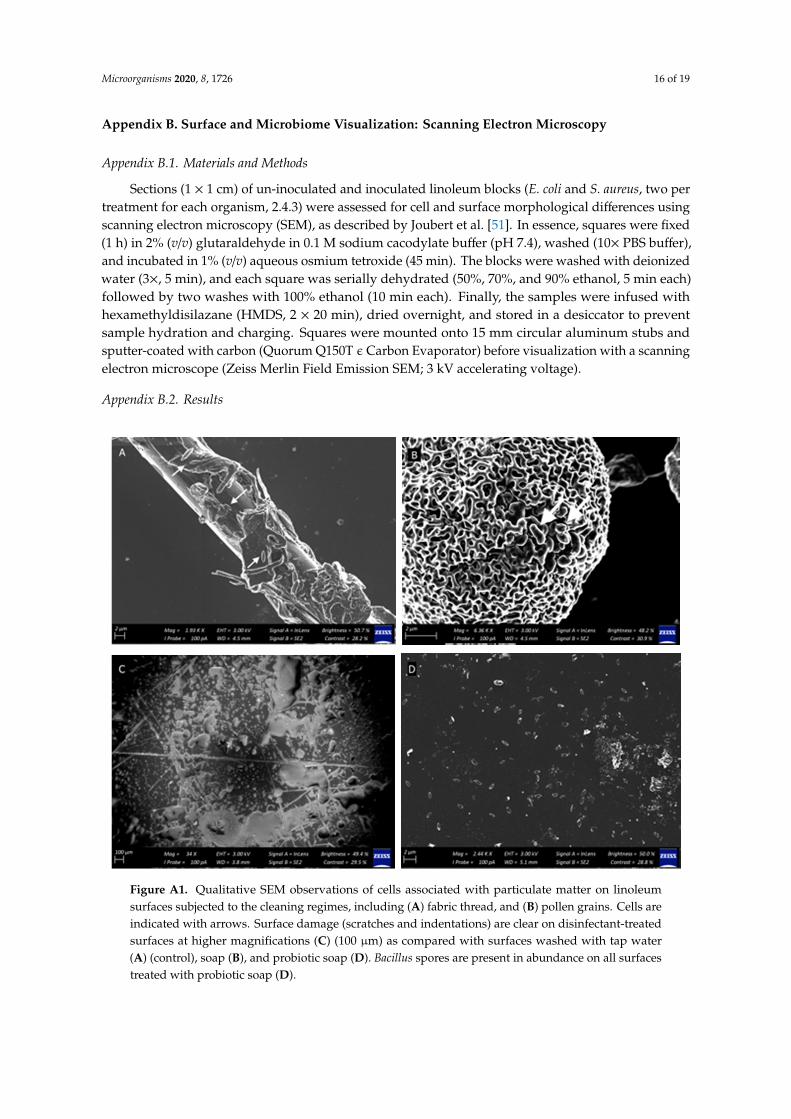
Sections (1 × 1 cm) of un-inoculated and inoculated linoleum blocks (E. coli and S. aureus, two pertreatment for each organism, 2.4.3) were assessed for cell and surface morphological differences usingscanning electron microscopy (SEM), as described by Joubert et al. [51]. In essence, squares were fixed(1 h) in 2% (v/v) glutaraldehyde in 0.1 M sodium cacodylate buffer (pH 7.4), washed (10× PBS buffer),and incubated in 1% (v/v) aqueous osmium tetroxide (45 min). The blocks were washed with deionizedwater (3×, 5 min), and each square was serially dehydrated (50%, 70%, and 90% ethanol, 5 min each)followed by two washes with 100% ethanol (10 min each). Finally, the samples were infused withhexamethyldisilazane (HMDS, 2 × 20 min), dried overnight, and stored in a desiccator to preventsample hydration and charging. Squares were mounted onto 15 mm circular aluminum stubs andsputter-coated with carbon (Quorum Q150T ε Carbon Evaporator) before visualization with a scanningelectron microscope (Zeiss Merlin Field Emission SEM; 3 kV accelerating voltage).
Appendix B.2. Results
Microorganisms 2020, 8, x 16 of 19
aeruginosa competitive viability was quantified as the percentage of GFP over Hoecsht (total) cells per treatment.
Appendix B. Surface and Microbiome Visualization: Scanning Electron Microscopy
Appendix B.1. Materials and Methods
Sections (1 × 1 cm) of un-inoculated and inoculated linoleum blocks (E. coli and S. aureus, two per treatment for each organism, 2.4.3) were assessed for cell and surface morphological differences using scanning electron microscopy (SEM), as described by Joubert et al. [51]. In essence, squares were fixed (1 h) in 2% (v/v) glutaraldehyde in 0.1 M sodium cacodylate buffer (pH 7.4), washed (10× PBS buffer), and incubated in 1% (v/v) aqueous osmium tetroxide (45 min). The blocks were washed with deionized water (3×, 5 min), and each square was serially dehydrated (50%, 70%, and 90% ethanol, 5 min each) followed by two washes with 100% ethanol (10 min each). Finally, the samples were infused with hexamethyldisilazane (HMDS, 2 × 20 min), dried overnight, and stored in a desiccator to prevent sample hydration and charging. Squares were mounted onto 15 mm circular aluminum stubs and sputter-coated with carbon (Quorum Q150T ϵ Carbon Evaporator) before visualization with a scanning electron microscope (Zeiss Merlin Field Emission SEM; 3 kV accelerating voltage).
Appendix B.2. Results
Figure A1. Qualitative SEM observations of cells associated with particulate matter on linoleum surfaces subjected to the cleaning regimes, including (A) fabric thread, and (B) pollen grains. Cells are indicated with arrows. Surface damage (scratches and indentations) are clear on disinfectant-treated surfaces at higher magnifications (C) (100 μm) as compared with surfaces washed with tap water (A) (control), soap (B), and probiotic soap (D). Bacillus spores are present in abundance on all surfaces treated with probiotic soap (D).
Figure A1. Qualitative SEM observations of cells associated with particulate matter on linoleumsurfaces subjected to the cleaning regimes, including (A) fabric thread, and (B) pollen grains. Cells areindicated with arrows. Surface damage (scratches and indentations) are clear on disinfectant-treatedsurfaces at higher magnifications (C) (100 µm) as compared with surfaces washed with tap water(A) (control), soap (B), and probiotic soap (D). Bacillus spores are present in abundance on all surfacestreated with probiotic soap (D).
Microorganisms 2020, 8, 1726 17 of 19
References
1. Lax, S.; Gilbert, J.A. Hospital-associated microbiota and implications for nosocomial infections.Trends Mol. Med. 2015, 21, 427–432. [CrossRef]
2. Weinstein, R.A.; Hota, B. Contamination, Disinfection, and Cross-Colonization: Are Hospital SurfacesReservoirs for Nosocomial Infection? Clin. Infect. Dis. 2004, 39, 1182–1189. [CrossRef] [PubMed]
3. Vandini, A.; Temmerman, R.; Frabetti, A.; Caselli, E.; Antonioli, P.; Balboni, P.G.; Mazzacane, S. Hard surfacebiocontrol in hospitals using microbial-based cleaning products. PLoS ONE 2014, 9. [CrossRef]
4. Mann, E.E.; Manna, D.; Mettetal, M.R.; May, R.M.; Dannemiller, E.M.; Chung, K.K.; Reddy, S.T.Surface micropattern limits bacterial contamination. Antimicrob. Resist. Infect. Control. 2014, 3, 28. [CrossRef]
5. Mora, M.; Mahnert, A.; Koskinen, K.; Pausan, M.R.; Oberauner-Wappis, L.; Krause, R.; Moissl-Eichinger, C.Microorganisms in confined habitats: Microbial monitoring and control of intensive care units,operating rooms, cleanrooms and the international space station. Front. Microbiol. 2016. [CrossRef]
6. Wand, M.E.; Bock, L.J.; Bonney, L.C.; Sutton, J.M. Mechanisms of increased resistance to chlorhexidine andcross-resistance to colistin following exposure of Klebsiella pneumoniae clinical isolates to chlorhexidine.Antimicrob. Agents Chemother. 2017, 61, e01162-16. [CrossRef] [PubMed]
7. Aslam, B.; Wang, W.; Arshad, M.I.; Khurshid, M.; Muzammil, S.; Rasool, M.H.; Salamat, M.K.F. Infection and DrugResistance Dovepress Antibiotic resistance: A rundown of a global crisis. Infect. Drug Resist. 2018. [CrossRef]
8. World Health Organization. Health Care-Associated Infections Fact Sheet. 2017. Available online:http://www.who.int/gpsc/country_work/gpsc_ccisc_fact_sheet_en.pdf (accessed on 12 April 2018).
9. D’Accolti, M.; Soffritti, I.; Mazzacane, S.; Caselli, E. Fighting AMR in the healthcare environment: Microbiome-basedsanitation approaches and monitoring tools. Int. J. Mol. Sci. 2019, 20, 1535. [CrossRef] [PubMed]
10. Ventola, C.L. The antibiotic resistance crisis: Part 1: Causes and threats. Pharm. Ther. 2015, 40, 277.11. Tezel, U.; Pavlostathis, S.G. Quaternary ammonium disinfectants: Microbial adaptation, degradation and
ecology. Curr. Opin. Biotechnol. 2015, 33, 296–304. [CrossRef]12. Dunne, S.S.; Ahonen, M.; Modic, M.; Crijns, F.R.; Keinänen-Toivola, M.M.; Meinke, R.; Dunne, C.P.
Specialized cleaning associated with antimicrobial coatings for reduction of hospital-acquired infection:Opinion of the COST Action Network AMiCI (CA15114). J. Hosp. Infect. 2018, 99, 250–255. [CrossRef]
13. Abt, M.C.; Pamer, E.G. Commensal bacteria mediated defenses against pathogens. Curr. Opin. Immunol.2014, 16–22. [CrossRef]
14. Hibbing, M.E.; Fuqua, C.; Parsek, M.R.; Peterson, S.B. Bacterial competition: Surviving and thriving in themicrobial jungle. Nat. Rev. Microbiol. 2010, 15–25. [CrossRef]
15. Marco, M.L.; Heeney, D.; Binda, S.; Cifelli, C.J.; Cotter, P.D.; Foligné, B.; Smid, E.J. Health benefits of fermentedfoods: Microbiota and beyond. Curr. Opin. Biotech. 2017, 44, 94–102. [CrossRef]
16. Finlay, B.B.; Arrieta, M.C. Let Them Eat Dirt: Saving Your Child from an Oversanitized World; Algonquin Books:New York, NY, USA, 2016.
17. Sha, S.; Liang, J.; Chen, M.; Xu, B.; Liang, C.; Wei, N.; Wu, K. Systematic review: Faecal microbiotatransplantation therapy for digestive and nondigestive disorders in adults and children. Aliment. Pharm. Therap.2014, 39, 1003–1032. [CrossRef]
18. Falagas, M.E.; Makris, G.C. Probiotic bacteria and biosurfactants for nosocomial infection control:A hypothesis. J. Hosp. Infect. 2009, 71, 301–306. [CrossRef]
19. Kembel, S.W.; Jones, E.; Kline, J.; Northcutt, D.; Stenson, J.; Womack, A.M.; Green, J.L. Architectural designinfluences the diversity and structure of the built environment microbiome. ISME J. 2012, 6, 1469–1479. [CrossRef]
20. Berg, G.; Mahnert, A.; Moissl-Eichinger, C. Beneficial effects of plant-associated microbes on indoormicrobiomes and human health? Front. Microbiol. 2014. [CrossRef]
21. Available online: http://www.healthierhospitals.org/ (accessed on 6 August 2019).22. Available online: https://noharm.org/ (accessed on 6 August 2019).23. Available online: https://practicegreenhealth.org/ (accessed on 6 August 2019).24. Parat, S.; Perdrix, A.; Fricker-Hidalgo, H.; Saude, I.; Grillot, R.; Baconnier, P. Multivariate analysis comparing
microbial air content of an air-conditioned building and a naturally ventilated building over one year.Atmos. Environ. 1997, 31, 441–449. [CrossRef]

Microorganisms 2020, 8, 1726 18 of 19
25. Harrison, J.; Pickering, C.A.C.; Faragher, E.B.; Austwick, P.K.C.; Little, S.A.; Lawton, L. An investigation ofthe relationship between microbial and particulate indoor air pollution and the sick building syndrome.Resp. Med. 1992, 86, 225–235. [CrossRef]
26. Ronan, E.; Yeung, C.W.; Hausner, M.; Wolfaardt, G.M. Interspecies interaction extends bacterial survival atsolid-air interfaces. Biofouling 2013, 29, 1087–1096. [CrossRef]
27. Cardinale, M.; Brusetti, L.; Quatrini, P.; Borin, S.; Puglia, A.M.; Rizzi, A.; Daffonchio, D. Comparison ofdifferent primer sets for use in automated ribosomal intergenic spacer analysis of complex bacterialcommunities. Appl. Environ. Microbiol. 2004, 70, 6147–6156. [CrossRef]
28. White, T.J.; Bruns, T.; Lee, S.J.W.T.; Taylor, J. Amplification and direct sequencing of fungal ribosomal RNAgenes for phylogenetics. In PCR Protocols: A Guide to Methods and Applications; Innis, M.A., Gelfand, D.H.,Sninsky, J.J., White, T.J., Eds.; Academic Press Inc.: New York, NY, USA, 1990; Volume 18, pp. 315–322.
29. De Waal, G.M.; Engelbrecht, L.; Davis, T.; De Villiers, W.J.; Kell, D.B.; Pretorius, E. Correlative Light-ElectronMicroscopy detects lipopolysaccharide and its association with fibrin fibres in Parkinson’s Disease,Alzheimer’s Disease and Type 2 Diabetes Mellitus. Sci. Rep. 2018, 8, 16798. [CrossRef]
30. La Duc, M.T.; Dekas, A.; Osman, S.; Moissl, C.; Newcombe, D.; Venkateswaran, K. Isolation andcharacterization of bacteria capable of tolerating the extreme conditions of clean room environments.Appl. Environ. Microbiol. 2007, 73, 2600–2611. [CrossRef]
31. Palmer, J.; Flint, S.; Brooks, J. Bacterial cell attachment, the beginning of a biofilm. J. Ind. Microbiol. Biotechnol.2007, 34, 577–588. [CrossRef]
32. Morgan, T.D.; Wilson, M. The effects of surface roughness and type of denture acrylic on biofilm formationby Streptococcus oralis in a constant depth film fermentor. J. Appl. Microbiol. 2001, 91, 47–53. [CrossRef]
33. Gupta, M.; Bisesi, M.; Lee, J. Comparison of survivability of Staphylococcus aureus and spores of Aspergillusniger on commonly used floor materials. Am. J. Infect. Control 2017, 45, 717–722. [CrossRef]
34. Bergen, L.K.; Meyer, M.; Høg, M.; Rubenhagen, B.; Andersen, L.P. Spread of bacteria on surfaces whencleaning with microfibre cloths. J. Hosp. Infect. 2009, 71, 132–137. [CrossRef]
35. Moeller, R.; Stackebrandt, E.; Reitz, G.; Berger, T.; Rettberg, P.; Doherty, A.J.; Nicholson, W.L. Role of DNArepair by nonhomologous-end joining in Bacillus subtilis spore resistance to extreme dryness, mono-andpolychromatic UV, and ionizing radiation. J. Bacteriol. 2007, 189, 3306–3311. [CrossRef] [PubMed]
36. Baron, J.L.; Vikram, A.; Duda, S.; Stout, J.E.; Bibby, K. Shift in the microbial ecology of a hospital hotwater system following the introduction of an on-site monochloramine disinfection system. PLoS ONE2014, 9. [CrossRef]
37. Pourhajibagher, M.; Bahador, A. An in vivo evaluation of microbial diversity before and after thephoto-activated disinfection in primary endodontic infections: Traditional phenotypic and molecularapproaches. Photodiag. Photodyn. Ther. 2018, 22, 19–25. [CrossRef] [PubMed]
38. Tringe, S.G.; Zhang, T.; Liu, X.; Yu, Y.; Lee, W.H.; Yap, J.; Rohwer, F. The airborne metagenome in an indoorurban environment. PLoS ONE 2008, 3. [CrossRef]
39. Dillon, R.J.; Vennard, C.T.; Buckling, A.; Charnley, A.K. Diversity of locust gut bacteria protects againstpathogen invasion. Ecol. Lett. 2005, 8, 1291–1298. [CrossRef]
40. Available online: https://countercultureclean.com/products/baby-got-bac$-$2-pack (accessed on 6 August 2019).41. Available online: https://www.probioclean.com/faq/ (accessed on 6 August 2019).42. Available online: https://mrsmartins.co.za/product/mrs-martins-probiotic-surface-soap$-$500mL-aluminium/
(accessed on 6 August 2019).43. Available online: https://patents.google.com/patent/CA2983075A1/en (accessed on 6 August 2019).44. Available online: https://www.probac.co.za/pages/the-probac-story (accessed on 6 August 2019).45. Caselli, E.; Brusaferro, S.; Coccagna, M.; Arnoldo, L.; Berloco, F.; Antonioli, P.; Conte, A.
Reducing healthcare-associated infections incidence by a probiotic-based sanitation system: A multicentre,prospective, intervention study. PLoS ONE 2018, 13. [CrossRef] [PubMed]
46. Caselli, E.; Antonioli, P.; Mazzacane, S. Safety of probiotics used for hospital environmental sanitation.J. Hosp. Infect. 2016, 94, 193. [CrossRef]
47. Caselli, E.; Arnoldo, L.; Rognoni, C.; D’Accolti, M.; Soffritti, I.; Lanzoni, L.; Mazzacane, S. Impact of aprobiotic-based hospital sanitation on antimicrobial resistance and HAI-associated antimicrobial consumptionand costs: A multicenter study. Dovepress 2019, 12, 501–510. [CrossRef]
Microorganisms 2020, 8, 1726 19 of 19
48. Joubert, L.M.; Ferreira, J.A.; Stevens, D.A.; Nazik, H.; Cegelski, L. Visualization of Aspergillus fumigatusbiofilms with Scanning Electron Microscopy and Variable Pressure-Scanning Electron Microscopy:A comparison of processing techniques. J. Microbiol. Methods. 2017, 132, 46–55. [CrossRef] [PubMed]
49. Slabbert, E.; Van Heerden, C.J.; Jacobs, K. Optimisation of automated ribosomal intergenic spacer analysisfor the estimation of microbial diversity in fynbos soil. S. Afr. J. Sci. 2010, 106, 1–4. [CrossRef]
50. R Core Team. R: A Language and Environment for Statistical Computing; R Foundation for Statistical Computing:Vienna, Austria, 2013; Available online: http://www.R-project.org/ (accessed on 10 December 2019).
51. Available online: https://imagej.nih.gov/ij/ (accessed on 10 December 2019).
Publisher’s Note: MDPI stays neutral with regard to jurisdictional claims in published maps and institutionalaffiliations.
© 2020 by the authors. Licensee MDPI, Basel, Switzerland. This article is an open accessarticle distributed under the terms and conditions of the Creative Commons Attribution(CC BY) license (http://creativecommons.org/licenses/by/4.0/).