Embed Size (px)
Citation preview
Page 1/22
Cortical Activation during Cooperative and CompetitiveJoint Actions in Children With and Without Autism SpectrumDisorder (ASD) – An fNIRS StudyWan-Chun Su
University of DelawareMcKenzie Culotta
University of DelawareDaisuke Tsuzuki
Tokyo Metropolitan UniversityAnjana Bhat ( [email protected] )
University of Delaware
Research Article
Keywords: Cooperative and Competitive Joint Actions, Autism Spectrum Disorder (ASD), spatio-temporal action errors
Posted Date: August 20th, 2021
DOI: https://doi.org/10.21203/rs.3.rs-820947/v1
License: This work is licensed under a Creative Commons Attribution 4.0 International License. Read Full License
Page 2/22
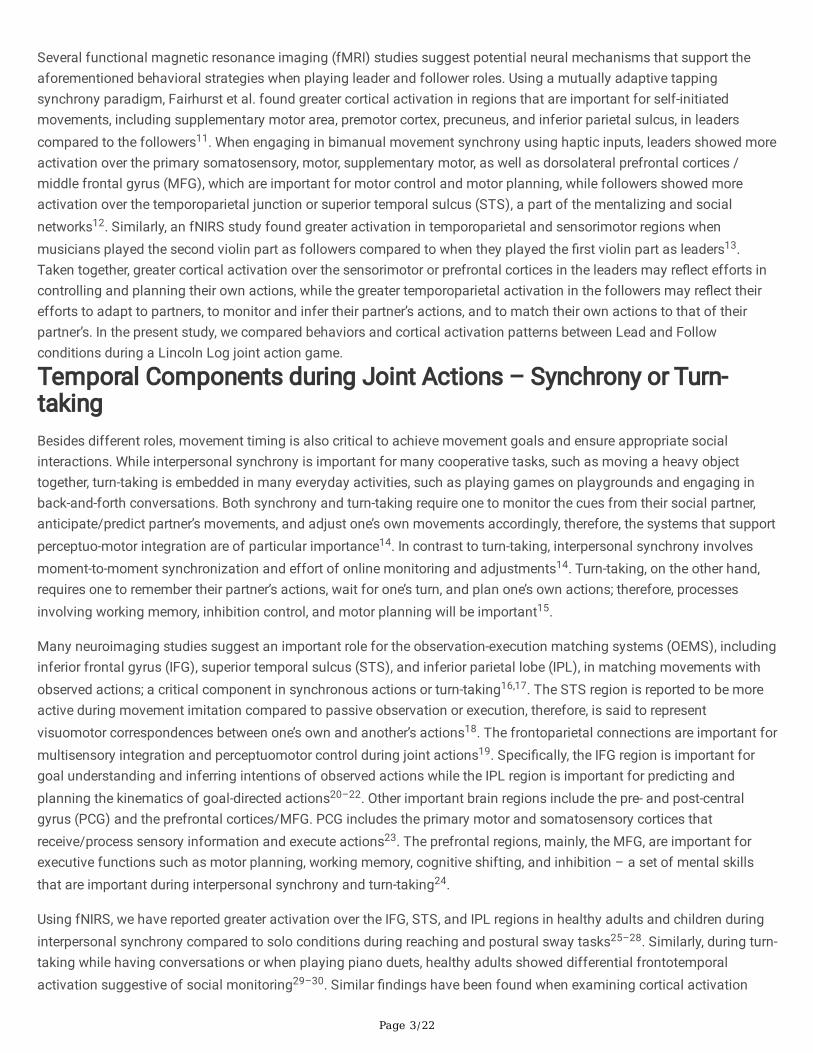
AbstractChildren with Autism Spectrum Disorder (ASD) have social communication and perceptuomotor di�culties that affecttheir ability to engage in various types of joint actions. In this study, we compared spatio-temporal action errors andfNIRS-related cortical activation between children with and without ASD during a Lincoln log joint action game requiringthem to play leader or follower roles, move in synchrony or while taking turns, and move cooperatively or competitivelywith an adult partner. Children with ASD had greater motor, planning, and spatial errors and took longer to complete thebuilding tasks compared to typically developing (TD) children. Children with ASD had lower superior temporal sulcus(STS) activation during Turn-take and Compete, and greater Inferior Parietal Lobe (IPL) activation during Lead and Turn-take compared to TD children. As joint action demands increased, TD children showed greater STS activation during Turn-take (vs. Synchrony) and Compete (vs. Cooperate) whereas children with ASD showed greater IPL activation during Leadand Compete (vs. Cooperate). Our �ndings suggest that children with ASD rely on self-generated action plans (i.e.,increased IPL activation) more than relying on their partner’s action cues (i.e., reduced STS activation) when performingjoint actions.
IntroductionAutism Spectrum Disorder (ASD) is a prevalent neurodevelopmental disorder affecting 1 in 54 children.1 Children withASD have primary impairments in social communication, including poor social reciprocity, verbal/nonverbalcommunication skills, as well as the presence of restricted and repetitive behaviors 2. Apart from the primary symptoms ofASD, they also present with sensorimotor comorbidities, such as movement incoordination and dyspraxia (i.e., di�cultiesin performing complex motor sequences)3–6, as well as poor executive functions, including poor attention shifting,working memory, response inhibition, and mental �exibility7. Together, these primary and comorbid impairmentscontribute to their di�culties in engaging in joint actions.
Joint actions are complex everyday activities that require one to play different roles (a leaders or followers), move withdifferent temporal demands (in-synchrony or when taking turns), and while using same or different goals (cooperatively-similar goal or competitive-different/opposite goals). These rich and variable contexts embedded within joint actionsprovide opportunities for motor learning and to build social connections with others8. Di�culties in performing jointactions could affect children with ASD’s abilities to learn new skills and establish/maintain social relationships5,9.Although studies have posited neural mechanisms underlying social interaction di�culties of children with ASD, corticalactivation patterns during different types of joint actions are not well understood. In this study, we use functional nearinfrared spectroscopy (fNIRS), a non-invasive neuroimaging technique that is robust against motion artifacts, toinvestigate cortical activation patterns during Lincoln Log-based joint action games that require children with and withoutASD to play leader/follower roles (Lead vs. Follow), move in synchrony or while taking turns (Lead, Follow vs. Turn-take),and while moving cooperatively or competitively with adult partners (Lead, Follow, and Turn-take vs. Compete).
Roles during Joint Actions – Leader or FollowerIndividuals play different roles during everyday joint actions by being a leader or a follower. For example, musicians followthe cues from the conductor to achieve musical harmony whereas the conductor leads and directs the orchestra. Basedon their roles within cooperative actions, individuals apply different movement strategies. Leaders tend to focus oninternally driven behaviors, including planning and monitoring of one’s own movements, whereas followers tend toperform externally driven behaviors, such as being socially aware and adjusting to the leader’s actions10. Speci�cally, withthe goal of moving together, it is said that leaders often reduce their movement variability so that their movements aremore predictable, while the followers prioritize reducing the timing gaps between their own and the leader’s actions10.
Page 3/22
Several functional magnetic resonance imaging (fMRI) studies suggest potential neural mechanisms that support theaforementioned behavioral strategies when playing leader and follower roles. Using a mutually adaptive tappingsynchrony paradigm, Fairhurst et al. found greater cortical activation in regions that are important for self-initiatedmovements, including supplementary motor area, premotor cortex, precuneus, and inferior parietal sulcus, in leaderscompared to the followers11. When engaging in bimanual movement synchrony using haptic inputs, leaders showed moreactivation over the primary somatosensory, motor, supplementary motor, as well as dorsolateral prefrontal cortices /middle frontal gyrus (MFG), which are important for motor control and motor planning, while followers showed moreactivation over the temporoparietal junction or superior temporal sulcus (STS), a part of the mentalizing and socialnetworks12. Similarly, an fNIRS study found greater activation in temporoparietal and sensorimotor regions whenmusicians played the second violin part as followers compared to when they played the �rst violin part as leaders13.Taken together, greater cortical activation over the sensorimotor or prefrontal cortices in the leaders may re�ect efforts incontrolling and planning their own actions, while the greater temporoparietal activation in the followers may re�ect theirefforts to adapt to partners, to monitor and infer their partner’s actions, and to match their own actions to that of theirpartner’s. In the present study, we compared behaviors and cortical activation patterns between Lead and Followconditions during a Lincoln Log joint action game.
Temporal Components during Joint Actions – Synchrony or Turn-takingBesides different roles, movement timing is also critical to achieve movement goals and ensure appropriate socialinteractions. While interpersonal synchrony is important for many cooperative tasks, such as moving a heavy objecttogether, turn-taking is embedded in many everyday activities, such as playing games on playgrounds and engaging inback-and-forth conversations. Both synchrony and turn-taking require one to monitor the cues from their social partner,anticipate/predict partner’s movements, and adjust one’s own movements accordingly, therefore, the systems that supportperceptuo-motor integration are of particular importance14. In contrast to turn-taking, interpersonal synchrony involvesmoment-to-moment synchronization and effort of online monitoring and adjustments14. Turn-taking, on the other hand,requires one to remember their partner’s actions, wait for one’s turn, and plan one’s own actions; therefore, processesinvolving working memory, inhibition control, and motor planning will be important15.
Many neuroimaging studies suggest an important role for the observation-execution matching systems (OEMS), includinginferior frontal gyrus (IFG), superior temporal sulcus (STS), and inferior parietal lobe (IPL), in matching movements withobserved actions; a critical component in synchronous actions or turn-taking16,17. The STS region is reported to be moreactive during movement imitation compared to passive observation or execution, therefore, is said to representvisuomotor correspondences between one’s own and another’s actions18. The frontoparietal connections are important formultisensory integration and perceptuomotor control during joint actions19. Speci�cally, the IFG region is important forgoal understanding and inferring intentions of observed actions while the IPL region is important for predicting andplanning the kinematics of goal-directed actions20–22. Other important brain regions include the pre- and post-centralgyrus (PCG) and the prefrontal cortices/MFG. PCG includes the primary motor and somatosensory cortices thatreceive/process sensory information and execute actions23. The prefrontal regions, mainly, the MFG, are important forexecutive functions such as motor planning, working memory, cognitive shifting, and inhibition – a set of mental skillsthat are important during interpersonal synchrony and turn-taking24.
Using fNIRS, we have reported greater activation over the IFG, STS, and IPL regions in healthy adults and children duringinterpersonal synchrony compared to solo conditions during reaching and postural sway tasks25–28. Similarly, during turn-taking while having conversations or when playing piano duets, healthy adults showed differential frontotemporalactivation suggestive of social monitoring29–30. Similar �ndings have been found when examining cortical activation
Page 4/22
during turn-taking interactions. During a table setting task, adults showed greater IPL activation during turn taking withanother partner vs. moving solo or when observing their partner’s actions31. In the current study, we compared behaviorsand cortical activation during naturalistic, Lincoln Log-based joint actions involving synchrony (Lead and Followconditions) and turn-taking (Turn-take condition) in children with and without ASD.
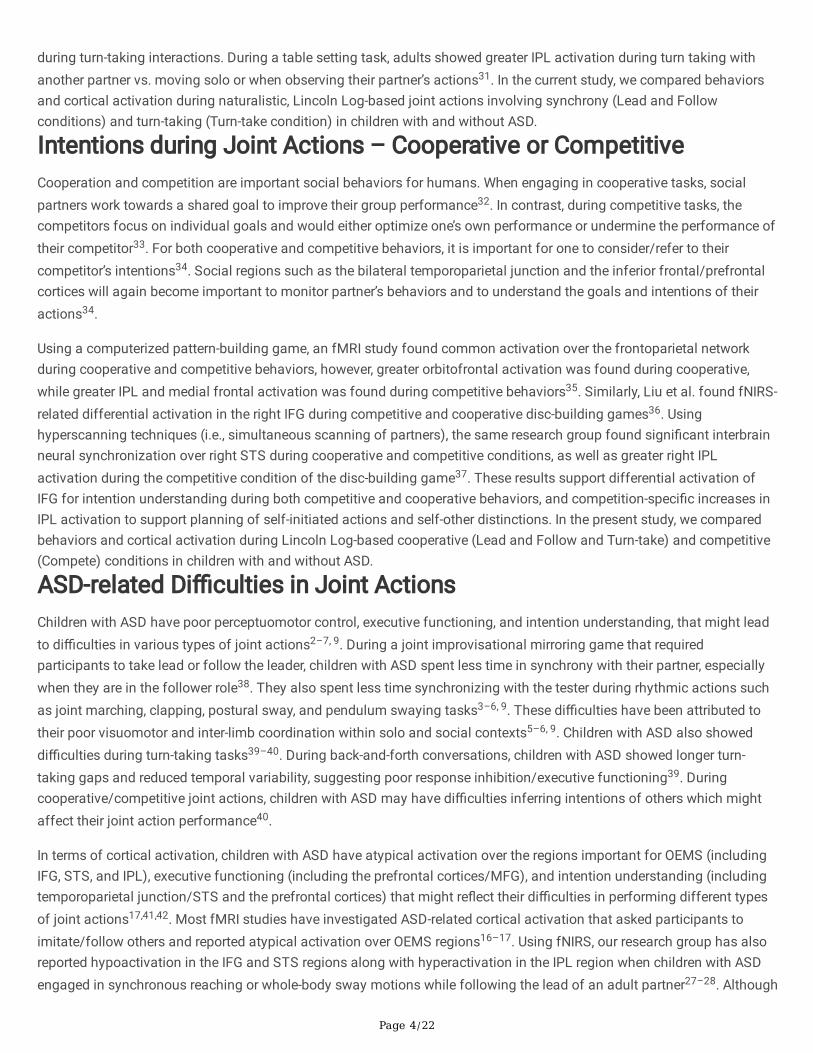
Intentions during Joint Actions – Cooperative or CompetitiveCooperation and competition are important social behaviors for humans. When engaging in cooperative tasks, socialpartners work towards a shared goal to improve their group performance32. In contrast, during competitive tasks, thecompetitors focus on individual goals and would either optimize one’s own performance or undermine the performance oftheir competitor33. For both cooperative and competitive behaviors, it is important for one to consider/refer to theircompetitor’s intentions34. Social regions such as the bilateral temporoparietal junction and the inferior frontal/prefrontalcortices will again become important to monitor partner’s behaviors and to understand the goals and intentions of theiractions34.
Using a computerized pattern-building game, an fMRI study found common activation over the frontoparietal networkduring cooperative and competitive behaviors, however, greater orbitofrontal activation was found during cooperative,while greater IPL and medial frontal activation was found during competitive behaviors35. Similarly, Liu et al. found fNIRS-related differential activation in the right IFG during competitive and cooperative disc-building games36. Usinghyperscanning techniques (i.e., simultaneous scanning of partners), the same research group found signi�cant interbrainneural synchronization over right STS during cooperative and competitive conditions, as well as greater right IPLactivation during the competitive condition of the disc-building game37. These results support differential activation ofIFG for intention understanding during both competitive and cooperative behaviors, and competition-speci�c increases inIPL activation to support planning of self-initiated actions and self-other distinctions. In the present study, we comparedbehaviors and cortical activation during Lincoln Log-based cooperative (Lead and Follow and Turn-take) and competitive(Compete) conditions in children with and without ASD.
ASD-related Di�culties in Joint ActionsChildren with ASD have poor perceptuomotor control, executive functioning, and intention understanding, that might leadto di�culties in various types of joint actions2–7, 9. During a joint improvisational mirroring game that requiredparticipants to take lead or follow the leader, children with ASD spent less time in synchrony with their partner, especiallywhen they are in the follower role38. They also spent less time synchronizing with the tester during rhythmic actions suchas joint marching, clapping, postural sway, and pendulum swaying tasks3–6, 9. These di�culties have been attributed totheir poor visuomotor and inter-limb coordination within solo and social contexts5–6, 9. Children with ASD also showeddi�culties during turn-taking tasks39–40. During back-and-forth conversations, children with ASD showed longer turn-taking gaps and reduced temporal variability, suggesting poor response inhibition/executive functioning39. Duringcooperative/competitive joint actions, children with ASD may have di�culties inferring intentions of others which mightaffect their joint action performance40.
In terms of cortical activation, children with ASD have atypical activation over the regions important for OEMS (includingIFG, STS, and IPL), executive functioning (including the prefrontal cortices/MFG), and intention understanding (includingtemporoparietal junction/STS and the prefrontal cortices) that might re�ect their di�culties in performing different typesof joint actions17,41,42. Most fMRI studies have investigated ASD-related cortical activation that asked participants toimitate/follow others and reported atypical activation over OEMS regions16–17. Using fNIRS, our research group has alsoreported hypoactivation in the IFG and STS regions along with hyperactivation in the IPL region when children with ASDengaged in synchronous reaching or whole-body sway motions while following the lead of an adult partner27–28. Although
Page 5/22
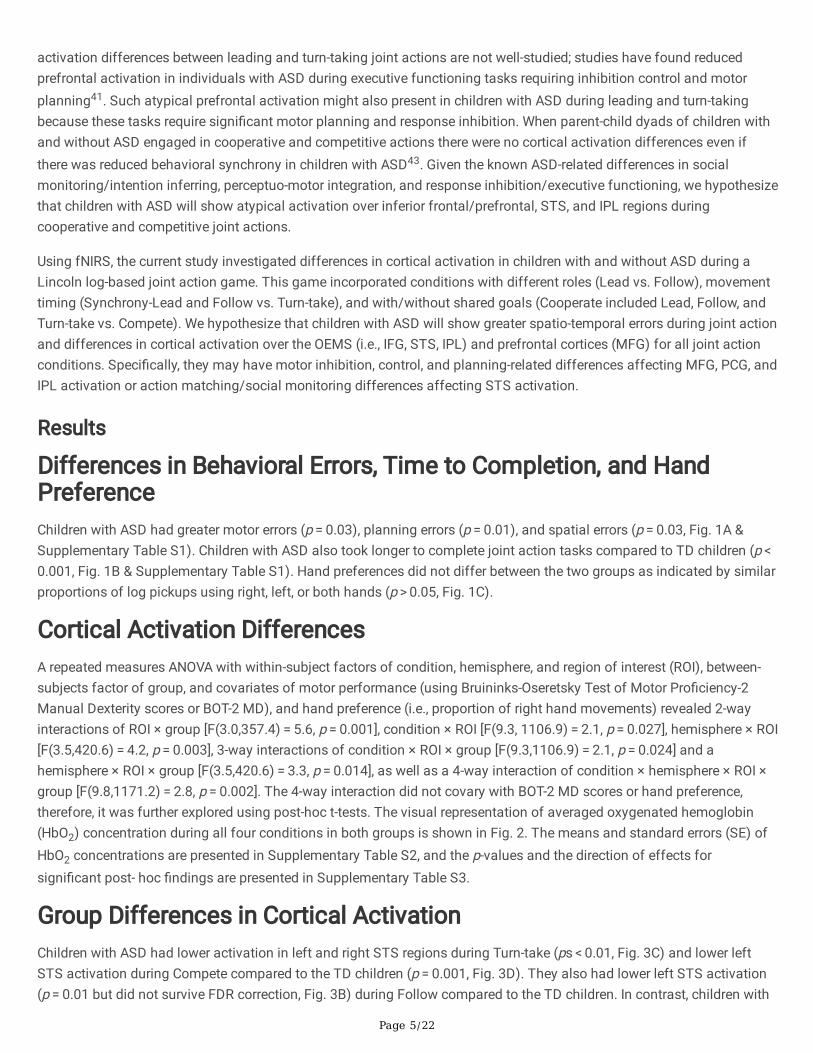
activation differences between leading and turn-taking joint actions are not well-studied; studies have found reducedprefrontal activation in individuals with ASD during executive functioning tasks requiring inhibition control and motorplanning41. Such atypical prefrontal activation might also present in children with ASD during leading and turn-takingbecause these tasks require signi�cant motor planning and response inhibition. When parent-child dyads of children withand without ASD engaged in cooperative and competitive actions there were no cortical activation differences even ifthere was reduced behavioral synchrony in children with ASD43. Given the known ASD-related differences in socialmonitoring/intention inferring, perceptuo-motor integration, and response inhibition/executive functioning, we hypothesizethat children with ASD will show atypical activation over inferior frontal/prefrontal, STS, and IPL regions duringcooperative and competitive joint actions.
Using fNIRS, the current study investigated differences in cortical activation in children with and without ASD during aLincoln log-based joint action game. This game incorporated conditions with different roles (Lead vs. Follow), movementtiming (Synchrony-Lead and Follow vs. Turn-take), and with/without shared goals (Cooperate included Lead, Follow, andTurn-take vs. Compete). We hypothesize that children with ASD will show greater spatio-temporal errors during joint actionand differences in cortical activation over the OEMS (i.e., IFG, STS, IPL) and prefrontal cortices (MFG) for all joint actionconditions. Speci�cally, they may have motor inhibition, control, and planning-related differences affecting MFG, PCG, andIPL activation or action matching/social monitoring differences affecting STS activation.
Results
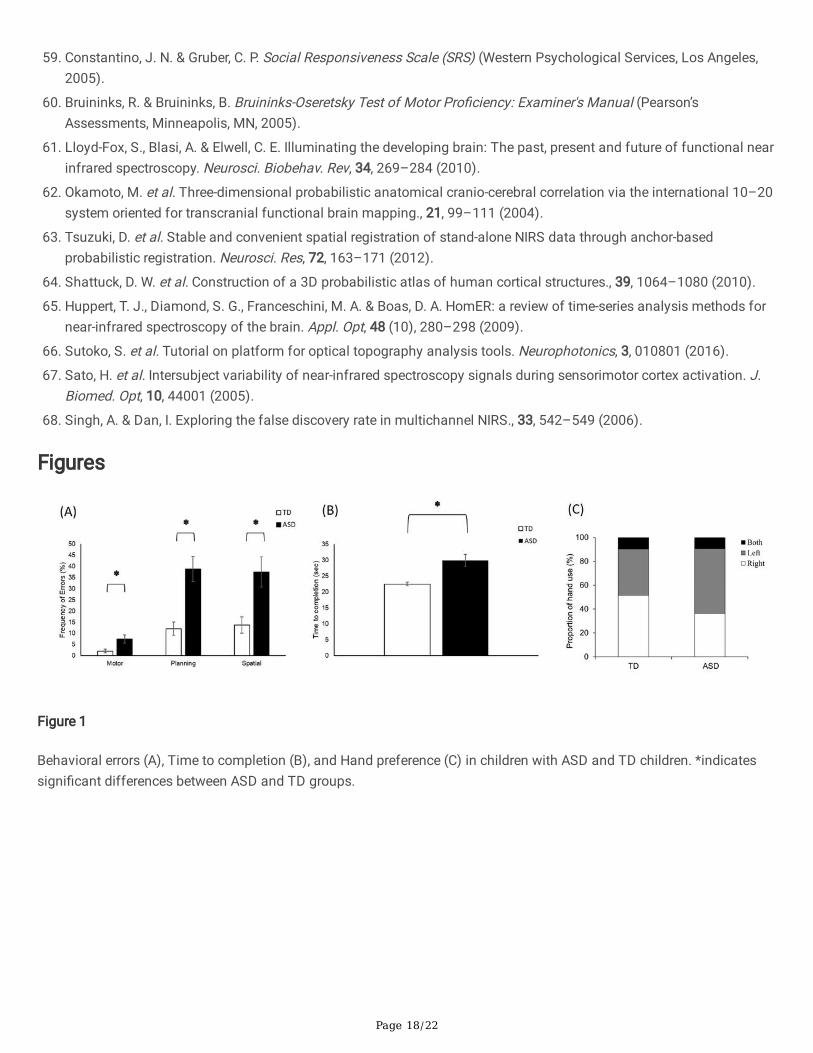
Differences in Behavioral Errors, Time to Completion, and HandPreferenceChildren with ASD had greater motor errors (p = 0.03), planning errors (p = 0.01), and spatial errors (p = 0.03, Fig. 1A &Supplementary Table S1). Children with ASD also took longer to complete joint action tasks compared to TD children (p < 0.001, Fig. 1B & Supplementary Table S1). Hand preferences did not differ between the two groups as indicated by similarproportions of log pickups using right, left, or both hands (p > 0.05, Fig. 1C).
Cortical Activation DifferencesA repeated measures ANOVA with within-subject factors of condition, hemisphere, and region of interest (ROI), between-subjects factor of group, and covariates of motor performance (using Bruininks-Oseretsky Test of Motor Pro�ciency-2Manual Dexterity scores or BOT-2 MD), and hand preference (i.e., proportion of right hand movements) revealed 2-wayinteractions of ROI × group [F(3.0,357.4) = 5.6, p = 0.001], condition × ROI [F(9.3, 1106.9) = 2.1, p = 0.027], hemisphere × ROI[F(3.5,420.6) = 4.2, p = 0.003], 3-way interactions of condition × ROI × group [F(9.3,1106.9) = 2.1, p = 0.024] and ahemisphere × ROI × group [F(3.5,420.6) = 3.3, p = 0.014], as well as a 4-way interaction of condition × hemisphere × ROI ×group [F(9.8,1171.2) = 2.8, p = 0.002]. The 4-way interaction did not covary with BOT-2 MD scores or hand preference,therefore, it was further explored using post-hoc t-tests. The visual representation of averaged oxygenated hemoglobin(HbO2) concentration during all four conditions in both groups is shown in Fig. 2. The means and standard errors (SE) ofHbO2 concentrations are presented in Supplementary Table S2, and the p-values and the direction of effects forsigni�cant post- hoc �ndings are presented in Supplementary Table S3.
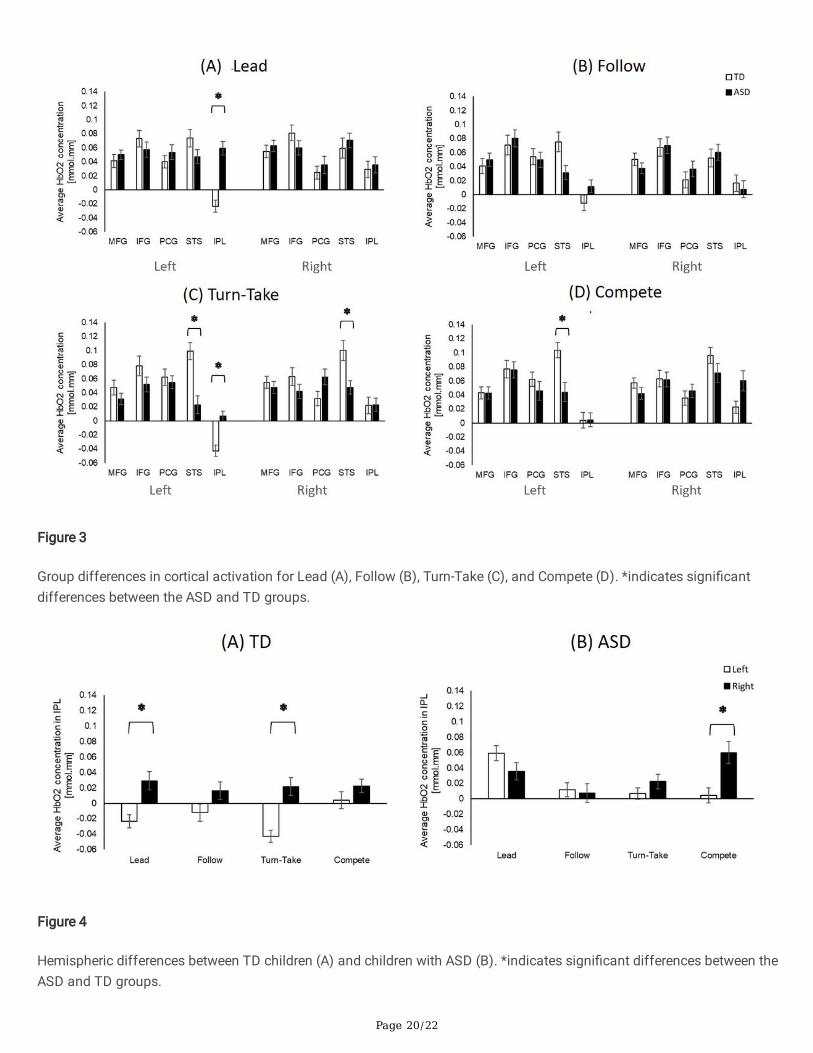
Group Differences in Cortical ActivationChildren with ASD had lower activation in left and right STS regions during Turn-take (ps < 0.01, Fig. 3C) and lower leftSTS activation during Compete compared to the TD children (p = 0.001, Fig. 3D). They also had lower left STS activation(p = 0.01 but did not survive FDR correction, Fig. 3B) during Follow compared to the TD children. In contrast, children with
Page 6/22
ASD had greater activation in the left IPL region during Lead and Turn-take compared to the TD children (ps < 0.001, Figs.3A and 3C).
Hemispheric Differences in ActivationFor both children with and without ASD, the hemispheric differences were found only in the IPL region, however, thecondition for hemispheric differences differs between groups. Speci�cally, greater right than left hemispheric activation(i.e., right lateralization) was found in the TD children during Lead and Turn-take (ps < 0.001, Fig. 4A), whereas in thechildren with ASD, a similar right lateralization pattern was found during Compete (p < 0.001, Fig. 4B).
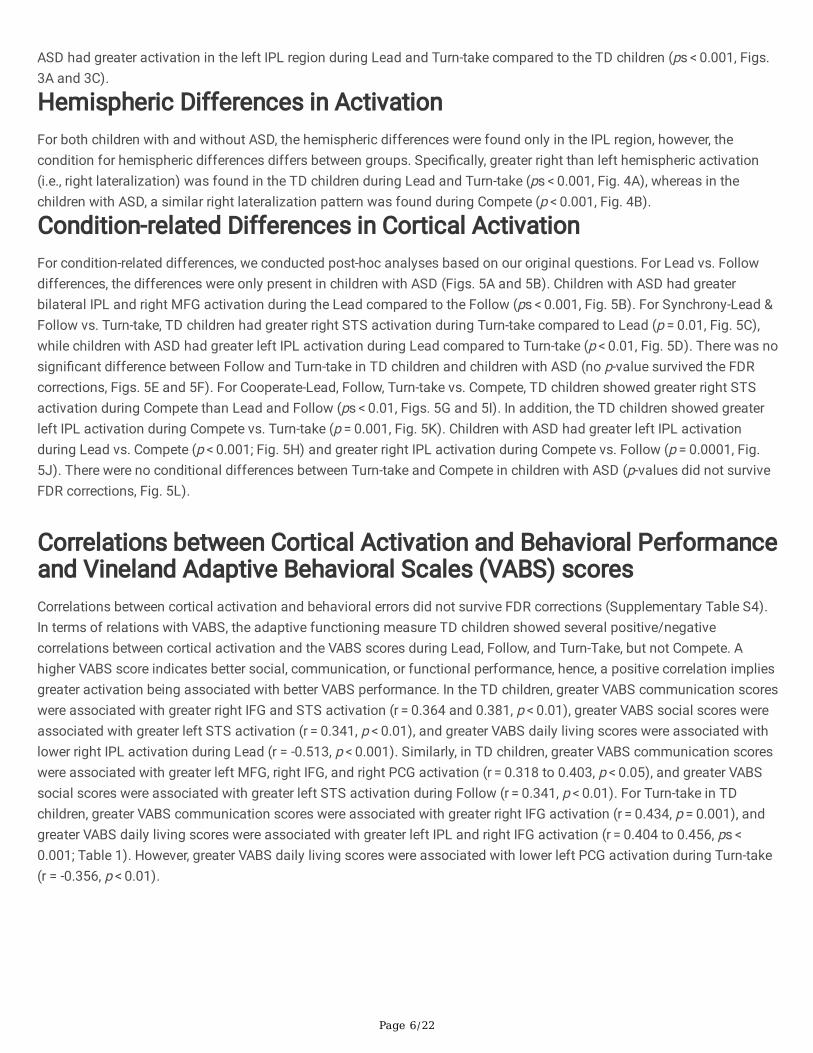
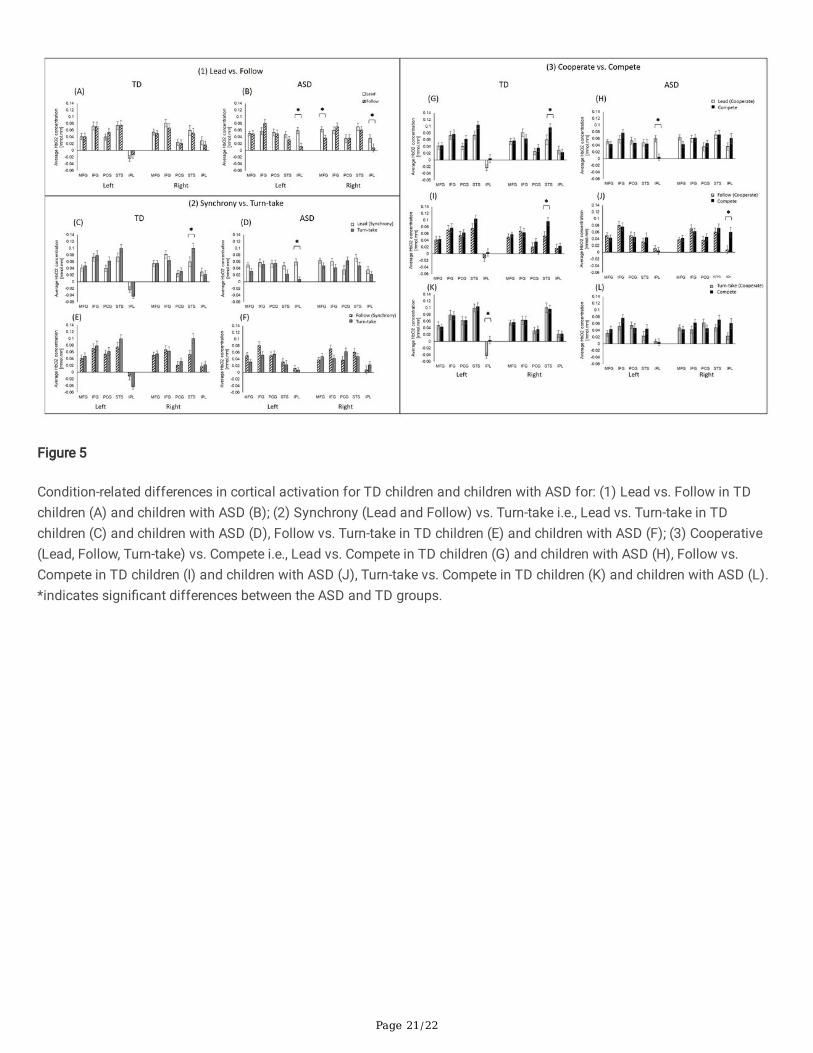
Condition-related Differences in Cortical ActivationFor condition-related differences, we conducted post-hoc analyses based on our original questions. For Lead vs. Followdifferences, the differences were only present in children with ASD (Figs. 5A and 5B). Children with ASD had greaterbilateral IPL and right MFG activation during the Lead compared to the Follow (ps < 0.001, Fig. 5B). For Synchrony-Lead &Follow vs. Turn-take, TD children had greater right STS activation during Turn-take compared to Lead (p = 0.01, Fig. 5C),while children with ASD had greater left IPL activation during Lead compared to Turn-take (p < 0.01, Fig. 5D). There was nosigni�cant difference between Follow and Turn-take in TD children and children with ASD (no p-value survived the FDRcorrections, Figs. 5E and 5F). For Cooperate-Lead, Follow, Turn-take vs. Compete, TD children showed greater right STSactivation during Compete than Lead and Follow (ps < 0.01, Figs. 5G and 5I). In addition, the TD children showed greaterleft IPL activation during Compete vs. Turn-take (p = 0.001, Fig. 5K). Children with ASD had greater left IPL activationduring Lead vs. Compete (p < 0.001; Fig. 5H) and greater right IPL activation during Compete vs. Follow (p = 0.0001, Fig.5J). There were no conditional differences between Turn-take and Compete in children with ASD (p-values did not surviveFDR corrections, Fig. 5L).
Correlations between Cortical Activation and Behavioral Performanceand Vineland Adaptive Behavioral Scales (VABS) scoresCorrelations between cortical activation and behavioral errors did not survive FDR corrections (Supplementary Table S4).In terms of relations with VABS, the adaptive functioning measure TD children showed several positive/negativecorrelations between cortical activation and the VABS scores during Lead, Follow, and Turn-Take, but not Compete. Ahigher VABS score indicates better social, communication, or functional performance, hence, a positive correlation impliesgreater activation being associated with better VABS performance. In the TD children, greater VABS communication scoreswere associated with greater right IFG and STS activation (r = 0.364 and 0.381, p < 0.01), greater VABS social scores wereassociated with greater left STS activation (r = 0.341, p < 0.01), and greater VABS daily living scores were associated withlower right IPL activation during Lead (r = -0.513, p < 0.001). Similarly, in TD children, greater VABS communication scoreswere associated with greater left MFG, right IFG, and right PCG activation (r = 0.318 to 0.403, p < 0.05), and greater VABSsocial scores were associated with greater left STS activation during Follow (r = 0.341, p < 0.01). For Turn-take in TDchildren, greater VABS communication scores were associated with greater right IFG activation (r = 0.434, p = 0.001), andgreater VABS daily living scores were associated with greater left IPL and right IFG activation (r = 0.404 to 0.456, ps < 0.001; Table 1). However, greater VABS daily living scores were associated with lower left PCG activation during Turn-take(r = -0.356, p < 0.01).
Page 7/22
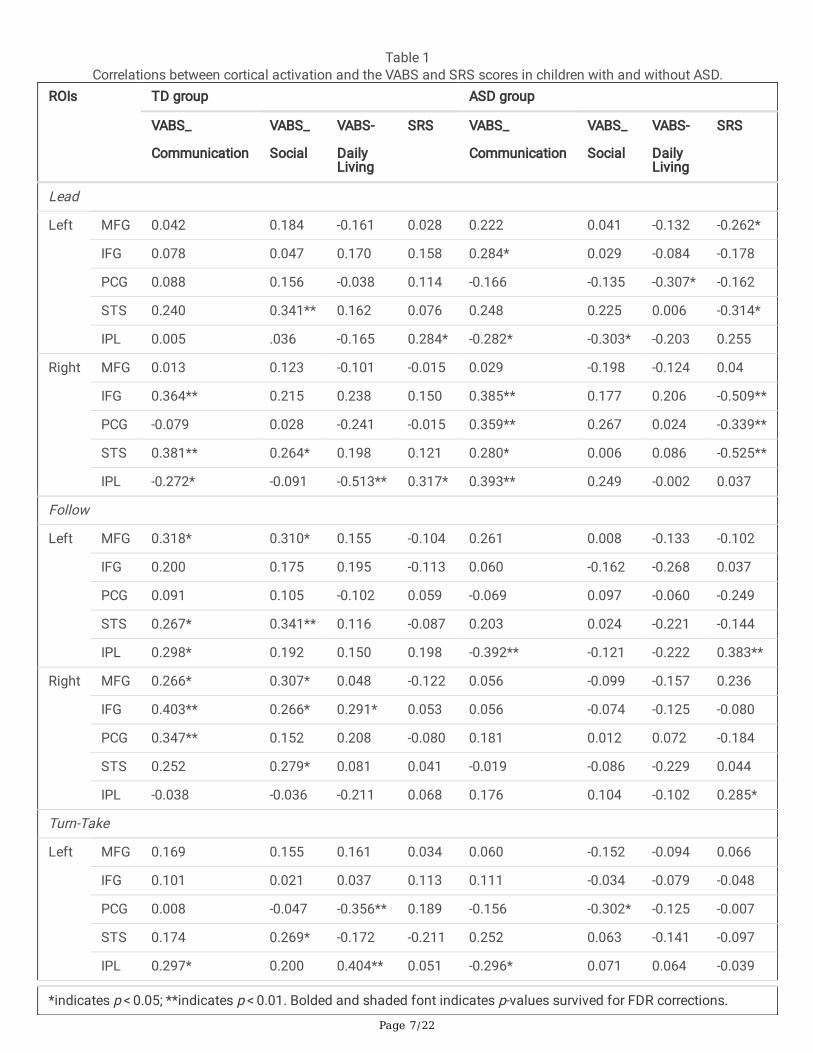
Table 1Correlations between cortical activation and the VABS and SRS scores in children with and without ASD.
ROIs TD group ASD group
VABS_
Communication
VABS_
Social
VABS-
DailyLiving
SRS VABS_
Communication
VABS_
Social
VABS-
DailyLiving
SRS
Lead
Left MFG 0.042 0.184 -0.161 0.028 0.222 0.041 -0.132 -0.262*
IFG 0.078 0.047 0.170 0.158 0.284* 0.029 -0.084 -0.178
PCG 0.088 0.156 -0.038 0.114 -0.166 -0.135 -0.307* -0.162
STS 0.240 0.341** 0.162 0.076 0.248 0.225 0.006 -0.314*
IPL 0.005 .036 -0.165 0.284* -0.282* -0.303* -0.203 0.255
Right MFG 0.013 0.123 -0.101 -0.015 0.029 -0.198 -0.124 0.04
IFG 0.364** 0.215 0.238 0.150 0.385** 0.177 0.206 -0.509**
PCG -0.079 0.028 -0.241 -0.015 0.359** 0.267 0.024 -0.339**
STS 0.381** 0.264* 0.198 0.121 0.280* 0.006 0.086 -0.525**
IPL -0.272* -0.091 -0.513** 0.317* 0.393** 0.249 -0.002 0.037
Follow
Left MFG 0.318* 0.310* 0.155 -0.104 0.261 0.008 -0.133 -0.102
IFG 0.200 0.175 0.195 -0.113 0.060 -0.162 -0.268 0.037
PCG 0.091 0.105 -0.102 0.059 -0.069 0.097 -0.060 -0.249
STS 0.267* 0.341** 0.116 -0.087 0.203 0.024 -0.221 -0.144
IPL 0.298* 0.192 0.150 0.198 -0.392** -0.121 -0.222 0.383**
Right MFG 0.266* 0.307* 0.048 -0.122 0.056 -0.099 -0.157 0.236
IFG 0.403** 0.266* 0.291* 0.053 0.056 -0.074 -0.125 -0.080
PCG 0.347** 0.152 0.208 -0.080 0.181 0.012 0.072 -0.184
STS 0.252 0.279* 0.081 0.041 -0.019 -0.086 -0.229 0.044
IPL -0.038 -0.036 -0.211 0.068 0.176 0.104 -0.102 0.285*
Turn-Take
Left MFG 0.169 0.155 0.161 0.034 0.060 -0.152 -0.094 0.066
IFG 0.101 0.021 0.037 0.113 0.111 -0.034 -0.079 -0.048
PCG 0.008 -0.047 -0.356** 0.189 -0.156 -0.302* -0.125 -0.007
STS 0.174 0.269* -0.172 -0.211 0.252 0.063 -0.141 -0.097
IPL 0.297* 0.200 0.404** 0.051 -0.296* 0.071 0.064 -0.039
*indicates p < 0.05; **indicates p < 0.01. Bolded and shaded font indicates p-values survived for FDR corrections.
Page 8/22
ROIs TD group ASD group
VABS_
Communication
VABS_
Social
VABS-
DailyLiving
SRS VABS_
Communication
VABS_
Social
VABS-
DailyLiving
SRS
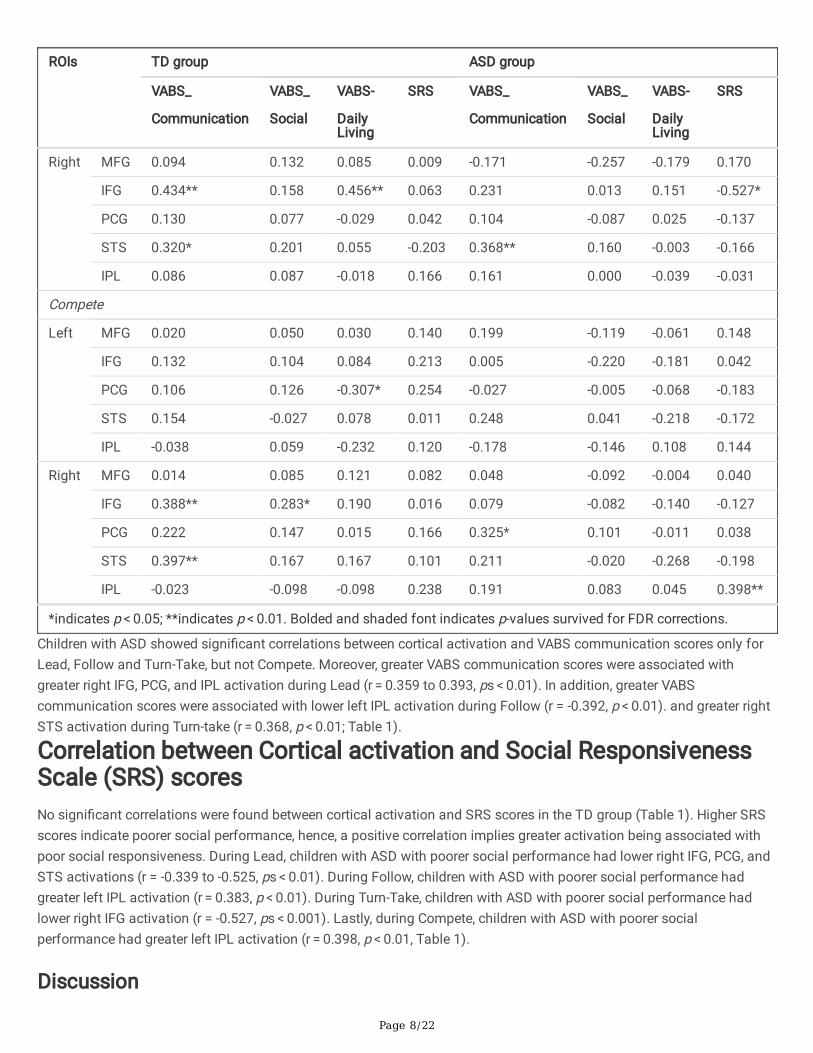
Right MFG 0.094 0.132 0.085 0.009 -0.171 -0.257 -0.179 0.170
IFG 0.434** 0.158 0.456** 0.063 0.231 0.013 0.151 -0.527*
PCG 0.130 0.077 -0.029 0.042 0.104 -0.087 0.025 -0.137
STS 0.320* 0.201 0.055 -0.203 0.368** 0.160 -0.003 -0.166
IPL 0.086 0.087 -0.018 0.166 0.161 0.000 -0.039 -0.031
Compete
Left MFG 0.020 0.050 0.030 0.140 0.199 -0.119 -0.061 0.148
IFG 0.132 0.104 0.084 0.213 0.005 -0.220 -0.181 0.042
PCG 0.106 0.126 -0.307* 0.254 -0.027 -0.005 -0.068 -0.183
STS 0.154 -0.027 0.078 0.011 0.248 0.041 -0.218 -0.172
IPL -0.038 0.059 -0.232 0.120 -0.178 -0.146 0.108 0.144
Right MFG 0.014 0.085 0.121 0.082 0.048 -0.092 -0.004 0.040
IFG 0.388** 0.283* 0.190 0.016 0.079 -0.082 -0.140 -0.127
PCG 0.222 0.147 0.015 0.166 0.325* 0.101 -0.011 0.038
STS 0.397** 0.167 0.167 0.101 0.211 -0.020 -0.268 -0.198
IPL -0.023 -0.098 -0.098 0.238 0.191 0.083 0.045 0.398**
*indicates p < 0.05; **indicates p < 0.01. Bolded and shaded font indicates p-values survived for FDR corrections.
Children with ASD showed signi�cant correlations between cortical activation and VABS communication scores only forLead, Follow and Turn-Take, but not Compete. Moreover, greater VABS communication scores were associated withgreater right IFG, PCG, and IPL activation during Lead (r = 0.359 to 0.393, ps < 0.01). In addition, greater VABScommunication scores were associated with lower left IPL activation during Follow (r = -0.392, p < 0.01). and greater rightSTS activation during Turn-take (r = 0.368, p < 0.01; Table 1).
Correlation between Cortical activation and Social ResponsivenessScale (SRS) scoresNo signi�cant correlations were found between cortical activation and SRS scores in the TD group (Table 1). Higher SRSscores indicate poorer social performance, hence, a positive correlation implies greater activation being associated withpoor social responsiveness. During Lead, children with ASD with poorer social performance had lower right IFG, PCG, andSTS activations (r = -0.339 to -0.525, ps < 0.01). During Follow, children with ASD with poorer social performance hadgreater left IPL activation (r = 0.383, p < 0.01). During Turn-Take, children with ASD with poorer social performance hadlower right IFG activation (r = -0.527, ps < 0.001). Lastly, during Compete, children with ASD with poorer socialperformance had greater left IPL activation (r = 0.398, p < 0.01, Table 1).
Discussion
Page 9/22
Previous fMRI studies of joint actions have been limited to simple hand movements and unnatural environments. Moststudies focused on imitation and synchrony-based cooperative actions but not turn-taking or competition. Using fNIRSand motion tracking systems, we have reported differences in behavioral performance and cortical activation in healthyadults and school-age children with and without ASD during multiple interpersonal synchrony tasks involvingreaching/body sway versus solo actions.25–28 In this study, we extend our past work to a novel naturalistic, joint actionbuilding game using Lincoln Logs in children with and without ASD. We found that children with ASD had greater motor,planning, and spatial errors, and they took longer to complete the tasks compared to the TD children. For group-basedactivation differences, children with ASD had lower bilateral STS activation during Turn-take, and lower left STS activationduring Compete and a similar statistical trend for Follow compared to TD children. In contrast, children with ASD hadgreater left IPL activation during Lead and Turn-take compared to TD children. For hemispheric differences, TD childrenhad right lateralized IPL activation during Lead and Turn-take, whereas children with ASD had right lateralized IPLactivation during Compete. For condition-related differences, TD children had a consistent pattern of greater right STSactivation during joint action tasks involving greater social monitoring/intention inferring demands (Turn-take > Lead,Compete > Lead, and Compete > Follow). They also had greater left IPL activation during Compete vs. Turn-take. Incontrast, children with ASD had a completely different strategy of greater left and/or right IPL or right MFG activationduring Lead vs. Follow, Lead vs. Turn-take, Lead vs. Compete, and Compete vs. Follow. For correlations between thecortical activation and the adaptive functioning measure in both groups, better VABS social, communication, and dailyliving performance was associated with greater left MFG, right IFG, and bilateral STS activation. The associationsbetween VABS scores and bilateral PCG/IPL activation were not consistent. For correlations between cortical activationand SRS scores, children with ASD’s poor social performance was also associated with lower right IFG, PCG, and STSactivation and greater left/right IPL activation across multiple joint action conditions.
We found that children with ASD had greater motor, spatial, and planning errors and took longer to complete the taskscompared to their TD peers. Children with ASD have poor social awareness, visuo-motor coordination, and executivefunctioning skills, which might affect their joint building abilities44–47. Poor social monitoring is a fundamental diagnosticimpairment and is widely reported in children with ASD. Children with ASD are less likely to follow an adult partner’s gazeor gestural bids to observe objects in the environment44,47. Toddlers with ASD who were shown 2D clips of a complexscene involving objects and people pay less attention to interacting adults and paid more attention to the surroundingbackground48. Moreover, dyspraxia (i.e., di�culties performing skilled motor sequences) is often reported in children withASD with greater spatio-temporal errors and greater time to task completion compared to those without ASD3–6. Together,these motor coordination/planning and social impairments could impair joint action performance in children with ASD.
Children with ASD had lower bilateral STS activation during Turn-take and lower left STS activation during Compete andFollow compared to TD children. In contrast, they had greater left IPL activation during Lead and Turn-take than the TDchildren. Recent studies have reported that followers showed greater STS activation whereas leaders showed greatersupplementary motor area and sensorimotor activation during synchronous movement or playing of the violin12–13. Whenplanning joint actions, children with ASD may rely more on internal or self-generated plans than being externally driven(i.e., using social information from their partners to plan their actions). For hemispheric differences, TD children had rightlateralized IPL activation during Lead and Turn-take conditions whereas children with ASD had a similar right lateralizedIPL activation during the Compete condition. Right IPL is important in making self-other distinctions when engaging insynchrony or competition vs. cooperation tasks35,49. Less right IPL activation is expected when cooperating as it mayinvolve greater merging of self and other whereas greater right IPL activation is expected when competing with apartner35. In the present study, children with ASD also showed a similar pattern of greater right lateralized IPL activationduring Compete vs. Cooperate. Interestingly, TD children showed a similar pattern of greater right-lateralized IPL activationin Lead and Turn-take; this may also be attributed to greater deactivation in left IPL across multiple joint action conditions.The left IPL region is considered part of the Default Mode Network (DMN) and is said to deactivate when performing
Page 10/22
externally directed processing (i.e., tasks that are cognitively demanding, goal-directed, or requiring greater socialawareness)28,50. The DMN is said to be important during social as well as imitation tasks51. In fact, being imitated led togreater DMN deactivation, compared to when imitating others suggesting that an individual is perhaps more sociallyaware of their partner’s actions when they are able to regulate the social interaction52. Consistent with this �nding, TDchildren showed more deactivation in the left IPL across multiple joint action tasks whereas such left IPL deactivationwas rarely seen in children with ASD. Past studies have also reported a lack of DMN deactivation in children with ASDduring cognitively demanding tasks28,53,54.
For most joint action comparisons, TD children had a consistent pattern of greater right STS activation during joint actiontasks involving greater social monitoring/intention inferring demands (Turn-take vs. Lead, Compete vs. Lead, andCompete vs. Follow). They also had reduced deactivation in the left IPL during Compete vs. Turn-take suggesting that theywere more internally driven when Competing vs. when Cooperating/Turn-taking. In contrast, children with ASD had greaterbilateral IPL and right MFG activation during Lead vs. Follow, greater left IPL activation during Lead vs. Follow, Lead vs.Turn-take, and Lead vs. Compete, and greater right IPL activation during Compete vs. Follow. Taken together, TD childrenhad greater activation in an important social network region (i.e., the STS) suggesting they may be more socially awareduring joint action tasks involving greater social monitoring/intention inferring demands (i.e., Follow, Turn-take, andCompete vs. Lead). In addition, they might utilize more internally driven/self-initiated planning when competing as seenby reduced left IPL deactivation.
In contrast, children with ASD seem to use a completely different IPL-based strategy wherein they showed reduceddeactivation and greater left IPL activation during Lead compared to other joint action conditions, indicating greaterreliance on self-generated action plans. Lastly, they also showed greater right IPL activation during Compete vs.Cooperate. Taken together, children with ASD may engage in better self-other distinctions when Leading and Competingwith partners compared to Following and Cooperating with others making Leading and Cooperation valuablelearning/intervention contexts to promote greater self vs. other awareness.
For correlations between activation and the adaptive functioning in both groups, better VABS social, communication, anddaily living performance was generally associated with greater left MFG, right IFG, and bilateral STS activation. Forcorrelations between cortical activation and SRS scores, children with ASD that had better social performance had higherright IFG, PCG, and STS activation and lower left/right IPL activation across multiple joint action conditions. During jointactions, one must anticipate their partner’s actions by observing them, infer their intentions, plan one’s own actions, andexecute the action plan14. The networks formed by MFG, IFG, and STS regions are implicated in each of these processes(i.e., social awareness (STS), intention inferring (IFG), planning actions (MFG and IPL), and action execution (PCG) alongwith many other important brain regions.
Finally, this is a pilot study involving a relatively small sample size (N = 30); yet several signi�cant and meaningful�ndings were revealed. Despite matching multiple factors across groups, we included children with ASD with a broadrange of functioning, which may have increased the variability of our study sample. During naturalistic play, it is di�cultto control the time to task completion and standardize the duration of the stimulation period. While we followedconsistent probe placement, variation in participant head sizes and probe placement could have led to inconsistency inour spatial registration output.
Our study identi�ed multiple behavioral and fNIRS-based neurobiomarkers during a Lincoln Log-based joint action gameacross prefrontal, frontal, temporal and parietal cortices. Children with ASD had greater behavioral errors (motor, spatial,and planning) and took greater time to complete tasks. In addition, children with ASD showed reduced STS activation andincreased IPL activation as well as a lack of differential activation in the STS region compared to TD children. We alsofound different patterns of activation in children with ASD compared to TD children suggesting that both groups useddifferent mechanisms to process social-perceptual information for motor planning/execution of joint actions. In the
Page 11/22
future, we will use the aforementioned fNIRS neurobiomarkers to assess changes in cortical activation following a bout ofsocially embedded motor intervention focused on imitation, synchronization, and cooperation. Overall, fNIRS appears tobe a valid and powerful child-friendly tool to examine cortical activation during joint play in both children with and withoutASD. From a learning standpoint, clinicians must consider utilizing opportunities for leading and competition to improvesocial awareness in children with ASD apart from following and cooperation.
Methods
ParticipantsThirty children with and without ASD (Average ± SE: ASD: 11.5 ± 0.8, 12 males, 3 females; TD: 12.2 ± 0.9, 8 males, 7females) participated. There were no signi�cant group differences in age or ethnicity. Children were recruited throughonline postings, phone calls, and �iers sent to ASD advocacy groups, and Simons Powering Autism Research (SPARK)participant research match service. SPARK informs their family database about research studies(https://www.sfari.org/resource/spark/). Before participation, we completed screening interviews with potentialparticipants to obtain their demographic information and to con�rm their eligibility. The inclusion criteria for children withASD were (i) should hold a professionally con�rmed ASD diagnosis, supported by school records, an IndividualizedEducation Plan for ASD-related services, or medical/neuropsychological records from a psychiatrist or clinicalpsychologist using the Autism Diagnostic Observation Schedule; there is a growing trend of using professionallycon�rmed diagnostic records for ASD cohort studies55 and (ii) met criteria for a social communication delay (> 12 points)on the Social Communication Questionnaire (SCQ)56. Children with ASD were excluded if they had anybehavioral/sensory issues that prevented them from completing the test activities. The age-matched TD children wereexcluded if they had any neurological or developmental disorder/delay or a family history of ASD.
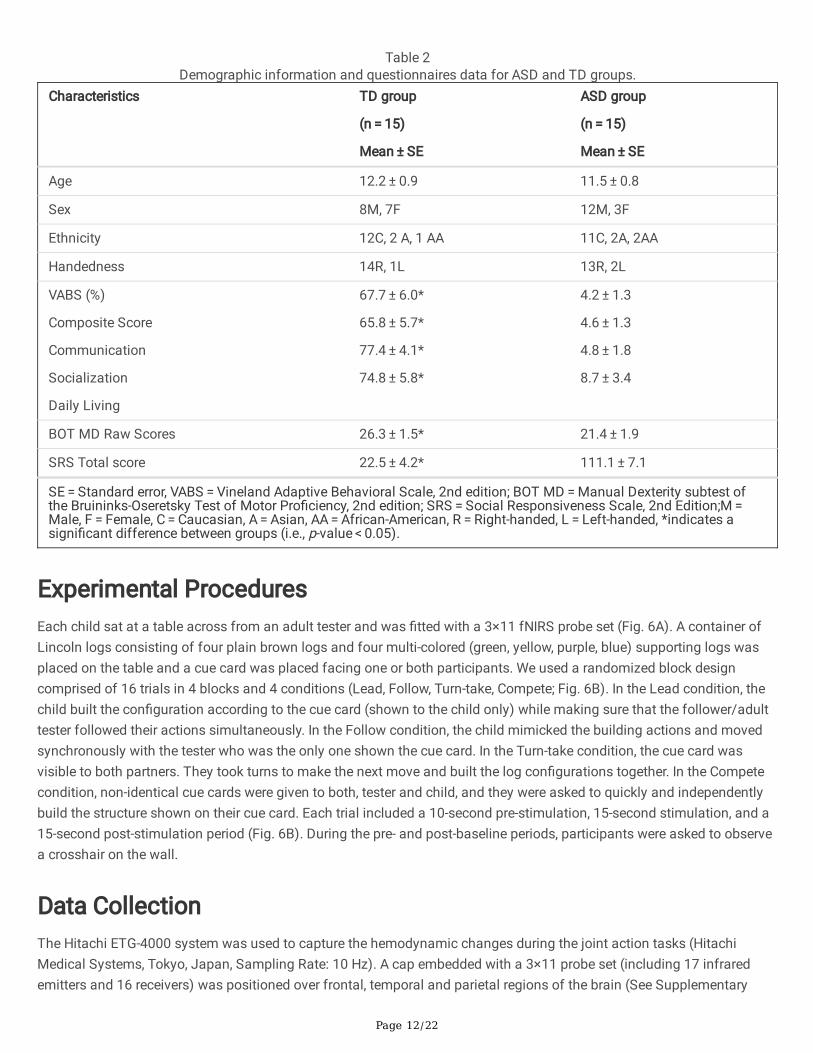
Parents of all children completed the Coren handedness survey to assess hand preferences57, the VABS measure toassess adaptive functioning,58 and SRS to assess social responsiveness impairment59. Additionally, we administered theBOT-2 MD to assess �ne motor skills60. Compared to TD children, children with ASD had signi�cantly lower VABS, BOT-2MD scores, and greater SRS total scores indicating impaired adaptive functioning, manual dexterity performance, andsocial responsiveness (Table 2). All study procedures were carried out in accordance with the Declaration of Helsinki. Allinformed consent and assent forms as well as all study procedures were approved by the University of DelawareInstitutional Review Board (UD IRB, Study Approval #: 930721). Prior to study participation, written informed consent wasobtained from parents who gave approval for their child’s study participation as their legal guardians and written andverbal assent was obtained from the children. Written parental permission and experimenter informed consent has beentaken to use pictures for this publication.
Page 12/22
Table 2Demographic information and questionnaires data for ASD and TD groups.
Characteristics TD group
(n = 15)
Mean ± SE
ASD group
(n = 15)
Mean ± SE
Age 12.2 ± 0.9 11.5 ± 0.8
Sex 8M, 7F 12M, 3F
Ethnicity 12C, 2 A, 1 AA 11C, 2A, 2AA
Handedness 14R, 1L 13R, 2L
VABS (%)
Composite Score
Communication
Socialization
Daily Living
67.7 ± 6.0*
65.8 ± 5.7*
77.4 ± 4.1*
74.8 ± 5.8*
4.2 ± 1.3
4.6 ± 1.3
4.8 ± 1.8
8.7 ± 3.4
BOT MD Raw Scores 26.3 ± 1.5* 21.4 ± 1.9
SRS Total score 22.5 ± 4.2* 111.1 ± 7.1
SE = Standard error, VABS = Vineland Adaptive Behavioral Scale, 2nd edition; BOT MD = Manual Dexterity subtest ofthe Bruininks-Oseretsky Test of Motor Pro�ciency, 2nd edition; SRS = Social Responsiveness Scale, 2nd Edition;M = Male, F = Female, C = Caucasian, A = Asian, AA = African-American, R = Right-handed, L = Left-handed, *indicates asigni�cant difference between groups (i.e., p-value < 0.05).
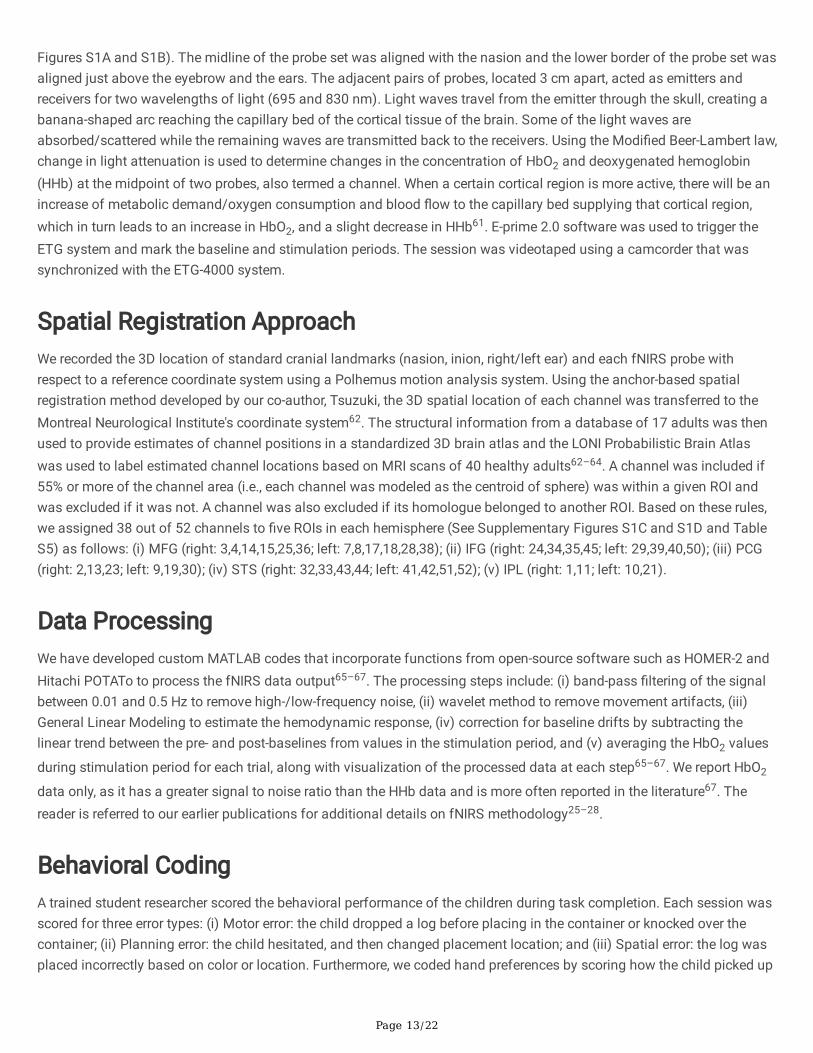
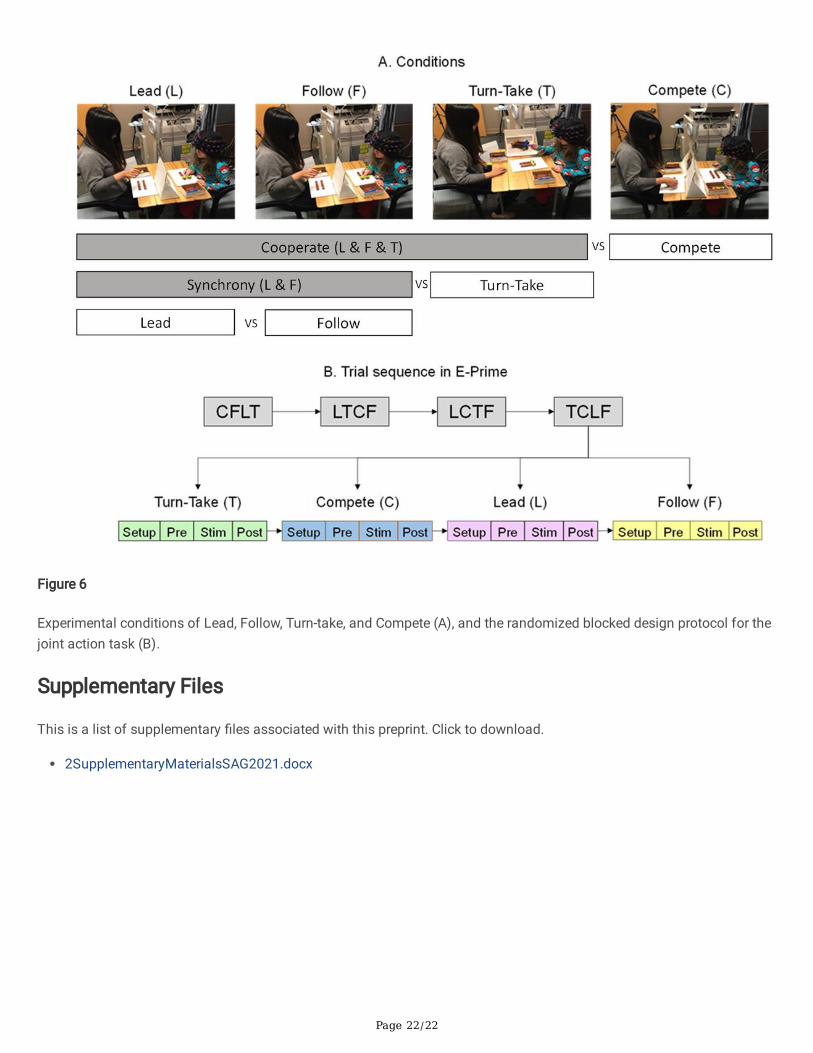
Experimental ProceduresEach child sat at a table across from an adult tester and was �tted with a 3×11 fNIRS probe set (Fig. 6A). A container ofLincoln logs consisting of four plain brown logs and four multi-colored (green, yellow, purple, blue) supporting logs wasplaced on the table and a cue card was placed facing one or both participants. We used a randomized block designcomprised of 16 trials in 4 blocks and 4 conditions (Lead, Follow, Turn-take, Compete; Fig. 6B). In the Lead condition, thechild built the con�guration according to the cue card (shown to the child only) while making sure that the follower/adulttester followed their actions simultaneously. In the Follow condition, the child mimicked the building actions and movedsynchronously with the tester who was the only one shown the cue card. In the Turn-take condition, the cue card wasvisible to both partners. They took turns to make the next move and built the log con�gurations together. In the Competecondition, non-identical cue cards were given to both, tester and child, and they were asked to quickly and independentlybuild the structure shown on their cue card. Each trial included a 10-second pre-stimulation, 15-second stimulation, and a15-second post-stimulation period (Fig. 6B). During the pre- and post-baseline periods, participants were asked to observea crosshair on the wall.
Data CollectionThe Hitachi ETG-4000 system was used to capture the hemodynamic changes during the joint action tasks (HitachiMedical Systems, Tokyo, Japan, Sampling Rate: 10 Hz). A cap embedded with a 3×11 probe set (including 17 infraredemitters and 16 receivers) was positioned over frontal, temporal and parietal regions of the brain (See Supplementary
Page 13/22
Figures S1A and S1B). The midline of the probe set was aligned with the nasion and the lower border of the probe set wasaligned just above the eyebrow and the ears. The adjacent pairs of probes, located 3 cm apart, acted as emitters andreceivers for two wavelengths of light (695 and 830 nm). Light waves travel from the emitter through the skull, creating abanana-shaped arc reaching the capillary bed of the cortical tissue of the brain. Some of the light waves areabsorbed/scattered while the remaining waves are transmitted back to the receivers. Using the Modi�ed Beer-Lambert law,change in light attenuation is used to determine changes in the concentration of HbO2 and deoxygenated hemoglobin(HHb) at the midpoint of two probes, also termed a channel. When a certain cortical region is more active, there will be anincrease of metabolic demand/oxygen consumption and blood �ow to the capillary bed supplying that cortical region,which in turn leads to an increase in HbO2, and a slight decrease in HHb61. E-prime 2.0 software was used to trigger theETG system and mark the baseline and stimulation periods. The session was videotaped using a camcorder that wassynchronized with the ETG-4000 system.
Spatial Registration ApproachWe recorded the 3D location of standard cranial landmarks (nasion, inion, right/left ear) and each fNIRS probe withrespect to a reference coordinate system using a Polhemus motion analysis system. Using the anchor-based spatialregistration method developed by our co-author, Tsuzuki, the 3D spatial location of each channel was transferred to theMontreal Neurological Institute's coordinate system62. The structural information from a database of 17 adults was thenused to provide estimates of channel positions in a standardized 3D brain atlas and the LONI Probabilistic Brain Atlaswas used to label estimated channel locations based on MRI scans of 40 healthy adults62–64. A channel was included if55% or more of the channel area (i.e., each channel was modeled as the centroid of sphere) was within a given ROI andwas excluded if it was not. A channel was also excluded if its homologue belonged to another ROI. Based on these rules,we assigned 38 out of 52 channels to �ve ROIs in each hemisphere (See Supplementary Figures S1C and S1D and TableS5) as follows: (i) MFG (right: 3,4,14,15,25,36; left: 7,8,17,18,28,38); (ii) IFG (right: 24,34,35,45; left: 29,39,40,50); (iii) PCG(right: 2,13,23; left: 9,19,30); (iv) STS (right: 32,33,43,44; left: 41,42,51,52); (v) IPL (right: 1,11; left: 10,21).
Data ProcessingWe have developed custom MATLAB codes that incorporate functions from open-source software such as HOMER-2 andHitachi POTATo to process the fNIRS data output65–67. The processing steps include: (i) band-pass �ltering of the signalbetween 0.01 and 0.5 Hz to remove high-/low-frequency noise, (ii) wavelet method to remove movement artifacts, (iii)General Linear Modeling to estimate the hemodynamic response, (iv) correction for baseline drifts by subtracting thelinear trend between the pre- and post-baselines from values in the stimulation period, and (v) averaging the HbO2 values
during stimulation period for each trial, along with visualization of the processed data at each step65–67. We report HbO2
data only, as it has a greater signal to noise ratio than the HHb data and is more often reported in the literature67. Thereader is referred to our earlier publications for additional details on fNIRS methodology25–28.
Behavioral CodingA trained student researcher scored the behavioral performance of the children during task completion. Each session wasscored for three error types: (i) Motor error: the child dropped a log before placing in the container or knocked over thecontainer; (ii) Planning error: the child hesitated, and then changed placement location; and (iii) Spatial error: the log wasplaced incorrectly based on color or location. Furthermore, we coded hand preferences by scoring how the child picked up
Page 14/22
each log using their left, right, or both hands. Lastly, we coded the time in seconds to complete each buildingcon�guration.
Statistical AnalysesTo assess group differences in frequency of behavioral errors of each type, we conducted non-parametric, Mann-Whitney-U tests. For group differences in time to completion and hand preference (i.e., proportion of right, left or both handactions) we conducted independent t-tests for each action type. For cortical activation, we conducted a repeated measureANOVA using within-group factors of condition (Lead, Follow, Compete, Turn-Take), region (MFG, PCG, IFG, STS, IPL),hemisphere (Left, Right), a between-group factor of group (ASD, TD) with BOT-2 MD score and hand preference ascovariates. When our data violated Mauchly’s test of sphericity, we applied Greenhouse-Geisser corrections. Lastly,Pearson’s correlations were used to correlate cortical activation and behavioral performance (both groups), VABS (bothgroups) and SRS performance (ASD only). To control for multiple comparisons for post-hoc analyses and correlation runs,the Benjamini-Hochberg False Discovery Rate (FDR) method was used to adjust the statistically signi�cant cut-off68.Speci�cally, the unadjusted p-values were rank ordered from low to high and the statistical signi�cance was declared ifthe unadjusted p-value was less than the p-value threshold which was determined by multiplying 0.05 with the ratio of theunadjusted p-value rank to the total number of comparisons (p-threshold for ith comparison = 0.05 × i/n; where n = numberof comparisons).
Declarations
Data Availability StatementThe datasets generated during and/or analyzed during the current study are available from the corresponding author onreasonable request.
AcknowledgmentsWe are grateful to the SPARK children and families who participated in this study. We also thank the SPARK clinical sitesand SPARK research participant match service staff for their help with participant recruitment. Researchers may contactSPARK study research participant match service here: https://wp-qa.sparkforautism.org/spark-research-match/ This workwas supported by the National Institutes of Health through a shared instrumentation grant awarded to the University ofDelaware (Grant #: 1S10OD021534-01, PI: Bhat) and pilot award funding through an Institutional Development Award(IDeA) from the National Institute of General Medical Sciences of the National Institutes of Health (U54-GM104941, P20GM103446) and funding from the Dana Foundation through a Clinical Neuroscience Award (PI: Bhat). The last author’seffort in writing and editing this manuscript was also supported by the NIH R01 grant #: 1R01MH125823-01. The contentof this manuscript has been published before as part of the Master’s thesis of McKenzie Culotta (2019).
Author ContributionsM.C., W.S., and A.B. contributed to conception and design of the study, data collection, and organized the database. A.B.and M.C. performed the statistical analyses and wrote the �rst draft of the manuscript. W.S. and D.T. wrote sections of themanuscript. All authors contributed to manuscript revision, read, and approved the submitted version.
Additional Contributions
Page 15/22
The funders had no role in study design, data collection and analysis, decision to publish, or preparation of themanuscript. All the authors declare that they have no con�icts of interest.
Competing Interests The funders had no role in study design, data collection and analysis, decision to publish, or preparation of themanuscript. All the authors declare that they have no con�icts of interest.
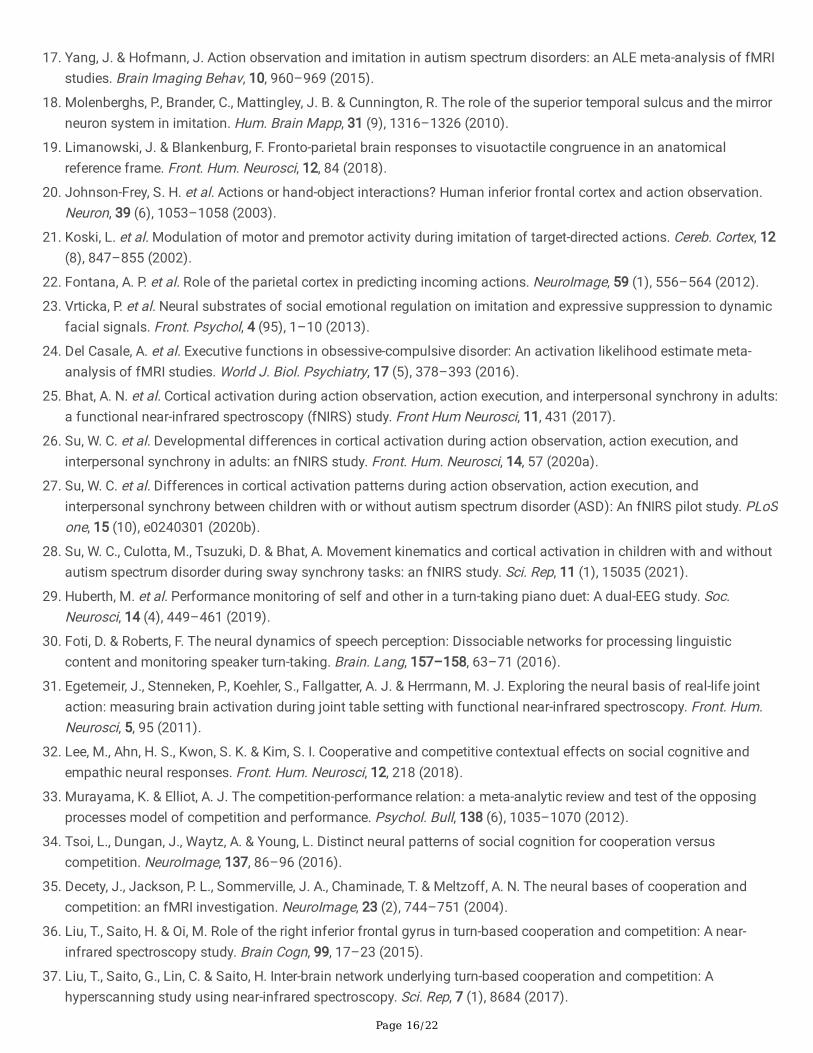
References1. Maenner, M. J. et al. Prevalence of autism spectrum disorder among children aged 8 years - autism and
developmental disabilities Monitoring network, 11 sites, united states, 2016. MMWR Surveill. Summ, 69 (4), 1–12(2020).
2. American Psychiatric Association. Diagnostic and Statistical Manual of Mental Disorders 5th edn (AmericanPsychiatric Publishing, 2013).
3. Bhat, A. N. Is motor impairment in autism spectrum disorder distinct from developmental coordination disorder? Areport from the SPARK study. Phys. Ther, 100 (4), 633–644 (2020).
4. Bhat, A. N. Motor impairment increases in children with autism spectrum disorder as a function of socialcommunication, cognitive and functional impairment, repetitive behavior severity, and comorbid diagnoses: a SPARKstudy report. Autism Res, 14 (1), 202–219 (2021).
5. Kaur, M., Srinivasan, S. M. & Bhat, A. N. Comparing motor performance, praxis, coordination, and interpersonalsynchrony between children with and without autism spectrum disorder (ASD). Res. Dev. Disabil, 72, 79–95 (2018).
�. Kaur, M., Gifford, T., Marsh, K. & Bhat, A. The effects of robot-child interactions on bilateral coordination skills oftypically developing children and one child with autism between 4 to 7 years of age. Journal of Motor Learning andDevelopment, 1 (2), 31–37 (2013).
7. Freeman, L. M., Lock, J., Rotheram-Fuller, E. & Mandell, D. Brief report: examining executive and social functioning inelementary aged children with autism. J. Autism Dev. Disord, 47, 1890–1895 (2017).
�. Vicaria, I. & Dickens, L. Meta-analyses of intra and inter-personal coordination. J. Nonverbal Behav, 40, 335–361(2016).
9. Fitzpatrick, P. et al. Social motor synchronization: insights for understanding social behavior in autism. J. Autism Dev.Disord, 47, 2092–2107 (2017).
10. Bolt, N. K. & Loehr, J. D. The motor-related brain activity that supports joint action: A review. Acta Psychol, 212,103218 (2021).
11. Fairhurst, M. T., Janata, P. & Keller, P. E. Leading the follower: an fMRI investigation of dynamic cooperativity andleader-follower strategies in synchronization with an adaptive virtual partner. NeuroImage, 84, 688–697 (2014).
12. Chauvigné, L. & Brown, S. Role-speci�c brain activations in leaders and followers during joint action. Front. Hum.Neurosci, 12, 401 (2018).
13. Vanzella, P. et al. fNIRS responses in professional violinists while playing duets: evidence for distinct leader andfollower roles at the brain level. Front. Psychol, 10, 164 (2019).
14. Vesper, C. et al. Joint action: mental representations, shared information and general mechanisms for coordinatingwith others. Front. Psychol, 7, 2039 (2017).
15. Meyer, M., Bekkering, H., Haartsen, R., Stapel, J. C. & Hunnius, S. The role of action prediction and inhibitory control forjoint action coordination in toddlers. Exp. Child Psychol, 139, 203–220 (2015).
1�. Iacoboni, M. Neurobiology of imitation. Curr. Opin. Neurobiol, 19, 661–665 (2009).
Page 16/22
17. Yang, J. & Hofmann, J. Action observation and imitation in autism spectrum disorders: an ALE meta-analysis of fMRIstudies. Brain Imaging Behav, 10, 960–969 (2015).
1�. Molenberghs, P., Brander, C., Mattingley, J. B. & Cunnington, R. The role of the superior temporal sulcus and the mirrorneuron system in imitation. Hum. Brain Mapp, 31 (9), 1316–1326 (2010).
19. Limanowski, J. & Blankenburg, F. Fronto-parietal brain responses to visuotactile congruence in an anatomicalreference frame. Front. Hum. Neurosci, 12, 84 (2018).
20. Johnson-Frey, S. H. et al. Actions or hand-object interactions? Human inferior frontal cortex and action observation.Neuron, 39 (6), 1053–1058 (2003).
21. Koski, L. et al. Modulation of motor and premotor activity during imitation of target-directed actions. Cereb. Cortex, 12(8), 847–855 (2002).
22. Fontana, A. P. et al. Role of the parietal cortex in predicting incoming actions. NeuroImage, 59 (1), 556–564 (2012).
23. Vrticka, P. et al. Neural substrates of social emotional regulation on imitation and expressive suppression to dynamicfacial signals. Front. Psychol, 4 (95), 1–10 (2013).
24. Del Casale, A. et al. Executive functions in obsessive-compulsive disorder: An activation likelihood estimate meta-analysis of fMRI studies. World J. Biol. Psychiatry, 17 (5), 378–393 (2016).
25. Bhat, A. N. et al. Cortical activation during action observation, action execution, and interpersonal synchrony in adults:a functional near-infrared spectroscopy (fNIRS) study. Front Hum Neurosci, 11, 431 (2017).
2�. Su, W. C. et al. Developmental differences in cortical activation during action observation, action execution, andinterpersonal synchrony in adults: an fNIRS study. Front. Hum. Neurosci, 14, 57 (2020a).
27. Su, W. C. et al. Differences in cortical activation patterns during action observation, action execution, andinterpersonal synchrony between children with or without autism spectrum disorder (ASD): An fNIRS pilot study. PLoSone, 15 (10), e0240301 (2020b).
2�. Su, W. C., Culotta, M., Tsuzuki, D. & Bhat, A. Movement kinematics and cortical activation in children with and withoutautism spectrum disorder during sway synchrony tasks: an fNIRS study. Sci. Rep, 11 (1), 15035 (2021).
29. Huberth, M. et al. Performance monitoring of self and other in a turn-taking piano duet: A dual-EEG study. Soc.Neurosci, 14 (4), 449–461 (2019).
30. Foti, D. & Roberts, F. The neural dynamics of speech perception: Dissociable networks for processing linguisticcontent and monitoring speaker turn-taking. Brain. Lang, 157–158, 63–71 (2016).
31. Egetemeir, J., Stenneken, P., Koehler, S., Fallgatter, A. J. & Herrmann, M. J. Exploring the neural basis of real-life jointaction: measuring brain activation during joint table setting with functional near-infrared spectroscopy. Front. Hum.Neurosci, 5, 95 (2011).
32. Lee, M., Ahn, H. S., Kwon, S. K. & Kim, S. I. Cooperative and competitive contextual effects on social cognitive andempathic neural responses. Front. Hum. Neurosci, 12, 218 (2018).
33. Murayama, K. & Elliot, A. J. The competition-performance relation: a meta-analytic review and test of the opposingprocesses model of competition and performance. Psychol. Bull, 138 (6), 1035–1070 (2012).
34. Tsoi, L., Dungan, J., Waytz, A. & Young, L. Distinct neural patterns of social cognition for cooperation versuscompetition. NeuroImage, 137, 86–96 (2016).
35. Decety, J., Jackson, P. L., Sommerville, J. A., Chaminade, T. & Meltzoff, A. N. The neural bases of cooperation andcompetition: an fMRI investigation. NeuroImage, 23 (2), 744–751 (2004).
3�. Liu, T., Saito, H. & Oi, M. Role of the right inferior frontal gyrus in turn-based cooperation and competition: A near-infrared spectroscopy study. Brain Cogn, 99, 17–23 (2015).
37. Liu, T., Saito, G., Lin, C. & Saito, H. Inter-brain network underlying turn-based cooperation and competition: Ahyperscanning study using near-infrared spectroscopy. Sci. Rep, 7 (1), 8684 (2017).
Page 17/22
3�. Brezis, R. S. et al. Patterns of joint improvisation in adults with autism spectrum disorder. Front. Psychol, 8, 1790(2017).
39. Ochi, K. et al. Quanti�cation of speech and synchrony in the conversation of adults with autism spectrum disorder.PLoS one, 14 (12), e0225377 (2019).
40. Cerullo, S., Fulceri, F., Muratori, F. & Contaldo, A. Acting with shared intentions: A systematic review on joint actioncoordination in autism spectrum disorder. Brain Cogn, 149, 105693 (2021).
41. Uratani, M. et al. Reduced prefrontal hemodynamic response in pediatric autism spectrum disorder measured withnear-infrared spectroscopy. Child Adolesc. Psychiatry Ment. Health, 13, 29 (2019).
42. Todorova, G. K., Hatton, R. & Pollick, F. E. Biological motion perception in autism spectrum disorder: a meta-analysis.Mol. Autism, 10, 49 (2019).
43. Kruppa, J. A. et al. Brain and motor synchrony in children and adolescents with ASD-A fNIRS hyperscanning study.Soc. Cogn. Affect Neurosci, 16 (1–2), 103–116 (2021).
44. Leekam, S. R., Lopez, B. & Moore, C. Attention and joint attention in preschool children with autism. Dev Psychol, 38,261–273 (2000).
45. Robinson, S., Goddard, L., Dritschel, B., Wisley, M. & Howlin, P. Executive functions in children with autism spectrumdisorders. Brain Cogn, 71, 362–368 (2009).
4�. Sachse, M. et al. Executive and visuo-motor function in adolescents and adults with autism spectrum disorder. J.Autism Dev. Disord, 43, 1222–1235 (2013).
47. Leekam, S. R. & Ramsden, C. A. Dyadic orienting and joint attention in preschool children with Autism. J. Autism Dev.Disord, 36, 185–197 (2006).
4�. Shic, F., Bradshaw, J., Klin, A., Scassellati, B. & Chawarska, K. Limited activity monitoring in toddlers with autismspectrum disorder. Brain Res, 1380, 246–254 (2011).
49. Ohata, R. et al. Sense of agency beyond sensorimotor process: decoding self-other action attribution in the humanbrain. Cereb. Cortex, 30 (7), 4076–4091 (2020).
50. Greicius, M. D., Krasnow, B., Reiss, A. L. & Menon, V. Functional connectivity in the resting brain: a network analysis ofthe default mode hypothesis. Proc. Natl. Acad. Sci. U. S. A. 100(1), 253–258(2003).
51. Schilbach, L., Eickhoff, S. B., Rotarska-Jagiela, A., Fink, G. R. & Vogeley, K. Minds at rest? Social cognition as thedefault mode of cognizing and its putative relationship to the "default system" of the brain. Conscious Cogn, 17 (2),457–467 (2008).
52. Guionnet, S. et al. Reciprocal imitation: toward a neural basis of social interaction. Cereb. Cortex, 22 (4), 971–978(2012).
53. Spencer, M. D. et al. Failure to deactivate the default mode network indicates a possible endophenotype of autism.Mol. Autism, 3 (1), 15 (2012).
54. Chien, H. Y., Gau, S. S. & Isaac Tseng, W. Y. De�cient visuospatial working memory functions and neural correlates ofthe default mode network in adolescents with autism spectrum disorder. Autism Res, 9 (10), 1058–1072 (2016).
55. Lord, C. et al. Autism diagnostic observation schedule, second edition (ADOS-2) manual (Part 1): Modules 1–4(Western Psychological Services, Torrance, CA, 2012).
5�. Daniels, A. M. et al. Veri�cation of parent-report of child autism spectrum disorder diagnosis to a web-based autismregistry. J. Autism Dev. Disord, 42 (2), 257–265 (2012).
57. Coren, S. H. & Questionnaire The Left-Hander Syndrome: The Causes and Consequences of Left-Handedness (NY FreePress, New York, 1992).
5�. Volkmar, F. R. et al. Social de�cits in autism: an operational approach using the Vineland Adaptive Behavior Scales. J.Am. Acad. Child Adolesc. Psychiatry, 26 (2), 156–161 (1987).
Page 18/22
59. Constantino, J. N. & Gruber, C. P. Social Responsiveness Scale (SRS) (Western Psychological Services, Los Angeles,2005).
�0. Bruininks, R. & Bruininks, B. Bruininks-Oseretsky Test of Motor Pro�ciency: Examiner's Manual (Pearson’sAssessments, Minneapolis, MN, 2005).
�1. Lloyd-Fox, S., Blasi, A. & Elwell, C. E. Illuminating the developing brain: The past, present and future of functional nearinfrared spectroscopy. Neurosci. Biobehav. Rev, 34, 269–284 (2010).
�2. Okamoto, M. et al. Three-dimensional probabilistic anatomical cranio-cerebral correlation via the international 10–20system oriented for transcranial functional brain mapping., 21, 99–111 (2004).
�3. Tsuzuki, D. et al. Stable and convenient spatial registration of stand-alone NIRS data through anchor-basedprobabilistic registration. Neurosci. Res, 72, 163–171 (2012).
�4. Shattuck, D. W. et al. Construction of a 3D probabilistic atlas of human cortical structures., 39, 1064–1080 (2010).
�5. Huppert, T. J., Diamond, S. G., Franceschini, M. A. & Boas, D. A. HomER: a review of time-series analysis methods fornear-infrared spectroscopy of the brain. Appl. Opt, 48 (10), 280–298 (2009).
��. Sutoko, S. et al. Tutorial on platform for optical topography analysis tools. Neurophotonics, 3, 010801 (2016).
�7. Sato, H. et al. Intersubject variability of near-infrared spectroscopy signals during sensorimotor cortex activation. J.Biomed. Opt, 10, 44001 (2005).
��. Singh, A. & Dan, I. Exploring the false discovery rate in multichannel NIRS., 33, 542–549 (2006).
Figures
Figure 1
Behavioral errors (A), Time to completion (B), and Hand preference (C) in children with ASD and TD children. *indicatessigni�cant differences between ASD and TD groups.
Page 19/22
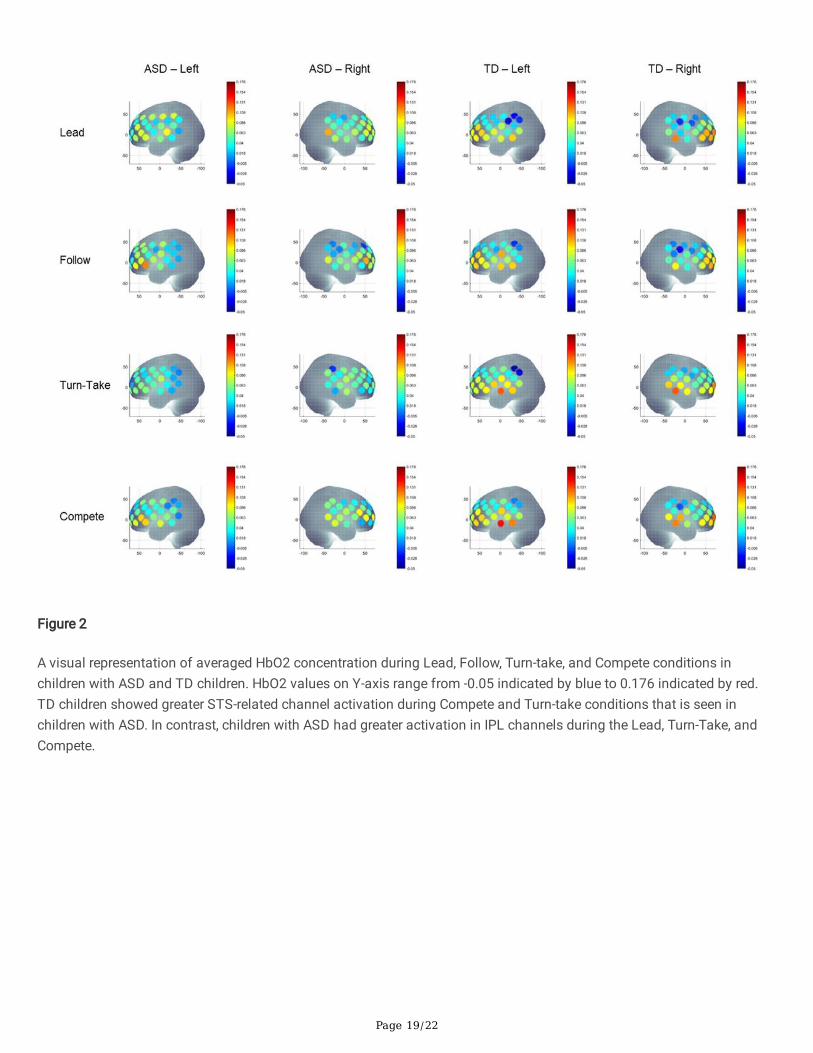
Figure 2
A visual representation of averaged HbO2 concentration during Lead, Follow, Turn-take, and Compete conditions inchildren with ASD and TD children. HbO2 values on Y-axis range from -0.05 indicated by blue to 0.176 indicated by red.TD children showed greater STS-related channel activation during Compete and Turn-take conditions that is seen inchildren with ASD. In contrast, children with ASD had greater activation in IPL channels during the Lead, Turn-Take, andCompete.
Page 20/22
Figure 3
Group differences in cortical activation for Lead (A), Follow (B), Turn-Take (C), and Compete (D). *indicates signi�cantdifferences between the ASD and TD groups.
Figure 4
Hemispheric differences between TD children (A) and children with ASD (B). *indicates signi�cant differences between theASD and TD groups.
Page 21/22
Figure 5
Condition-related differences in cortical activation for TD children and children with ASD for: (1) Lead vs. Follow in TDchildren (A) and children with ASD (B); (2) Synchrony (Lead and Follow) vs. Turn-take i.e., Lead vs. Turn-take in TDchildren (C) and children with ASD (D), Follow vs. Turn-take in TD children (E) and children with ASD (F); (3) Cooperative(Lead, Follow, Turn-take) vs. Compete i.e., Lead vs. Compete in TD children (G) and children with ASD (H), Follow vs.Compete in TD children (I) and children with ASD (J), Turn-take vs. Compete in TD children (K) and children with ASD (L).*indicates signi�cant differences between the ASD and TD groups.
Page 22/22
Figure 6
Experimental conditions of Lead, Follow, Turn-take, and Compete (A), and the randomized blocked design protocol for thejoint action task (B).
Supplementary Files
This is a list of supplementary �les associated with this preprint. Click to download.
2SupplementaryMaterialsSAG2021.docx