Embed Size (px)
Citation preview
Dispelling the Black Magic of Solder Paste
Tony LentzFCT Assembly

Black magic (noun):
magic involving the supposed invocation of evil spirits for evil purposes
Gray magic (noun):
magic involving the secret formulation of solder paste for nefarious soldering purposes

Scientific Evaluation Dispels the Magic!
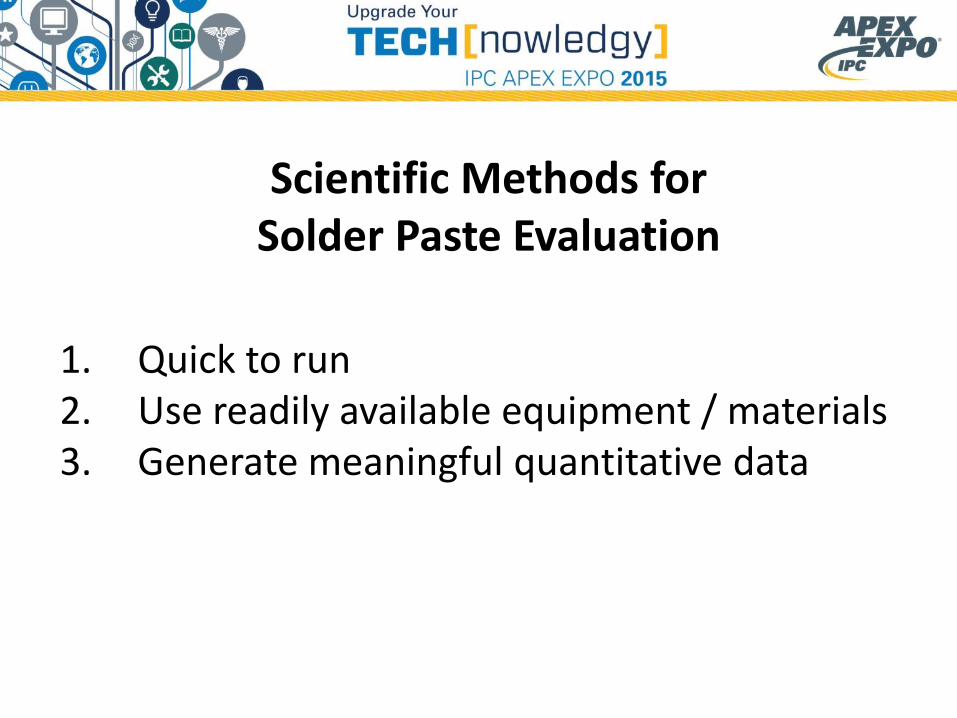
Scientific Methods for Solder Paste Evaluation
1. Quick to run2. Use readily available equipment / materials3. Generate meaningful quantitative data

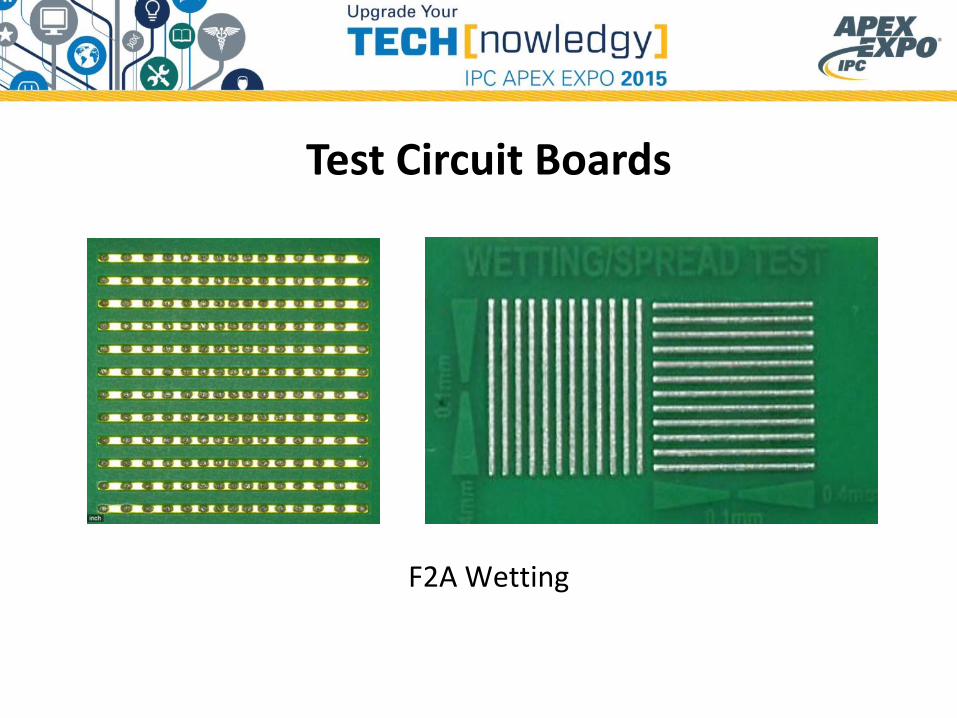
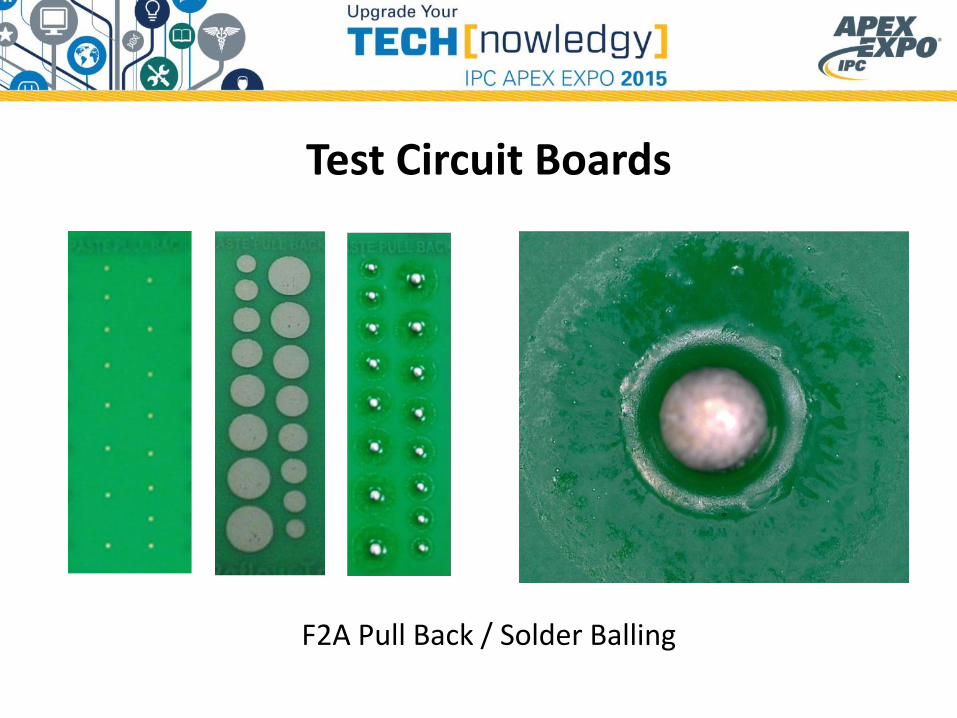
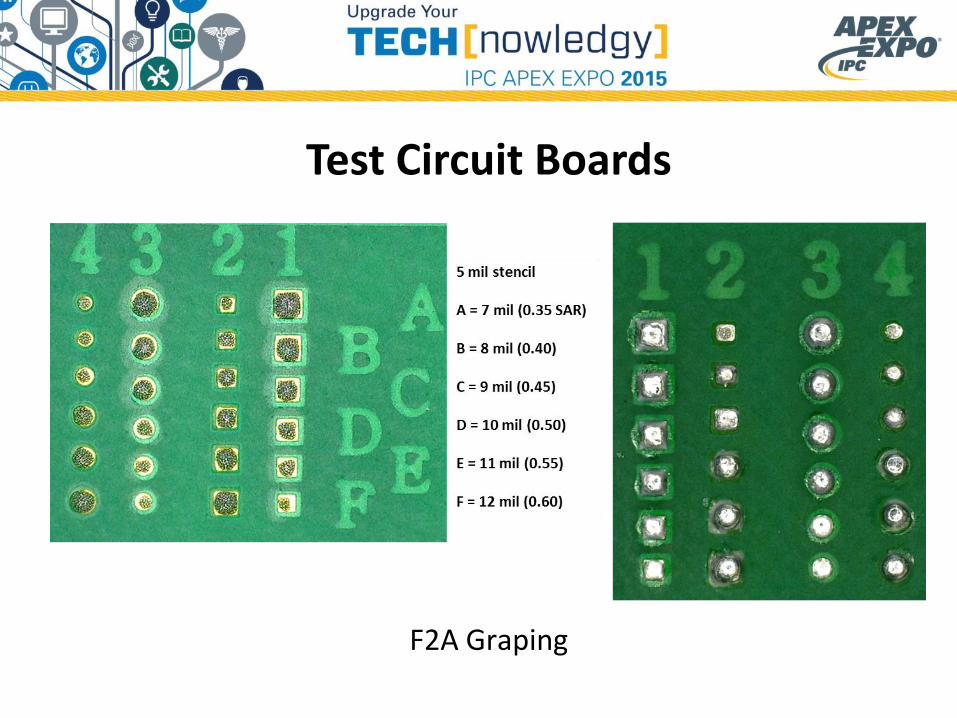
Test Circuit Boards
• Commercially available
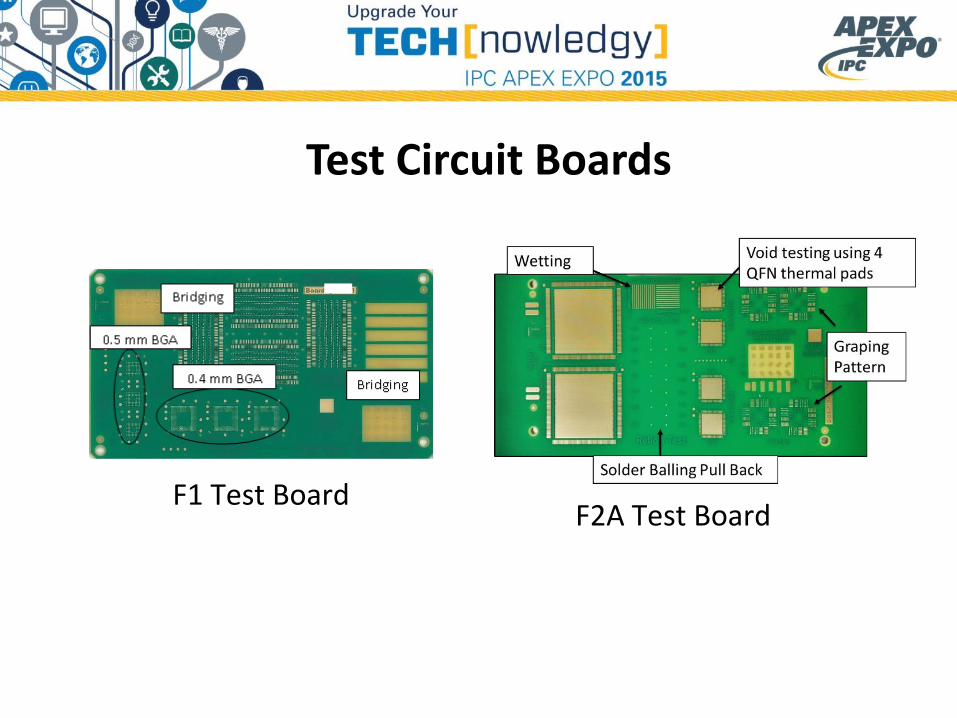
Test Circuit Boards
F1 Test BoardF2A Test Board
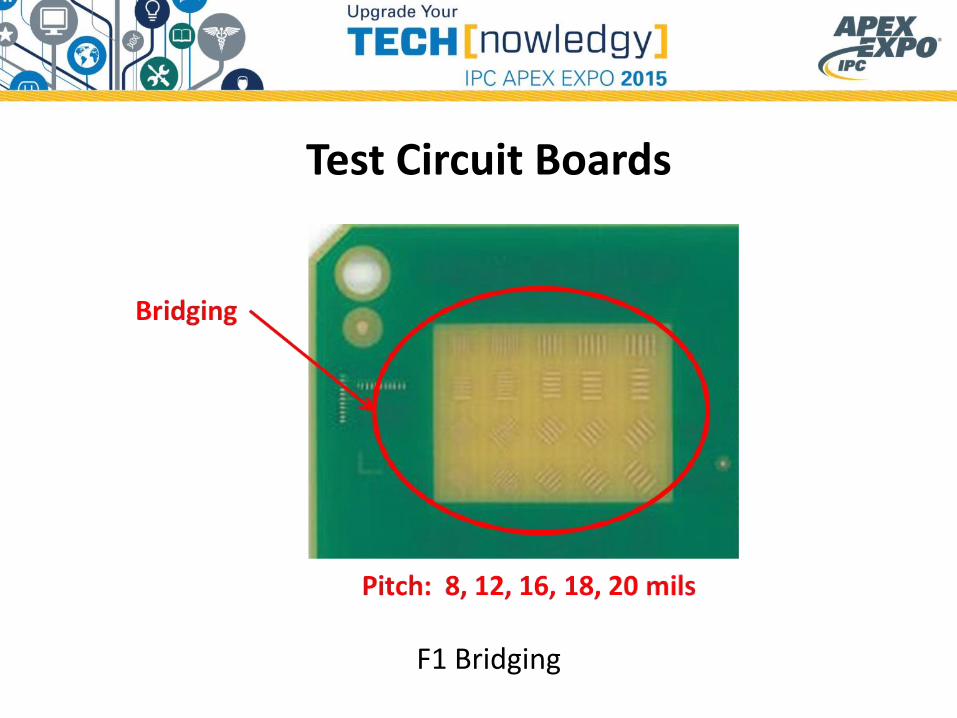
Test Circuit Boards
F1 Bridging
Test Circuit Boards
F2A Wetting
Test Circuit Boards
F2A Pull Back / Solder Balling
Test Circuit Boards
F2A Graping
Methods to Challenge Solder Paste
1. Printed volume and bridging2. Reflow performance3. Stencil life / Response to pause4. Stencil life / Reflow performance5. Open time6. Heat aging7. Continuous mixing8. Water washability
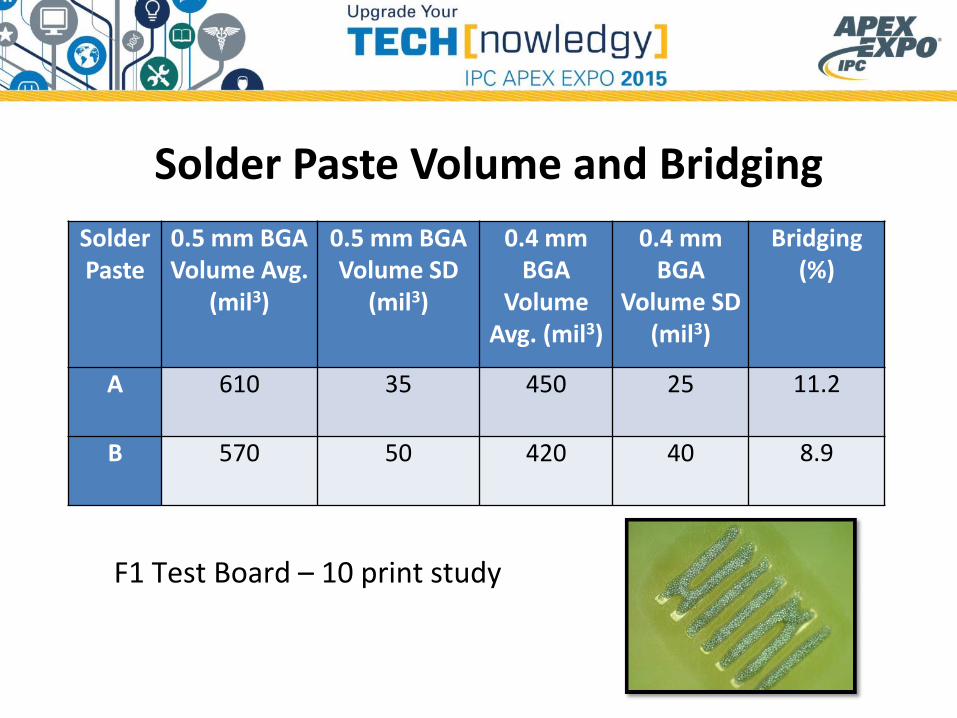
Solder Paste Volume and Bridging
F1 Test Board – 10 print study
Solder Paste
0.5 mm BGA Volume Avg.
(mil3)
0.5 mm BGA Volume SD
(mil3)
0.4 mm BGA
Volume Avg. (mil3)
0.4 mm BGA
Volume SD (mil3)
Bridging(%)
A 610 35 450 25 11.2
B 570 50 420 40 8.9
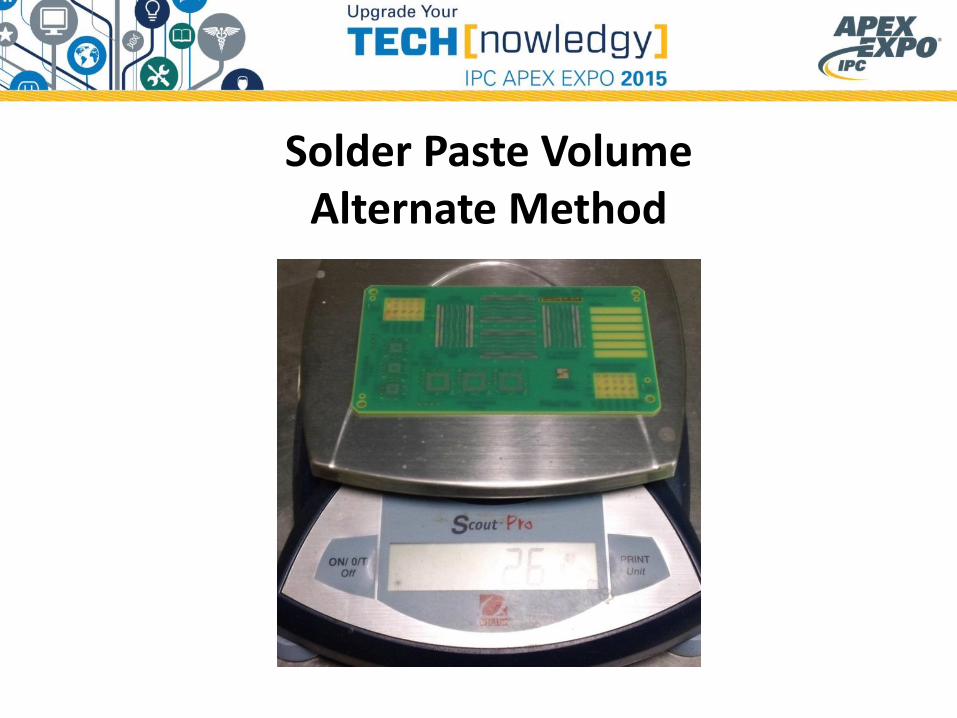
Solder Paste VolumeAlternate Method
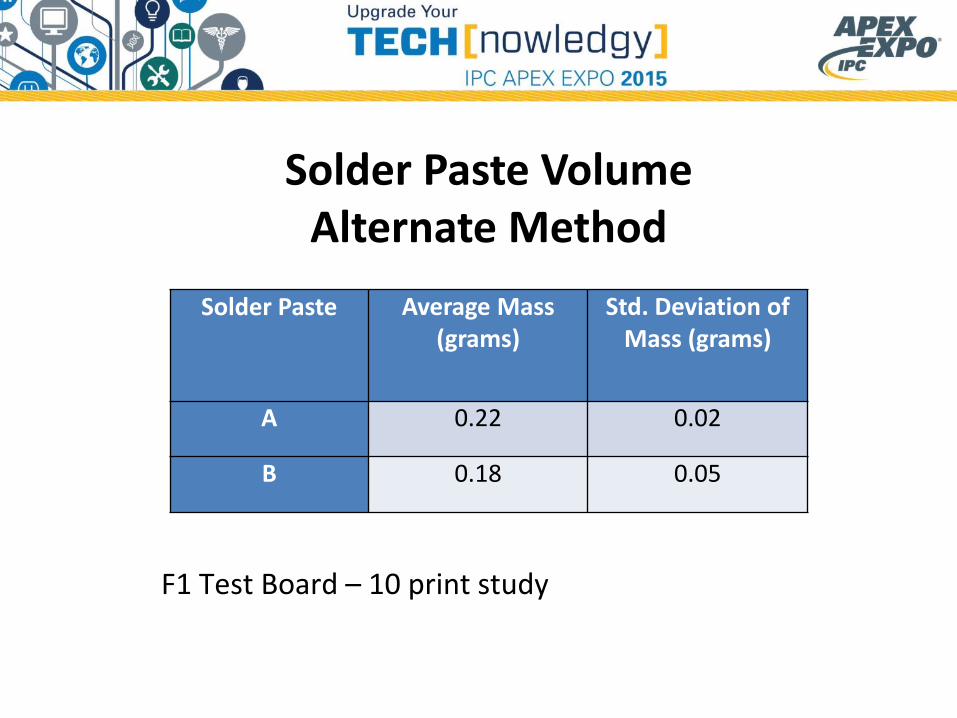
Solder Paste VolumeAlternate Method
F1 Test Board – 10 print study
Solder Paste Average Mass (grams)
Std. Deviation of Mass (grams)
A 0.22 0.02
B 0.18 0.05
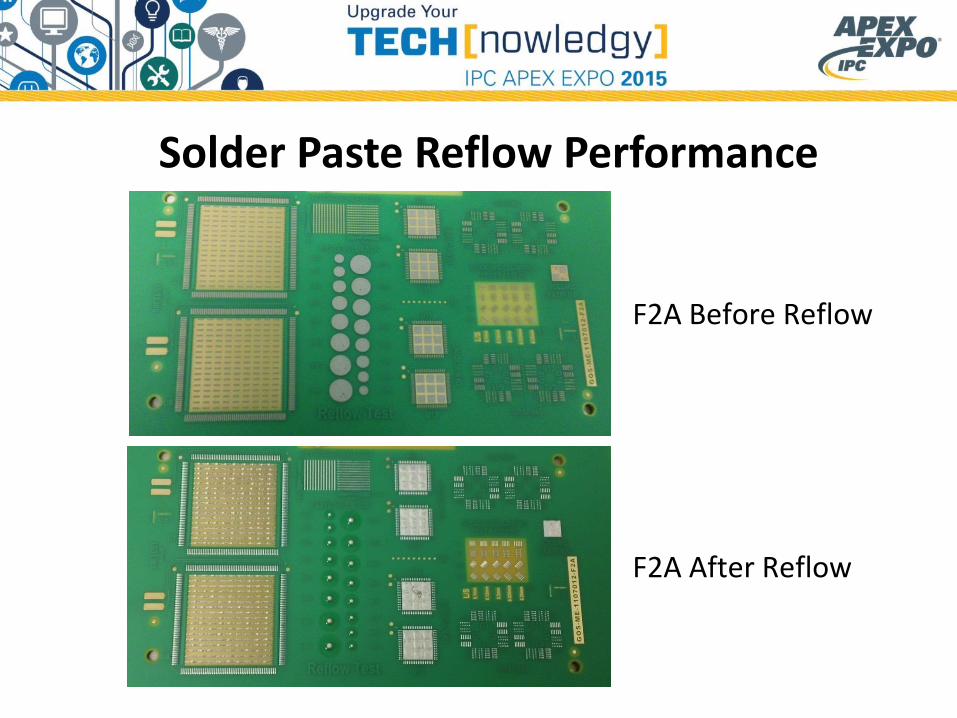
Solder Paste Reflow Performance
F2A Before Reflow
F2A After Reflow
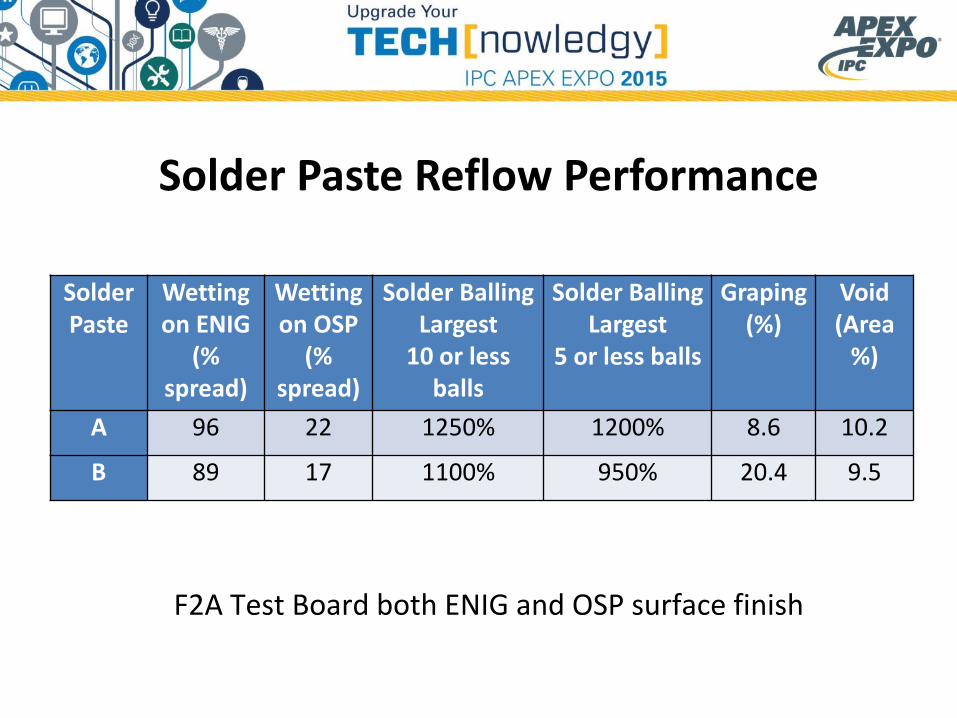
Solder Paste Reflow Performance
F2A Test Board both ENIG and OSP surface finish
Solder Paste
Wetting on ENIG
(% spread)
Wetting on OSP
(% spread)
Solder BallingLargest
10 or less balls
Solder BallingLargest
5 or less balls
Graping (%)
Void(Area
%)
A 96 22 1250% 1200% 8.6 10.2
B 89 17 1100% 950% 20.4 9.5
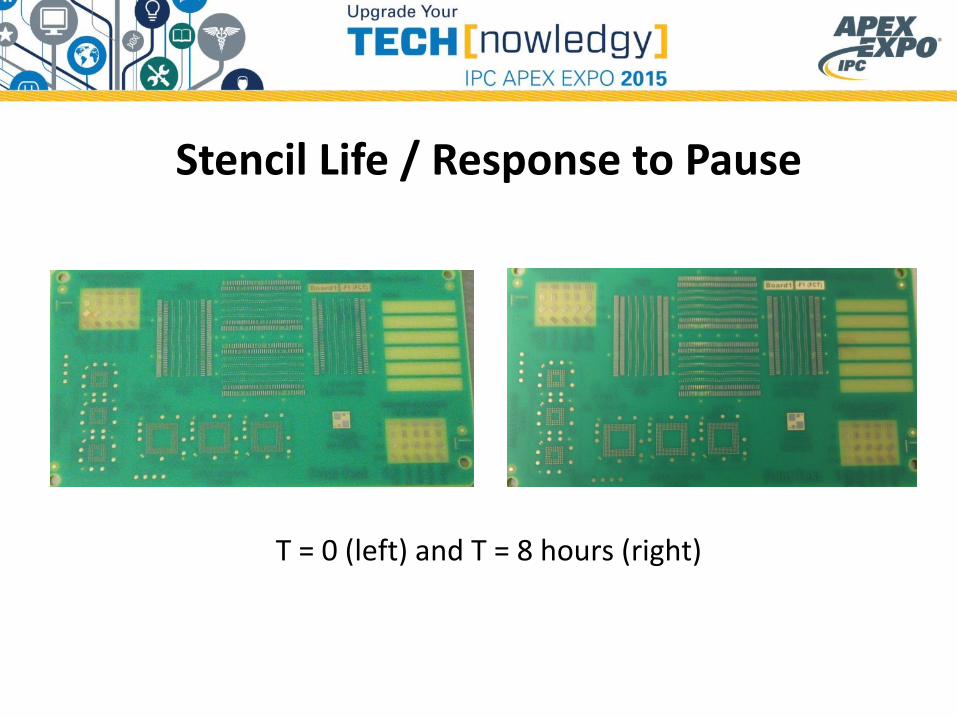
Stencil Life / Response to Pause
T = 0 (left) and T = 8 hours (right)
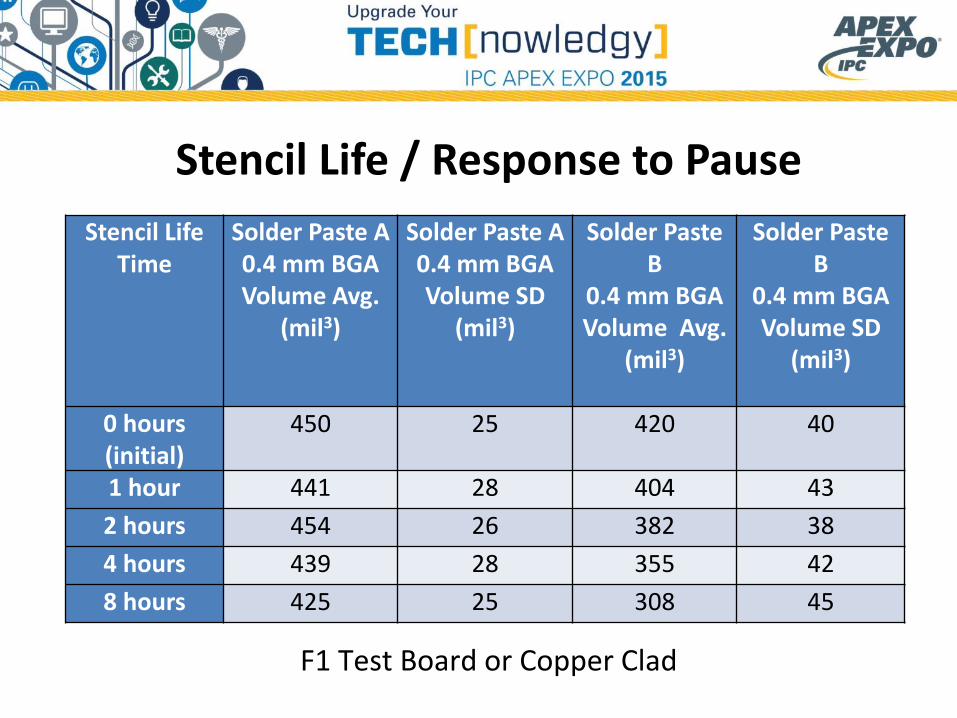
Stencil Life / Response to Pause
F1 Test Board or Copper Clad
Stencil Life Time
Solder Paste A0.4 mm BGA Volume Avg.
(mil3)
Solder Paste A0.4 mm BGA Volume SD
(mil3)
Solder Paste B
0.4 mm BGA Volume Avg.
(mil3)
Solder Paste B
0.4 mm BGA Volume SD
(mil3)
0 hours (initial)
450 25 420 40
1 hour 441 28 404 43
2 hours 454 26 382 38
4 hours 439 28 355 42
8 hours 425 25 308 45
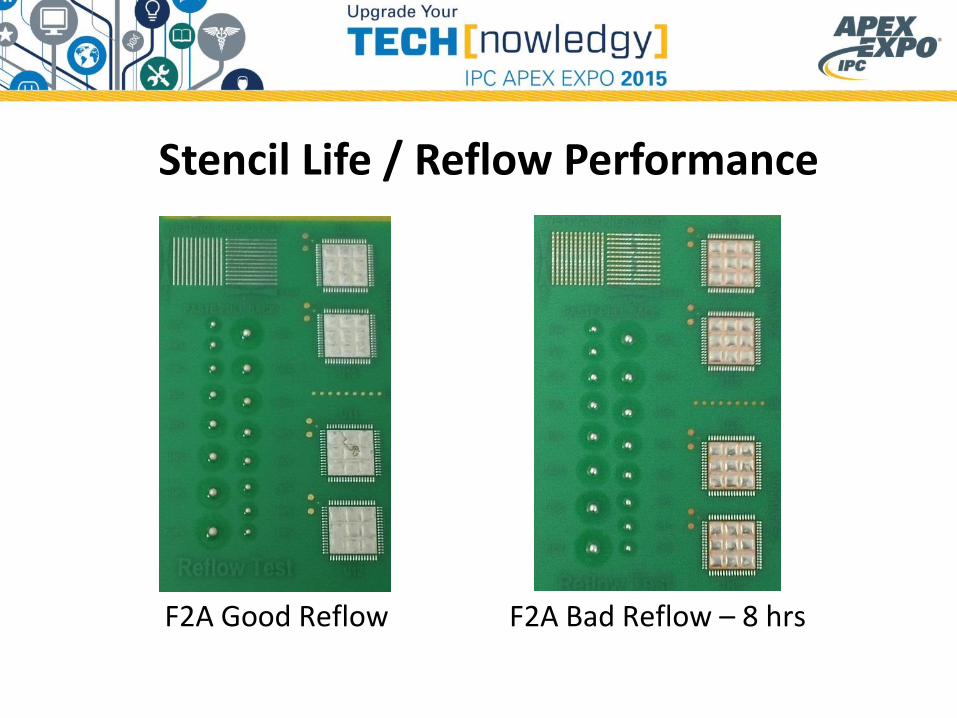
Stencil Life / Reflow Performance
F2A Good Reflow F2A Bad Reflow – 8 hrs
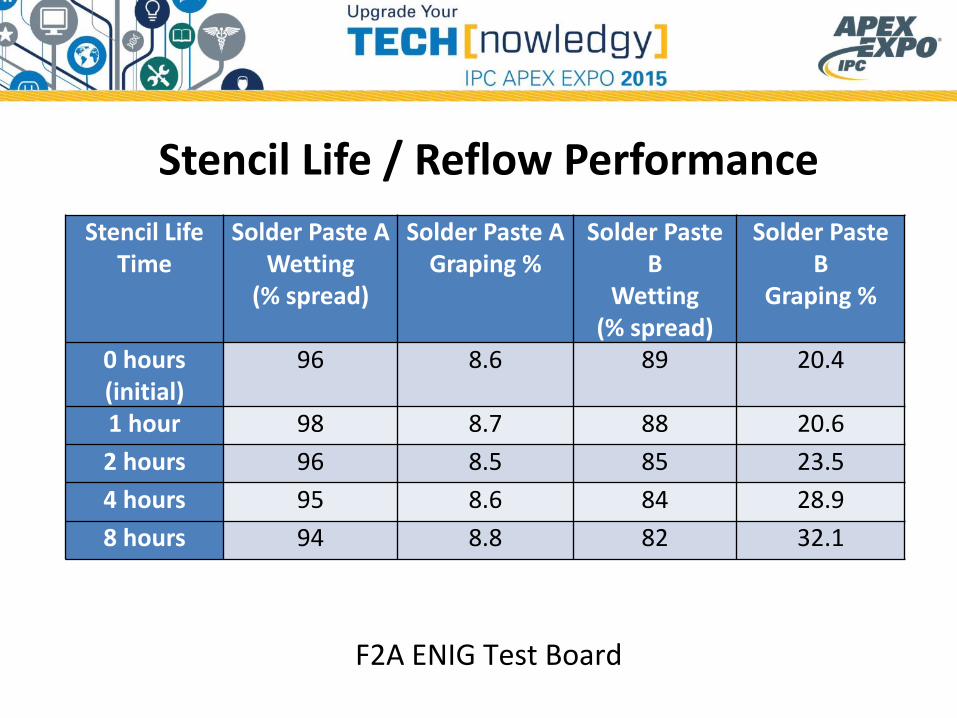
Stencil Life / Reflow Performance
F2A ENIG Test Board
Stencil Life Time
Solder Paste AWetting
(% spread)
Solder Paste AGraping %
Solder Paste B
Wetting (% spread)
Solder Paste B
Graping %
0 hours (initial)
96 8.6 89 20.4
1 hour 98 8.7 88 20.6
2 hours 96 8.5 85 23.5
4 hours 95 8.6 84 28.9
8 hours 94 8.8 82 32.1
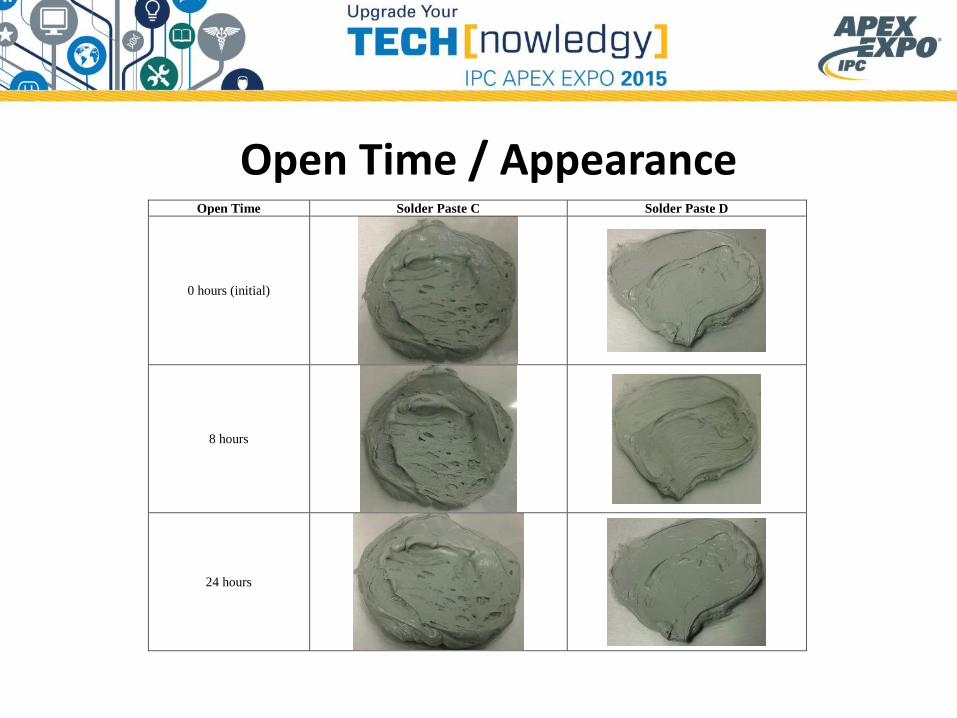
Open Time / AppearanceOpen Time Solder Paste C Solder Paste D
0 hours (initial)
8 hours
24 hours
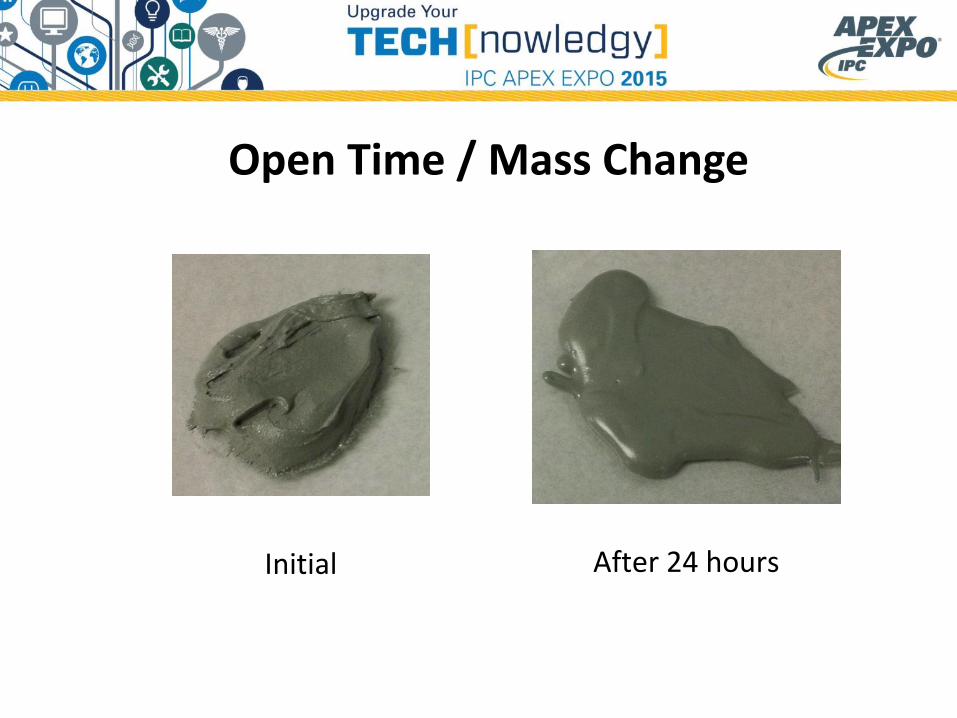
Open Time / Mass Change
Initial After 24 hours
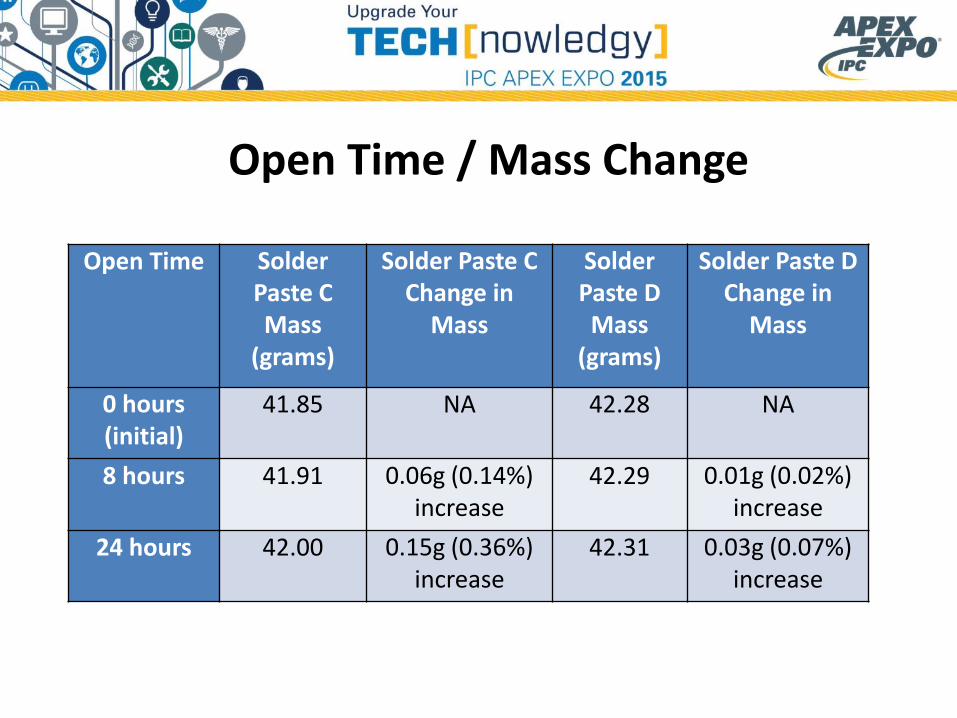
Open Time / Mass Change
Open Time Solder Paste CMass
(grams)
Solder Paste CChange in
Mass
Solder Paste D
Mass (grams)
Solder Paste DChange in
Mass
0 hours (initial)
41.85 NA 42.28 NA
8 hours 41.91 0.06g (0.14%) increase
42.29 0.01g (0.02%) increase
24 hours 42.00 0.15g (0.36%) increase
42.31 0.03g (0.07%) increase
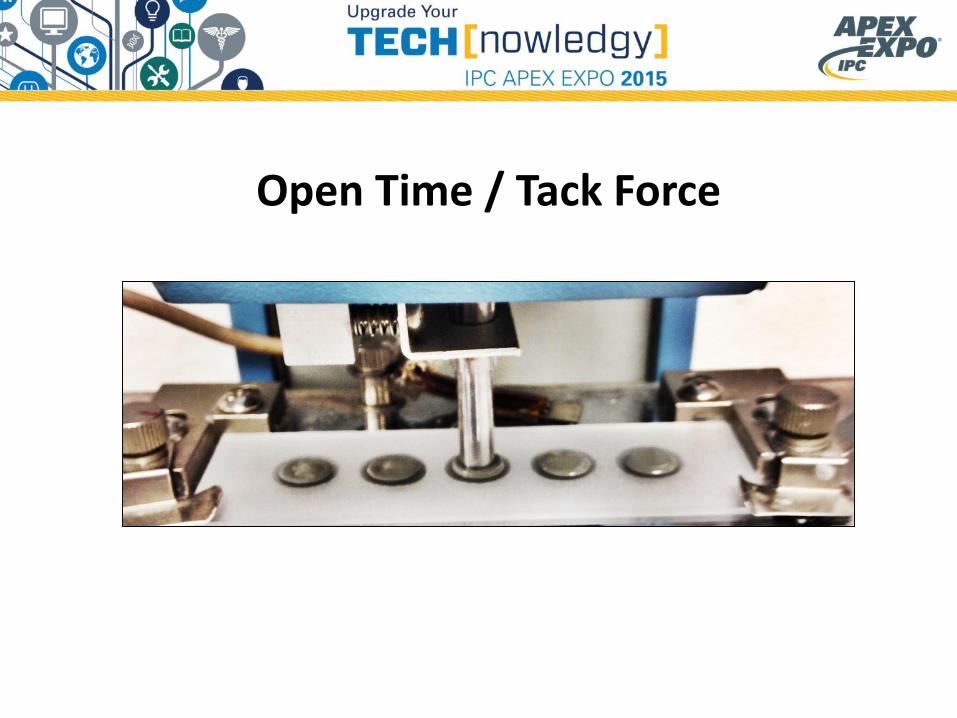
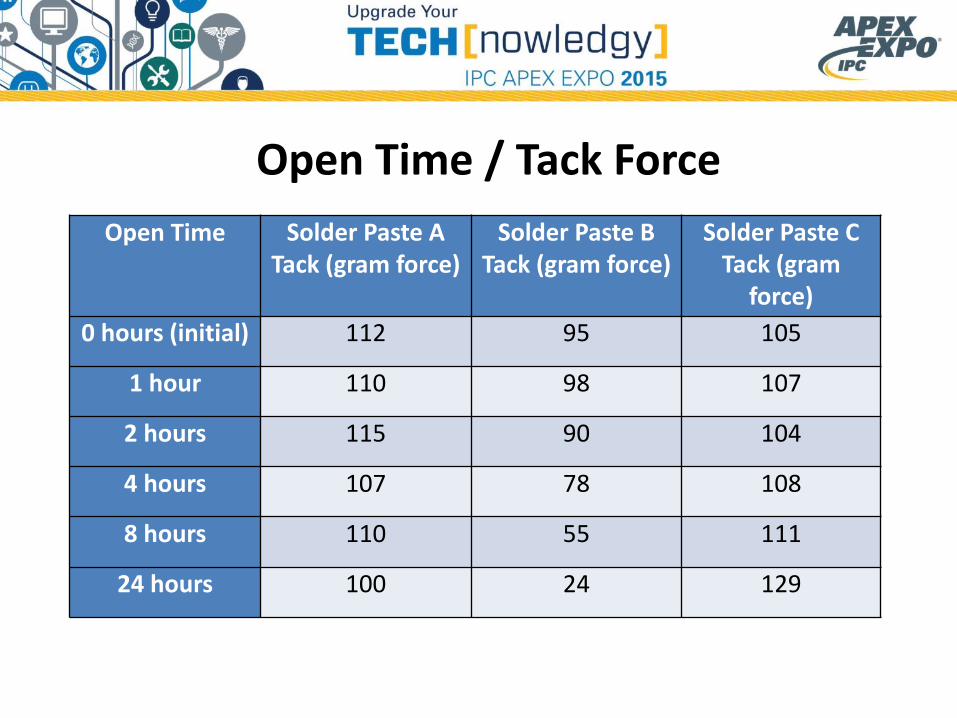
Open Time / Tack Force
Open Time / Tack Force
Open Time Solder Paste ATack (gram force)
Solder Paste BTack (gram force)
Solder Paste CTack (gram
force)
0 hours (initial) 112 95 105
1 hour 110 98 107
2 hours 115 90 104
4 hours 107 78 108
8 hours 110 55 111
24 hours 100 24 129

Open Time / Component Tack
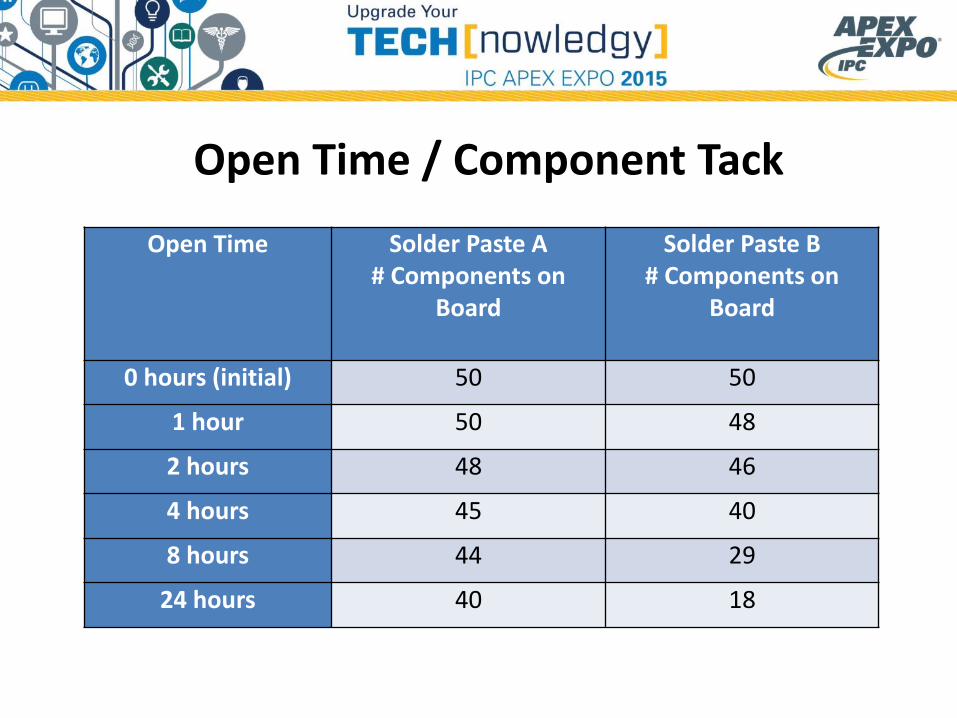
Open Time / Component Tack
Open Time Solder Paste A# Components on
Board
Solder Paste B# Components on
Board
0 hours (initial) 50 50
1 hour 50 48
2 hours 48 46
4 hours 45 40
8 hours 44 29
24 hours 40 18
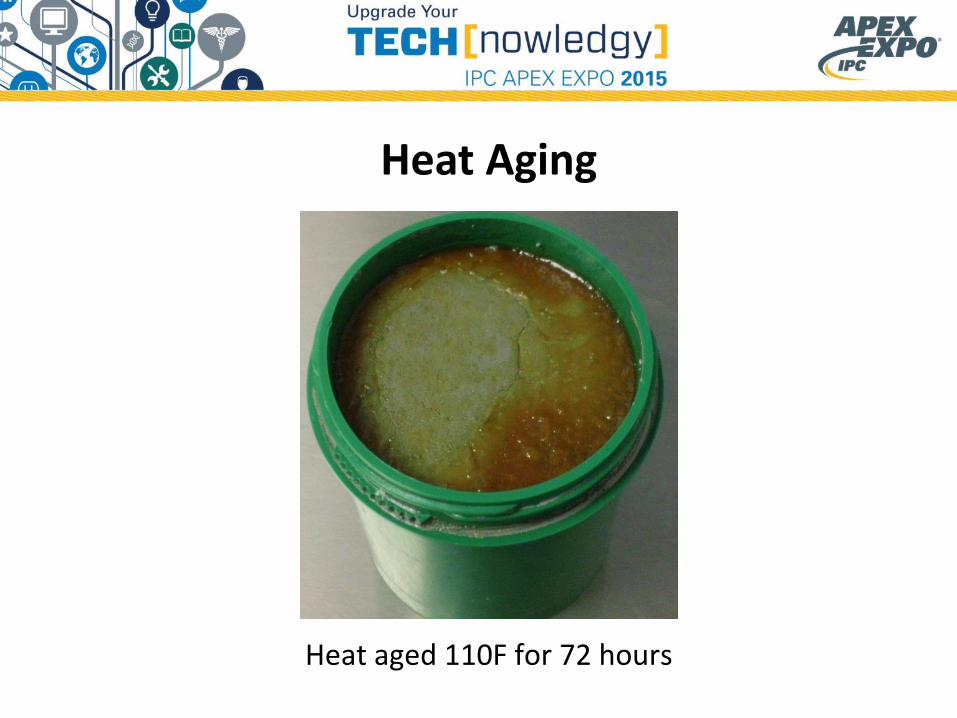
Heat Aging
Heat aged 110F for 72 hours
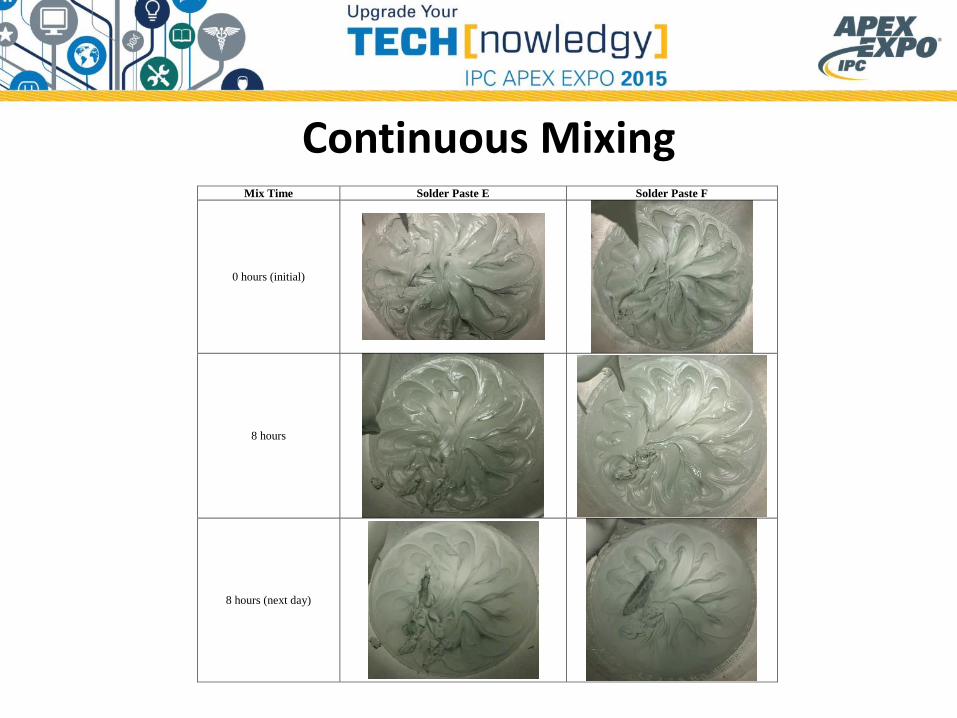
Continuous MixingMix Time Solder Paste E Solder Paste F
0 hours (initial)
8 hours
8 hours (next day)
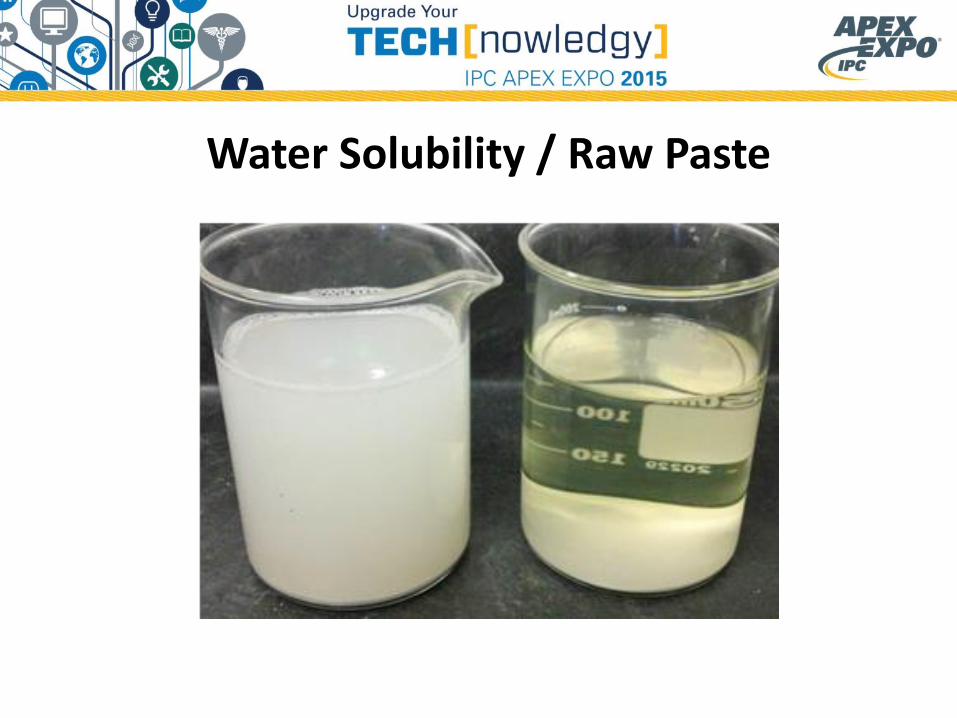
Water Solubility / Raw Paste
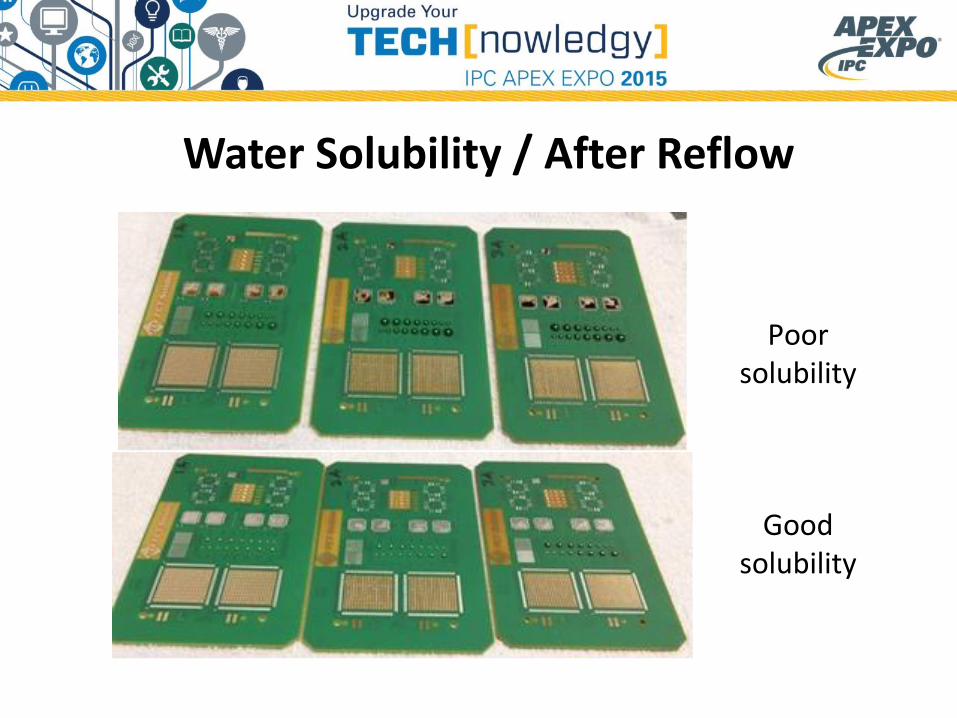
Water Solubility / After Reflow
Poor solubility
Good solubility
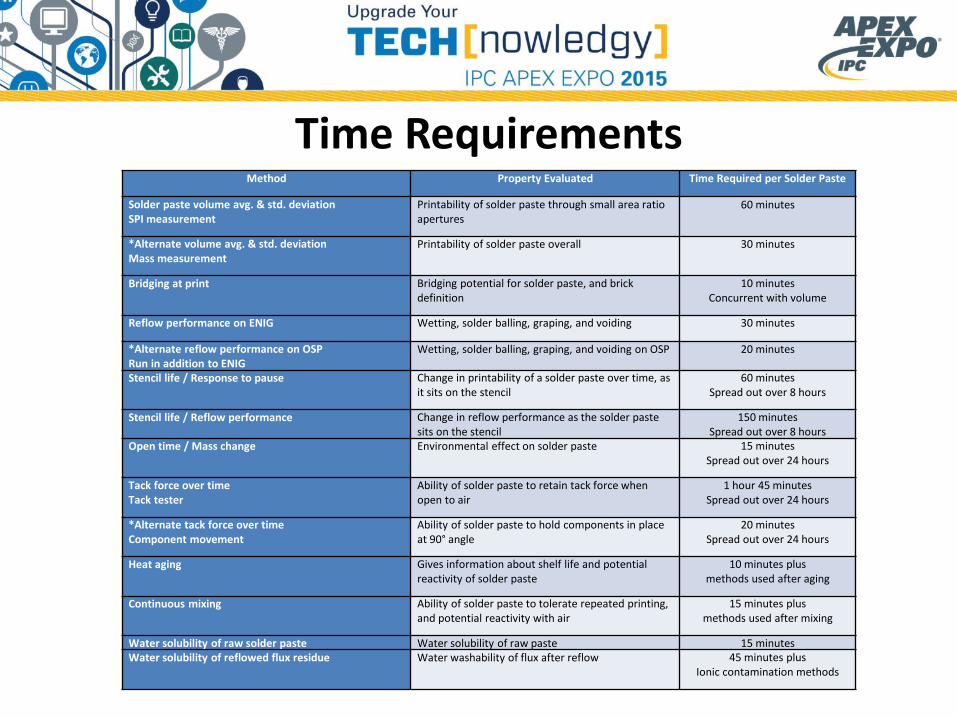
Time RequirementsMethod Property Evaluated Time Required per Solder Paste
Solder paste volume avg. & std. deviationSPI measurement
Printability of solder paste through small area ratio apertures
60 minutes
*Alternate volume avg. & std. deviationMass measurement
Printability of solder paste overall 30 minutes
Bridging at print Bridging potential for solder paste, and brick definition
10 minutesConcurrent with volume
Reflow performance on ENIG Wetting, solder balling, graping, and voiding 30 minutes
*Alternate reflow performance on OSPRun in addition to ENIG
Wetting, solder balling, graping, and voiding on OSP 20 minutes
Stencil life / Response to pause Change in printability of a solder paste over time, as it sits on the stencil
60 minutesSpread out over 8 hours
Stencil life / Reflow performance Change in reflow performance as the solder paste sits on the stencil
150 minutesSpread out over 8 hours
Open time / Mass change Environmental effect on solder paste 15 minutesSpread out over 24 hours
Tack force over timeTack tester
Ability of solder paste to retain tack force when open to air
1 hour 45 minutesSpread out over 24 hours
*Alternate tack force over timeComponent movement
Ability of solder paste to hold components in place at 90° angle
20 minutesSpread out over 24 hours
Heat aging Gives information about shelf life and potential reactivity of solder paste
10 minutes plusmethods used after aging
Continuous mixing Ability of solder paste to tolerate repeated printing, and potential reactivity with air
15 minutes plusmethods used after mixing
Water solubility of raw solder paste Water solubility of raw paste 15 minutesWater solubility of reflowed flux residue Water washability of flux after reflow 45 minutes plus
Ionic contamination methods
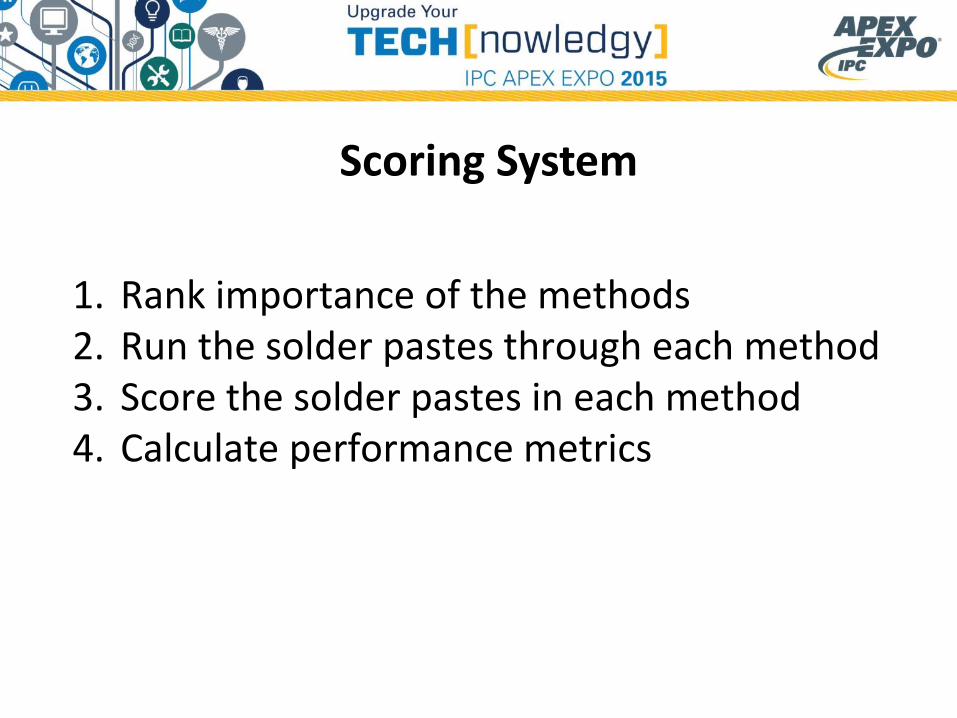
Scoring System
1. Rank importance of the methods2. Run the solder pastes through each method3. Score the solder pastes in each method4. Calculate performance metrics
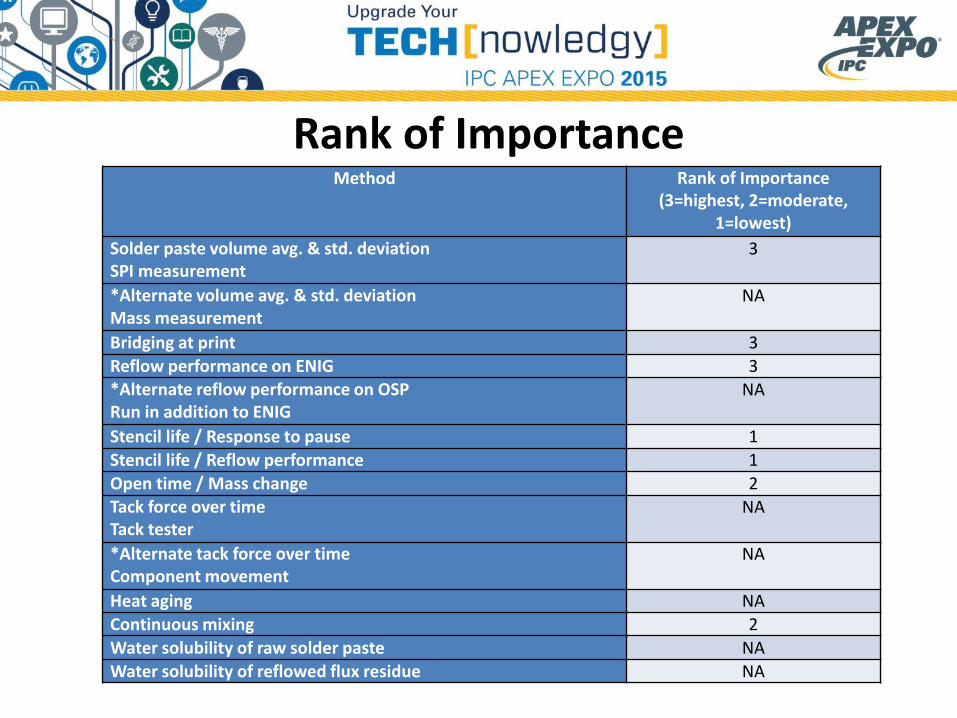
Rank of ImportanceMethod Rank of Importance
(3=highest, 2=moderate, 1=lowest)
Solder paste volume avg. & std. deviationSPI measurement
3
*Alternate volume avg. & std. deviationMass measurement
NA
Bridging at print 3
Reflow performance on ENIG 3*Alternate reflow performance on OSPRun in addition to ENIG
NA
Stencil life / Response to pause 1
Stencil life / Reflow performance 1
Open time / Mass change 2Tack force over timeTack tester
NA
*Alternate tack force over timeComponent movement
NA
Heat aging NA
Continuous mixing 2
Water solubility of raw solder paste NA
Water solubility of reflowed flux residue NA
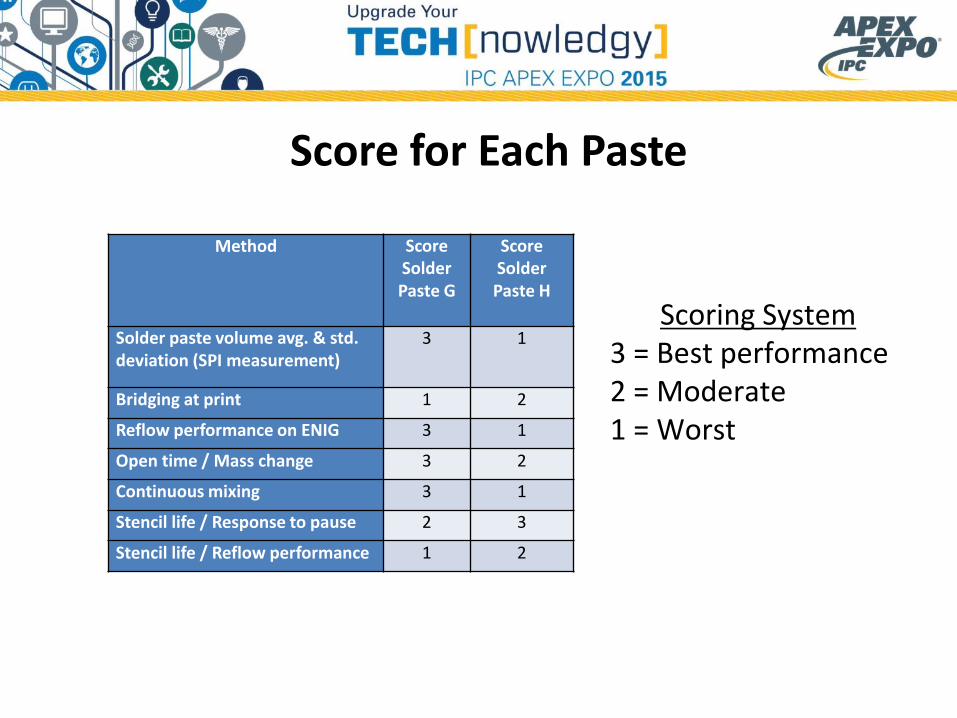
Score for Each Paste
Method ScoreSolder Paste G
ScoreSolder Paste H
Solder paste volume avg. & std. deviation (SPI measurement)
3 1
Bridging at print 1 2
Reflow performance on ENIG 3 1
Open time / Mass change 3 2
Continuous mixing 3 1
Stencil life / Response to pause 2 3
Stencil life / Reflow performance 1 2
Scoring System3 = Best performance2 = Moderate1 = Worst
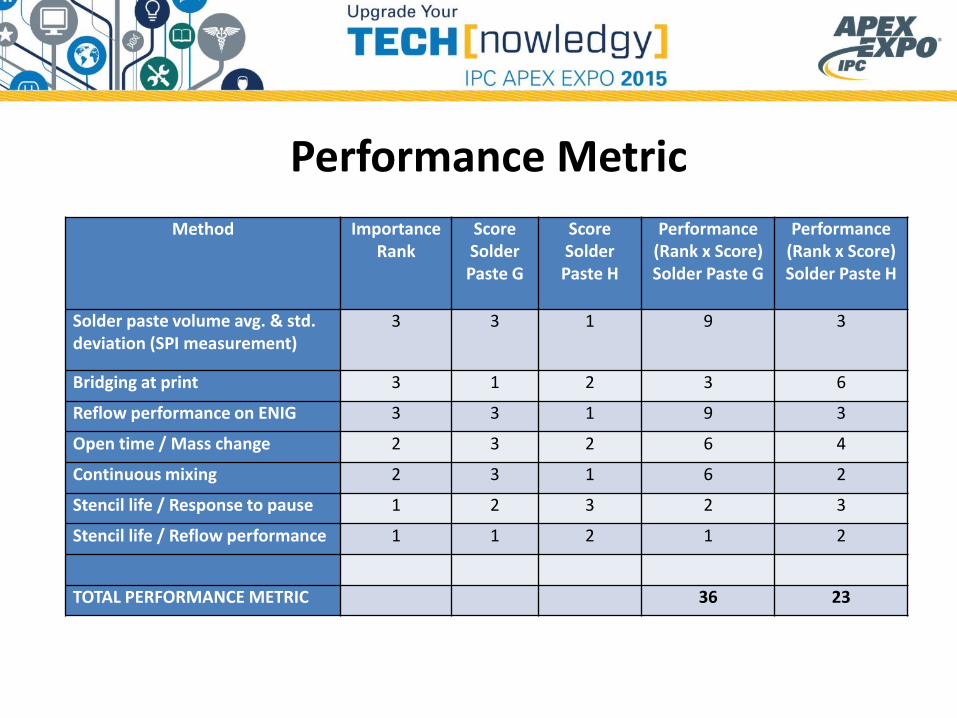
Performance Metric
Method Importance Rank
ScoreSolder Paste G
ScoreSolder Paste H
Performance(Rank x Score)Solder Paste G
Performance(Rank x Score)Solder Paste H
Solder paste volume avg. & std. deviation (SPI measurement)
3 3 1 9 3
Bridging at print 3 1 2 3 6
Reflow performance on ENIG 3 3 1 9 3
Open time / Mass change 2 3 2 6 4
Continuous mixing 2 3 1 6 2
Stencil life / Response to pause 1 2 3 2 3
Stencil life / Reflow performance 1 1 2 1 2
TOTAL PERFORMANCE METRIC 36 23
Conclusions
• Black magic of solder paste can be dispelled!• Challenging methods differentiate • Data is used to rank performance
Don’t trust your gut Use data!

Acknowledgements
We appreciate the support of Jabil Circuit who allowed us to use their test board designs.
Also appreciated is the hard work of the lab staff at FCT Assembly who aided in the development and testing of the methods.