Embed Size (px)
Citation preview
Dispensing Pattern of Generic and Brand-NameDrugs in Children
Alex Y. Chen, MD, MSHS; Susan Wu, MD
Objective.—To describe the dispensing patterns of generic andbrand-name drugs in children and to identify patient sociodemo-graphic characteristics associated with generic drug use.
Methods.—We analyzed data from the 2002 Medical Expendi-tures Panel Survey. This survey is conducted by the Agency forHealthcare Research and Quality and consists of a nationally rep-resentative sample of civilian noninstitutionalized population ofthe United States. The 2002 survey included 14 828 familiesand 37 418 individuals, 11 099 of whom were children 0 to17 years of age. Our unit of analysis was individual prescriptiondrugs dispensed to children 0 to 17 years of age. The main depen-dent variable for the logistic model was the use of generic drugs.Independent variables included age, gender, race, insurance type,family income, Metropolitan Statistical Area status, and healthstatus.
Results.—Generic drugs were filled in 40.6% of the 24 465 pre-scriptions analyzed. Average expenditure for generic drugs was
$20.92 (SD 24.53) per prescription versus $71.65 (SD $170.22)for brand-name drugs. Use of generic versus brand-name drugsvaried by conditions and medication class. Uninsured patientswere more likely than privately insured patients to have a genericdrug dispensed than brand-name drugs (odds ratio [OR] 1.42;95% confidence interval [CI], 1.10–1.84). Asian children weremore likely than white children to receive generic drugs (OR,1.66; 95% CI, 1.07–2.57). Girls were also more likely thanboys to receive generic drugs over brand-name drugs (OR, 1.36;95% CI, 1.08–1.73).
Conclusions.—Generic drugs were dispensed more often to unin-sured children, Asian children, and girls.
KEY WORDS: generic drugs; medical expenditure panelsurvey; prescription drugs
Ambulatory Pediatrics 2008;8:189–194
The cost of prescription drugs has risen to approxi-mately 10% of total health care expenditures inthe United States; it is also one of the fastest-rising
costs in the health care sector.1 The increasing costs of pre-scription medication also places additional burden on al-ready stressed public insurance programs. According tothe Government Accountability Office, Medicaid expendi-tures on outpatient prescription drugs have increased from$4.6 billion in 1990 (7% of total budget) to $33.8 billion(13% of total) in 2003. The Centers for Medicare and Med-icaid Services reported total US expenditure from all payersources to be $51 billion in 1993 and $157.9 billion in2002.1 The Centers for Medicare and Medicaid Servicesprojected this amount to be $446.3 billion by year 2015.2
Many factors contribute to this increased spending. Duboisand colleagues3 cited new drug development, new indica-tions for drugs, increased disease prevalence, an aging pop-ulation, increased quantities of drugs being prescribed,increased dispensing fees, and inflation as causative fac-tors.3–5 In 2002, the per capita annual expenditure for pre-scription drugs was $5485.1 The average prescription pricehad also more than tripled the average inflation rate of 2.5%.6
In order to contain prescription drug costs, many insur-ance providers and government entities have adopted var-
From the Division of General Pediatrics, Department of Pediatrics,
Children’s Hospital Los Angeles (Dr Chen), Keck School of Medicine
at the University of Southern California (Dr Wu), Los Angeles, Calif.
Address correspondence to Alex Chen, MD, MSHS, Childrens Hospital
Los Angeles, MS #30, 4650 Sunset Boulevard, Los Angeles, California
90027 (e-mail: [email protected]).
Received for publication July 16, 2007; accepted December 25, 2007.
AMBULATORY PEDIATRICSCopyright � 2008 by Academic Pediatric Association 18
ious strategies, including prior authorization, dispensinglimits, cost sharing (eg, tiered copays and deductibles),and generic substitution.7 A survey of 36 states by theKaiser Commission on Medicaid and the Uninsured foundthat in 2000, 36% of state Medicaid programs required ge-neric substitution, and that proportion increased to 70% in2003 and to 92% in 2005.8 Similarly, 82% of the states re-quired prior authorization for brand-name drugs in 2000,95% by 2003, and 100% by 2005.8 Private insurers alsoimplemented similar policies. In 2000, only 27% ofemployer-based insurance programs used a 3- or 4-tieredpharmacy benefit design; by 2005, the proportion hadincreased to 74%.8
The few studies that have examined the effects of pre-scription drug policies have shown a decrease in prescrip-tion drug expenditures, but not without detriment. Severalstudies have shown that implementing preferred drug listsleads to decreased access to newer or more effective drugs,particularly for certain vulnerable segments of the popula-tion.9–11 Newer drugs may have improved efficacy, moreconvenient dosing, or more favorable side effect profilesthan older drugs. Lichtenberg12 found that newer drugsare associated with reduced mortality, fewer work-dayslost, and net decrease in cost attributable to shorter hospitalstays and lower hospital expenditures. In addition, prescrip-tion drug costs are increasingly being shifted toward the pa-tient (via increased copays and deductibles), resulting infurther decreased access to needed medications.13–16
Among adult patients, factors found to be associated withdecreased access of prescription medications include gen-der, race, insurance status, and health status.16
Volume 8, Number 39 May–June 2008
190 Chen and Wu AMBULATORY PEDIATRICS
Generic substitution in particular is a formulary-restrict-ing strategy that may also exacerbate disparities. TheHatch-Waxman Act in 1984, which created an expeditedprocess for approving generic drugs, also led to less com-prehensive bioequivalence testing and efficacy trials.17–19
There are several case reports of therapeutic failure of cer-tain generics; use of generic cyclosporine was associatedwith a 2-fold greater risk of biopsy-proven acute graftrejection in renal transplant patients.20 Thus, the use ofgeneric drugs may disproportionately affect the health out-comes of some patients.21
Because the use of generic drugs may lead to a differencein patient outcomes, and because policies governing thedispensing of generic drugs may lead to inequitable distri-bution by sociodemographic characteristics, we aimed tostudy the dispensing pattern of generic and brand-namedrugs among US children. We hypothesized that sociallyand economically disadvantaged children might be morelikely to receive generic drugs over brand-name drugs.To our knowledge, this is the first study that used nationaldata to describe generic and brand-name prescription drugdispensing pattern in children.
METHODS
Our conceptual framework was based on Andersen’sBehavioral Model of Health Services Utilization.22 Thismodel is one of the most frequently used social modelsthat captures patient-level factors influencing health care.It consists of 3 main components: predisposing character-istics, enabling factors, and the need for health care. Predis-posing characteristics are demographic factors such as age,gender, and race. Enabling factors are factors such as fam-ily income, insurance status, education status, and region ofresidence. The need for health care consists of factors, suchas health status, medical conditions, and diagnosis, thatdetermine the health care needs of an individual.
Data Source and Study Population
We used the public use files of the Household Compo-nent and the Prescribed Medicine Event File of the 2002Medical Expenditure Panel Survey (MEPS), a national sur-vey on the use and expenditures of medical care conductedby the Agency for Healthcare Research and Quality.23,24
The MEPS has been conducted annually since 1996 andconsists of a nationally representative sample of the nonin-stitutionalized civilian population of the United States. The2002 survey included 14 828 families and 37 418 individ-uals, 11 099 of whom were children 0 to 17 years of age.Each family in the household component participated in5 rounds of data collection. A core questionnaire was ad-ministered by computer-assisted interviewing to obtain in-formation about each family member’s health status, use ofmedical services, health care expenditures, income, and in-surance coverage. Different versions of the health statusitems were used for adults and for children. In addition,data were collected each round for specific medical eventsand compiled in event files. The events included office-based medical provider visits, outpatient department visits,
emergency room visits, hospital inpatient stays, dentalvisits, prescribed medicines, home health care, and othermedical expenses.
The prescribed medicine event file provides detailed in-formation on household-reported use of prescription drugs.Each record in the file represents one prescription drug pur-chased for members in the household during calendar year2002, each a unique prescribed medicine event. The infor-mation was collected primarily from household reports;data from medical providers and pharmacies were usedto provide expenditures and details of the medication. Dur-ing each round of data collection, all respondents wereasked to give the name of any prescription medicine theyor their family members obtained, the number of timesa medicine was obtained, and a list of names and addressesof pharmacies that filled their prescriptions. We contactedpharmacy providers with written permission to obtaina computerized printout of all prescriptions filled for thehousehold. The printout included the date a medicinewas filled, the national drug code, medication name,dose, quantity, total charge, and payment sources.
Variable Definitions
Generic designation was derived from the Multum Lex-icon label for the product’s status as a brand-name drug ora generic drug, independent of patient-level characteris-tics.25 Drug class and subclass were also derived by usingMultum classification.25 Pediatric conditions associatedwith each prescribed medicine were reported by house-hold. This information was provided by MEPS by usingcollapsed ICD-9-CM codes (3-digit code without deci-mals) to protect patients from deductive disclosure. Thecodes were verified by professional coders with a MEPS-reported error rate of less than 2.5%. Of note, althoughwe did not intentionally exclude drug classes or pediatricconditions with limited generic option from the analysis,all drug class and subclass and condition reported in thestudy had generic therapeutic alterative, but not necessarilya pharmacological equivalent.
Expenditures in MEPS are defined as the sum of pay-ments for care received, including out-of-pocket paymentsand payments made by private insurance, public insuranceprograms, and other sources. Although expenditures inMEPS incorporated discounts given to payers, they usuallydid not account for manufacturer rebates, which are oftennegotiated by and paid to the insurance company, phar-macy benefit manager, or other third-party payer.
For logistic regression, we used whether a drug had a ge-neric designation as the dependent variable (1 ¼ genericdrug; 0¼ nongeneric, brand-name drug). Independent var-iables were chosen on the basis of the study conceptualframework and preliminary bivariate descriptions. Themain explanatory variables were patient sociodemographiccharacteristics consisting of: (1) indicator variables forchild’s gender (categorized as male, female), and race/eth-nicity, categorized as non-Hispanic white, non-Hispanicblack, Hispanic, Asian, or other; (2) family income, cate-gorized as poor (<100% federal poverty level [FPL]),near poor (100%–124% FPL), low income (125%–199%

AMBULATORY PEDIATRICS Generic and Brand-Name Drugs in Children 191
FPL), middle income (200%–399% FPL), or high income($400% FPL) (these family income categorizations werebased on the 2002 Census Current Population Survey);and (3) insurance coverage, categorized as uninsured, pri-vate insurance, or public insurance. Uninsured was definedas without insurance during all of 2002; private insurancewas defined as any private coverage during 2002 (ie, em-ployer, union, group or school, and self-purchased); publicinsurance was defined as coverage under Tricare, Medi-care, Medicaid, State Children’s Health Insurance Pro-gram, or other public hospital programs. We alsoincluded the child’s age, Metropolitan Statistical Area,and health status as control variables (categorized as excel-lent, very good, good, fair, or poor), as well as interactionterm between gender and age.
Statistical Analysis
Our analysis was aimed at testing the hypothesis thatpatient’s sociodemographic characteristics are associatedwith the dispensing of generic prescription drugs. We con-ducted all analyses with the STATA statistical package(version 8.1, StataCorp, College Station, Tex). The analyticsample consisted of individual prescription medication dis-pensed to children 0 to 17 years of age in the calendar year2002. We chose to conduct the analysis at the event levelprimarily because we believe that the circumstances sur-rounding each prescription can be unique, and we tried toaccount for biases at the person level by using clusteringadjustments. We excluded medications with missing ge-neric versus brand-name designation based on Multumclassification. We performed univariate and bivariate anal-yses summarizing the percentage of generic prescriptionsdispensed and the mean prescription drug expenditure,by select pediatric conditions and drug class or subclass.We estimated a multivariate logistic regression model byusing variables specified above. A P value of .05 or lesswas chosen as the criterion for statistical significance inall analyses. We weighted all analyses with weights that re-flect the sample design of the MEPS as well as survey non-response, and we adjusted all standard errors for clusteringat the person level by the Huber-White sandwich estima-tor.26 This study was exempt from institutional reviewboard approval because it uses public-use data with noidentifiable information.
RESULTS
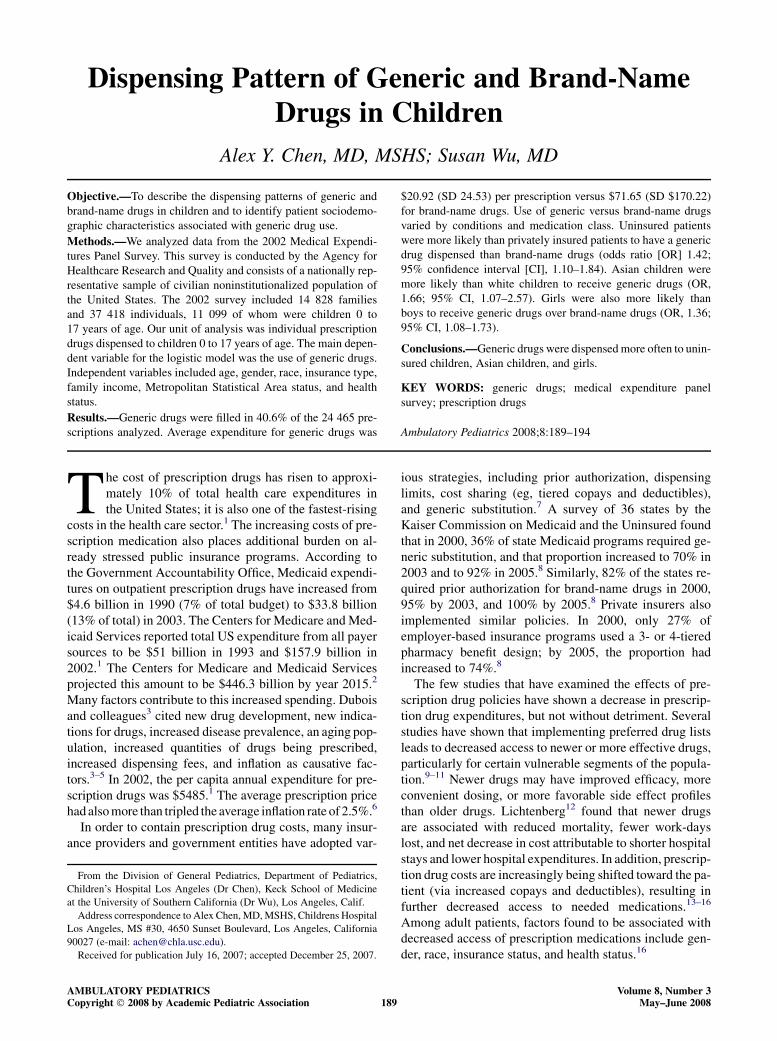
A total of 24 465 prescriptions were analyzed (all cova-riates had less than 1% missing data). Generic drugs consti-tuted 40.6% of the prescriptions dispensed in 2002 for USchildren 0 to 17 years of age (5696 children had at least oneprescribed medicine record in our study sample). Table 1summarizes the characteristics of the study sample. Anti-histamines, antibiotics, and dermatological preparationswere common prescriptions for children in 2002. The per-centage of generic drugs by common pediatric conditionsand Multum drug class or subclass are summarized inTable 2. Prescriptions for otitis media and asthma hadhigher percentages of generic drugs than other pediatric
conditions listed in Table 2. Correspondingly, bronchodila-tors and penicillins were drug classes with high percent-ages of generic prescriptions. The analgesics categoryhad the highest percentage of generic drugs, predominantlyas a result of nonsteroidal anti-inflammatory drugs andother nonopioids.
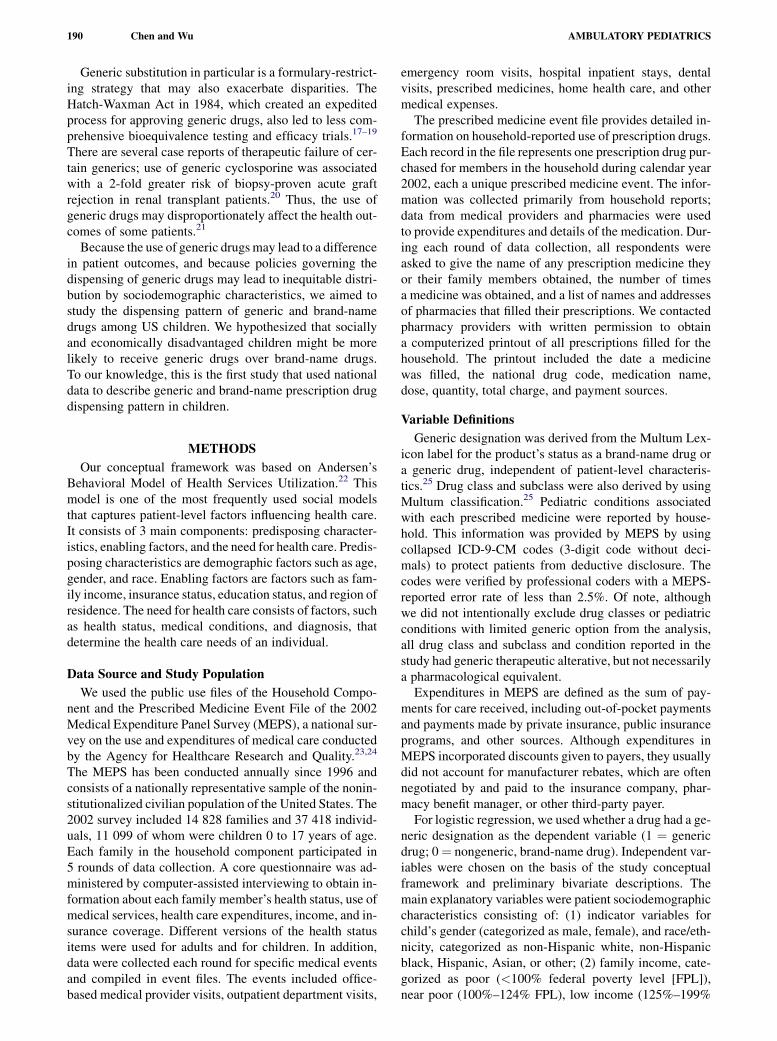
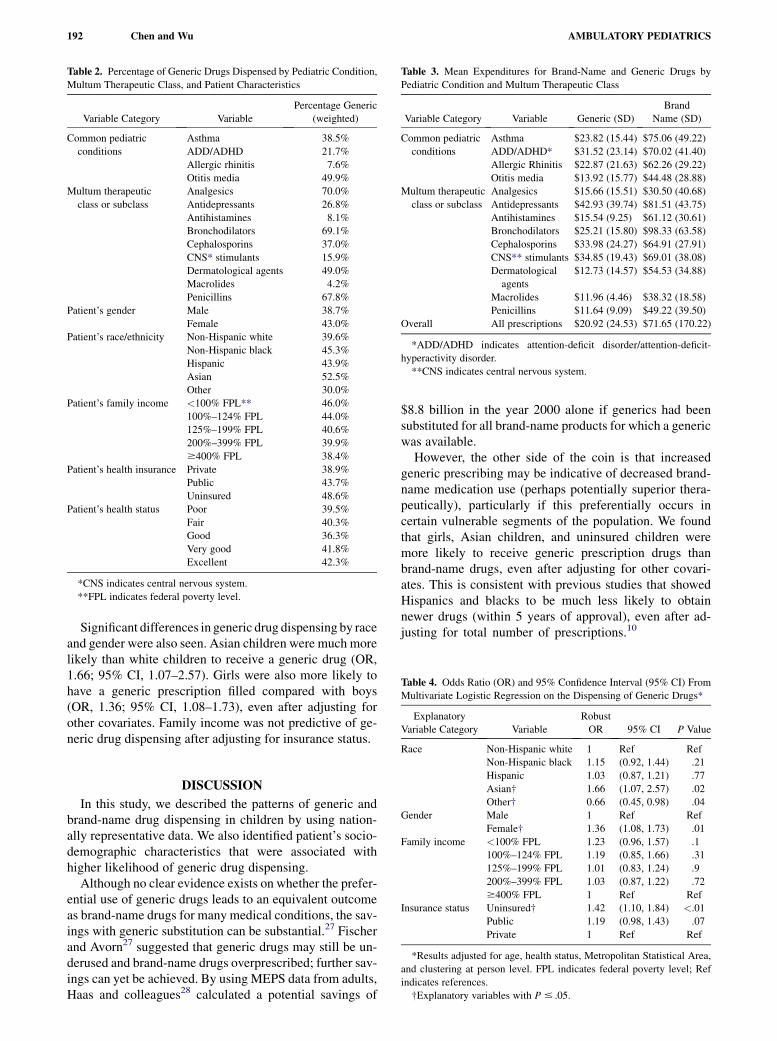
Table 3 shows the mean expenditures for prescriptiondrugs for both generic and brand-name drugs, by commonpediatric conditions and Multum drug class or subclass.Overall, the mean expenditure for generic drugs was$20.92, and the mean expenditure for brand-name drugswas $71.65. Otitis media had the lowest mean expenditurefor both generic and brand-name drugs. Bronchodilatorsand antidepressants were some of the most expensivebrand-name drugs for children.
Multivariate logistic regression results are presented inTable 4. Insurance type was predictive of the dispensingof generic drugs. Uninsured patients were more likelythan privately insured patients to have a generic drug dis-pensed (odds ratio [OR], 1.42; 95% confidence interval[95% CI], 1.10–1.84). Insurance type also affected out-of-pocket prescription drug expenditures.
Table 1. Prescription Drugs for Children (N ¼ 24 465)
Variable Category Variable
Sample Size
(unweighted)
Frequency
(weighted)
Drug designation Brand name 14 182 0.594
Generic 10 283 0.406
Common therapeutic
class or subclass*
Analgesics 1164 0.039
Antidepressants 951 0.042
Antihistamines 2156 0.093
Bronchodilators 2161 0.075
Cephalosporins 752 0.031
CNS* stimulants 1152 0.049
Dermatological
agents
1866 0.081
Macrolides 833 0.04
Penicillins 3095 0.132
Patient’s gender Male 13 451 0.55
Female 11 014 0.45
Patient’s race/
ethnicity
Non-Hispanic white 13 566 0.696
Non-Hispanic black 3323 0.109
Hispanic 6442 0.143
Asian 339 0.016
Other 795 0.036
Patient’s family
income
<100% FPL** 5800 0.147
100%–124% FPL 1846 0.056
125%–199% FPL 4100 0.139
200%–399% FPL 7676 0.357
$400% FPL 5043 0.301
Patient’s health
insurance
Private 13 622 0.675
Public 9926 0.29
Uninsured 917 0.035
Patient’s health status Poor 736 0.026
Fair 2031 0.065
Good 6228 0.224
Very good 7391 0.313
Excellent 7966 0.372
*CNS indicates central nervous system.
**FPL indicates federal poverty level.
192 Chen and Wu AMBULATORY PEDIATRICS
Significant differences in generic drug dispensing by raceand gender were also seen. Asian children were much morelikely than white children to receive a generic drug (OR,1.66; 95% CI, 1.07–2.57). Girls were also more likely tohave a generic prescription filled compared with boys(OR, 1.36; 95% CI, 1.08–1.73), even after adjusting forother covariates. Family income was not predictive of ge-neric drug dispensing after adjusting for insurance status.
DISCUSSION
In this study, we described the patterns of generic andbrand-name drug dispensing in children by using nation-ally representative data. We also identified patient’s socio-demographic characteristics that were associated withhigher likelihood of generic drug dispensing.
Although no clear evidence exists on whether the prefer-ential use of generic drugs leads to an equivalent outcomeas brand-name drugs for many medical conditions, the sav-ings with generic substitution can be substantial.27 Fischerand Avorn27 suggested that generic drugs may still be un-derused and brand-name drugs overprescribed; further sav-ings can yet be achieved. By using MEPS data from adults,Haas and colleagues28 calculated a potential savings of
Table 2. Percentage of Generic Drugs Dispensed by Pediatric Condition,
Multum Therapeutic Class, and Patient Characteristics
Variable Category Variable
Percentage Generic
(weighted)
Common pediatric
conditions
Asthma 38.5%
ADD/ADHD 21.7%
Allergic rhinitis 7.6%
Otitis media 49.9%
Multum therapeutic
class or subclass
Analgesics 70.0%
Antidepressants 26.8%
Antihistamines 8.1%
Bronchodilators 69.1%
Cephalosporins 37.0%
CNS* stimulants 15.9%
Dermatological agents 49.0%
Macrolides 4.2%
Penicillins 67.8%
Patient’s gender Male 38.7%
Female 43.0%
Patient’s race/ethnicity Non-Hispanic white 39.6%
Non-Hispanic black 45.3%
Hispanic 43.9%
Asian 52.5%
Other 30.0%
Patient’s family income <100% FPL** 46.0%
100%–124% FPL 44.0%
125%–199% FPL 40.6%
200%–399% FPL 39.9%
$400% FPL 38.4%
Patient’s health insurance Private 38.9%
Public 43.7%
Uninsured 48.6%
Patient’s health status Poor 39.5%
Fair 40.3%
Good 36.3%
Very good 41.8%
Excellent 42.3%
*CNS indicates central nervous system.
**FPL indicates federal poverty level.
$8.8 billion in the year 2000 alone if generics had beensubstituted for all brand-name products for which a genericwas available.
However, the other side of the coin is that increasedgeneric prescribing may be indicative of decreased brand-name medication use (perhaps potentially superior thera-peutically), particularly if this preferentially occurs incertain vulnerable segments of the population. We foundthat girls, Asian children, and uninsured children weremore likely to receive generic prescription drugs thanbrand-name drugs, even after adjusting for other covari-ates. This is consistent with previous studies that showedHispanics and blacks to be much less likely to obtainnewer drugs (within 5 years of approval), even after ad-justing for total number of prescriptions.10
Table 3. Mean Expenditures for Brand-Name and Generic Drugs by
Pediatric Condition and Multum Therapeutic Class
Variable Category Variable Generic (SD)
Brand
Name (SD)
Common pediatric
conditions
Asthma $23.82 (15.44) $75.06 (49.22)
ADD/ADHD* $31.52 (23.14) $70.02 (41.40)
Allergic Rhinitis $22.87 (21.63) $62.26 (29.22)
Otitis media $13.92 (15.77) $44.48 (28.88)
Multum therapeutic
class or subclass
Analgesics $15.66 (15.51) $30.50 (40.68)
Antidepressants $42.93 (39.74) $81.51 (43.75)
Antihistamines $15.54 (9.25) $61.12 (30.61)
Bronchodilators $25.21 (15.80) $98.33 (63.58)
Cephalosporins $33.98 (24.27) $64.91 (27.91)
CNS** stimulants $34.85 (19.43) $69.01 (38.08)
Dermatological
agents
$12.73 (14.57) $54.53 (34.88)
Macrolides $11.96 (4.46) $38.32 (18.58)
Penicillins $11.64 (9.09) $49.22 (39.50)
Overall All prescriptions $20.92 (24.53) $71.65 (170.22)
*ADD/ADHD indicates attention-deficit disorder/attention-deficit-
hyperactivity disorder.
**CNS indicates central nervous system.
Table 4. Odds Ratio (OR) and 95% Confidence Interval (95% CI) From
Multivariate Logistic Regression on the Dispensing of Generic Drugs*
Explanatory
Variable Category Variable
Robust
OR 95% CI P Value
Race Non-Hispanic white 1 Ref Ref
Non-Hispanic black 1.15 (0.92, 1.44) .21
Hispanic 1.03 (0.87, 1.21) .77
Asian† 1.66 (1.07, 2.57) .02
Other† 0.66 (0.45, 0.98) .04
Gender Male 1 Ref Ref
Female† 1.36 (1.08, 1.73) .01
Family income <100% FPL 1.23 (0.96, 1.57) .1
100%–124% FPL 1.19 (0.85, 1.66) .31
125%–199% FPL 1.01 (0.83, 1.24) .9
200%–399% FPL 1.03 (0.87, 1.22) .72
$400% FPL 1 Ref Ref
Insurance status Uninsured† 1.42 (1.10, 1.84) <.01
Public 1.19 (0.98, 1.43) .07
Private 1 Ref Ref
*Results adjusted for age, health status, Metropolitan Statistical Area,
and clustering at person level. FPL indicates federal poverty level; Ref
indicates references.
†Explanatory variables with P # .05.
AMBULATORY PEDIATRICS Generic and Brand-Name Drugs in Children 193
There are numerous points in the decision-making pro-cess before a prescription drug is ultimately dispensed.The use of brand-name versus generic drugs can be the re-sult of physician prescribing practices, type of clinical set-ting, pharmaceutical marketing (either physician detailingor direct-to-consumer marketing), formulary restriction orpharmacy substitution, insurance plan policies, financialincentives or disincentives, availability of equivalent med-ications, and out-of-pocket costs.
We found that girls were more likely than boys to receivegeneric drugs. This is an interesting and noteworthy findingfor 2 reasons. First, it was an independent effect of gender.In addition, its effect size rivaled that of insurance cover-age. Second, this finding highlights a less known butwell-described area of health care disparity: gender dispar-ity. Hong and Shepherd29 conducted a descriptive study ofprescription drug expenditures in 3144 children under 18years of age who were participants in employer-basedcarved-out prescription drug benefit plans that imple-mented minimal copays for generic and higher cost-shar-ing for brand-name drugs. Using insurance claims data,they evaluated mean total expenditure, mean out-of-pocketcost, and mean duration of therapy, adjusting for durationof enrollment. They found that the average expenditureper prescription was lower for female than male patients:$15.56 (SD 16.16) compared with $17.12 (SD 18.27). Astudy on adult Medicaid enrollees also reported difficultiesin accessing prescription drugs for female patients.16 Asdescribed above, the observed gender disparity in prescrip-tion drug dispensing can occur as a result of various pro-cesses (eg, system, provider, patient, and other contextualfactors). It could also be due to an increased prevalencein boys of certain disease types that might require drugsfor which generics were not widely available. Studieshave shown that allergic rhinitis, asthma, and attention-def-icit/hyperactivity disorder are more prevalent in boys thangirls, and thus more prescriptions are written for these con-ditions for boys than for girls.30,31 Our analyses did not de-lineate the mechanism associated with the observed genderdisparity, and it is an important area for future research.
Physician prescribing bias has been documented in sev-eral studies. A study of adult patients with schizophreniafound that African American patients were less likely toreceive newer brand-name drugs than white patients.32 An-other study showed that emergency departments were lesslikely to prescribe analgesics and opioids to black pa-tients.33 The pediatric literature showed decreased control-ler medication prescribing in children with asthma who areblack or Latino.34 Black children were also less likely toreceive a prescription for psychotropic medication.35
Patients may also preferentially fill generic medicationsover brand-name drugs because of the lower out-of-pocketcosts.36 This is disproportionately associated with minorityand poor patients.15,37 Patients in the private office settingwere also more likely to receive newer brand-namedrugs.32 One possibility is that the private office settingmay self-select patients with more generous or less restric-tive prescription drug coverage; the prescribing providersmay also be more accustomed to using brand-name medi-
cations. Pharmaceutical companies target marketingtoward certain practice or patient types and provide incen-tives such as free samples (pharmaceutical companyspending on advertising to physicians has grown to $7.2billion in 2005; spending on direct-to-consumer advertis-ing has grown to $4.2 billion in 2005).6 Pharmacies canalso substitute for generic equivalents or can contact theprescribing physician to change to a therapeutic equivalent.In some settings, pharmacists may have more time to con-tact physicians and suggest therapeutic equivalents.38,39
Our study has several limitations. First, we could not iso-late the source of differences in prescription drug dispens-ing. It could be due to differences in prescriber practices,insurance benefits, pharmacy policies, patient preferences,or some combination of these. There are few data currentlyavailable to address this question. Second, our results, aswith other prescription drug studies, may be confoundedby the availability of comparable or equivalent drugs(this can be a result of US Food and Drug Administrationapproval or pharmacy or health plan contract restrictions).For example, providers (and maybe patients) may be morewilling to substitute brand-name drugs with generic drugsif the drugs have similar efficacy and safety profiles. Third,our data and method are limited, and we cannot address themyriad of factors related to provider prescribing behaviors,to incentives at the system and practice levels, or to deci-sions and preferences regarding prescription drug cost ver-sus quality. Furthermore, refilling practices for prescriptiondrugs can vary from health plan to health plan, provider toprovider, and patient to patient. Our results may be biasedif refills were easier for certain types of drugs or for certaintypes of patients. Our intention was to describe the dispens-ing patterns seen at the national level for children, and weacknowledge our limitation in teasing out the ‘‘why.’’ Thus,we were careful when we drew our conclusions. Fourth,our analysis did not account for details of prescriptiondrug benefits in subjects because MEPS did not provide in-formation on public insurance drug coverage (which variesby state) or pharmacy or formulary restrictions. We also didnot account for state-to-state variations. Medicaid pro-grams are administered by each state; there is a wide vari-ation in state policies regarding Medicaid prescription drugbenefits. State data in the MEPS are not publicly availablefor confidentiality reasons. Last, we did not account forindividual rebates that pharmaceutical companies paydirectly to insurers or consumers. In 2002, the standardrebate to Medicaid was 15.1% of the average manufac-turer’s price or the difference between the average manu-facturer’s price and the best price to any buyer, whicheveris greater; brand-name drugs may have additional rebates(Douglas Holtz-Eakin, director, CBO, June 21, 2005, per-sonal communication). Despite these limitations, our studyprovided an overview of generic drug and brand-name drugdispensing in a nationally representative sample of childrenand identified sociodemographic factors associated withgeneric drug use.
Being uninsured, being of Asian race, and being of fe-male gender were associated with increased odds of receiv-ing a generic medication over brand-name medication.
194 Chen and Wu AMBULATORY PEDIATRICS
ACKNOWLEDGMENT
Presented in part at the Annual Meeting of the American Academy of
Pediatrics, Atlanta, Ga, October 7, 2006.
REFERENCES
1. Smith C, Cowan C, Heffler S, Catlin A, the National Health Accounts
Team. National health spending in 2004: recent slowdown led by pre-
scription drug spending. Health Aff (Millwood). 2006;25:186–196.
2. Borger C, Smith S, Truffer C, et al. Health spending projections
through 2015: changes on the horizon. Health Aff (Millwood).
2006;25:w61–w73.
3. Dubois RW, Chawla AJ, Neslusan CA, Smith MW, Wade S. Explain-
ing drug spending trends: does perception match reality? Health Aff
(Millwood). 2000;19:231–239.
4. Schondelmeyer SW, Thomas J 3rd. Trends in retail prescription
expenditures. Health Aff (Millwood). 1990;9:131–145.
5. Foote SM, Etheredge L. Increasing use of new prescription drugs:
a case study. Health Aff (Millwood). 2000;19:165–170.
6. Kaiser Family Foundation. Prescription Drug Trends. Report 3057-
05. Menlo Park, Calif: Henry J. Kaiser Family Foundation; 2006.
7. Morden NE, Sullivan SD. States’ control of prescription drug spend-
ing: a heterogeneous approach. Health Aff (Millwood). 2005;24:
1032–1038.
8. Crowley JS, Ashner D, Elam L. State Medicaid Outpatient Prescrip-
tion Drug Policies: Findings From a National Survey, 2005 Update.
Report 7381. Washington, DC: Henry J. Kaiser Foundation; 2005.
9. Lichtenberg FR. The effect of access restrictions on the vintage of
drugs used by Medicaid enrollees. Am J Manag Care. 2005;11:
SP7–SP13.
10. Wang J, Zuckerman IH, Miller NA, Shaya FT, Noel JM, Mullins CD.
Utilizing new prescription drugs: disparities among non-Hispanic
whites, non-Hispanic blacks, and Hispanic whites. Health Serv Res.
2007;42:1499–1519.
11. Krobot KJ, Miller WC, Kaufman JS, Chrisensen DB, Preisser JS,
Ibrahim MA. The disparity in access to new medication by type of
health insurance: lessons from Germany. Med Care. 2004;42:487–491.
12. Lichtenberg FR. Are the benefits of newer drugs worth their cost?
Evidence from the 1996 MEPS. Health Aff (Millwood). 2001;20.
241–225.
13. Reuveni H, Sheizaf B, Elhayany A, et al. The effect of drug co-pay-
ment policy on the purchase of prescription drugs for children with
infections in the community. Health Policy. 2002;62:1–13.
14. Huskamp HA, Deverka PA, Epstein AM, et al. Impact of 3-tier formu-
laries on drug treatment of attention-deficit/hyperactivity disorder in
children. Arch Gen Psychiatry. 2005;62:435–441.
15. Kennedy J, Coyne J, Sclar D. Drug affordability and prescription non-
compliance in the United States: 1997–2002. Clin Ther. 2004;26:
607–614.
16. Cunningham PJ. Medicaid cost containment and access to prescrip-
tion drugs. Health Aff (Millwood). 2005;24:780–789.
17. Saha A, Grabowski H, Birnbaum H, Greenberg P, Bizan O. Generic
competition in the US pharmaceutical industry. Int J Econ Bus.
2006;1315–1338.
18. Blier P. Generic medications: another variable in the treatment of
illnesses. J Psychopharmacol. 2007;21:459–460.
19. Alloway RR, Isaacs R, Lake K, et al. Report of the American Society
of Transplantation Conference on immunosuppressive drugs and
the use of generic immunosuppressants. Am J Transplant. 2003;3:
1211–1215.
20. Taber DJ, Baillie GM, Ashcraft EE, et al. Does bioequivalence
between modified cyclosporine formulations translate into equal
outcomes? Transplantation. 2005;80:1633–1635.
21. Burroughs VJ, Maxey RW, Levy RA. Racial and ethnic differences in
response to medicines: towards individualized pharmaceutical treat-
ment. J Natl Med Assoc. 2002;94:1–26.
22. Andersen RM. Revisiting the behavioral model and access to medical
care: does it matter? J Health Soc Behavior. 1995;36:1–10.
23. Cohen JW, Monheit AC, Beauregard KM, et al. The medical expen-
diture panel survey: a national health information resource. Inquiry.
1996–1997;33:373–389.
24. MEPS HC-070: 2002 full year consolidated data file. December
2004. Available at: http://www.meps.ahrq.gov/mepsweb/data_stats/
download_data/pufs/h70/h70doc.pdf. Accessed January 14, 2007.
25. Cerner Multum Inc. Available at: http://www.multum.com/Lexicon.
htm. Accessed January 14, 2008.
26. Huber PJ. The behavior of maximum likelihood estimates under non-
standard conditions. In: Proceedings of the Fifth Berkeley Symposium
on Mathematical Statistics and Probability. Berkeley, Calif: Univer-
sity of California Press; 1967;1:221–223.
27. Fischer MA, Avorn J. Economic consequences of underuse of generic
drugs: evidence from Medicaid and implications for prescription drug
benefit plans. Health Serv Res. 2003;38:1051–1063.
28. Haas JS, Phillips KA, Gerstenberger EP, Seger AC. Potential savings
from substituting generic drugs for brand-name drugs: Medical
Expenditure Panel Survey, 1997–2000. Ann Intern Med. 2005;142:
891–897.
29. Hong S-H, Shepherd MD. Outpatient prescription drug use by chil-
dren enrolled in five drug benefit plans. Clin Ther. 1996;18:528–545.
30. Straand J, Rokstad K, Heggedal U. Drug prescribing for children in
general practice. A report from the More and Romsdal Prescription
Study. Acta Paediatr. 1998;87:218–224.
31. Roe CM, McNAmara AM, Motheral BR. Gender- and age-related
prescription drug use patterns. Ann Pharmacother. 2002;36:30–39.
32. Kuno E, Rothbard AB. Racial disparities in antipsychotic prescription
patterns for patients with schizophrenia. Am J Psychiatry. 2002;159:
567–572.
33. Tamayo-Sarver JH, Hinze SW, Cydulka RK, Baker DW. Racial and
ethnic disparities in emergency department analgesic prescription.
Am J Public Health. 2003;93:2067–2073.
34. Finkelstein JA, Lozano P, Farber HJ, Miroshnik I, Lieu TA. Underuse
of controller medications among medicaid-insured children with
asthma. Arch Pediatr Adolesc Med. 2002;156:562–567.
35. Zito JM, Safer DJ, Zuckerman IH, Gardner JF, Soeken K. Effect
of medicaid eligibility category on racial disparities in the use of
psychotropic medications among youths. Psychiatr Serv. 2005;56:
157–163.
36. Mamdani MM, Tu K, Austin PC, Alter DA. Influence of socioeco-
nomic status on drug selection for the elderly in Canada. Ann Phar-
macother. 2002;36:804–808.
37. Taira DA, Iwane KA, Chung RS. Prescription drugs: elderly enrollee
reports of financial access, receipt of free samples, and discussion of
generic equivalents related to type of coverage. Am J Manag Care.
2003;9:305–312.
38. Wosinska M, Huckman RS. Generic dispensing and substitution in
mail and retail pharmacies. Health Aff (Millwood). 2004; (SupplWeb
Exclusives):W4409–W4416.
39. Mott DA, Cline RR. Exploring generic drug use behavior: the role of
prescribers and pharmacists in the opportunity for generic drug use
and generic substitution. Med Care. 2002;40:662–674.