Embed Size (px)
Citation preview
January 16January 16thth, 2007, 2007Antonia D’Amore, Antonia D’Amore,
Valentine Hemingway and Valentine Hemingway and Kerstin WassonKerstin Wasson
AQUATIC HABITAT AND LANDSCAPE AQUATIC HABITAT AND LANDSCAPE CHARACTERISTICS PREDICT DISTRIBUTION OF CHARACTERISTICS PREDICT DISTRIBUTION OF
AMPHIBIANS IN ELKHORN SLOUGHAMPHIBIANS IN ELKHORN SLOUGH
Main questions…• What predicts the distribution of pond-
breeding amphibians coastal California?
• Does the distribution of different species change significantly between years?
• How can we best manage to promote native amphibian populations?
• What are the threats to local populations?
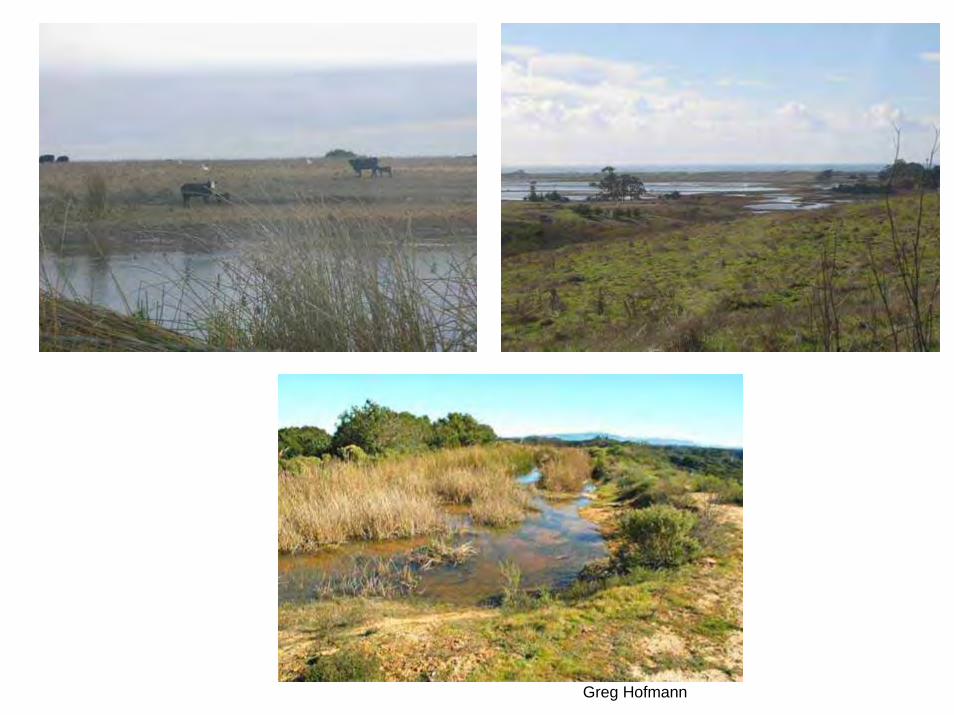
Greg Hofmann
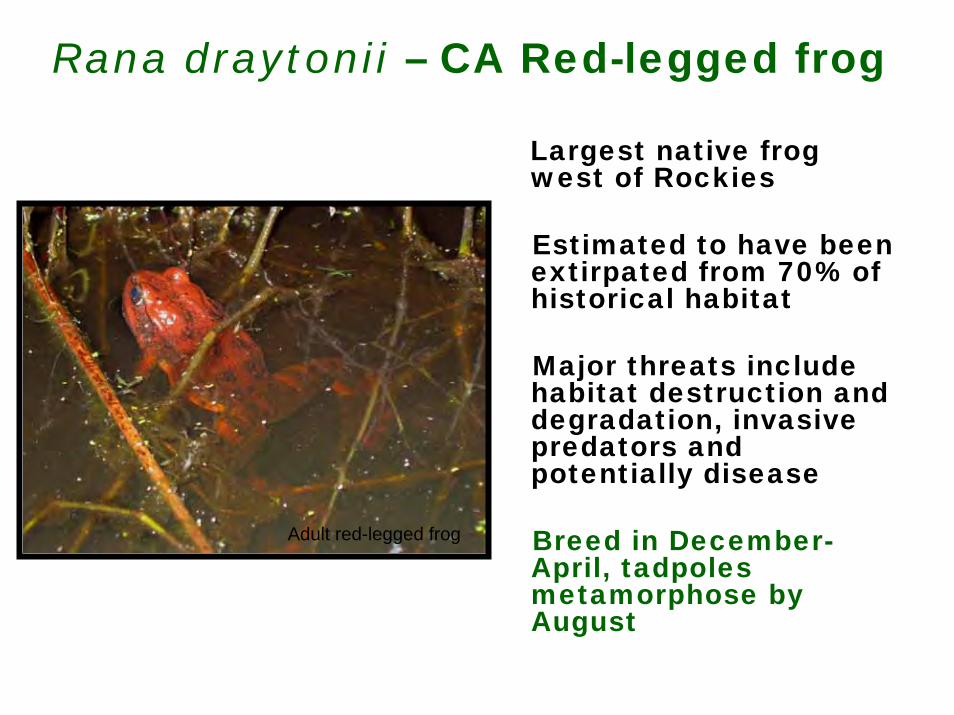
Rana draytonii – CA Red-legged frog
Largest native frog west of Rockies
Estimated to have been extirpated from 70% of historical habitat
Major threats include habitat destruction and degradation, invasive predators and potentially disease
Breed in December-April, tadpoles metamorphose by August
Adult red-legged frog
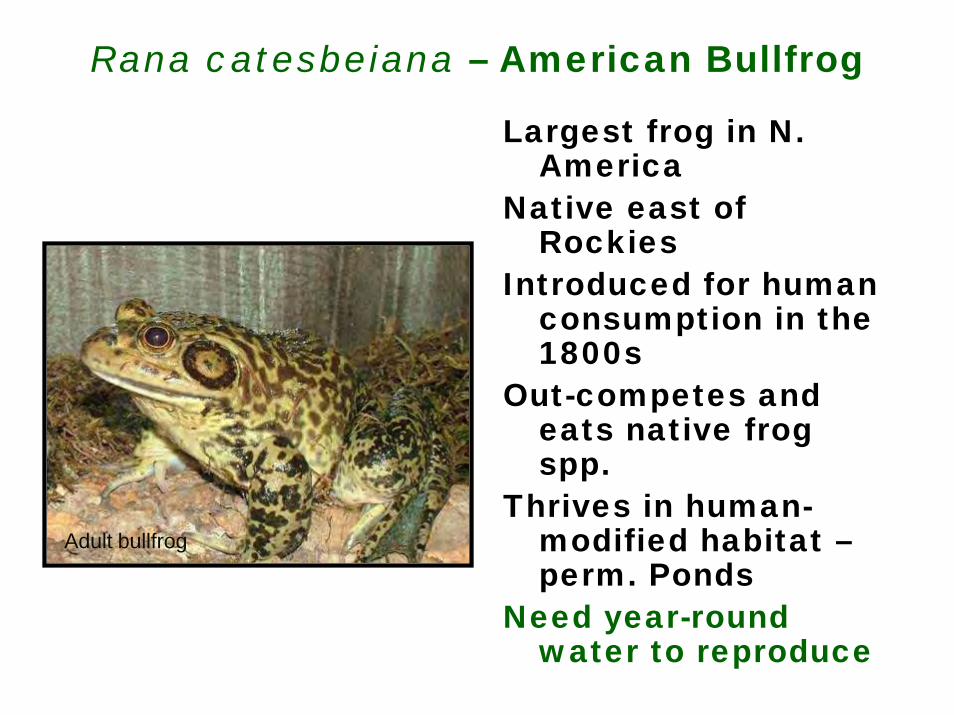
Rana catesbeiana – American Bullfrog
Largest frog in N. America
Native east of Rockies
Introduced for human consumption in the 1800s
Out-competes and eats native frog spp.
Thrives in human-modified habitat –perm. Ponds
Need year-round water to reproduce
Adult bullfrog
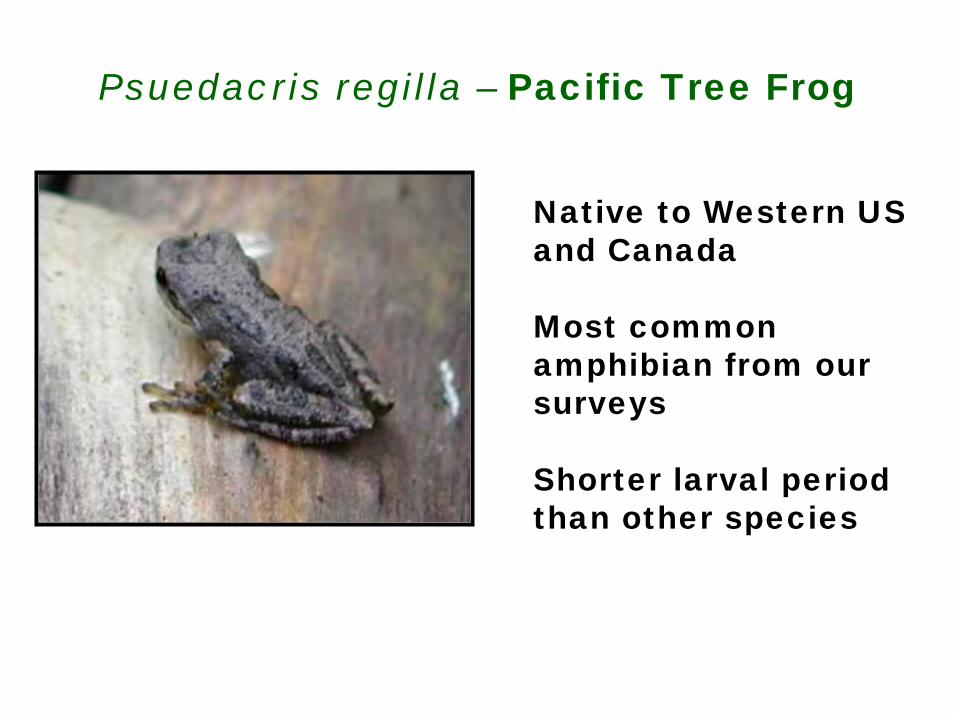
Psuedacris regilla – Pacific Tree Frog
Native to Western US and Canada
Most common amphibian from our surveys
Shorter larval period than other species
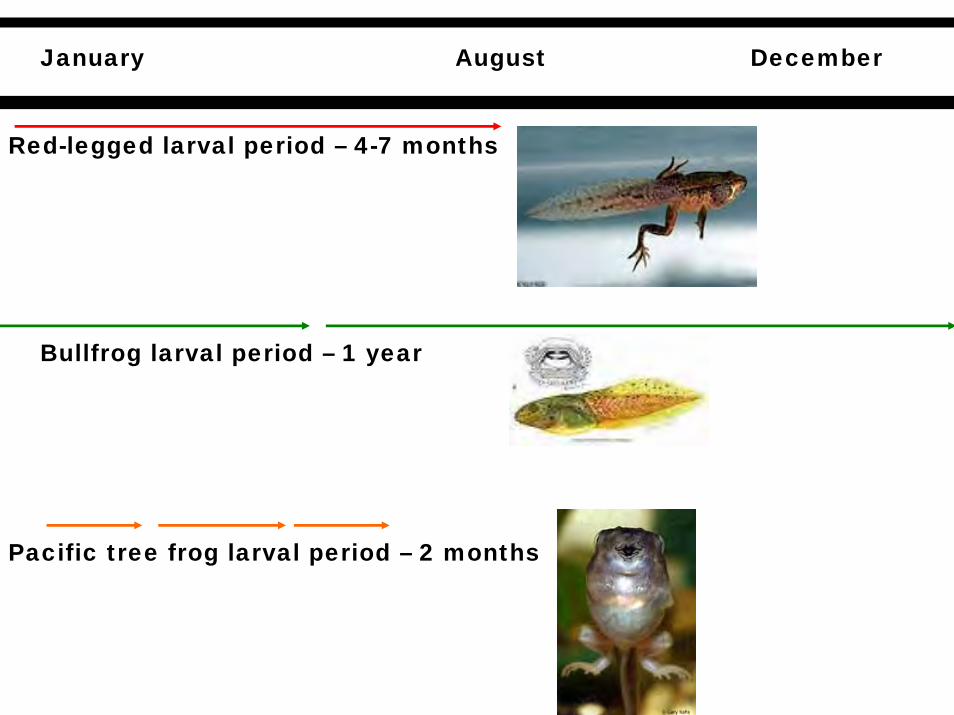
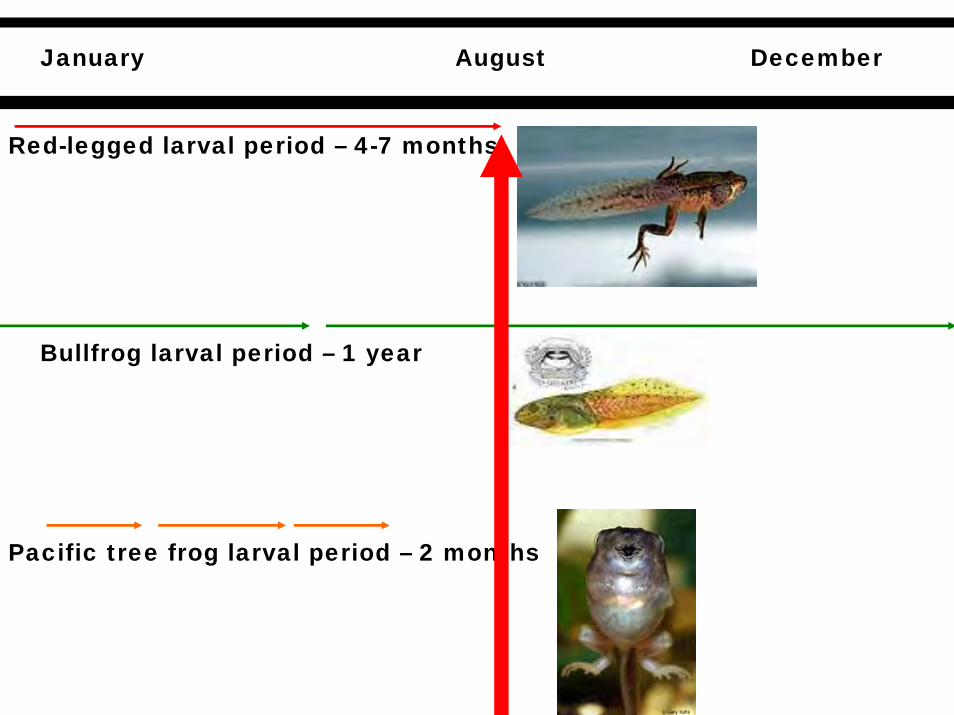
January DecemberAugust
Red-legged larval period – 4-7 months
Bullfrog larval period – 1 year
Pacific tree frog larval period – 2 months
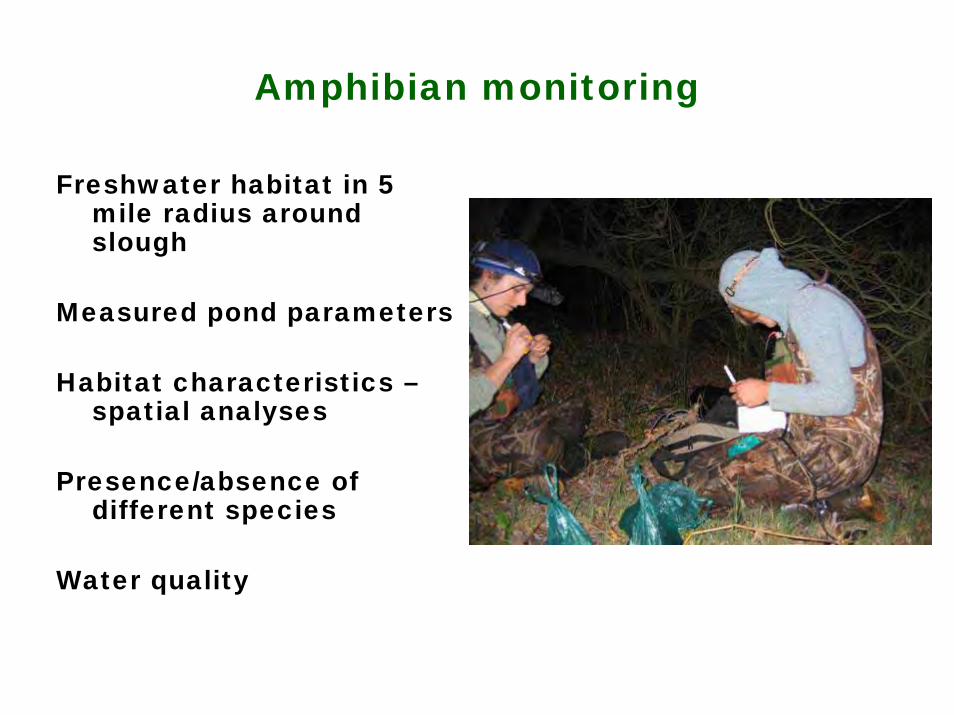
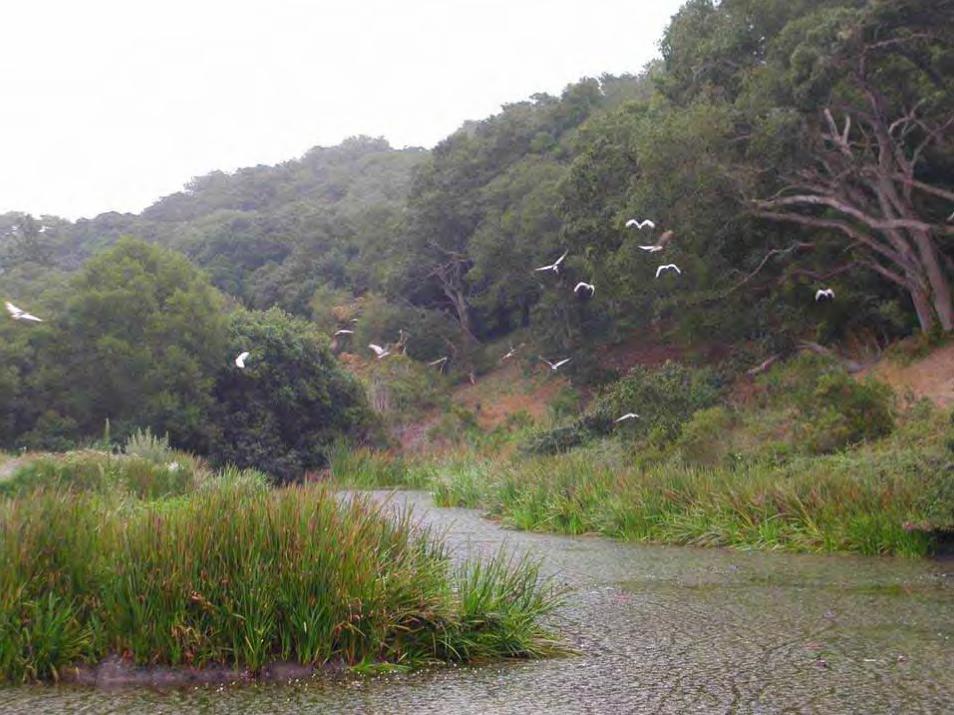
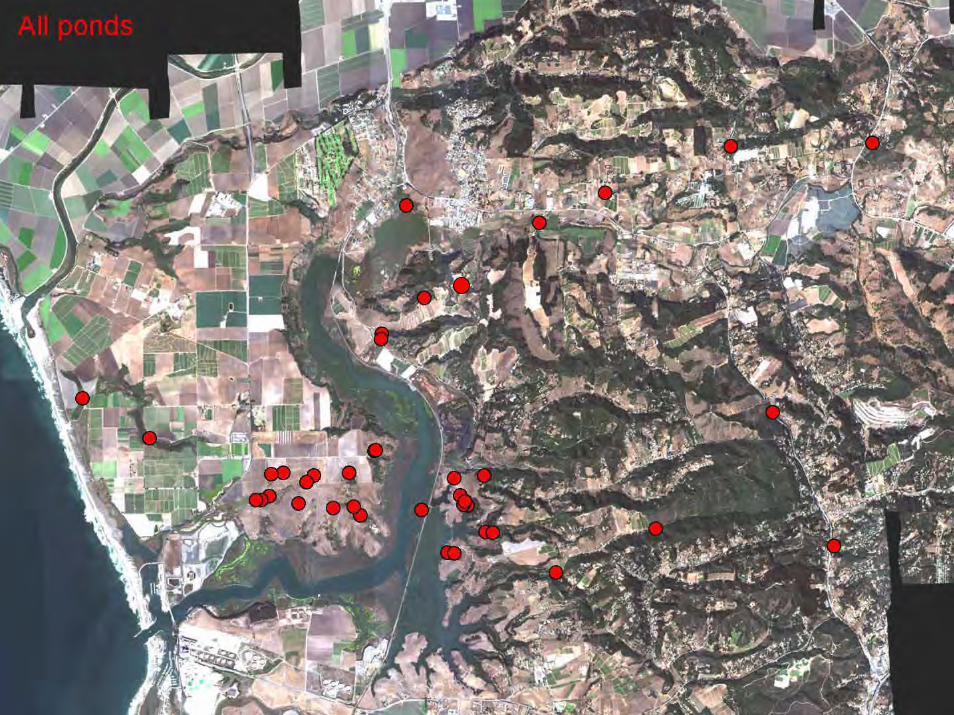
Amphibian monitoring
Freshwater habitat in 5 mile radius around slough
Measured pond parameters
Habitat characteristics –spatial analyses
Presence/absence of different species
Water quality
Spatial analyses
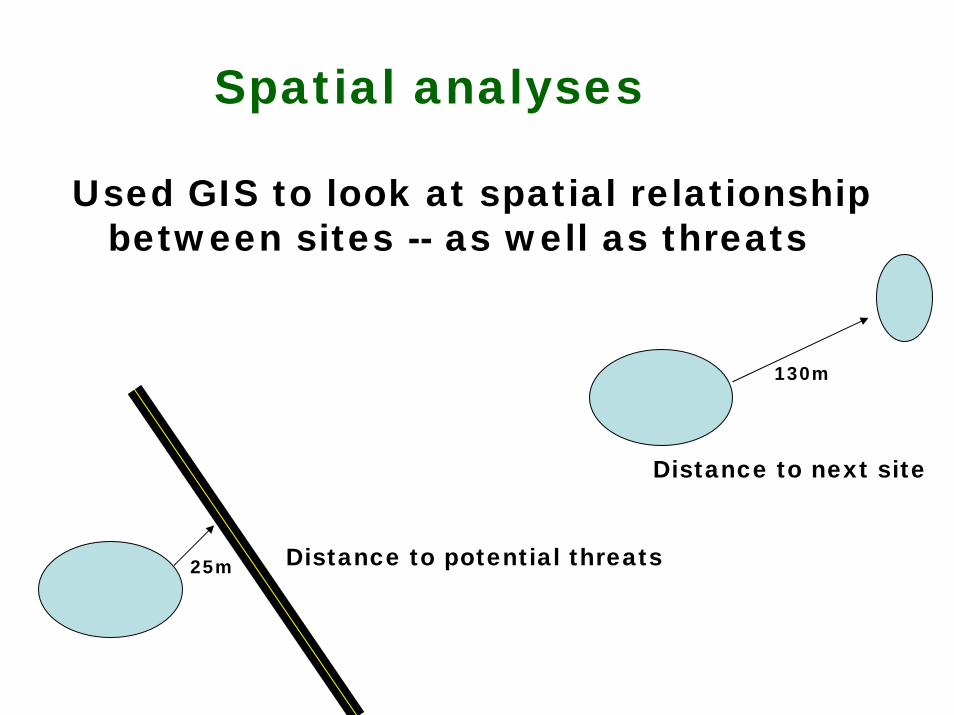
Used GIS to look at spatial relationship between sites -- as well as threats
Distance to potential threats25m
130m
Distance to next site
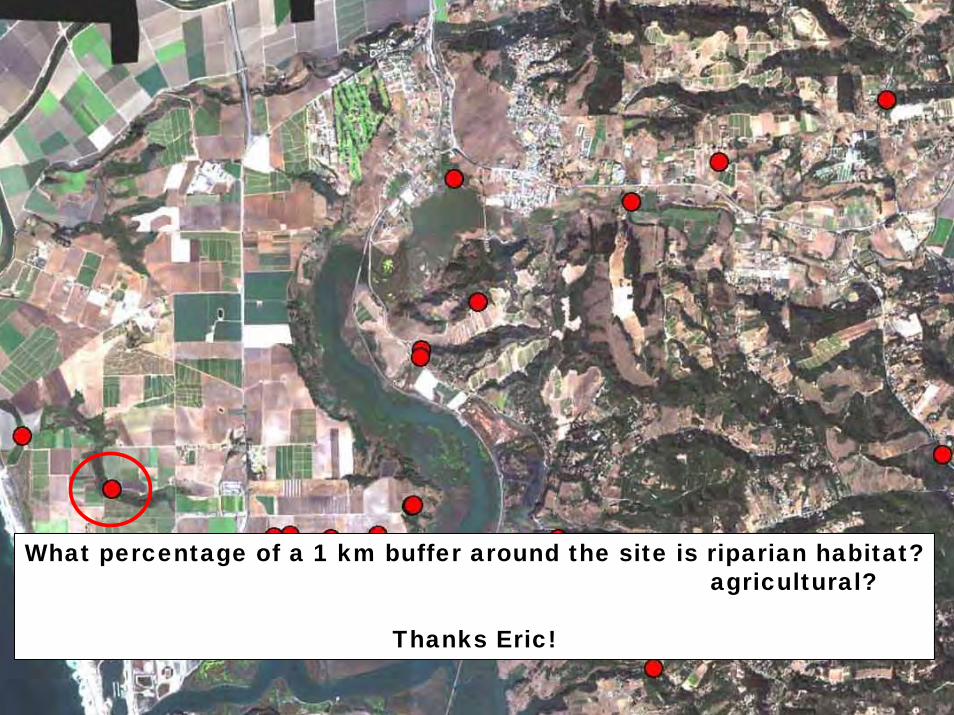
What percentage of a 1 km buffer around the site is riparian habitat?agricultural?
Thanks Eric!
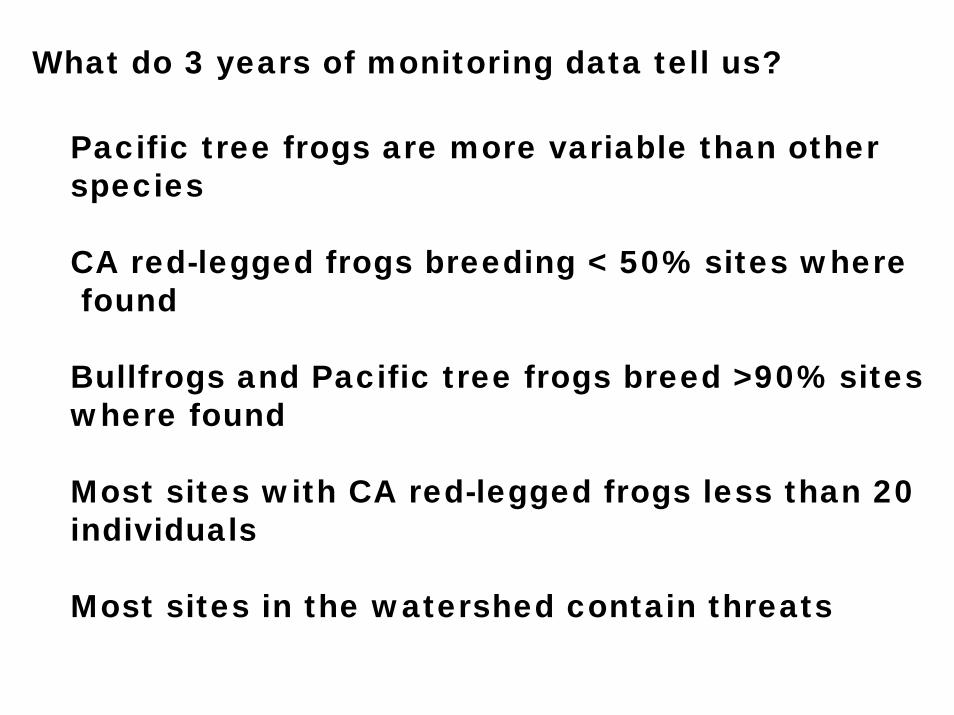
What do 3 years of monitoring data tell us?
Pacific tree frogs are more variable than other species
CA red-legged frogs breeding < 50% sites wherefound
Bullfrogs and Pacific tree frogs breed >90% sites where found
Most sites with CA red-legged frogs less than 20 individuals
Most sites in the watershed contain threats
What do we see when we look at species,site characteristics and annual patterns?
e.g. Do sites with roads within 50m have differentnumbers of adult frogs than sites without roads?
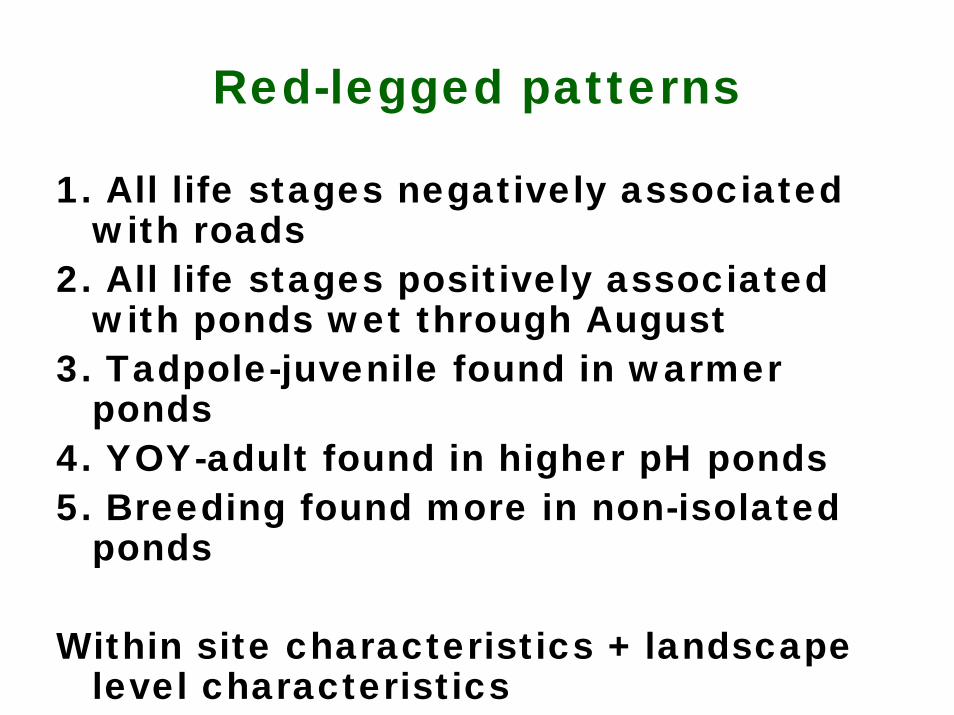
Red-legged patterns
1. All life stages negatively associated with roads
2. All life stages positively associated with ponds wet through August
3. Tadpole-juvenile found in warmer ponds
4. YOY-adult found in higher pH ponds5. Breeding found more in non-isolated
ponds
Within site characteristics + landscape level characteristics
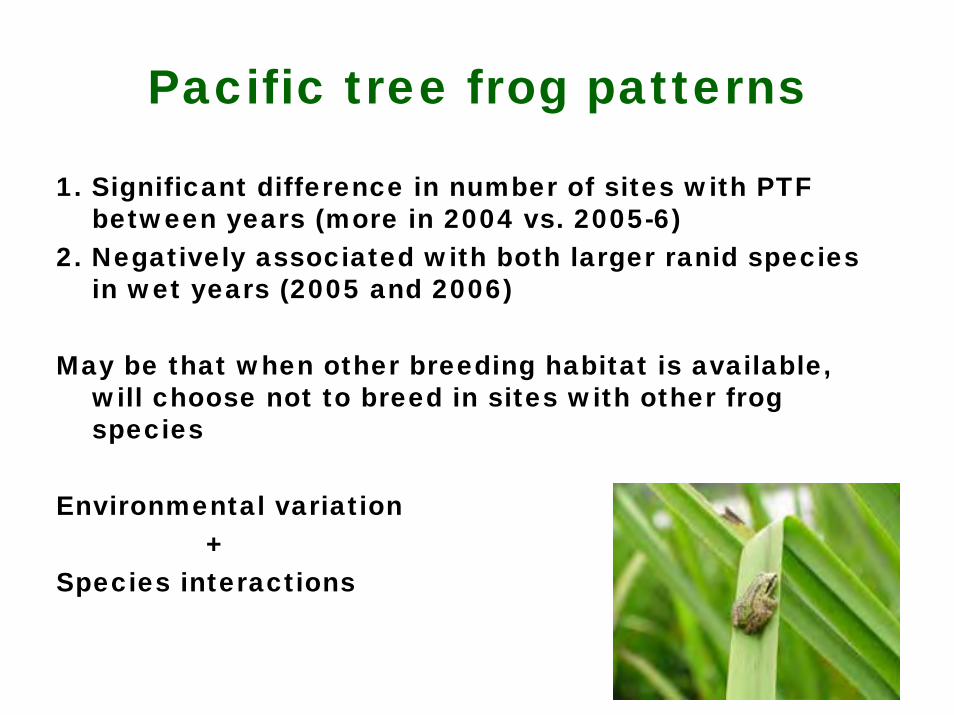
Pacific tree frog patterns
1. Significant difference in number of sites with PTF between years (more in 2004 vs. 2005-6)
2. Negatively associated with both larger ranid species in wet years (2005 and 2006)
May be that when other breeding habitat is available, will choose not to breed in sites with other frog species
Environmental variation+
Species interactions
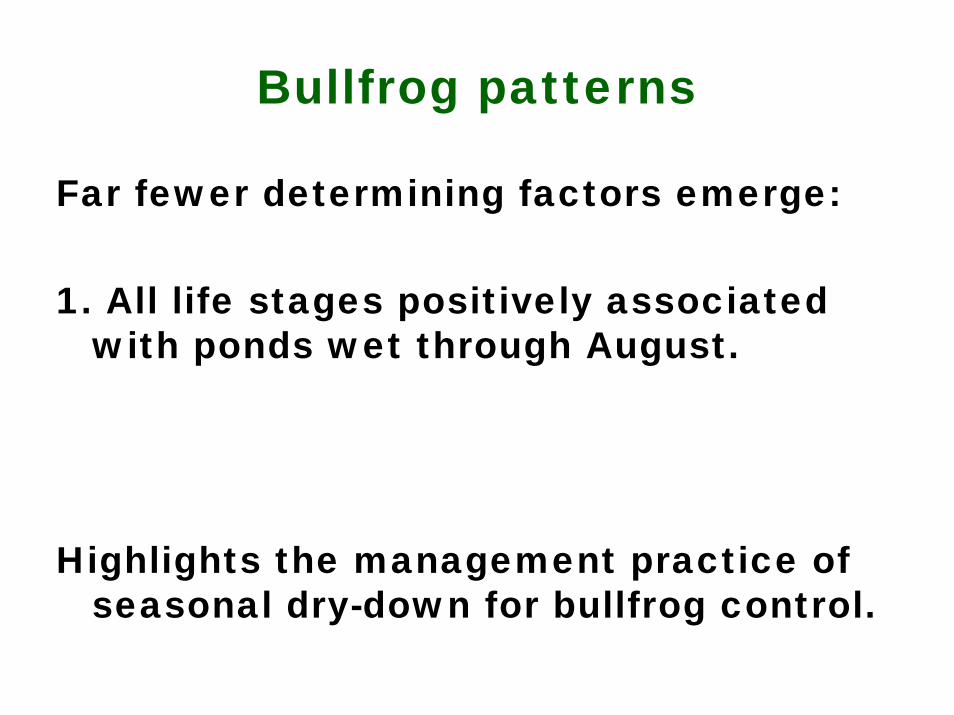
Bullfrog patterns
Far fewer determining factors emerge:
1. All life stages positively associated with ponds wet through August.
Highlights the management practice of seasonal dry-down for bullfrog control.
January DecemberAugust
Red-legged larval period – 4-7 months
Bullfrog larval period – 1 year
Pacific tree frog larval period – 2 months
What patterns do we find if we use all of the data together?
Broke data into two different matrices
amphibian data and environmental data
Multivariate statistics…
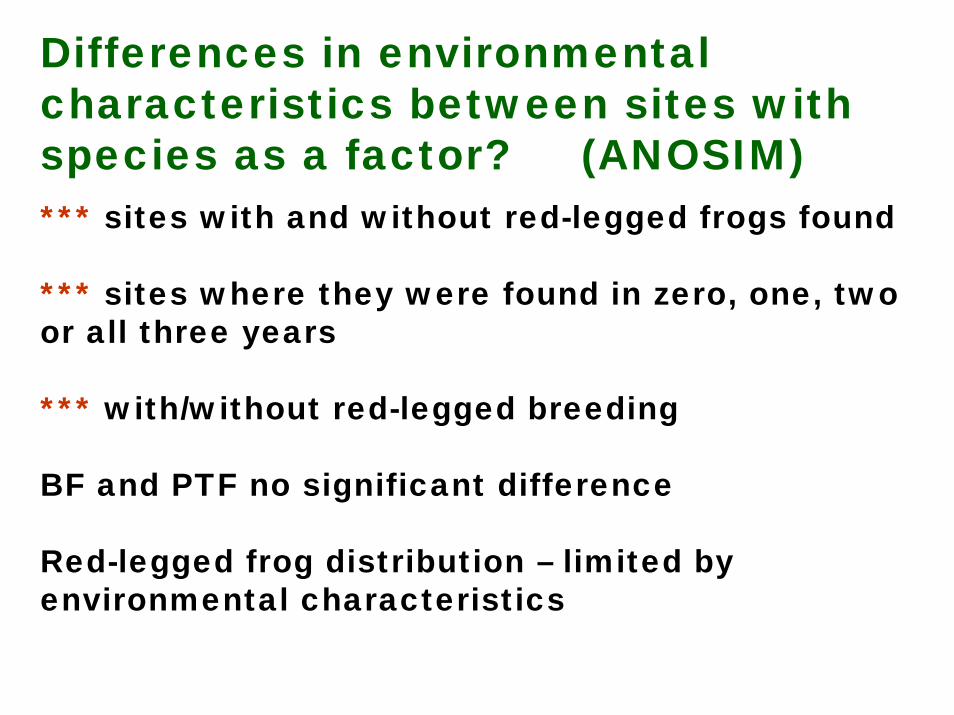
*** sites with and without red-legged frogs found
*** sites where they were found in zero, one, two or all three years
*** with/without red-legged breeding
BF and PTF no significant difference
Red-legged frog distribution – limited by environmental characteristics
Differences in environmental characteristics between sites with species as a factor? (ANOSIM)
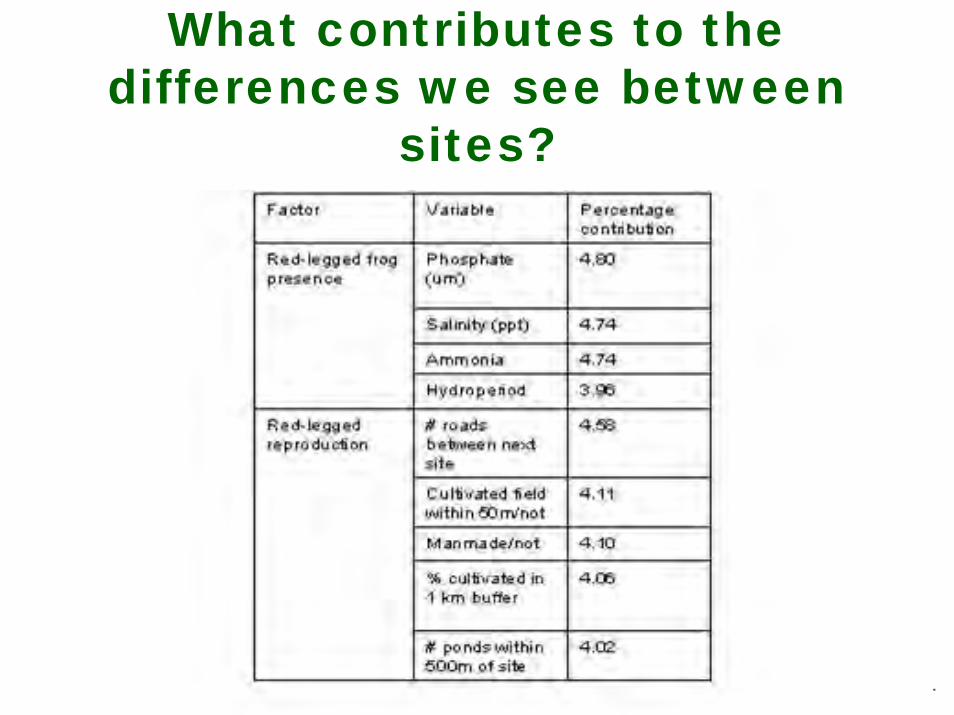
What contributes to the differences we see between
sites?
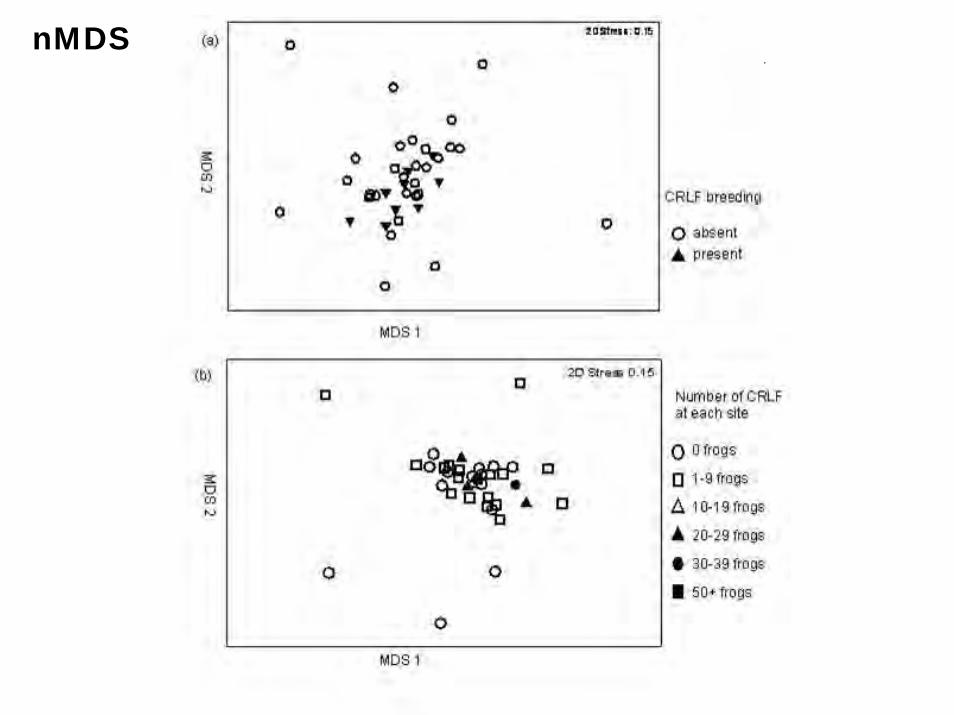
nMDS

Do binary environmental factors drive community patterns? (ANOSIM)
Amphibian communities differ based on:
Ephemeral or permanent
With and without Gambusia spp.
Within 100m of a paved road or not
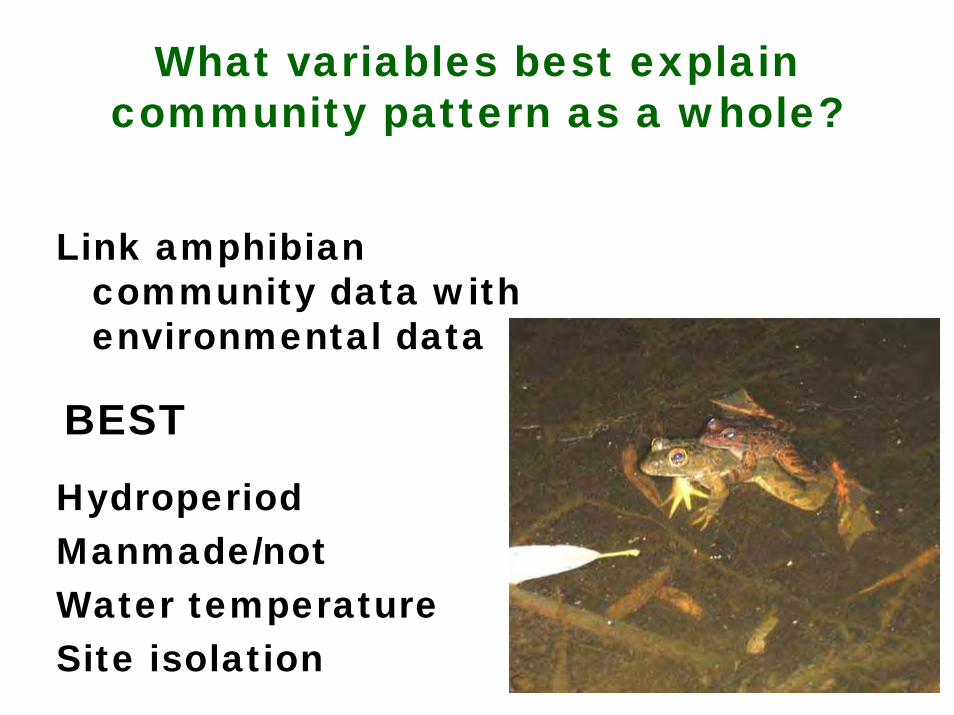
What variables best explain community pattern as a whole?
Link amphibian community data with environmental data
HydroperiodManmade/notWater temperatureSite isolation
BEST
Summary of findings
All three species are governed by different sets of requirements
California red-legged frogs have much more specific habitat requirements – less habitat available
Roads have a large impact on amphibian communities in our area
Managing hydroperiod -- control the spread of introduced bullfrogs