Embed Size (px)
Citation preview
Dispersion modelling of MOD and OESCO power station discharges
Report to Environmental Agency, Gibraltar
Restricted Commercial
ED 48335
R2455 Issue 1
May 2007

Restricted – Commercial Dispersion modelling of MOD and OESCO power station discharges AEA/ED48335/Issue 1
AEA Energy & Environment iii
Title Dispersion modelling of MOD and OESCO power station discharges
Customer Environmental Agency, Gibraltar
Customer reference
Confidentiality, copyright and reproduction
This report is the Copyright of AEA Technology and has been prepared by AEA Technology plc under contract to the Report to Environmental Agency, Gibraltar. The contents of this report may not be reproduced in whole or in part, nor passed to any organisation or person without the specific prior written permission of the Commercial Manager, AEA Technology plc. AEA Technology plc accepts no liability whatsoever to any third party for any loss or damage arising from any interpretation or use of the information contained in this report, or reliance on any views expressed therein.
File reference ED48335
Reference number ED48335/R2455 Issue 1
AEA Energy & Environment
The Gemini Building Fermi Avenue
Harwell International Business Centre Didcot OX11 0QR t: 0870 190 6401 f: 0870 190 6318 AEA Energy & Environment is a business name of AEA Technology plc AEA Energy & Environment is certificated to ISO9001
and ISO14001 Author Name John Abbott
Approved by Name Sean Christiansen
Signature
Date

Dispersion modelling of MOD and OESCO power station discharges Restricted – Commercial AEA/ED48335/Issue 1
iv AEA Energy & Environment

Restricted – Commercial Dispersion modelling of MOD and OESCO power station discharges AEA/ED48335/Issue 1
AEA Energy & Environment v
Executive summary
AEA Energy & Environment manage a programme of passive nitrogen dioxide monitoring using diffusion tubes on behalf of the Environmental Agency, Gibraltar. The results of the first two years of the monitoring programme have highlighted a significant area of Gibraltar that is exposed to annual
average concentrations of nitrogen dioxide that is above the EU limit value of 40 g m-3
. Measurements suggest that several areas are exposed to concentrations in excess of the limit value + margin of tolerance (a trigger for action prior to 2010). In order to inform our understanding of the elevated measured concentrations a modelling study has been undertaken to investigate the MOD and OESCO Ltd power generation facilities contribution to the measured concentrations. The complex terrain in the region of the OESCO Ltd and MOD power stations on Gibraltar presents a serious challenge for dispersion modelling. The flow model predicts that a zone of recirculating airflow develops in the area of Rosia Road and this limits the dispersion model‟s capability to predict concentrations in the area during these conditions. Model runs were therefore carried out with and without the effects of complex terrain. The model predicted that, even in the absence of complex terrain effects, the power station emissions
result in concentrations of nitrogen dioxide greater than the annual average limit value of 40 g m-3
in the Jumper‟s area. Model runs that took complex terrain effects into account indicated that plume
grounding would lead to hourly average concentrations greater than the limit value of 200 g m-3
on the slopes of the rock. The diesel generators used in the power stations are relatively old. Modern diesel engines that follow best available techniques emit approximately one tenth of the oxides of nitrogen emissions. The model results indicate that a 90% reduction in oxides of nitrogen emissions would be just sufficient to meet the annual average limit value and also to meet the hourly limit value. Dispersion of pollutants from the power stations could be improved by increasing the height of the discharge stacks. The model results show that increasing the stack height to 25 m would be sufficient to meet the annual mean and hourly mean limit values in the absence of complex terrain effects. However, the model runs with complex terrain indicate that plume grounding may continue to lead to
hourly average concentrations greater than the limit value of 200 g m-3
on the slopes of the rock. Road traffic emissions from Rosia Road also contribute to pollutant concentrations. Simple model results indicate that, in the absence of complex terrain effects and the increased emissions from vehicles travelling up hill, these emissions would not increase roadside concentrations much above background levels. Sensitivity studies suggest that roadside concentrations could approach those observed at Rosia Road and South Barracks Road if the effects of increased emissions from vehicles climbing up hill and the effects of street canyons are taken into account.

Dispersion modelling of MOD and OESCO power station discharges Restricted – Commercial AEA/ED48335/Issue 1
vi AEA Energy & Environment
Table of contents
1 Introduction 1
2 Nitrogen dioxide monitoring 2
2.1 Air quality objectives 2
2.2 Continuous monitoring 2
2.3 Passive monitoring 3
3 Modelling approach and inputs 6
3.1 Emissions sources 6
3.2 Emissions 6
3.3 Terrain 11
3.4 Buildings 12
3.5 Meteorological data 12
3.6 Receptor grids 14
3.7 Chemistry 14
3.8 Scenarios 14
3.9 Model runs 14
4 Results 16
4.1 Baseline 17
4.2 Scenario #1 - 90% reduction in emissions 19
4.3 Scenario #2 - 25 m stacks 19
4.4 Traffic 21
5 Discussion 33
5.1 Baseline Modelling 33
5.2 Scenario Modelling 34
6 Conclusions 35

Restricted – Commercial Dispersion modelling of MOD and OESCO power station discharges AEA/ED48335/Issue 1
AEA Energy & Environment vii


Restricted – Commercial Dispersion modelling of MOD and OESCO power station discharges AEA/ED48335/Issue 1
AEA Energy & Environment 1
1 Introduction
AEA Energy & Environment manage a programme of passive nitrogen dioxide monitoring using diffusion tubes on behalf of the Environmental Agency, Gibraltar. The results of the first two years of the monitoring programme, 2005 and 2006, highlighted consistently high concentrations of nitrogen dioxide in the vicinity of Jumper‟s on Rosia Road. The concentrations measured in and around this area exceeded the EU limit value plus the margin of tolerance for annual mean nitrogen dioxide concentrations. Road traffic is often the most significant contributor to roadside and kerbside nitrogen dioxide concentrations. However, the Jumper‟s location is close to two of the main power generation facilities in Gibraltar and it has been suggested that the generation plant contributes significantly to the local concentrations. The Environmental Agency, Gibraltar contracted AEA Energy & Environment to investigate further the measured high concentrations of nitrogen dioxide. The investigation comprises an expansion of the monitoring activities in the vicinity of Jumper‟s area and a dispersion modelling study of the area. This report describes the modelling study. The modelling study was carried out using the dispersion model ADMS3.3. ADMS3.3 is a practical dispersion model that uses an up-to-date description of the atmospheric boundary layer. Modules within the model allow the effects of complex terrain and buildings to be taken into account. Various approaches can be taken in modelling what is a complex real world situation, each involving some compromises because the modelling of pollutant dispersion over Gibraltar‟s complex terrain represents a considerable challenge. Sensitivity studies have therefore been carried out to assess the sensitivity of the model predictions to the modelling approach adopted and the meteorological input data used. In addition to using the model to represent the current situation (the base case) the model has been used to assess the effects of alternative scenarios representing options for process changes on the generation plant with a view to assessing the potential for reductions in nitrogen dioxide concentrations. Two scenarios have been investigated:
Reducing the emissions from the generation plant Increasing the discharge stack heights from the generation plant
The model is used to assess the effects of these alternative scenarios. Section 2 of this report provides a summary of recent measurements of nitrogen dioxide concentrations in Gibraltar. Section 3 of the report describes the model inputs. Section 4 presents the results of the modelling study and Section 5 discusses the contribution made by the power generation facility to the measured exceedences of the EU limit value. Section 6 presents the conclusions of the modelling study and sets out recommendations that arise from this study.
Dispersion modelling of MOD and OESCO power station discharges Restricted – Commercial AEA/ED48335/Issue 1
2 AEA Energy & Environment
2 Nitrogen dioxide monitoring
2.1 Air quality objectives
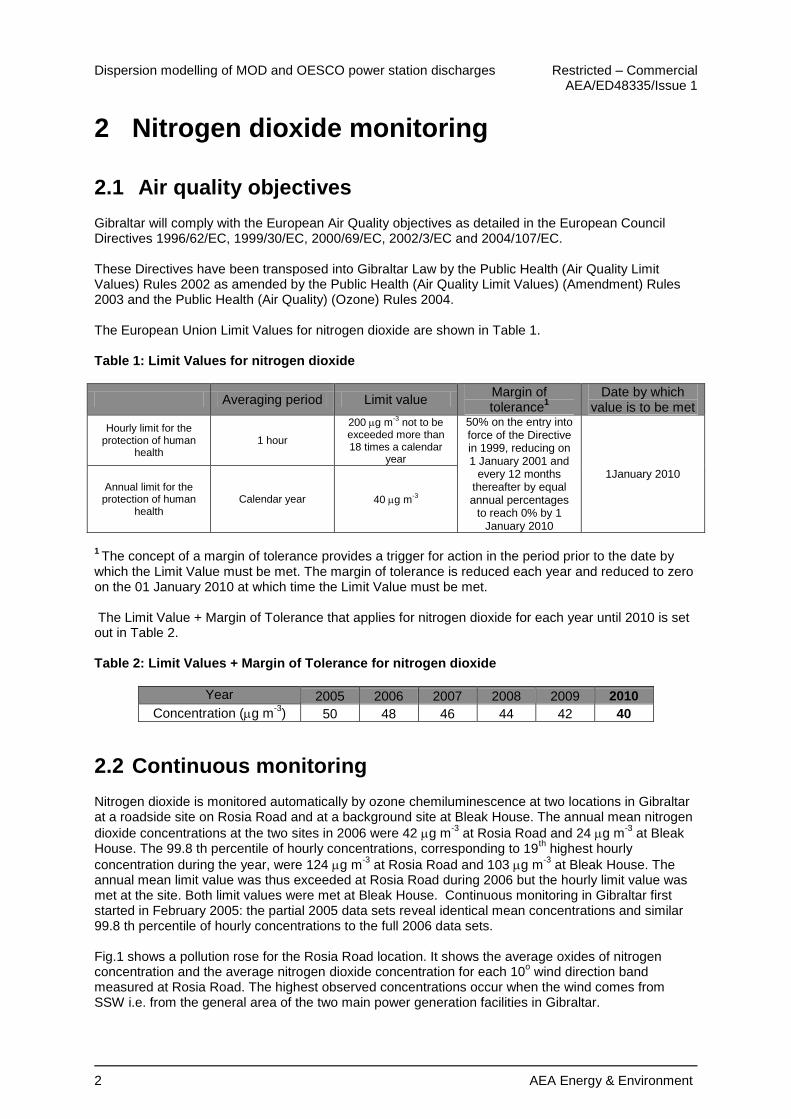
Gibraltar will comply with the European Air Quality objectives as detailed in the European Council Directives 1996/62/EC, 1999/30/EC, 2000/69/EC, 2002/3/EC and 2004/107/EC. These Directives have been transposed into Gibraltar Law by the Public Health (Air Quality Limit Values) Rules 2002 as amended by the Public Health (Air Quality Limit Values) (Amendment) Rules 2003 and the Public Health (Air Quality) (Ozone) Rules 2004. The European Union Limit Values for nitrogen dioxide are shown in Table 1. Table 1: Limit Values for nitrogen dioxide
Averaging period Limit value Margin of tolerance
1
Date by which value is to be met
Hourly limit for the protection of human
health 1 hour
200 g m-3 not to be
exceeded more than 18 times a calendar
year
50% on the entry into force of the Directive in 1999, reducing on 1 January 2001 and
every 12 months thereafter by equal annual percentages
to reach 0% by 1 January 2010
1January 2010
Annual limit for the protection of human
health Calendar year 40 g m
-3
1 The concept of a margin of tolerance provides a trigger for action in the period prior to the date by
which the Limit Value must be met. The margin of tolerance is reduced each year and reduced to zero on the 01 January 2010 at which time the Limit Value must be met. The Limit Value + Margin of Tolerance that applies for nitrogen dioxide for each year until 2010 is set out in Table 2. Table 2: Limit Values + Margin of Tolerance for nitrogen dioxide
Year 2005 2006 2007 2008 2009 2010
Concentration (g m-3
) 50 48 46 44 42 40
2.2 Continuous monitoring
Nitrogen dioxide is monitored automatically by ozone chemiluminescence at two locations in Gibraltar at a roadside site on Rosia Road and at a background site at Bleak House. The annual mean nitrogen
dioxide concentrations at the two sites in 2006 were 42 g m-3
at Rosia Road and 24 g m-3
at Bleak House. The 99.8 th percentile of hourly concentrations, corresponding to 19
th highest hourly
concentration during the year, were 124 g m-3
at Rosia Road and 103 g m-3
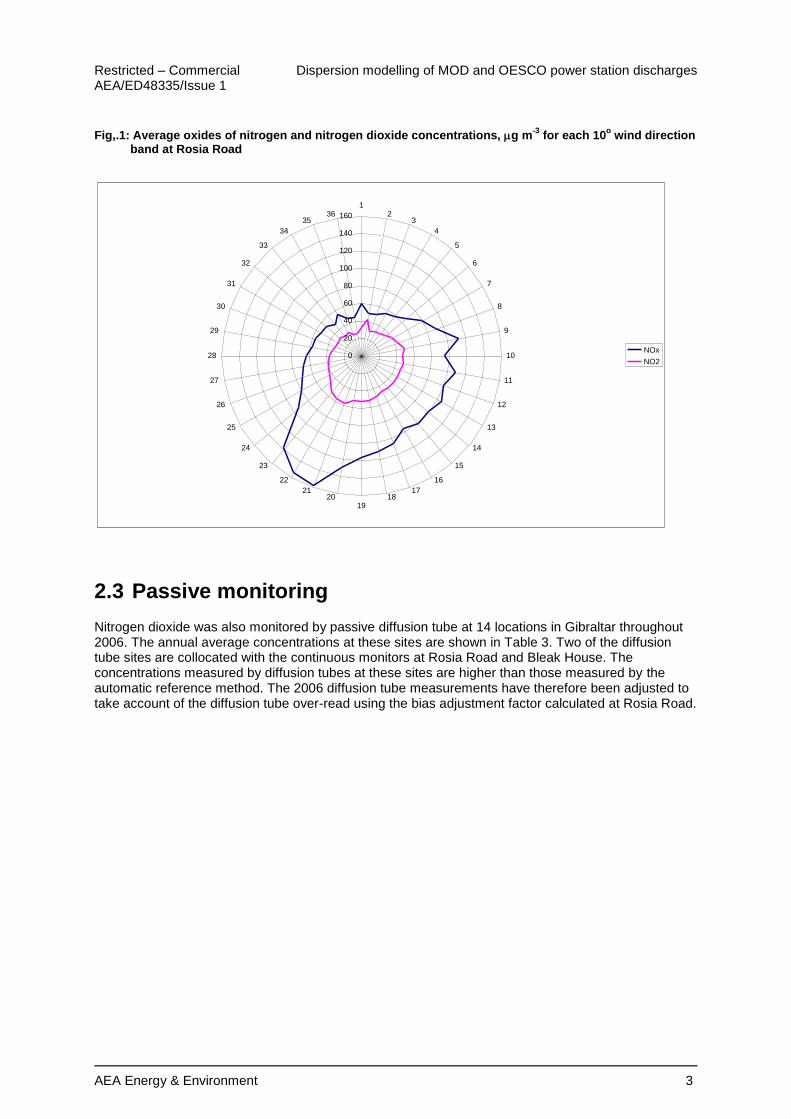
at Bleak House. The annual mean limit value was thus exceeded at Rosia Road during 2006 but the hourly limit value was met at the site. Both limit values were met at Bleak House. Continuous monitoring in Gibraltar first started in February 2005: the partial 2005 data sets reveal identical mean concentrations and similar 99.8 th percentile of hourly concentrations to the full 2006 data sets. Fig.1 shows a pollution rose for the Rosia Road location. It shows the average oxides of nitrogen concentration and the average nitrogen dioxide concentration for each 10
o wind direction band
measured at Rosia Road. The highest observed concentrations occur when the wind comes from SSW i.e. from the general area of the two main power generation facilities in Gibraltar.
Restricted – Commercial Dispersion modelling of MOD and OESCO power station discharges AEA/ED48335/Issue 1
AEA Energy & Environment 3
Fig,.1: Average oxides of nitrogen and nitrogen dioxide concentrations, g m-3
for each 10o wind direction
band at Rosia Road
2.3 Passive monitoring
Nitrogen dioxide was also monitored by passive diffusion tube at 14 locations in Gibraltar throughout 2006. The annual average concentrations at these sites are shown in Table 3. Two of the diffusion tube sites are collocated with the continuous monitors at Rosia Road and Bleak House. The concentrations measured by diffusion tubes at these sites are higher than those measured by the automatic reference method. The 2006 diffusion tube measurements have therefore been adjusted to take account of the diffusion tube over-read using the bias adjustment factor calculated at Rosia Road.
0
20
40
60
80
100
120
140
160
12
3
4
5
6
7
8
9
10
11
12
13
14
15
16
1718
1920
21
22
23
24
25
26
27
28
29
30
31
32
33
34
3536
NOx
NO2

Dispersion modelling of MOD and OESCO power station discharges Restricted – Commercial AEA/ED48335/Issue 1
4 AEA Energy & Environment
Table 3: Diffusion tube measurements 2006
Site Concentration, g m-3
Unadjusted Bias adjusted2
Jumpers 69 57
George Don House 47 39
Devils Tower Road 54 45
Water Gardens 51 42
Glacis Road 58 48
Harbour Views 39 32
Main Street No. 7 42 35
Queensway 42 35
Prince Edwards Road 49 40
Rosia Road 51 42
Red Sands Road 55 45
South Barracks Road 61 51
Bleak House 33 27
Lime Kiln Road 49 40 2 Bias adjustment based on the 2006 Rosia Road continuous monitoring collocation study
The annual limit value (40g m-3
) and the annual mean limit value + margin of tolerance for 2006
(48g m-3
) was exceeded at several of these sites during 2006, with particularly high concentrations measured at Jumpers. Most of the sites where the limit value was exceeded are kerbside sites on relatively busy roads. However, the Jumpers, South Barracks Road, Red Sands Road and Rosia Road sites are also close to two of the main power generation facilities in the dockyard area adjacent to Jumpers. In February 2007 additional diffusion tubes were installed near to the power generation facilities to provide more spatial detail of actual concentrations. Insufficient data have been collected so far to provide a basis for reliable assessment. Fig. 2 shows the location of diffusion tube sites in the area of the power generation facilities and Table 3 lists the measured concentrations (without any bias adjustment ) for February and March 2007. Table 4: Diffusion tube measurements, 30 January – 26 March2007
Site Unadjusted Concentration, g m-3
Rosia Road 48
Jumpers 69
Red Sands Road 54
South Barracks Road 60
Picton House - Rosia Promenade 46
Upper Withams Entrance 64
Withams Road 58
Almeda Gardens - Theatre 44
Almeda Gardens - Main Access 39
Rock Hotel - Europa Road 55
Gardiners Road 38
Governors Meadow - Rosia Promenade 58
Dockyard Road 59
Woodford Cottages - Europa Road 60
Restricted – Commercial Dispersion modelling of MOD and OESCO power station discharges AEA/ED48335/Issue 1
AEA Energy & Environment 5
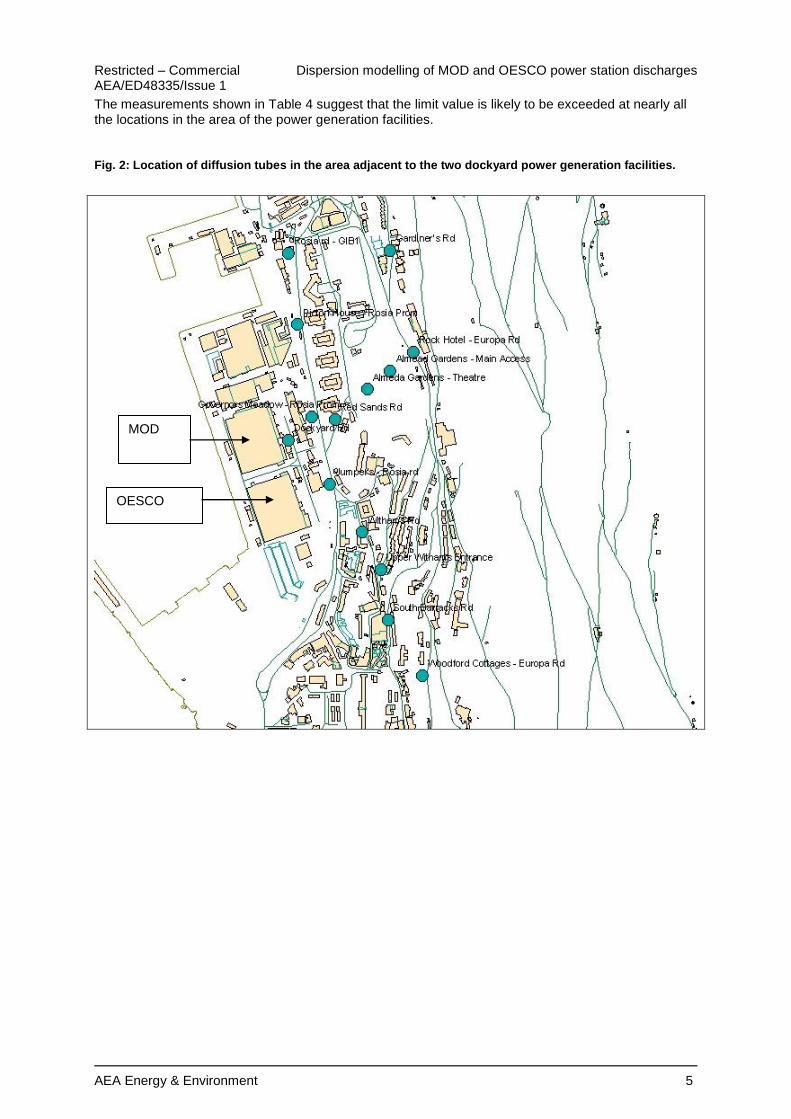
The measurements shown in Table 4 suggest that the limit value is likely to be exceeded at nearly all the locations in the area of the power generation facilities.
Fig. 2: Location of diffusion tubes in the area adjacent to the two dockyard power generation facilities.
OESCO
MOD
Dispersion modelling of MOD and OESCO power station discharges Restricted – Commercial AEA/ED48335/Issue 1
6 AEA Energy & Environment
3 Modelling approach and inputs
The impact of the emission discharges from the two dockyard power generation facilities is modelled using ADMS 3.3, a practical dispersion model that uses an up-to-date description of the atmospheric boundary layer. The actual ambient concentration of nitrogen dioxide that is experienced at any receptor location in Gibraltar is a function of emissions, from all sources of oxides of nitrogen, dispersion of those emissions after they leave the source and the chemistry that occurs between the emission point and the receptor location. Disperse sources of oxides of nitrogen provide a background concentration upon which more local sources such as the power generation facilities are superimposed. The 2006 monitoring data from the Bleak House continuous station has been used to provide the best estimate of the background concentration for Gibraltar. Modules within the model allow the dispersion effects of complex terrain and buildings to be taken into account. The modelling of the dispersion of pollutants over Gibraltar‟s complex terrain represents a considerable challenge for any model and various approaches can be taken in modelling this complex situation, each involving some compromises. Sensitivity studies were therefore carried out to assess the sensitivity of the model predictions to the modelling approach and the meteorological data. The contribution of road traffic local to the power generation facilities were assessed to identify how significant a contribution to ambient nitrogen dioxide concentrations is made by road traffic.
3.1 Emissions sources
Electricity is generated at three main power plants on Gibraltar. These are operated by the Ministry of Defence, OESCO Ltd and Gibelec Ltd. The Ministry of Defence and OESCO Ltd stations are located in the dockyard area to the west of Rosia Road below Jumpers, while the Gibelec Ltd power station is located on Gibraltar‟s North Mole. The Ministry of Defence and OESCO Ltd power stations have the greatest potential to affect the nitrogen dioxide concentrations in the Rosia Road area and are considered within this study. They are the nearest stations to the area of highest measured nitrogen dioxide concentrations. Traffic on Rosia Road also contributes to oxides of nitrogen emissions. The contribution to oxides of nitrogen emissions from the traffic was also investigated.
3.2 Emissions
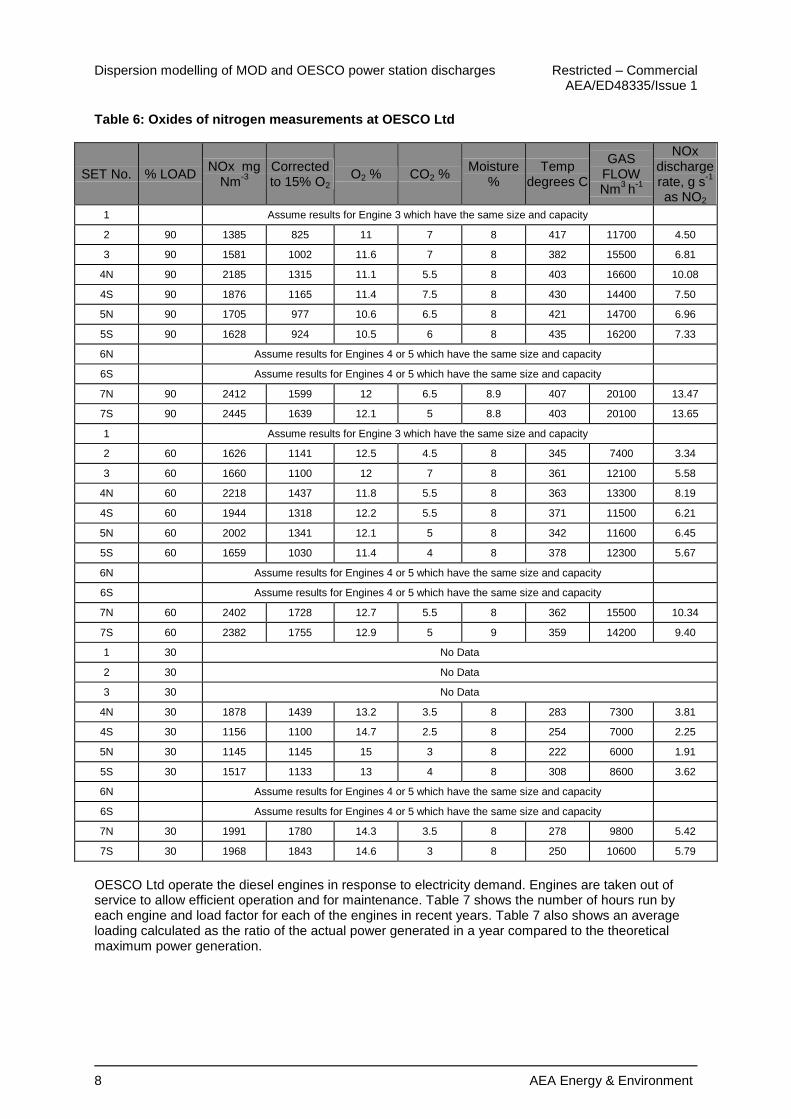
3.2.1 OESCO Ltd
OESCO Ltd operate seven diesel engines, discharging through eleven stacks as shown in Table 5.

Restricted – Commercial Dispersion modelling of MOD and OESCO power station discharges AEA/ED48335/Issue 1
AEA Energy & Environment 7
Table 5: OESCO Ltd Emission points
Emission Point
Description Engine
Size
A1 Engine No. 1 Stack 2.5 MW
A2 Engine No. 2 Stack 1.8 MW
A3 Engine No. 3 Stack 2.5 MW
A4 Engine No. 4 Stack 4N 5.1 MW
A5 Engine No. 4 Stack 4S
A6 Engine No. 5 Stack 5N 5.1 MW
A7 Engine No. 5 Stack 5S
A8 Engine No. 6 Stack 6N 5.1 MW
A9 Engine No. 6 Stack 6S
A10 Engine No. 7 Stack 7N 5.1 MW
A11 Engine No. 7 Stack 7S
Inspeccion y Control measured oxides of nitrogen concentrations and discharge flowrates for these stacks on behalf of OESCO Ltd. The gas flowrates were determined following standard UNE77225:2000, equivalent to ISO 10780:1994. Oxides of nitrogen concentrations were determined following standard UNE 77218:1996, equivalent to ISO 10369:1993. The results are summarised in Table 6.
Dispersion modelling of MOD and OESCO power station discharges Restricted – Commercial AEA/ED48335/Issue 1
8 AEA Energy & Environment
Table 6: Oxides of nitrogen measurements at OESCO Ltd
SET No. % LOAD NOx mg
Nm-3
Corrected to 15% O2
O2 % CO2 % Moisture
% Temp
degrees C
GAS FLOW Nm
3 h
-1
NOx discharge rate, g s
-1
as NO2
1 Assume results for Engine 3 which have the same size and capacity
2 90 1385 825 11 7 8 417 11700 4.50
3 90 1581 1002 11.6 7 8 382 15500 6.81
4N 90 2185 1315 11.1 5.5 8 403 16600 10.08
4S 90 1876 1165 11.4 7.5 8 430 14400 7.50
5N 90 1705 977 10.6 6.5 8 421 14700 6.96
5S 90 1628 924 10.5 6 8 435 16200 7.33
6N Assume results for Engines 4 or 5 which have the same size and capacity
6S Assume results for Engines 4 or 5 which have the same size and capacity
7N 90 2412 1599 12 6.5 8.9 407 20100 13.47
7S 90 2445 1639 12.1 5 8.8 403 20100 13.65
1 Assume results for Engine 3 which have the same size and capacity
2 60 1626 1141 12.5 4.5 8 345 7400 3.34
3 60 1660 1100 12 7 8 361 12100 5.58
4N 60 2218 1437 11.8 5.5 8 363 13300 8.19
4S 60 1944 1318 12.2 5.5 8 371 11500 6.21
5N 60 2002 1341 12.1 5 8 342 11600 6.45
5S 60 1659 1030 11.4 4 8 378 12300 5.67
6N Assume results for Engines 4 or 5 which have the same size and capacity
6S Assume results for Engines 4 or 5 which have the same size and capacity
7N 60 2402 1728 12.7 5.5 8 362 15500 10.34
7S 60 2382 1755 12.9 5 9 359 14200 9.40
1 30 No Data
2 30 No Data
3 30 No Data
4N 30 1878 1439 13.2 3.5 8 283 7300 3.81
4S 30 1156 1100 14.7 2.5 8 254 7000 2.25
5N 30 1145 1145 15 3 8 222 6000 1.91
5S 30 1517 1133 13 4 8 308 8600 3.62
6N Assume results for Engines 4 or 5 which have the same size and capacity
6S Assume results for Engines 4 or 5 which have the same size and capacity
7N 30 1991 1780 14.3 3.5 8 278 9800 5.42
7S 30 1968 1843 14.6 3 8 250 10600 5.79
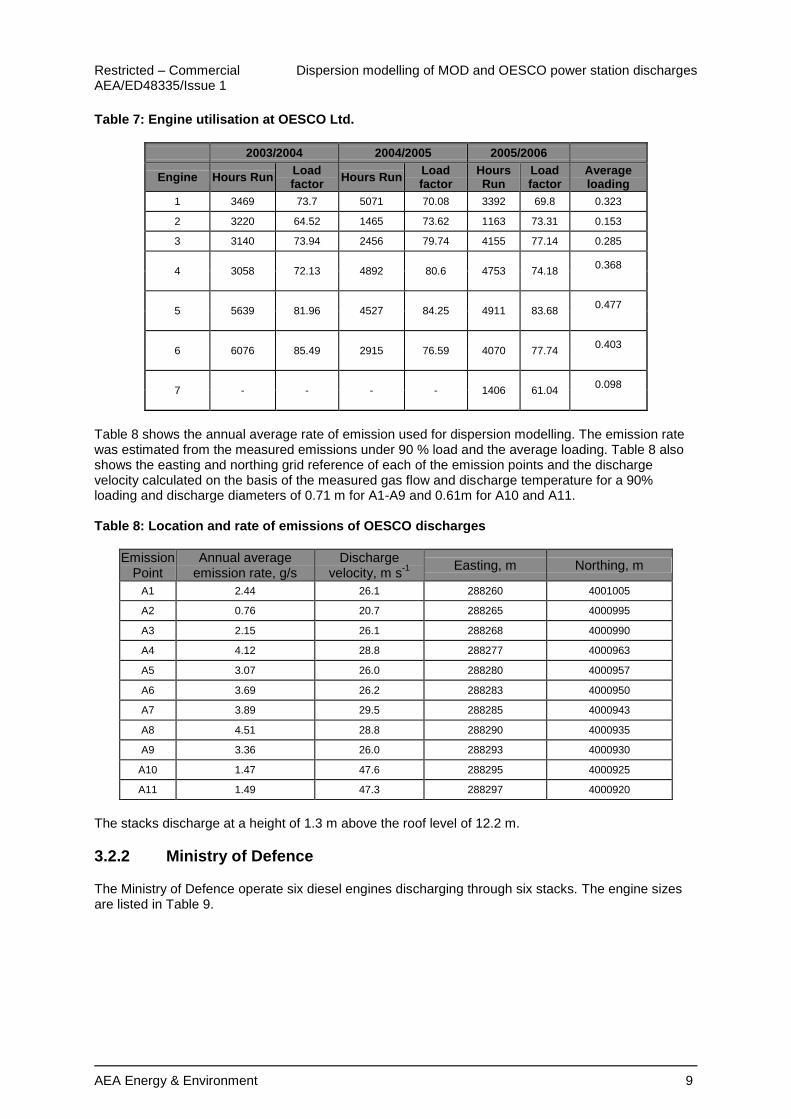
OESCO Ltd operate the diesel engines in response to electricity demand. Engines are taken out of service to allow efficient operation and for maintenance. Table 7 shows the number of hours run by each engine and load factor for each of the engines in recent years. Table 7 also shows an average loading calculated as the ratio of the actual power generated in a year compared to the theoretical maximum power generation.
Restricted – Commercial Dispersion modelling of MOD and OESCO power station discharges AEA/ED48335/Issue 1
AEA Energy & Environment 9
Table 7: Engine utilisation at OESCO Ltd.
2003/2004 2004/2005 2005/2006
Engine Hours Run Load factor
Hours Run Load factor
Hours Run
Load factor
Average loading
1 3469 73.7 5071 70.08 3392 69.8 0.323
2 3220 64.52 1465 73.62 1163 73.31 0.153
3 3140 73.94 2456 79.74 4155 77.14 0.285
4 3058 72.13 4892 80.6 4753 74.18 0.368
5 5639 81.96 4527 84.25 4911 83.68 0.477
6 6076 85.49 2915 76.59 4070 77.74 0.403
7 - - - - 1406 61.04 0.098
Table 8 shows the annual average rate of emission used for dispersion modelling. The emission rate was estimated from the measured emissions under 90 % load and the average loading. Table 8 also shows the easting and northing grid reference of each of the emission points and the discharge velocity calculated on the basis of the measured gas flow and discharge temperature for a 90% loading and discharge diameters of 0.71 m for A1-A9 and 0.61m for A10 and A11. Table 8: Location and rate of emissions of OESCO discharges
Emission Point
Annual average emission rate, g/s
Discharge velocity, m s
-1 Easting, m Northing, m
A1 2.44 26.1 288260 4001005
A2 0.76 20.7 288265 4000995
A3 2.15 26.1 288268 4000990
A4 4.12 28.8 288277 4000963
A5 3.07 26.0 288280 4000957
A6 3.69 26.2 288283 4000950
A7 3.89 29.5 288285 4000943
A8 4.51 28.8 288290 4000935
A9 3.36 26.0 288293 4000930
A10 1.47 47.6 288295 4000925
A11 1.49 47.3 288297 4000920
The stacks discharge at a height of 1.3 m above the roof level of 12.2 m.
3.2.2 Ministry of Defence
The Ministry of Defence operate six diesel engines discharging through six stacks. The engine sizes are listed in Table 9.
Dispersion modelling of MOD and OESCO power station discharges Restricted – Commercial AEA/ED48335/Issue 1
10 AEA Energy & Environment
Table 9: Ministry of Defence engine sizes
Emission Point
Engine Size
7 2.16 MW
8 2.16 MW
9 2.16 MW
10 2.16 MW
12 4.68 MW
14 3.8 MW
The Institute of Naval Measurement (INM) carried out stack emissions monitoring but standard methods were not used and it was not possible to measure either the discharge flowrate or the total oxides of nitrogen concentrations. An emission factor of 3 g MJ
-1, estimated from the measurements
on similar diesel engines at OESCO has therefore been used to estimate emissions from the MOD engines. Similarly a discharge rate of 2 Nm
3 MJ
-1 has been used to estimate the discharge flowrate.
The MOD diesel engines have a total generating capacity of 17.12 MW. Typically the electricity demand is 5-7 MW. For modelling purposes, it has been assumed that generators 7, 12 and 14 are running at 66% loading. Discharge temperature of 400
oC has been assumed, typical of this type of diesel engine. The stacks
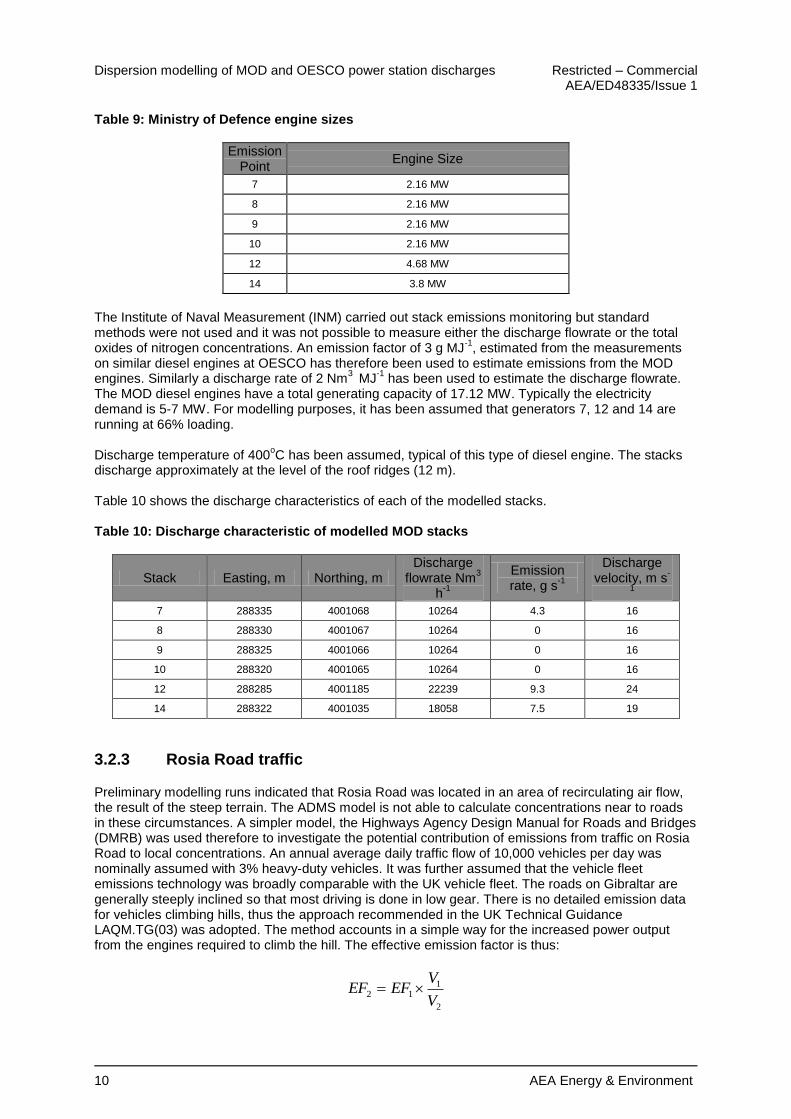
discharge approximately at the level of the roof ridges (12 m). Table 10 shows the discharge characteristics of each of the modelled stacks. Table 10: Discharge characteristic of modelled MOD stacks
Stack Easting, m Northing, m Discharge
flowrate Nm3
h-1
Emission rate, g s
-1
Discharge velocity, m s
-
1
7 288335 4001068 10264 4.3 16
8 288330 4001067 10264 0 16
9 288325 4001066 10264 0 16
10 288320 4001065 10264 0 16
12 288285 4001185 22239 9.3 24
14 288322 4001035 18058 7.5 19
3.2.3 Rosia Road traffic
Preliminary modelling runs indicated that Rosia Road was located in an area of recirculating air flow, the result of the steep terrain. The ADMS model is not able to calculate concentrations near to roads in these circumstances. A simpler model, the Highways Agency Design Manual for Roads and Bridges (DMRB) was used therefore to investigate the potential contribution of emissions from traffic on Rosia Road to local concentrations. An annual average daily traffic flow of 10,000 vehicles per day was nominally assumed with 3% heavy-duty vehicles. It was further assumed that the vehicle fleet emissions technology was broadly comparable with the UK vehicle fleet. The roads on Gibraltar are generally steeply inclined so that most driving is done in low gear. There is no detailed emission data for vehicles climbing hills, thus the approach recommended in the UK Technical Guidance LAQM.TG(03) was adopted. The method accounts in a simple way for the increased power output from the engines required to climb the hill. The effective emission factor is thus:
2
112
V
VEFEF
Restricted – Commercial Dispersion modelling of MOD and OESCO power station discharges AEA/ED48335/Issue 1
AEA Energy & Environment 11
where EF1 is the emission factor for vehicles travelling with high engine load on flat terrain (V1=100 kph) ; EF2 is the emission factor for vehicles travelling at speed V2=20 kph up hill. The road is sheltered on one or both sides by large buildings, close to the road. The closeness of the buildings gives rise to a potential street canyon effect. The advice given in the UK Technical Guidance LAQM.TG(03) was followed; this suggests that the predicted annual mean nitrogen dioxide road traffic component from DMRB should be multiplied by a factor 2. This should then be added to the background concentration (in this case from Bleak House) to give the total predicted concentration.
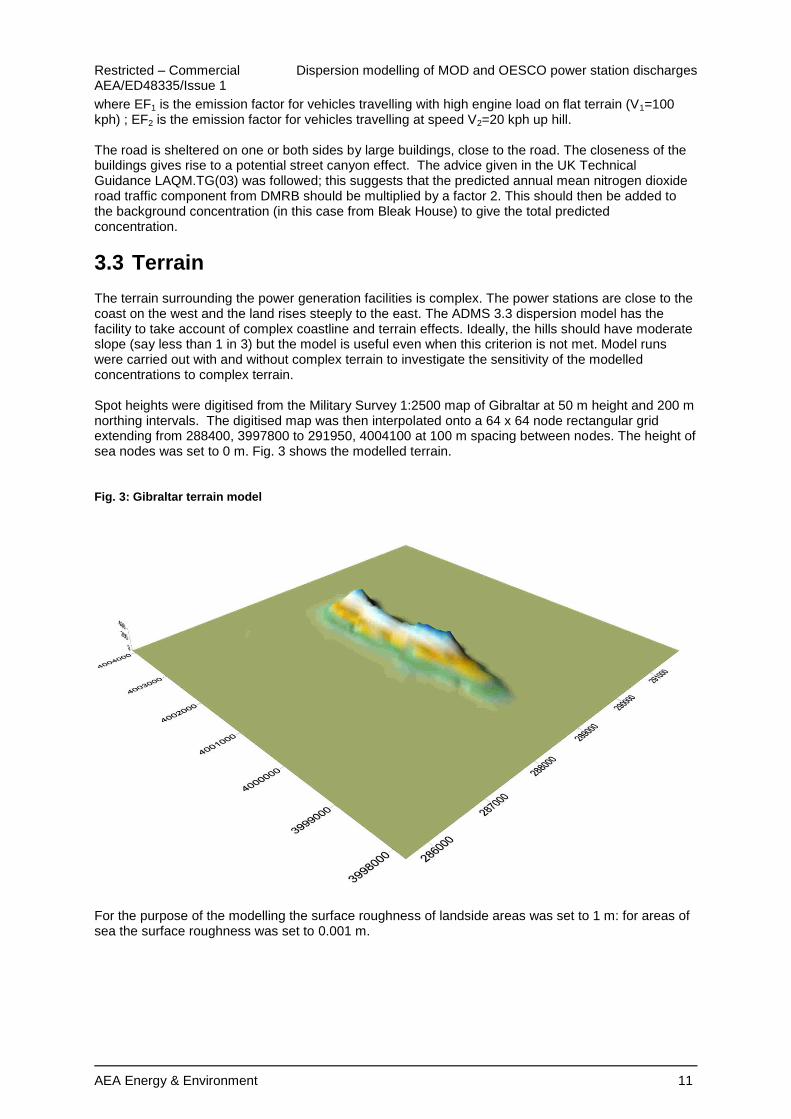
3.3 Terrain
The terrain surrounding the power generation facilities is complex. The power stations are close to the coast on the west and the land rises steeply to the east. The ADMS 3.3 dispersion model has the facility to take account of complex coastline and terrain effects. Ideally, the hills should have moderate slope (say less than 1 in 3) but the model is useful even when this criterion is not met. Model runs were carried out with and without complex terrain to investigate the sensitivity of the modelled concentrations to complex terrain. Spot heights were digitised from the Military Survey 1:2500 map of Gibraltar at 50 m height and 200 m northing intervals. The digitised map was then interpolated onto a 64 x 64 node rectangular grid extending from 288400, 3997800 to 291950, 4004100 at 100 m spacing between nodes. The height of sea nodes was set to 0 m. Fig. 3 shows the modelled terrain.
Fig. 3: Gibraltar terrain model
For the purpose of the modelling the surface roughness of landside areas was set to 1 m: for areas of sea the surface roughness was set to 0.001 m.
Dispersion modelling of MOD and OESCO power station discharges Restricted – Commercial AEA/ED48335/Issue 1
12 AEA Energy & Environment
3.4 Buildings
Dispersion from the diesel engine discharges is affected by the presence of nearby buildings. The MOD generator, HM Naval Base and OESCO Ltd buildings are located on the dock area immediately below the Rosia Road Promenade, with the building roofs approximately level with the Promenade. Model runs were carried out in which the buildings were included as part of the terrain. The effective stack heights for these model runs were the heights above the roof ridges. Close to the buildings, the MOD and OESCO Ltd buildings potentially have the most significant effect on dispersion. Separate model runs were therefore carried out for flat terrain, but taking the buildings into account. The two buildings were treated in ADMS3.3 as rectangular blocks. The position of the centre of the blocks, their dimensions and the angle with respect to north is shown in Table 11. The MOD building was assessed to be the “main building” influencing dispersion from MOD stacks 7-12: The OESCO building was the “main building” for the OESCO discharges and MOD stack 14. Table 11: Buildings affecting dispersion
Grid reference of building centroid Length ,
m Width, m
Angle to north
Height, m Easting,
m Northing,
m
MOD 288280 4001115 125 102 162 12.2
OESCO 288330 4000970 125 102 162 12.2
ADMS3.3 has the capability to model the buildings and the complex terrain together. However, the model cannot take account of buildings that are located in “reverse flow” areas where the ground level wind moves in the opposite direction to the general wind. Preliminary model runs showed that reverse flow occurred in the area of the MOD and OESCO buildings for many hours of the year.
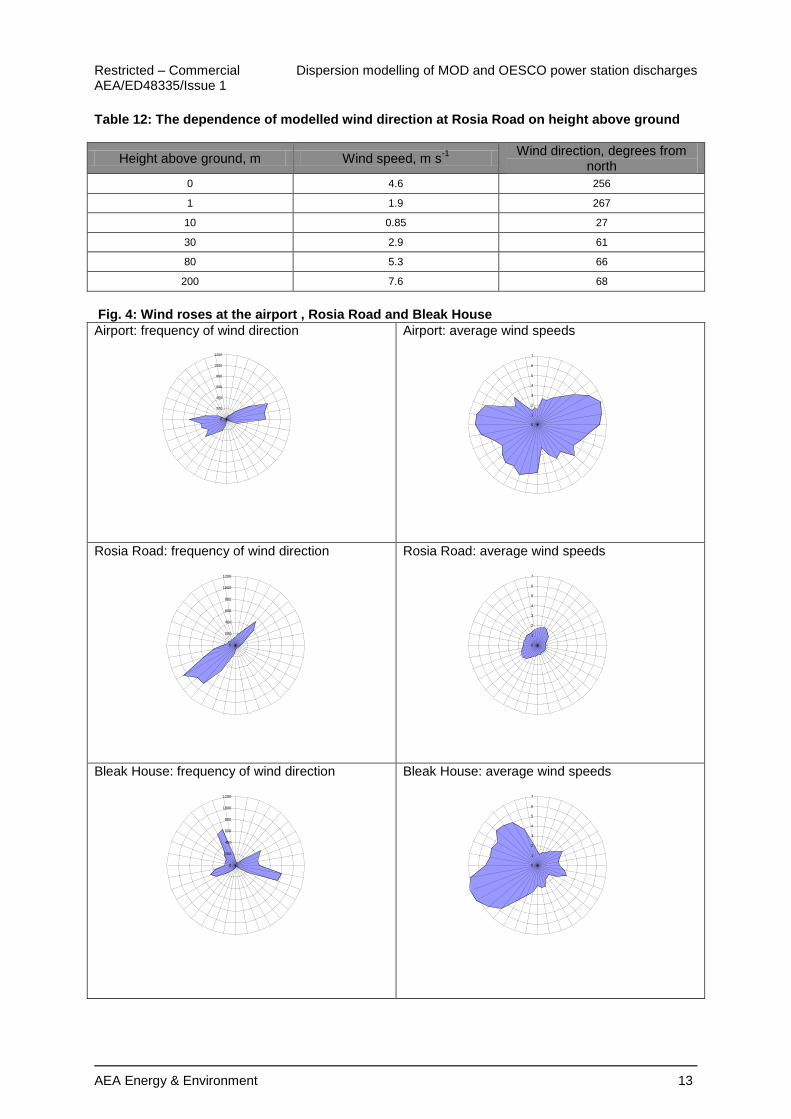
3.5 Meteorological data
Meteorological data for the period 2002-2006 for Gibraltar Airport was obtained from Trinity Consultants. The data provides hourly sequential records of the wind speed and direction, temperature and cloud cover. Fig.4 shows the frequency of winds from each direction observed at the airport and the average wind speed in each direction. The most frequent winds are from the south-west and north-east. Average wind speeds are typically 6-7 m s
-1 in these directions. By contrast the
wind speed measured on the 7 m meteorological mast at the Rosia Road air quality monitoring site is much smaller, typically less than 1 m s
-1. The wind speeds predicted by the ADMS terrain module at
the Rosia Road site are also substantially less than those predicted at the airport. For example, for winds (10 m above ground) from the north-east (70
o from north) at the Airport with a wind speed of 7
m s-1
, the predicted wind speed (10 m above ground) at Rosia Road was 0.85 m s-1
. The modelled wind direction at Rosia Road depends to a considerable degree on the height above ground. Table 12 shows the modelled wind direction at Rosia Road when there are north-east winds at the airport, it can be seen that the wind direction is reversed close to the ground.
Restricted – Commercial Dispersion modelling of MOD and OESCO power station discharges AEA/ED48335/Issue 1
AEA Energy & Environment 13
Table 12: The dependence of modelled wind direction at Rosia Road on height above ground
Height above ground, m Wind speed, m s-1 Wind direction, degrees from
north
0 4.6 256
1 1.9 267
10 0.85 27
30 2.9 61
80 5.3 66
200 7.6 68
Fig. 4: Wind roses at the airport , Rosia Road and Bleak House
Airport: frequency of wind direction
Airport: average wind speeds
Rosia Road: frequency of wind direction
Rosia Road: average wind speeds
Bleak House: frequency of wind direction
Bleak House: average wind speeds
0
1
2
3
4
5
6
7
12
3
4
5
6
7
8
9
10
11
12
13
14
15
16
1718
1920
21
22
23
24
25
26
27
28
29
30
31
32
33
34
3536
0
200
400
600
800
1000
1200
12
3
4
5
6
7
8
9
10
11
12
13
14
15
16
1718
1920
21
22
23
24
25
26
27
28
29
30
31
32
33
34
3536
0
200
400
600
800
1000
1200
12
3
4
5
6
7
8
9
10
11
12
13
14
15
16
1718
1920
21
22
23
24
25
26
27
28
29
30
31
32
33
34
3536
0
1
2
3
4
5
6
7
12
3
4
5
6
7
8
9
10
11
12
13
14
15
16
1718
1920
21
22
23
24
25
26
27
28
29
30
31
32
33
34
3536
0
200
400
600
800
1000
1200
12
3
4
5
6
7
8
9
10
11
12
13
14
15
16
1718
1920
21
22
23
24
25
26
27
28
29
30
31
32
33
34
3536
0
1
2
3
4
5
6
7
12
3
4
5
6
7
8
9
10
11
12
13
14
15
16
1718
1920
21
22
23
24
25
26
27
28
29
30
31
32
33
34
3536
Dispersion modelling of MOD and OESCO power station discharges Restricted – Commercial AEA/ED48335/Issue 1
14 AEA Energy & Environment
3.6 Receptor grids
The model was used to predict ground level concentrations resulting from emissions from the electricity generation on a rectangular receptor grid extending 500 m in each direction from the generating plant, with receptors at 50 m intervals.
3.7 Chemistry
Oxides of nitrogen emitted from the power generation diesel engines and from road traffic reacts with ozone in the air to form nitrogen dioxide. The rate of reaction depends on the concentrations of the reacting gases and on the temperature and available solar radiation. These chemical reactions were modelled in the ADMS 3.3 model runs for 2006 taking account of hourly measured oxides of nitrogen, nitrogen dioxide and ozone concentrations from the Bleak House monitoring site. It was assumed that 10% of the oxides of nitrogen emissions were present as nitrogen dioxide: this is the ADMS default value. Monitoring at Bleak House started part way through 2005 and so data is not available for complete years before 2006.
3.8 Scenarios
The Environment Agency Sector Guidance Note for combustion activities specifies a benchmark emission limit for compression ignition engines for oxides of nitrogen of 150 mg m
-3 at 15% oxygen,
dry, 273 K and 101325 Pa pressure. This is approximately 10-20% of the emission concentrations measured at the OESCO plant. The benchmark emission limit could be achieved if new engines were installed and so represents the best possible improvement that could be obtained by means of changes to the engine installation alone. A 90% reduction in engine emissions from the OESCO and MOD plant has therefore been considered as one possible improvement scenario. The contribution to oxides of nitrogen concentrations at the receptors from the generators is proportional to the rate of emission and so the contribution for this scenario can be obtained by scaling the baseline model results. However, the contribution to nitrogen dioxide concentrations is not proportional to emissions and so additional runs were carried out for 2006. Some improvement in dispersion could be obtained by discharging through taller stacks. The greatest benefit would be obtained where the discharges are grouped together in a single stack. It has been assumed therefore that the discharges from the OESCO plant can be discharged at 400
oC through a
single stack, 25 m tall with diameter 1.4 m at a velocity of 15 m s-1
. It has also been assumed that the MOD stacks are increased in height to 25 m: however, it has been assumed that the MOD discharges will remain through individual stacks because it is not practicable to discharge these emissions through a single stack.
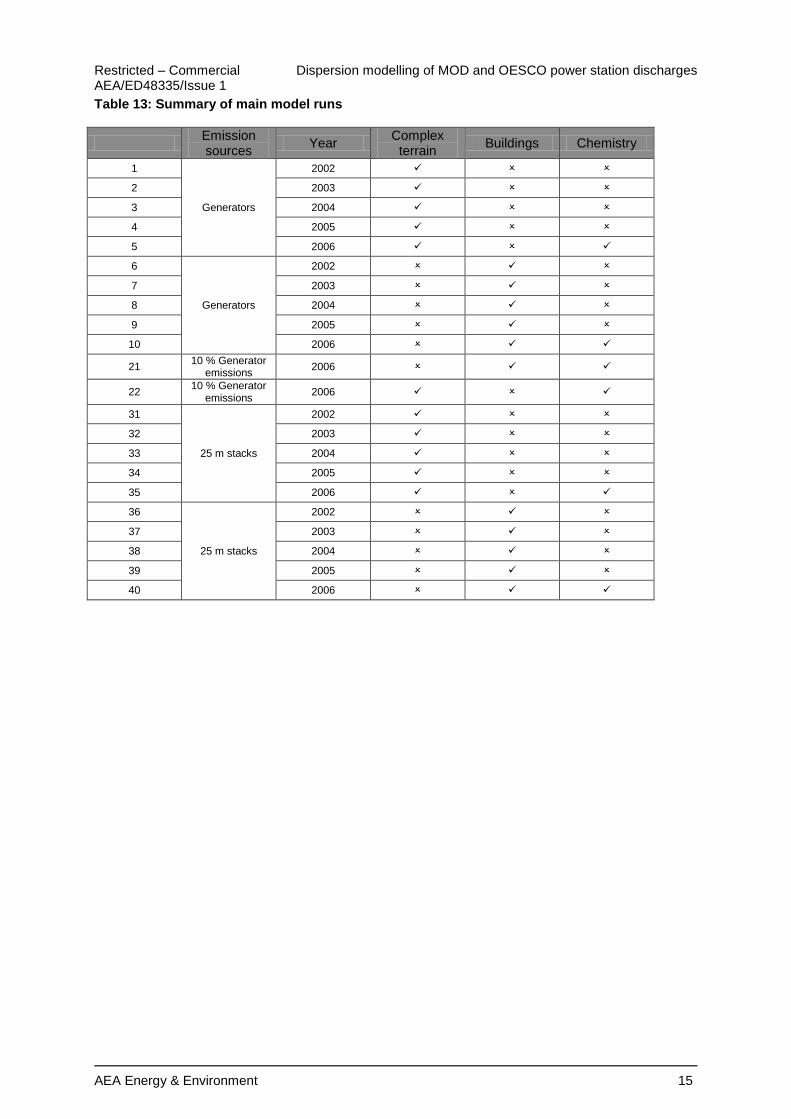
3.9 Model runs
Table 13 summarises the model runs carried out. Model runs without complex terrain provide an indication of the impact of the power stations in flat terrain. These model runs should be considered representative of the impact at the optimum location. An installation is unlikely to be satisfactory if predicted concentrations under these conditions exceed the limit values. Model runs carried out with complex terrain represent our best attempt to simulate the effects of Gibraltar‟s terrain.
Restricted – Commercial Dispersion modelling of MOD and OESCO power station discharges AEA/ED48335/Issue 1
AEA Energy & Environment 15
Table 13: Summary of main model runs
Emission sources
Year Complex
terrain Buildings Chemistry
1
Generators
2002
2 2003
3 2004
4 2005
5 2006
6
Generators
2002
7 2003
8 2004
9 2005
10 2006
21 10 % Generator
emissions 2006
22 10 % Generator
emissions 2006
31
25 m stacks
2002
32 2003
33 2004
34 2005
35 2006
36
25 m stacks
2002
37 2003
38 2004
39 2005
40 2006
Dispersion modelling of MOD and OESCO power station discharges Restricted – Commercial AEA/ED48335/Issue 1
16 AEA Energy & Environment
4 Results
The results of the dispersion modelling are presented in this section. Modelled concentrations at the diffusion tube locations in the area adjacent to the power generation facilities are listed in a series of tables. The tables show the modelled oxides of nitrogen concentrations for each meteorological data set and modelled nitrogen dioxide concentrations for 2006. The tables are listed as follows:
Table 14: Modelled contributions from the power generation facilities to annual average oxides
of nitrogen concentrations at monitoring locations, g m-3
: baseline Table 15: Modelled contributions from the power generation facilities to 99.8
th percentile of
hourly oxides of nitrogen concentrations at monitoring locations, g m-3
: baseline
Table 16: Modelled nitrogen dioxide concentrations at monitoring locations , g m-3
resulting from power generation facilities emissions: baseline
Table 17: Modelled nitrogen dioxide concentrations at monitoring locations, g m-3
resulting from power generation facilities emissions: 90% reduction in emissions Table 18: Modelled contributions from power generation facilities emissions to annual average
oxides of nitrogen concentrations at monitoring locations, g m-3
: 25 m stacks Table 19: Modelled contributions from power generation facilities emissions to 99.8
th
percentile of hourly oxides of nitrogen concentrations at monitoring locations, g m-3
: 25 m stacks Table 20: Modelled nitrogen dioxide concentrations at monitoring locations resulting from
power generation facilities emissions, g m-3
: 25 m stack height.
Table 21 shows the concentrations resulting from road traffic predicted at the kerbside (5 m from the road centreline) using the DMRB model for a range of scenarios.
The results of the power station modelling are shown as contour plots (isopleths) of modelled nitrogen dioxide concentrations superimposed on a map of the area near to the power stations:
Fig. 5: Annual mean nitrogen dioxide concentrations, base case with buildings, run 10c Fig. 6: Annual mean nitrogen dioxide concentrations, base case complex terrain, run 5c Fig. 7: 99.8
th percentile hourly nitrogen dioxide concentrations, base case with buildings, run
10c Fig. 8: 99.8
th percentile hourly nitrogen dioxide concentrations, base case with complex
terrain, run 5c Fig. 9: Annual mean nitrogen dioxide concentrations, 90 % reduction in emissions with buildings, run 21c Fig. 10: Annual mean nitrogen dioxide concentrations, 90 % reduction in emissions with complex terrain, run 22c Fig. 11: 99.8
th percentile hourly nitrogen dioxide concentrations, 90% reduction in emissions
with complex terrain, run 22c Fig. 12: Annual mean nitrogen dioxide concentrations, 25 m stacks with buildings, run 40c Fig. 13: Annual mean nitrogen dioxide concentrations, 25 m stacks with complex terrain, run 35c Fig. 14: 99.8
th percentile hourly nitrogen dioxide concentrations, 25 m stacks with buildings,
run 40c Fig. 15: 99.8
th percentile hourly nitrogen dioxide concentrations, 25 m stacks with complex
terrain, run 35c

Restricted – Commercial Dispersion modelling of MOD and OESCO power station discharges AEA/ED48335/Issue 1
AEA Energy & Environment 17
4.1 Baseline
Table 14: Modelled contributions to annual average oxides of nitrogen concentrations at
monitoring sites, g m-3
: baseline
Complex terrain Buildings
Met. Data Year 2002 2003 2004 2005 2006 2002 2003 2004 2005 2006
Run no. 1 2 3 4 5 6 7 8 9 10
Rosia rd - GIB1 31 24 20 18 21 21 18 13 11 16
Jumper's - Rosia rd 23 20 24 20 22 177 167 171 143 153
Red Sands Rd 38 30 30 30 32 189 161 143 131 153
South Barracks Rd 10 13 7 5 7 7 9 8 7 7
Picton House - Rosia Prom 45 34 29 29 33 67 54 42 38 51
Upper Withams Entrance 26 27 19 20 21 41 41 41 36 38
Withams Rd 16 16 16 14 15 76 76 78 66 70
Almeda Gardens - Theatre 67 54 62 60 63 121 104 96 87 100
Almead Gardens - Main Access 43 39 45 43 40 90 77 70 64 74
Rock Hotel - Europa Rd 23 17 23 22 21 69 59 53 49 57
Gardiner‟s Rd 45 40 40 40 36 38 31 24 23 29
Governors Meadow - Rosia Prom 56 45 38 38 44 169 142 115 107 134
Dockyard Rd 70 54 43 44 52 142 115 87 82 108
Woodford Cottages - Europa Rd 9 11 6 3 5 3 4 4 3 3
Dispersion modelling of MOD and OESCO power station discharges Restricted – Commercial AEA/ED48335/Issue 1
18 AEA Energy & Environment
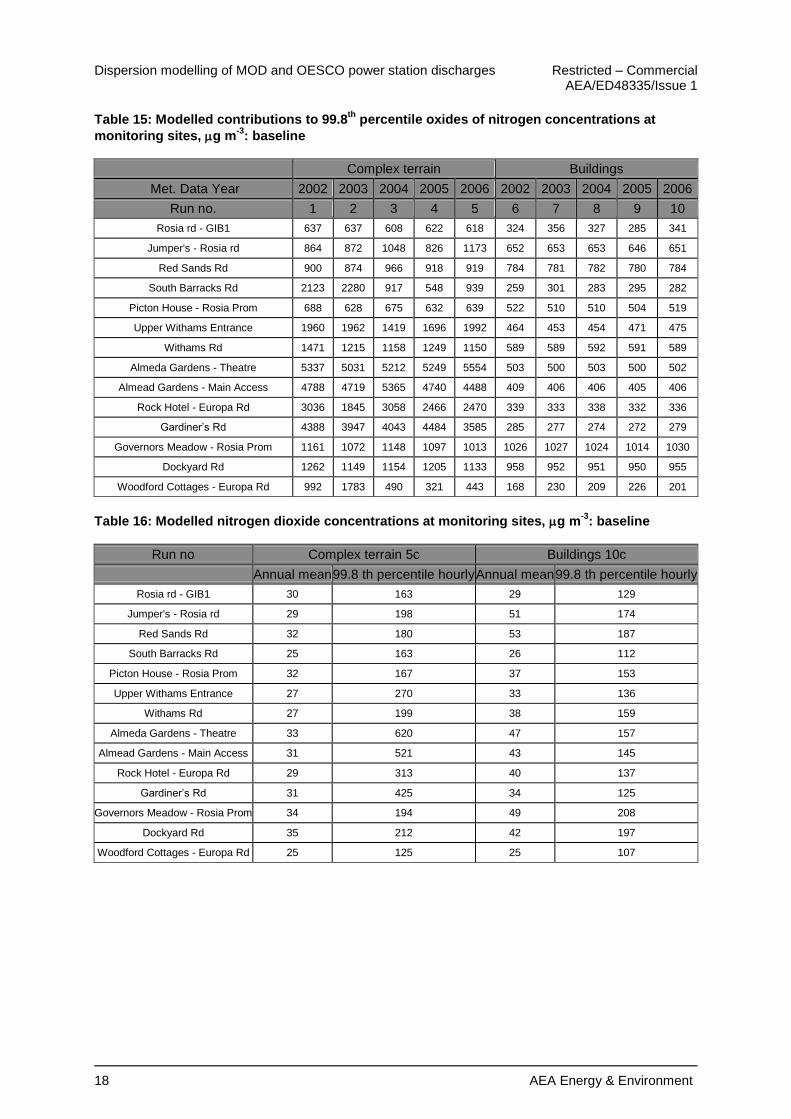
Table 15: Modelled contributions to 99.8
th percentile oxides of nitrogen concentrations at
monitoring sites, g m-3
: baseline
Complex terrain Buildings
Met. Data Year 2002 2003 2004 2005 2006 2002 2003 2004 2005 2006
Run no. 1 2 3 4 5 6 7 8 9 10
Rosia rd - GIB1 637 637 608 622 618 324 356 327 285 341
Jumper's - Rosia rd 864 872 1048 826 1173 652 653 653 646 651
Red Sands Rd 900 874 966 918 919 784 781 782 780 784
South Barracks Rd 2123 2280 917 548 939 259 301 283 295 282
Picton House - Rosia Prom 688 628 675 632 639 522 510 510 504 519
Upper Withams Entrance 1960 1962 1419 1696 1992 464 453 454 471 475
Withams Rd 1471 1215 1158 1249 1150 589 589 592 591 589
Almeda Gardens - Theatre 5337 5031 5212 5249 5554 503 500 503 500 502
Almead Gardens - Main Access 4788 4719 5365 4740 4488 409 406 406 405 406
Rock Hotel - Europa Rd 3036 1845 3058 2466 2470 339 333 338 332 336
Gardiner‟s Rd 4388 3947 4043 4484 3585 285 277 274 272 279
Governors Meadow - Rosia Prom 1161 1072 1148 1097 1013 1026 1027 1024 1014 1030
Dockyard Rd 1262 1149 1154 1205 1133 958 952 951 950 955
Woodford Cottages - Europa Rd 992 1783 490 321 443 168 230 209 226 201
Table 16: Modelled nitrogen dioxide concentrations at monitoring sites, g m-3
: baseline
Run no Complex terrain 5c Buildings 10c
Annual mean 99.8 th percentile hourly Annual mean 99.8 th percentile hourly
Rosia rd - GIB1 30 163 29 129
Jumper's - Rosia rd 29 198 51 174
Red Sands Rd 32 180 53 187
South Barracks Rd 25 163 26 112
Picton House - Rosia Prom 32 167 37 153
Upper Withams Entrance 27 270 33 136
Withams Rd 27 199 38 159
Almeda Gardens - Theatre 33 620 47 157
Almead Gardens - Main Access 31 521 43 145
Rock Hotel - Europa Rd 29 313 40 137
Gardiner‟s Rd 31 425 34 125
Governors Meadow - Rosia Prom 34 194 49 208
Dockyard Rd 35 212 42 197
Woodford Cottages - Europa Rd 25 125 25 107
Restricted – Commercial Dispersion modelling of MOD and OESCO power station discharges AEA/ED48335/Issue 1
AEA Energy & Environment 19
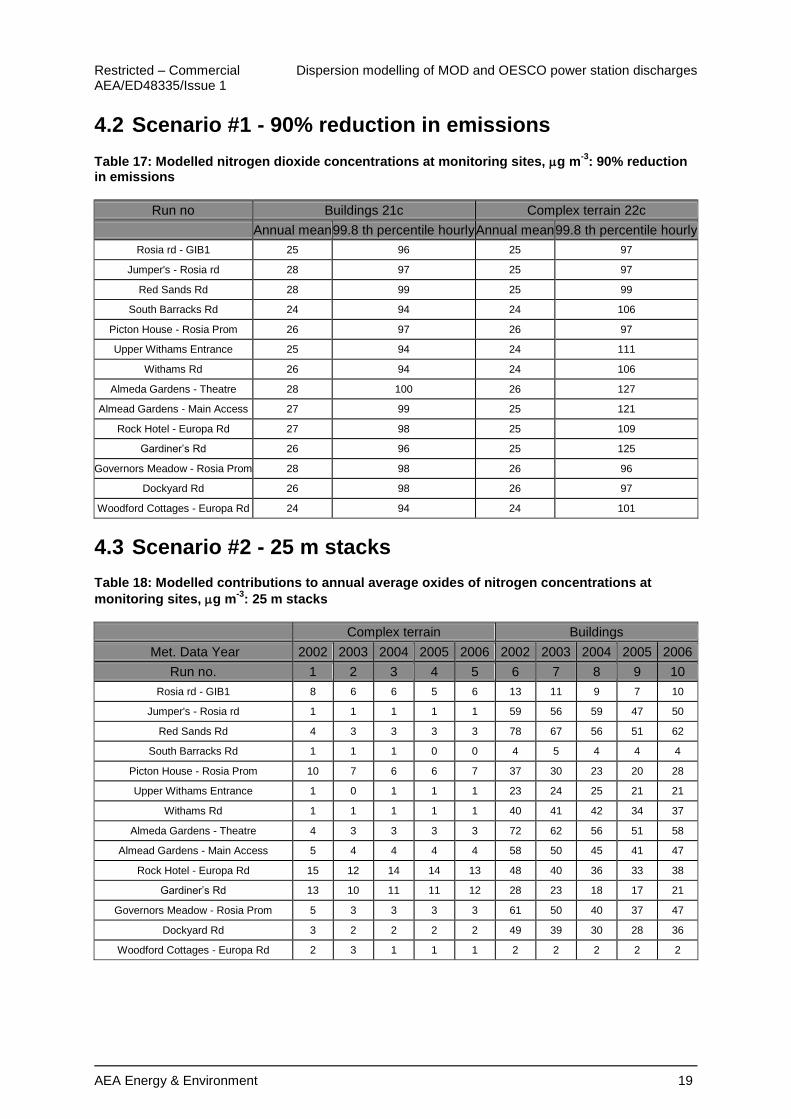
4.2 Scenario #1 - 90% reduction in emissions
Table 17: Modelled nitrogen dioxide concentrations at monitoring sites, g m-3
: 90% reduction in emissions
Run no Buildings 21c Complex terrain 22c
Annual mean 99.8 th percentile hourly Annual mean 99.8 th percentile hourly
Rosia rd - GIB1 25 96 25 97
Jumper's - Rosia rd 28 97 25 97
Red Sands Rd 28 99 25 99
South Barracks Rd 24 94 24 106
Picton House - Rosia Prom 26 97 26 97
Upper Withams Entrance 25 94 24 111
Withams Rd 26 94 24 106
Almeda Gardens - Theatre 28 100 26 127
Almead Gardens - Main Access 27 99 25 121
Rock Hotel - Europa Rd 27 98 25 109
Gardiner‟s Rd 26 96 25 125
Governors Meadow - Rosia Prom 28 98 26 96
Dockyard Rd 26 98 26 97
Woodford Cottages - Europa Rd 24 94 24 101
4.3 Scenario #2 - 25 m stacks
Table 18: Modelled contributions to annual average oxides of nitrogen concentrations at
monitoring sites, g m-3
: 25 m stacks
Complex terrain Buildings
Met. Data Year 2002 2003 2004 2005 2006 2002 2003 2004 2005 2006
Run no. 1 2 3 4 5 6 7 8 9 10
Rosia rd - GIB1 8 6 6 5 6 13 11 9 7 10
Jumper's - Rosia rd 1 1 1 1 1 59 56 59 47 50
Red Sands Rd 4 3 3 3 3 78 67 56 51 62
South Barracks Rd 1 1 1 0 0 4 5 4 4 4
Picton House - Rosia Prom 10 7 6 6 7 37 30 23 20 28
Upper Withams Entrance 1 0 1 1 1 23 24 25 21 21
Withams Rd 1 1 1 1 1 40 41 42 34 37
Almeda Gardens - Theatre 4 3 3 3 3 72 62 56 51 58
Almead Gardens - Main Access 5 4 4 4 4 58 50 45 41 47
Rock Hotel - Europa Rd 15 12 14 14 13 48 40 36 33 38
Gardiner‟s Rd 13 10 11 11 12 28 23 18 17 21
Governors Meadow - Rosia Prom 5 3 3 3 3 61 50 40 37 47
Dockyard Rd 3 2 2 2 2 49 39 30 28 36
Woodford Cottages - Europa Rd 2 3 1 1 1 2 2 2 2 2
Dispersion modelling of MOD and OESCO power station discharges Restricted – Commercial AEA/ED48335/Issue 1
20 AEA Energy & Environment
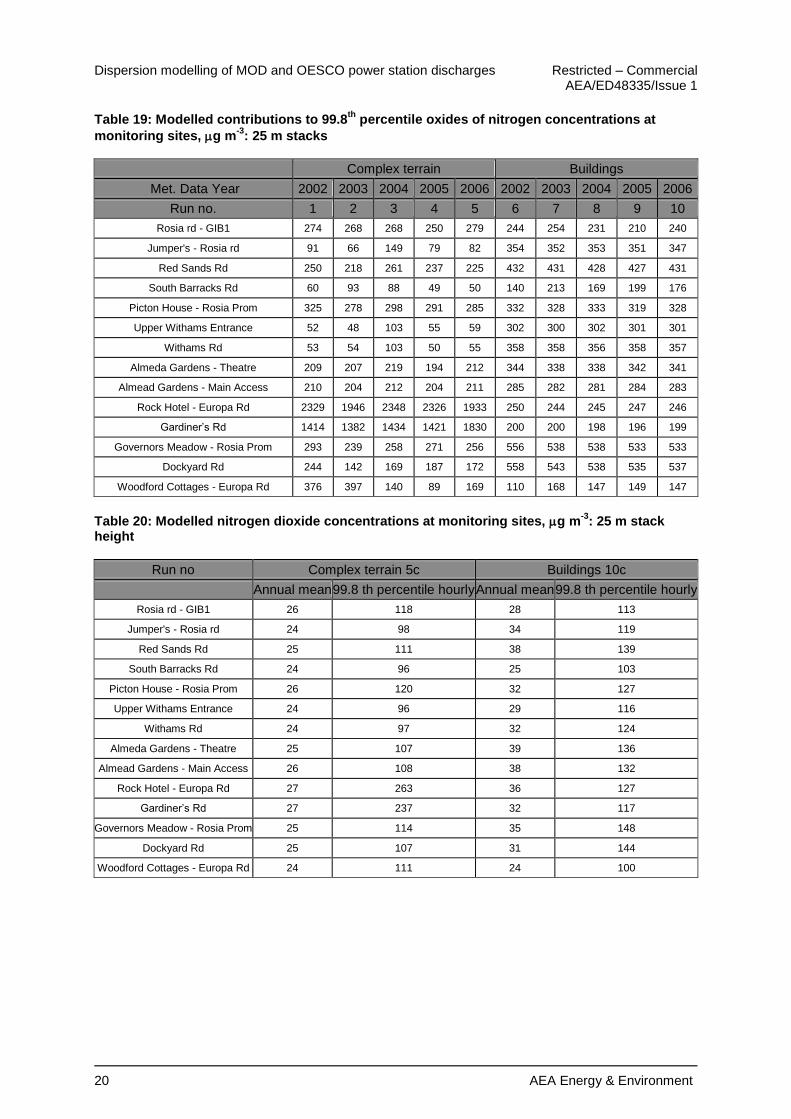
Table 19: Modelled contributions to 99.8
th percentile oxides of nitrogen concentrations at
monitoring sites, g m-3
: 25 m stacks
Complex terrain Buildings
Met. Data Year 2002 2003 2004 2005 2006 2002 2003 2004 2005 2006
Run no. 1 2 3 4 5 6 7 8 9 10
Rosia rd - GIB1 274 268 268 250 279 244 254 231 210 240
Jumper's - Rosia rd 91 66 149 79 82 354 352 353 351 347
Red Sands Rd 250 218 261 237 225 432 431 428 427 431
South Barracks Rd 60 93 88 49 50 140 213 169 199 176
Picton House - Rosia Prom 325 278 298 291 285 332 328 333 319 328
Upper Withams Entrance 52 48 103 55 59 302 300 302 301 301
Withams Rd 53 54 103 50 55 358 358 356 358 357
Almeda Gardens - Theatre 209 207 219 194 212 344 338 338 342 341
Almead Gardens - Main Access 210 204 212 204 211 285 282 281 284 283
Rock Hotel - Europa Rd 2329 1946 2348 2326 1933 250 244 245 247 246
Gardiner‟s Rd 1414 1382 1434 1421 1830 200 200 198 196 199
Governors Meadow - Rosia Prom 293 239 258 271 256 556 538 538 533 533
Dockyard Rd 244 142 169 187 172 558 543 538 535 537
Woodford Cottages - Europa Rd 376 397 140 89 169 110 168 147 149 147
Table 20: Modelled nitrogen dioxide concentrations at monitoring sites, g m-3
: 25 m stack height
Run no Complex terrain 5c Buildings 10c
Annual mean 99.8 th percentile hourly Annual mean 99.8 th percentile hourly
Rosia rd - GIB1 26 118 28 113
Jumper's - Rosia rd 24 98 34 119
Red Sands Rd 25 111 38 139
South Barracks Rd 24 96 25 103
Picton House - Rosia Prom 26 120 32 127
Upper Withams Entrance 24 96 29 116
Withams Rd 24 97 32 124
Almeda Gardens - Theatre 25 107 39 136
Almead Gardens - Main Access 26 108 38 132
Rock Hotel - Europa Rd 27 263 36 127
Gardiner‟s Rd 27 237 32 117
Governors Meadow - Rosia Prom 25 114 35 148
Dockyard Rd 25 107 31 144
Woodford Cottages - Europa Rd 24 111 24 100

Restricted – Commercial Dispersion modelling of MOD and OESCO power station discharges AEA/ED48335/Issue 1
AEA Energy & Environment 21
4.4 Traffic
Table 20: DMRB predictions of kerbside nitrogen dioxide concentrations
Case Effective annual
average daily traffic flow
Effective speed, kph
Nitrogen dioxide
concentration, g m-3 3
No hills, no street canyon effects
10000 20 27.6
No hills, with street canyon effects
10000 20 31.1
With hills, no street canyon effects
50000 100 32.3
With hills, with street canyon effects
50000 100 40.5
3 Note this is the predicted nitrogen dioxide concentration as a result of road traffic 5m from the
centreline of the road. This includes a background contribution of 24 g m-3
NO2 (the Bleak House
2006 annual average concentration).
Dispersion modelling of MOD and OESCO power station discharges Restricted – Commercial AEA/ED48335/Issue 1
22 AEA Energy & Environment
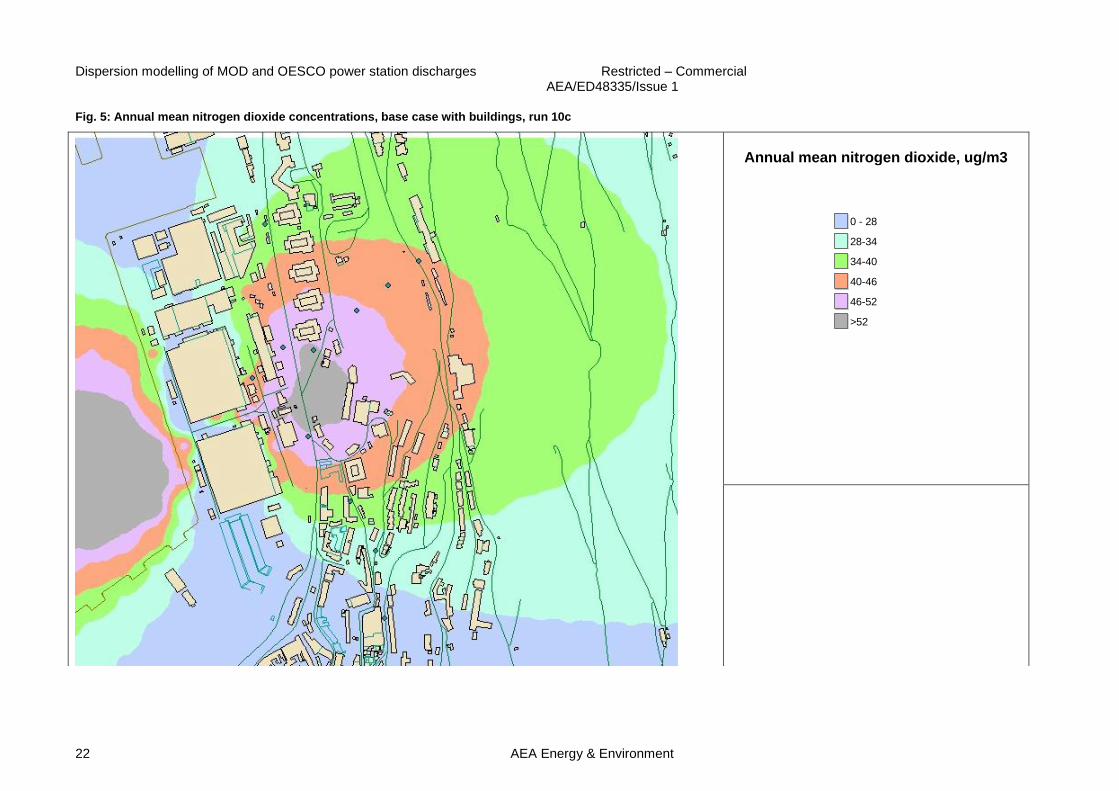
Fig. 5: Annual mean nitrogen dioxide concentrations, base case with buildings, run 10c
Annual mean nitrogen dioxide, ug/m3
idw_run10c1
<VALUE>
0 - 28
28-34
34-40
40-46
46-52
>52
Restricted – Commercial Dispersion modelling of MOD and OESCO power station discharges AEA/ED48335/Issue 1
AEA Energy & Environment 23
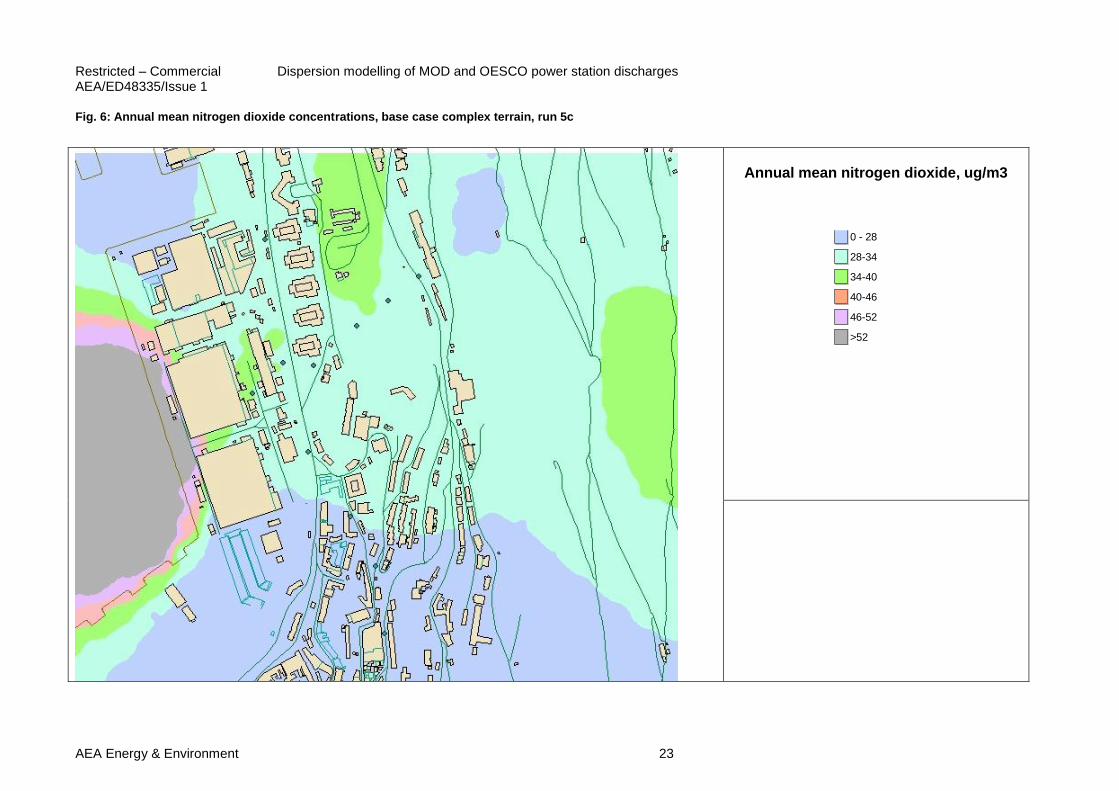
Fig. 6: Annual mean nitrogen dioxide concentrations, base case complex terrain, run 5c
Annual mean nitrogen dioxide, ug/m3
idw_run10c1
<VALUE>
0 - 28
28-34
34-40
40-46
46-52
>52
Dispersion modelling of MOD and OESCO power station discharges Restricted – Commercial AEA/ED48335/Issue 1
24 AEA Energy & Environment
Fig. 7: 99.8th
percentile hourly nitrogen dioxide concentrations, base case with buildings, run 10c
99.8th %ile nitrogen dioxide, ug/m3
<VALUE>
<100
100-125
125-150
150-175
175-200
>200
Restricted – Commercial Dispersion modelling of MOD and OESCO power station discharges AEA/ED48335/Issue 1
AEA Energy & Environment 25
Fig. 8: 99.8th
percentile hourly nitrogen dioxide concentrations, base case with complex terrain, run 5c
99.8th %ile nitrogen dioxide, ug/m3
<VALUE>
<100
100-125
125-150
150-175
175-200
>200
Dispersion modelling of MOD and OESCO power station discharges Restricted – Commercial AEA/ED48335/Issue 1
26 AEA Energy & Environment
Fig. 9: Annual mean nitrogen dioxide concentrations, 90 % reduction in emissions with buildings, run 21c
Annual mean nitrogen dioxide, ug/m3
idw_run10c1
<VALUE>
0 - 28
28-34
34-40
40-46
46-52
>52
Restricted – Commercial Dispersion modelling of MOD and OESCO power station discharges AEA/ED48335/Issue 1
AEA Energy & Environment 27
Fig. 10: Annual mean nitrogen dioxide concentrations, 90 % reduction in emissions with complex terrain, run 22c
Annual mean nitrogen dioxide, ug/m3
idw_run10c1
<VALUE>
0 - 28
28-34
34-40
40-46
46-52
>52
Dispersion modelling of MOD and OESCO power station discharges Restricted – Commercial AEA/ED48335/Issue 1
28 AEA Energy & Environment
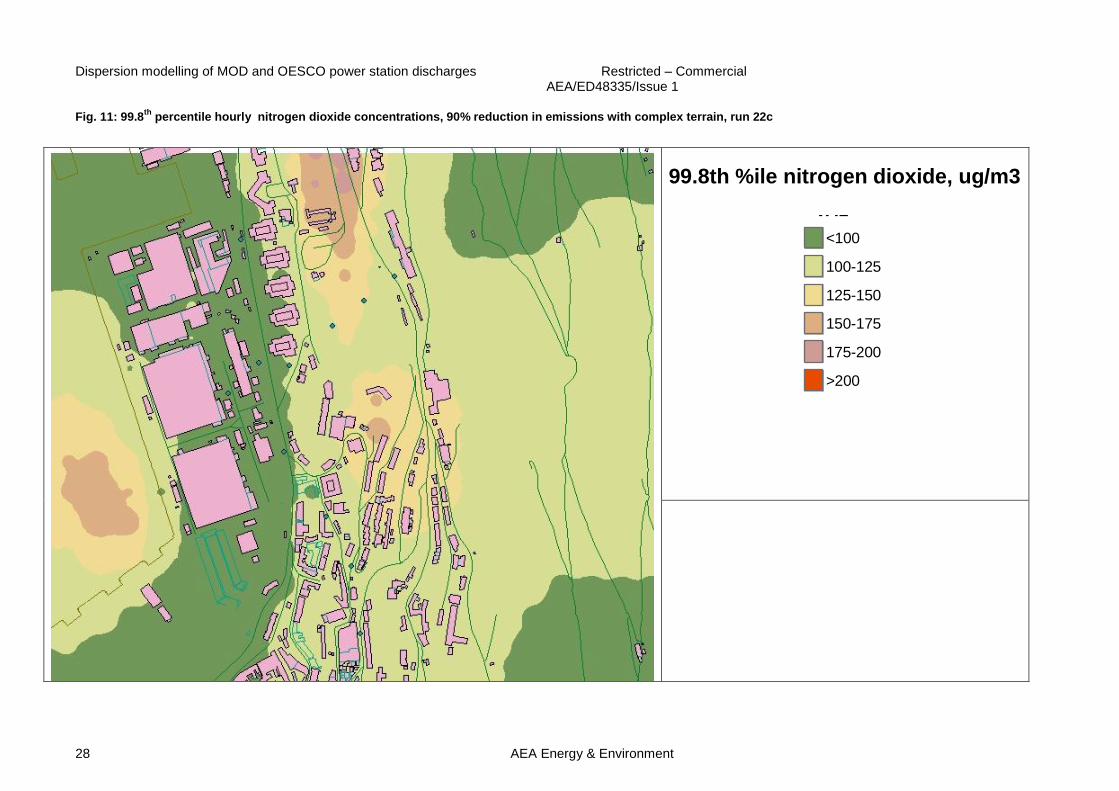
Fig. 11: 99.8th
percentile hourly nitrogen dioxide concentrations, 90% reduction in emissions with complex terrain, run 22c
99.8th %ile nitrogen dioxide, ug/m3
<VALUE>
<100
100-125
125-150
150-175
175-200
>200
Restricted – Commercial Dispersion modelling of MOD and OESCO power station discharges AEA/ED48335/Issue 1
AEA Energy & Environment 29
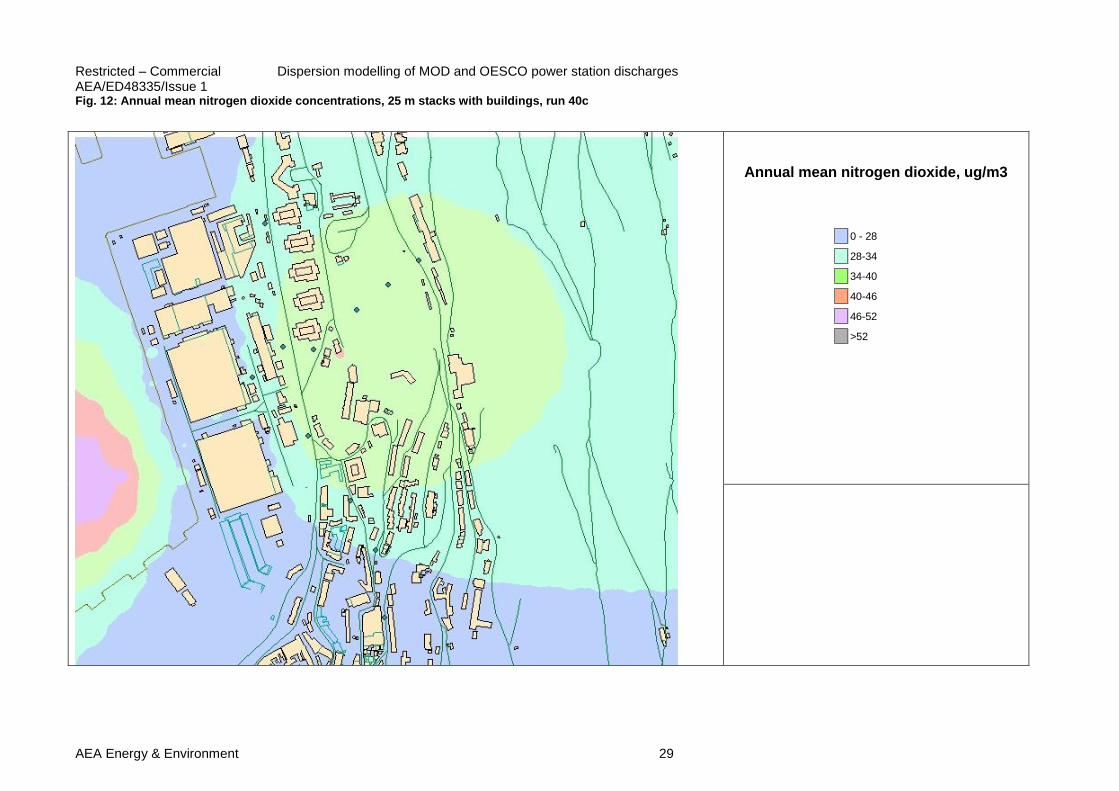
Fig. 12: Annual mean nitrogen dioxide concentrations, 25 m stacks with buildings, run 40c
Annual mean nitrogen dioxide, ug/m3
idw_run10c1
<VALUE>
0 - 28
28-34
34-40
40-46
46-52
>52
Dispersion modelling of MOD and OESCO power station discharges Restricted – Commercial AEA/ED48335/Issue 1
30 AEA Energy & Environment
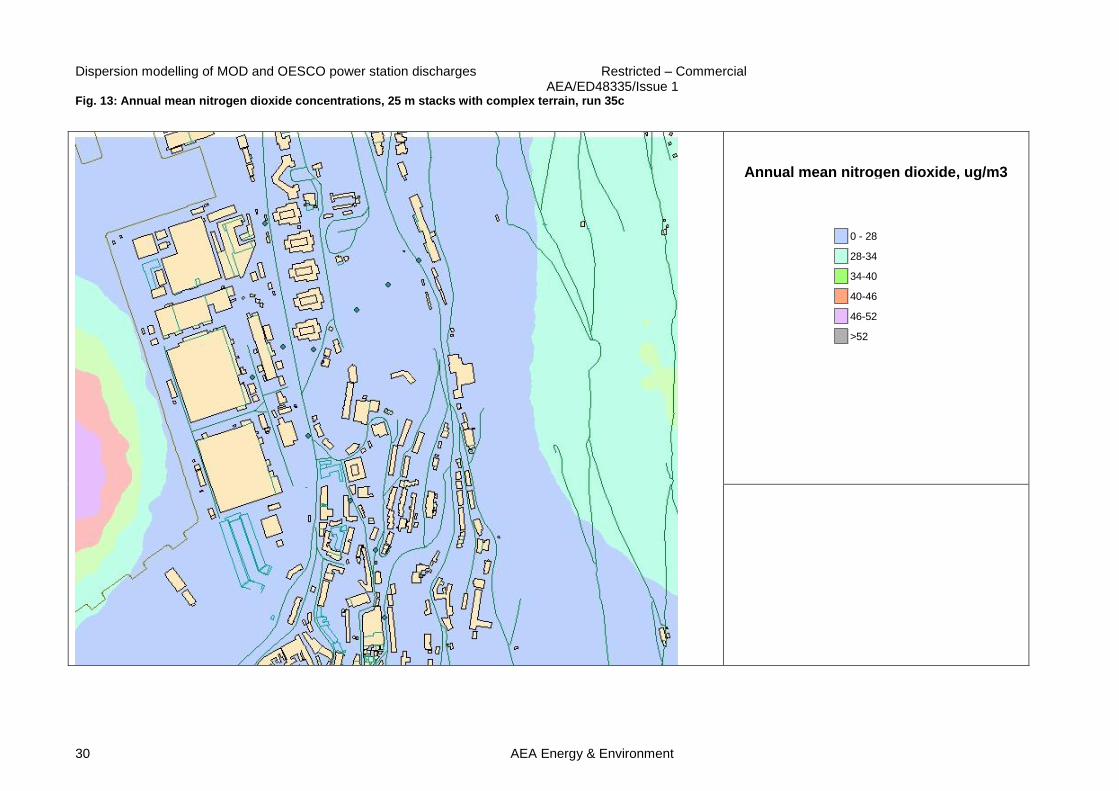
Fig. 13: Annual mean nitrogen dioxide concentrations, 25 m stacks with complex terrain, run 35c
Annual mean nitrogen dioxide, ug/m3
idw_run10c1
<VALUE>
0 - 28
28-34
34-40
40-46
46-52
>52
Restricted – Commercial Dispersion modelling of MOD and OESCO power station discharges AEA/ED48335/Issue 1
AEA Energy & Environment 31
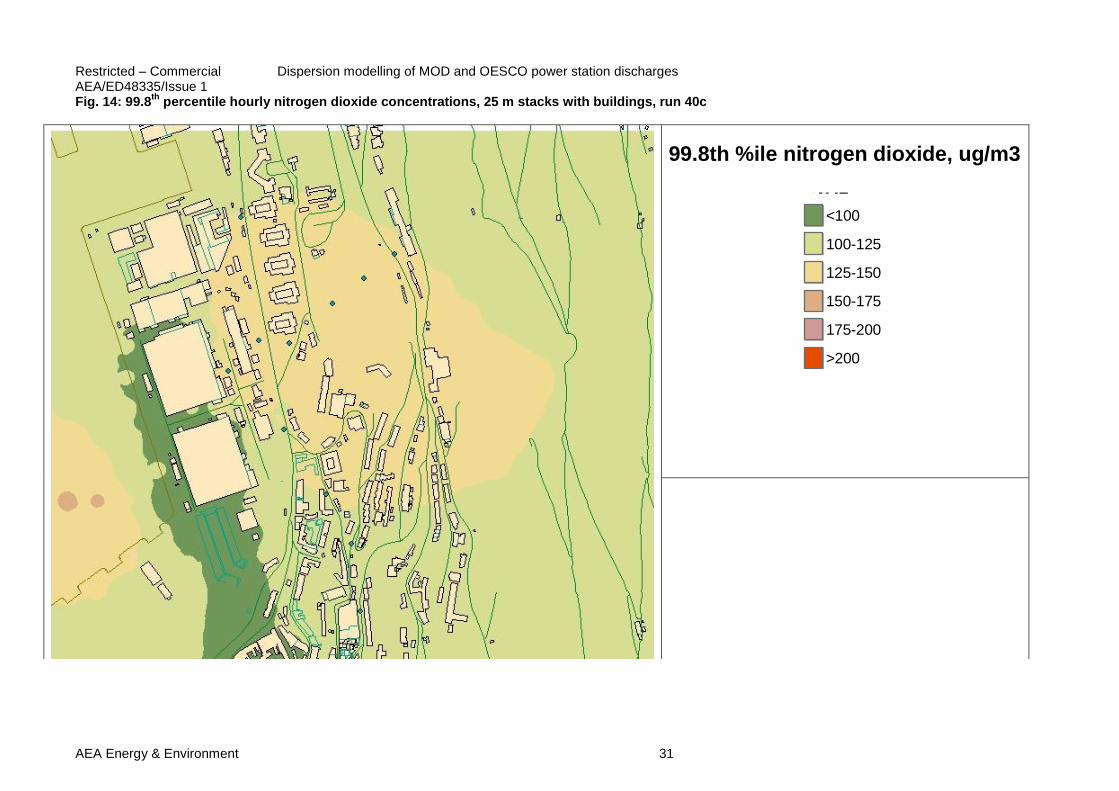
Fig. 14: 99.8th
percentile hourly nitrogen dioxide concentrations, 25 m stacks with buildings, run 40c
99.8th %ile nitrogen dioxide, ug/m3
<VALUE>
<100
100-125
125-150
150-175
175-200
>200
Dispersion modelling of MOD and OESCO power station discharges Restricted – Commercial AEA/ED48335/Issue 1
32 AEA Energy & Environment
Fig. 15: 99.8th
percentile hourly nitrogen dioxide concentrations, 25 m stacks with complex terrain, run 35c
99.8th %ile nitrogen dioxide, ug/m3
<VALUE>
<100
100-125
125-150
150-175
175-200
>200
Restricted – Commercial Dispersion modelling of MOD and OESCO power station discharges AEA/ED48335/Issue 1
AEA Energy & Environment 33
5 Discussion
5.1 Baseline Modelling
Fig. 5 shows the predicted annual average nitrogen dioxide concentration in the vicinity of the power generation facilities, taking the effect of the buildings but ignoring the effects of Gibraltar‟s complex terrain. The predicted concentrations are likely to represent the power generation impact in a „optimum location for the plant‟ (i.e. on flat terrain). High ground level concentrations, in excess of the limit value are predicted close to the plant in the area of Jumpers. The modelled concentration at the Jumpers
diffusion tube site of 51 g m-3
is less than the observed concentration of 57 g m-3
, which is at a roadside site potentially influenced by road vehicles not taken into account in the model. The modelled
concentrations at South Barracks Road and Rosia Road (26 g m-3
and 29 g m-3
), which are further
from the power generation facilities, are much lower than the measured concentrations (51 g m-3
and
42 g m-3
). It is likely that the nitrogen dioxide concentrations at these sites are dominated by road vehicle emissions. Fig. 6 shows the annual average nitrogen dioxide concentrations predicted by the ADMS model taking the complex terrain into account, but ignoring the buildings. The predicted concentrations in the
Jumpers area are well below the limit value of 40 g m-3
and much lower than the measured concentration at the location This underprediction is a limitation of the ADMS model. Under a wide range of meteorological conditions, a zone of recirculating air flow is predicted in the Jumpers area. The ADMS model does not allow pollutant emitted outside the recirculating zone to enter the zone, but rather directs the modelled air flow above the recirculating zone. Thus for these conditions low ground level concentrations are predicted. The nature of Gibraltar‟s complex terrain means that recirculating flow occurs for a significant number of hours every year, resulting in underprediction of actual concentrations. This is an artefact of the model, rather than a true representation of the reality. Fig. 7 shows the predicted 99.8
th percentile of hourly nitrogen dioxide concentrations taking the effect
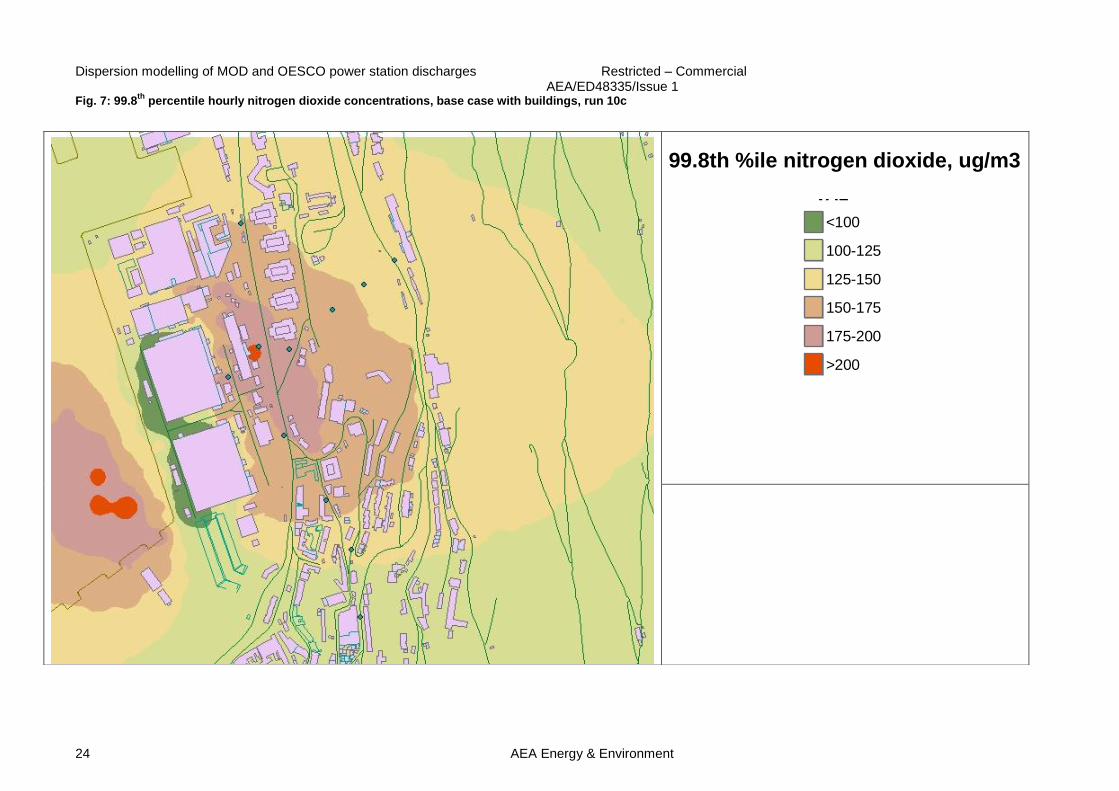
of the buildings but ignoring the effects of Gibraltar‟s complex terrain. The predicted concentrations
are less than the hourly limit value of 200 g m-3
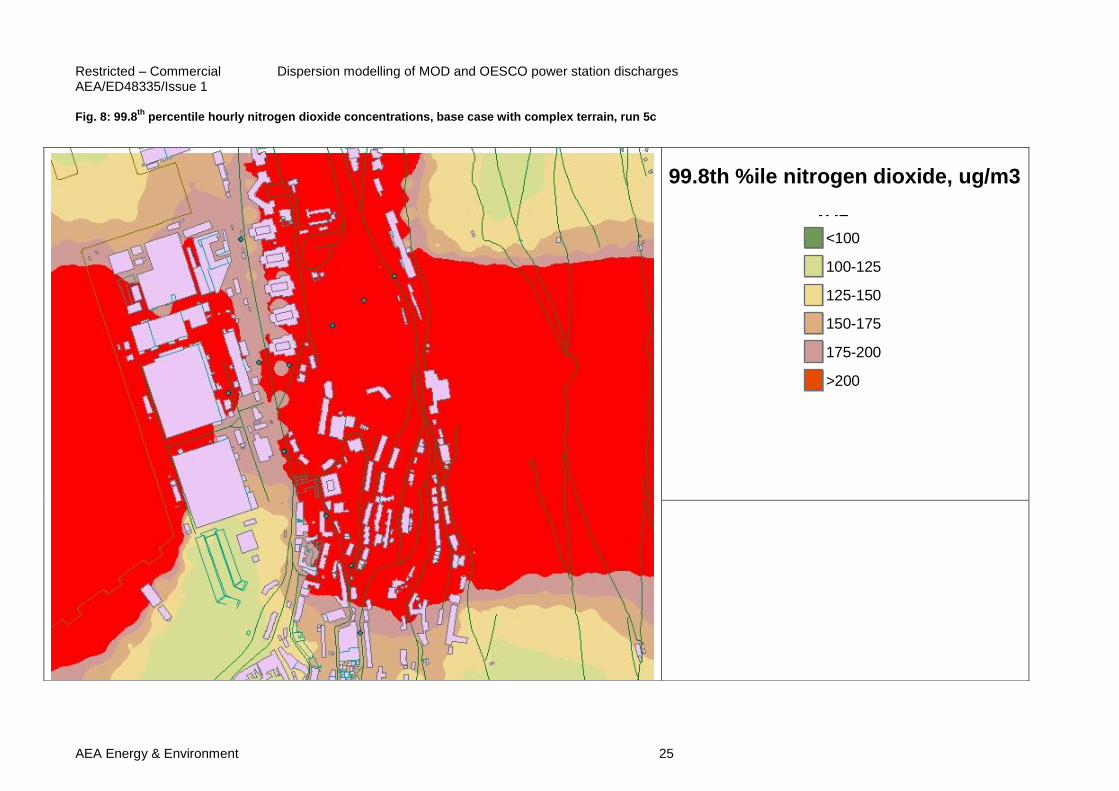
except in small areas within the dockyard or in the dock itself. Fig. 8 shows the predicted 99.8
th percentile of hourly nitrogen dioxide concentrations taking the
complex terrain into account, but ignoring the buildings. The model predicts occasional plume grounding events leading to exceedence of the limit value over a wide area. The model predicts a 99.8
th percentile concentration of 163 g m-3
at the Rosia Road site which is greater than the observed
value of 123 g m-3
, but not excessively so. The high hourly concentrations arise from occasional plume grounding, the result of meteorological conditions that prevent the plume rising over the rock. The model‟s treatment of recirculating flows leads to an effective increase in the plume height thus it is likely that the grounding events predicted are higher up the rock than actually occurs in practice. It was not appropriate to include traffic emissions in the ADMS model because the roads and receptors are located in a zone of recirculating air flow for a significant number of hours each year. Simple modelling of the traffic emissions using the DMRB model indicates that, in the absence of the complex terrain, steep hills and street canyon effects, the expected traffic flows of around 10,000 vehicles per day (which may well be a significant over estimate for this road) would not result in roadside concentrations much above background levels. The sensitivity studies suggest that roadside concentrations could approach those observed at Rosia Road and South Barracks Road if the effects of increased emissions from vehicles climbing up hill and the effects of street canyons are taken into account. However, it is not possible to draw firm conclusions from the modelling of traffic emissions. Model runs were carried out with 5 years of meteorological data. Examination of Tables 14, 15, 18 and 19 indicate that while there are significant year-to-year variations in predicted concentrations at receptors, the overall pattern of predicted concentrations remains broadly the same. The variation between years is generally less than the variation between receptors.
Dispersion modelling of MOD and OESCO power station discharges Restricted – Commercial AEA/ED48335/Issue 1
34 AEA Energy & Environment
5.2 Scenario Modelling
5.2.1 Scenario #1 – 90% Reduction in Emissions
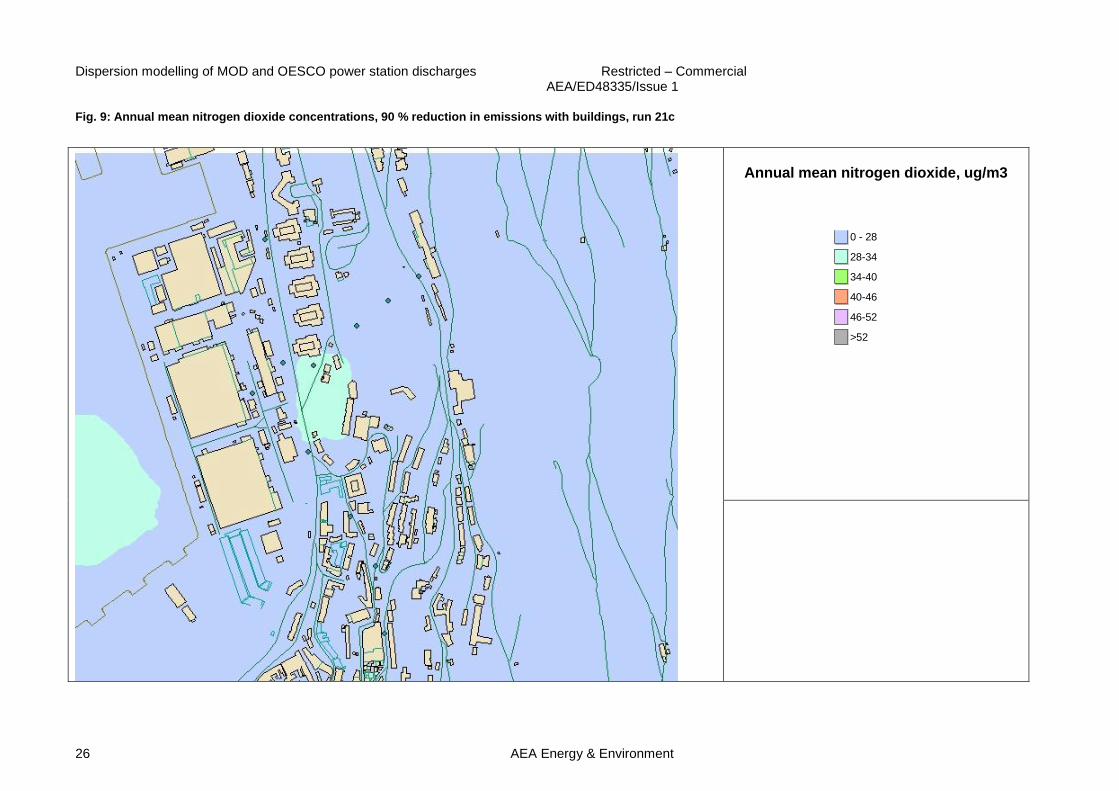
90 % reduction in emissions from the power generation plant, potentially achievable by employing new engines following best available technology would be sufficient to reduce predicted concentrations to below nitrogen dioxide limit values. Predicted annual mean concentrations, shown in Fig. 9 for flat terrain with buildings are less than the
annual mean limit value of 40 g m-3
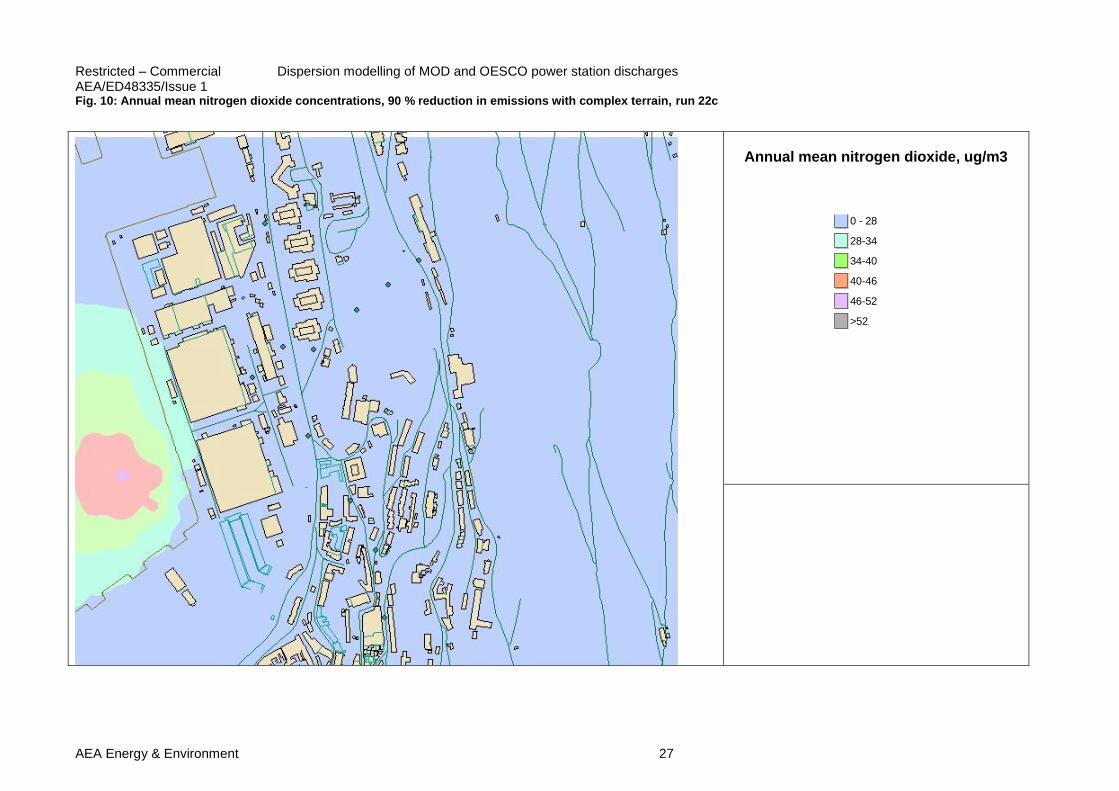
. Similarly, Fig. 10 for the case with complex terrain shows that
the limit value is met at all relevant locations, although the predicted concentration exceeds 40 g m-3
in the dock itself. Fig. 11 shows that the predicted 99.8
th percentile of hourly concentrations for complex terrain is less
than the limit value of 200 g m-3
at all receptor locations although the limit value is approached where the hill rises steeply between Europa Road and Gardiners Road. The predicted 99.8
th percentile of
hourly concentrations for the flat terrain with buildings case was less than 100 g m-3
at all locations.
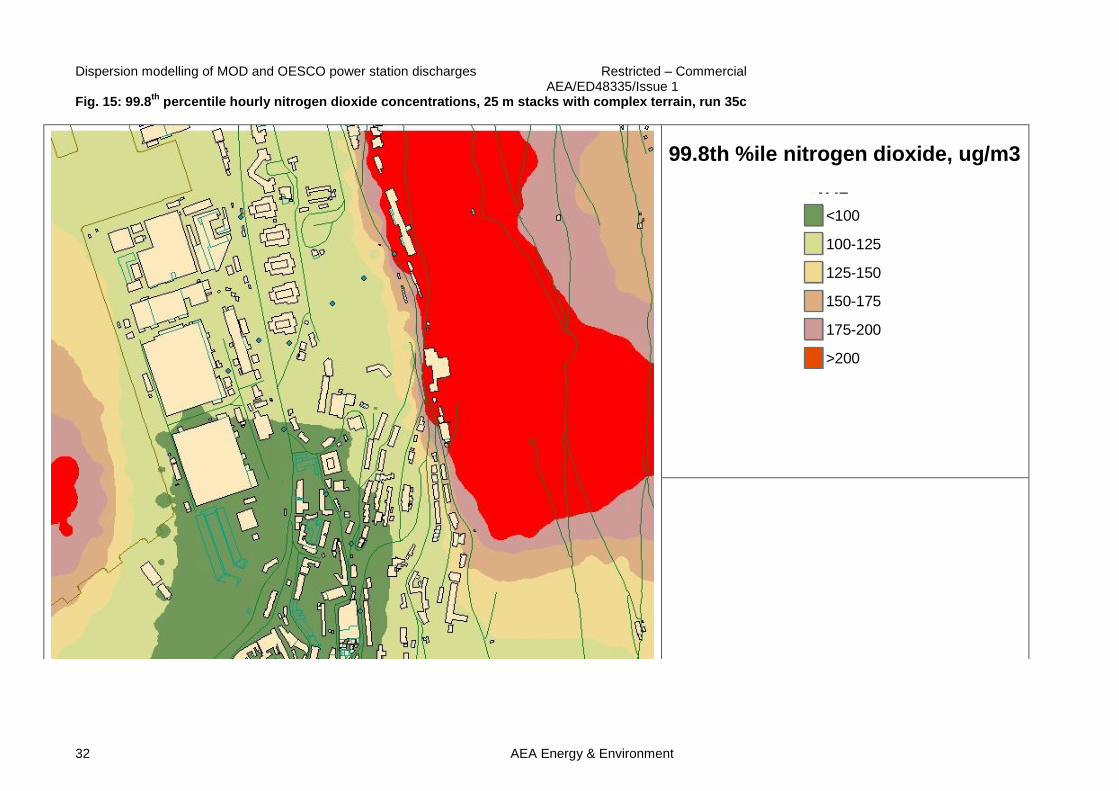
5.2.2 Scenario #2 – 25m stacks to aid pollutant dispersion
The addition of 25m stacks to aid pollutant dispersion from the power generation plant would largely be sufficient to reduce predicted concentrations to below nitrogen dioxide annual limit values BUT there may remain a risk of breaching the hourly limit value. For flat terrain, increasing the stack heights to 25 m would be almost sufficient to reduce predicted concentrations to below nitrogen dioxide limit values. Fig. 12 and 13 shows that the predicted annual
mean concentration is less than 40 g m-3
at all locations except within the dock and a small area below Almeda Gardens (Fig 12: flat terrain with buildings). Fig. 14 shows that the predicted 99.8
th percentile of hourly mean concentrations, for flat terrain with
buildings, are also less than the limit value of 200 g m-3
. Fig. 15, for the complex terrain case, shows that there is a substantial risk of plume grounding on the hillside, sufficient for concentrations to exceed the hourly limit value, despite the increased stack heights.
Restricted – Commercial Dispersion modelling of MOD and OESCO power station discharges AEA/ED48335/Issue 1
AEA Energy & Environment 35
6 Conclusions
The nitrogen dioxide monitoring programme for 2005 and 2006 has highlighted a significant area of
Gibraltar that is exposed to annual average concentrations that are above the EU limit value of 40 g m
-3. Measurements suggest that several areas are exposed to concentrations in excess of the limit
value + margin of tolerance (a trigger for action prior to 2010). In order to inform our understanding of the elevated measured concentrations, a modelling study has been undertaken to investigate the MOD and OESCO Ltd power generation facilities contribution to the measured concentrations. The complex terrain in the region of the OESCO Ltd and MOD power stations on Gibraltar presents a serious challenge for dispersion modelling. The slopes of the rock are steeper than the usual range of application of the ADMS3.3 dispersion model. The flow model predicts that a zone of recirculating air flow develops in the area of Rosia Road and this limits the dispersion model‟s capability to predict concentrations in the area during these conditions. Model runs were therefore carried out with and without the effects of complex terrain. The model predicted that, even in the absence of complex terrain effects, the power station emissions
result in concentrations of nitrogen dioxide greater than the annual average limit value of 40 g m-3
in the Jumper‟s area. Model runs that took complex terrain effects into account indicated that plume
grounding would lead to hourly average concentrations greater than the limit value of 200 g m-3
on the slopes of the rock. The diesel generators used in the power stations are relatively old. Modern diesel engines that follow best available techniques emit approximately one tenth of the oxides of nitrogen emissions. The model results indicate that a 90% reduction in oxides of nitrogen emissions would be just sufficient to meet the annual average limit value and also to meet the hourly limit value. Dispersion of pollutants from the power stations could be improved by increasing the height of the discharge stacks. The model results show that increasing the stack height to 25 m would be sufficient to meet the annual mean and hourly mean limit values in the absence of complex terrain effects. However, the model runs with complex terrain indicate that plume grounding may continue to lead to
hourly average concentrations greater than the limit value of 200 g m-3
on the slopes of the rock. Consideration should be given to the installation of a single continuous monitor to better elucidate the actual impact of plume grounding on short term nitrogen dioxide concentrations in the area affected by the power generation facility emissions. The current diffusion tube network cannot provide information on short term concentrations. Road traffic emissions from Rosia Road also contribute to pollutant concentrations. Simple model results indicate that in the absence of complex terrain effects and the increased emissions from vehicles travelling up hill these emissions would not increase roadside concentrations much above background levels. The sensitivity studies suggest that roadside concentrations could approach those observed at Rosia Road and South Barracks Road if the effects of increased emissions from vehicles climbing up hill and the effects of street canyons are taken into account.