Embed Size (px)
Citation preview

Fisheries Management and Ecology1998,5, 177–188
Dispersion of stocked brown trout, Salmo trutta
L., and landlocked salmon, Salmo salar L., from
stocking sites in Lake Oulujarvi, Finland
T. V E H A N E N & P. H Y VA R I N E N
Finnish Game and Fisheries Research Institute, Kainuu Fisheries Research and Aquaculture, Manamansalontie,Paltamo, Finland
J . A S P I
University of Oulu, Oulanka Biological Station, Kuusamo, Finland
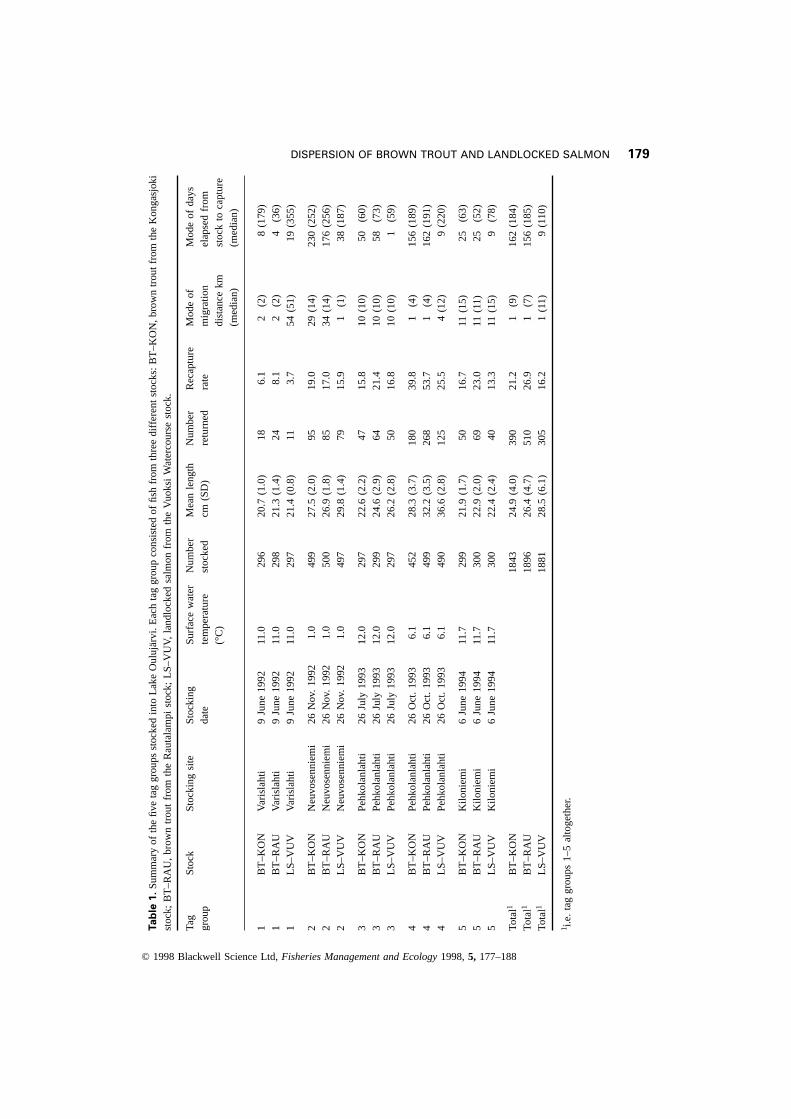
Abstract Movement and recaptures of two hatchery-reared brown trout,Salmo truttaL.,stocks and landlocked salmon,Salmo salarL., released at different sites in regulated LakeOulujarvi, were studied in relation to release site. Five groups of fish from each stock werereleased in approximately equal numbers. Most of the fish released in June and July wererecaptured within 3 months, whereas the majority of the fish released in early winter (Octoberand November) were caught the following spring, about 7–9 months after stocking. The releasesite had a significant effect on recapture rate. The results showed that fishing restrictionstargeted mainly at gill net fishing are needed to preserve the stocked fish from overfishing.Significantly fewer recaptures were observed from the landlocked salmon stocking comparedwith brown trout. The recaptures from the landlocked salmon stocking indicated more activemovement and less clumping compared with the two brown trout stocks.
K E Y W O R D S : brown trout, dispersal, fish stocking, Lake Ouluja¨rvi, landlocked salmon,migration pattern.
Introduction
As a result of the loss of nursery areas and overfishing, the catches of salmonids have declinedin inland waters in many countries. In Finland, the naturally reproducing brown trout,Salmotrutta L., and landlocked salmon,Salmo salarL., are considered endangered and stocks aremaintained through artificial propagation.
Migration patterns and home ranges have been studied in different fish species (Aneer &Westin 1990; Parker 1992; Dorazio, Hattala, McCollough & Skjevland 1994; Gatz & Adams1994; Minns 1995) and in different populations of hatchery-reared salmon and brown trout,Salmo truttaL., in the sea (Kallio-Nyberg & Ikonen 1992; Jonsson, Jonsson, Aass & Hansen1995). However, little is known about the differences in the movements of lake-stocked browntrout and landlocked salmon.
Correspondence: Dr Teppo Vehanen, Finnish Game and Fisheries Research Institute, Kainuu Fisheries Research andAquaculture, Manamansalontie 90, FIN–88300 Paltamo, Finland (e-mail: [email protected]).
© 1998 Blackwell Science Ltd 177

178 T. VEHANEN ET AL.
Naturally reproducing stocks have vanished from many lakes owing to a reduction of nurseryareas, and rehabilitation of these areas has started in many rivers throughout the world.However, to ensure natural reproduction, the stocked fish need to be protected from potentialoverfishing in lakes during their feeding migrations. This is why knowledge about the effectsof fishing on stocked smolts is important. Also, possible differences between the dispersionpatterns of the fish stocks used for stocking need to be studied to identify the population mostsuitable for stocking.
Tag-recapture data were used to follow the dispersion and the effect of fishing on two stocksof brown trout and landlocked salmon after release. The aim of this study was to reveal thepossible differences in the movement patterns of the two species and between the two browntrout stocks. The results are needed to formulate guidelines for future fisheries management.
Materials and methods
The brown trout populations in this study originated from the Vuoksi Watercourse in southernFinland (the Rautalampi stock), and from the River Kongasjoki (the Kongasjoki stock), atributary flowing into Lake Ouluja¨rvi in northern Finland. There are electrophoreticallydetectable allozymal differences between the two brown trout stocks (Hyva¨rinen, Virtanen,Vehanen, Koskiniemi, Kannel & Pursiainen 1996). The landlocked salmon originated from theVuoksi Watercourse in southern Finland. The fish were reared under similar conditions atKainuu Fisheries and Aquaculture.
Fish from all three populations were released at four different sites in Lake Ouluja¨rvi(27°109N, 64°209E) between 1992 and 1994 (Table 1). In all, five different tagging groupswere studied as one site was used to compare spring versus autumn stocking. The fish wereindividually Carlin tagged at least 3 weeks before release. The area of the lake is 928 km2
with mean depth of 7.6 m and maximum depth of 36 m. The lake has been regulated since1951 for hydropower purposes and the average annual change in water level is 1.9 m.
Despite similar rearing conditions, the body length of the released fish differed significantlybetween groups (ANOVA, P , 0.05). The size difference may have had some effect on thedistribution of the recaptures, owing to the size selectivity of the fishing gears. Differences inmean length between the smallest and the largest fish within each population varied between0.7 and 3.6 cm, with the exception of 8.3 cm in group 4. However, it was assumed that theeffect of the size differences between the tag groups was minimal on the distribution of therecaptures.
The migratory distance was calculated as the shortest distance between the release and therecapture site and the recapture time as the number of days from the release to recapture. Therecapture site for 1054 recaptures out of a total number of 1205 (338 out of the Kongasjokistock, 460 out of the Rautalammi stock and 256 out of the landlocked salmon) was specifiedaccurately, allowing the migration distance to be calculated. Tag groups 2 and 4 were releasedin October and November when temperatures were low and decreasing, whereas the otherthree groups were released in June and July (Table 1). The release site in Varislahti Bay (taggroup 1, Varislahti summer, Fig. 1) and in Pehkolanlahti Bay, in particular (tag groups 3and 4, Pehkolanlahti summer and Pehkolanlahti winter) are shallow areas, whereas CapeNeuvosenniemi and Cape Kiloniemi (tag groups 2 and 5, Neuvosenniemi winter and Kiloniemi
© 1998 Blackwell Science Ltd,Fisheries Management and Ecology1998,5, 177–188
179DISPERSION OF BROWN TROUT AND LANDLOCKED SALMONTa
ble
1.
Sum
mar
yof
the
five
tag
grou
psst
ocke
din
toLa
keO
uluj
a¨r
vi.
Eac
hta
ggr
oup
cons
iste
dof
fish
from
thre
edi
ffere
ntst
ocks
:B
T–K
ON
,br
own
trou
tfr
omth
eK
onga
sjok
ist
ock;
BT
–RA
U,
brow
ntr
out
from
the
Rau
tala
mpi
stoc
k;LS
–VU
V,la
ndlo
cked
salm
onfr
omth
eV
uoks
iWat
erco
urse
stoc
k.
Tag
Sto
ckS
tock
ing
site
Sto
ckin
gS
urfa
cew
ater
Num
ber
Mea
nle
ngth
Num
ber
Rec
aptu
reM
ode
ofM
ode
ofda
ysgr
oup
date
tem
pera
ture
stoc
ked
cm(S
D)
retu
rned
rate
mig
ratio
nel
apse
dfr
om(°
C)
dist
ance
kmst
ock
toca
ptur
e(m
edia
n)(m
edia
n)
1B
T–K
ON
Varis
laht
i9
June
1992
11.0
296
20.7
(1.0
)18
6.1
2(2
)8
(179
)1
BT
–RA
UVa
risla
hti
9Ju
ne19
9211
.029
821
.3(1
.4)
248.
12
(2)
4(3
6)1
LS–V
UV
Varis
laht
i9
June
1992
11.0
297
21.4
(0.8
)11
3.7
54(5
1)19
(355
)
2B
T–K
ON
Neu
vose
nnie
mi
26N
ov.
1992
1.0
499
27.5
(2.0
)95
19.0
29(1
4)23
0(2
52)
2B
T–R
AU
Neu
vose
nnie
mi
26N
ov.
1992
1.0
500
26.9
(1.8
)85
17.0
34(1
4)17
6(2
56)
2LS
–VU
VN
euvo
senn
iem
i26
Nov
.19
921.
049
729
.8(1
.4)
7915
.91
(1)
38(1
87)
3B
T–K
ON
Peh
kola
nlah
ti26
July
1993
12.0
297
22.6
(2.2
)47
15.8
10(1
0)50
(60)
3B
T–R
AU
Peh
kola
nlah
ti26
July
1993
12.0
299
24.6
(2.9
)64
21.4
10(1
0)58
(73)
3LS
–VU
VP
ehko
lanl
ahti
26Ju
ly19
9312
.029
726
.2(2
.8)
5016
.810
(10)
1(5
9)
4B
T–K
ON
Peh
kola
nlah
ti26
Oct
.19
936.
145
228
.3(3
.7)
180
39.8
1(4
)15
6(1
89)
4B
T–R
AU
Peh
kola
nlah
ti26
Oct
.19
936.
149
932
.2(3
.5)
268
53.7
1(4
)16
2(1
91)
4LS
–VU
VP
ehko
lanl
ahti
26O
ct.
1993
6.1
490
36.6
(2.8
)12
525
.54
(12)
9(2
20)
5B
T–K
ON
Kilo
niem
i6
June
1994
11.7
299
21.9
(1.7
)50
16.7
11(1
5)25
(63)
5B
T–R
AU
Kilo
niem
i6
June
1994
11.7
300
22.9
(2.0
)69
23.0
11(1
1)25
(52)
5LS
–VU
VK
iloni
emi
6Ju
ne19
9411
.730
022
.4(2
.4)
4013
.311
(15)
9(7
8)
Tota
l1B
T–K
ON
1843
24.9
(4.0
)39
021
.21
(9)
162
(184
)To
tal1
BT
–RA
U18
9626
.4(4
.7)
510
26.9
1(7
)15
6(1
85)
Tota
l1LS
–VU
V18
8128
.5(6
.1)
305
16.2
1(1
1)9
(110
)
1 i.e
.ta
ggr
oups
1–5
alto
geth
er.
© 1998 Blackwell Science Ltd,Fisheries Management and Ecology1998,5, 177–188

180 T. VEHANEN ET AL.
summer) are deeper and more open release sites. Kiloniemi is the deepest of the fourstocking sites.
The significance of release site, season (summer and winter), size and stock of fish onrecaptures was analysed using binomial logit analysis (Aitkin, Anderson, Francis & Hinde1990); the recapture of a fish was the response variable, stocking site and season (summer vs.autumn) categorial explanatory variables, and fish length was included as a continuousexplanatory variable. The GLIM statistical package (Aitkinet al. 1990) was used to fit thelogit models and to determine the parameters by using the maximun likelihood method; becausethe experimental design was not a full factorial, the analysis was restricted to main effects.
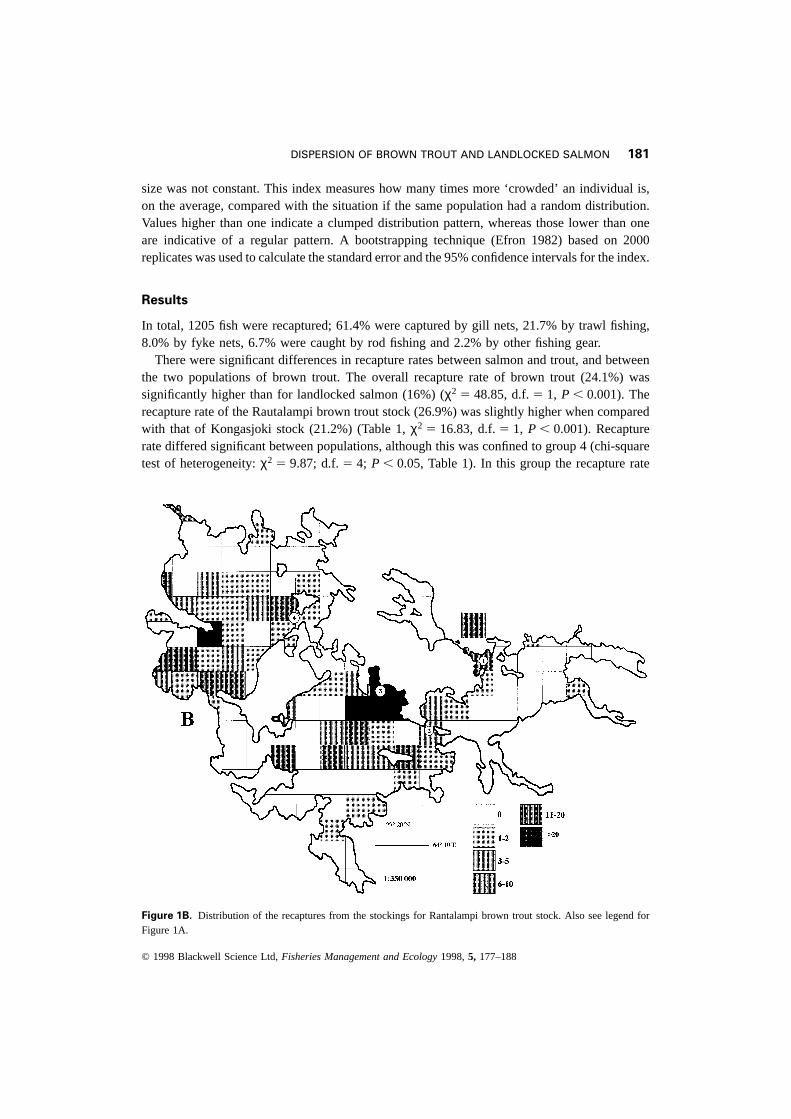
Lake Oulujarvi was divided into 141 quadrats (Figs 1A–C), and the number of recapturesinside each quadrat was calculated. Spearman rank-correlation was used as a measure ofsimilarity between the fish stocks in the distribution of recaptures. Quadrats with no recaptureswere excluded from the analysis to avoid spurious correlations. Watanabe’s (1988) modificationof Lloyd’s index (mp) of ‘patchiness’ (the ratio of the ‘mean crowding’ (m*) to the meandensity (m), Lloyd (1967)) was used to compare the distribution of recaptures from differentstocks. Watanabe’s (1988) modification (‘adjusted mean crowding’) was used because quadrat
Figure 1A. Distribution of the recaptures from the stockings for Kongasjoki brown trout stock. Lake Ouluja¨rvi isdivided into 141 quadrats and the number of the recaptured fish within each quadrat is indicated by the grey scale ofthe quadrat. Stocking sites are: 1, Varislahti Bay; 2, Cape Neuvosenniemi; 3, Pehkolanlahti Bay; 4, Cape Kiloniemi.
© 1998 Blackwell Science Ltd,Fisheries Management and Ecology1998,5, 177–188
181DISPERSION OF BROWN TROUT AND LANDLOCKED SALMON
size was not constant. This index measures how many times more ‘crowded’ an individual is,on the average, compared with the situation if the same population had a random distribution.Values higher than one indicate a clumped distribution pattern, whereas those lower than oneare indicative of a regular pattern. A bootstrapping technique (Efron 1982) based on 2000replicates was used to calculate the standard error and the 95% confidence intervals for the index.
Results
In total, 1205 fish were recaptured; 61.4% were captured by gill nets, 21.7% by trawl fishing,8.0% by fyke nets, 6.7% were caught by rod fishing and 2.2% by other fishing gear.
There were significant differences in recapture rates between salmon and trout, and betweenthe two populations of brown trout. The overall recapture rate of brown trout (24.1%) wassignificantly higher than for landlocked salmon (16%) (χ2 5 48.85, d.f.5 1, P , 0.001). Therecapture rate of the Rautalampi brown trout stock (26.9%) was slightly higher when comparedwith that of Kongasjoki stock (21.2%) (Table 1,χ2 5 16.83, d.f.5 1, P , 0.001). Recapturerate differed significant between populations, although this was confined to group 4 (chi-squaretest of heterogeneity:χ2 5 9.87; d.f.5 4; P , 0.05, Table 1). In this group the recapture rate
Figure 1B. Distribution of the recaptures from the stockings for Rantalampi brown trout stock. Also see legend forFigure 1A.
© 1998 Blackwell Science Ltd,Fisheries Management and Ecology1998,5, 177–188

182 T. VEHANEN ET AL.
of the Rautalampi stock was significantly higher than that for the Kongasjoki stock (χ2 5
18.35; d.f.5 1; P , 0.001).Significant differences in recapture rate between tag groups of brown trout (χ2 5 405.6;
d.f. 5 4; P , 0.001) and landlocked salmon (χ2 5 67.3; d.f.5 4; P , 0.001) were due todifferences in stocking site (Fig. 1). The differences occurred between Varislahti Bay andPehkolanlahti Bay, which also differed from the other stocking sites. According to binomiallogit analysis, excluding stocking site as an explanatory variable from the full model (i.e.stock, fish length, stocking site and season as explanatory variables) signficantly decreased theexplantory power (G(3) 5 55.04;P , 0.001), whereas excluding season (G(1) 5 0.41;P . 0.1)or fish length (G(1) 5 0.176;P . 0.1) did not decrease the significance of the model for browntrout. The result of the analysis was similar for the landlocked salmon. Excluding stockingsite (fish length, stocking site and season) decreased the significance of the model (G(3) 5
25.22;P , 0.001), whereas season (G(1) 5 1.29;P . 0.1) or fish length (G(1) 5 0.61;P . 0.1)had no significant effect.
No difference was found between the two brown trout stocks (Wilcoxon two-sample test,migratory distances: Z5 0.43, P . 0.05, recapture times: Z5 0.46, P . 0.05), allowing thesamples to be combined. For brown trout, the migratory distance and the number of days from
Figure 1C. Distribution of the recaptures from the stockings for landlocked salmon stock. Also see legend forFigure 1A.
© 1998 Blackwell Science Ltd,Fisheries Management and Ecology1998,5, 177–188

183DISPERSION OF BROWN TROUT AND LANDLOCKED SALMON
release to recapture differed significantly between release sites (Kruskal–Wallis test, d.f.5 3,migratory distances:χ2 5 107.09,P , 0.001, recapture times:χ2 5 190.47 P , 0.001) andlandlocked salmon (df5 3, migratory distances:χ2 5 38.20,P , 0.001, recapture times:χ2 5
14.19,P , 0.01). There was also a significant difference between brown trout and landlockedsalmon (Wilcoxon two-sample test, migration distances: Z5 3.52,P , 0.001, recapture times:Z 5 3.38,P , 0.001).
Most of the recaptures from fish released during the summer were caught within 3 monthsafter stocking (Fig. 2). Furthermore, the distance migrated by landlocked salmon before capturewas either greater than that of brown trout, or landlocked salmon were captured more rapidlythan brown trout after release (Table 1, Fig. 2). For instance, recaptures of brown trout releasedin the Varislahti and the Pehkolanlahti during the summer were caught within 10 km of thestocking site within 3 months of release. However, none of the landlocked salmon released inVarislahti during the summer were captured in the vicinity of the stocking site (, 10 km),indicating a rapid dispersion away from the stocking site (Fig. 2). The landlocked salmonreleased in the Pehkolanlahti during summer dispersed more rapidly into a wider area duringthe first 3 months after stocking than brown trout (Fig. 2). The majority of the fish from theKiloniemi summer stocking were caught during the first 3 months after release despite thedeeper and more open topography of the stocking site. However, the recapture distances,especially for brown trout, were greater compared with other summer stockings, mostly 11–30 km in both stocks.
The pattern of recaptures for the early winter stocking (Neuvosenniemi and Pehkolanlahtiwinter) was noticeably different from the summer stocking (Fig. 2). Most of the tagged fishwere captured in the following spring (7–9 months after stocking) or in the summer. Thedifferences in recapture times were significantly different between summer and winter stockingboth for brown trout (Mann–WhitneyU-test,U 5 163.32,P , 0.001) and landlocked salmon(U 5 21.26,P , 0.001), e.g. the recapture time was greater for winter stocking. Also migratorydistances differed between summer and winter stocking, both for brown trout (Mann–WhitneyU-test, U 5 49.24,P , 0.001) and landlocked salmon (U 5 9.66, P , 0.01). However, it isevident from Table 1 that stocking site and fish stock had more effect on migratory distancethan stocking season. This was partially because of the unbalanced study design such that thesame stocking site was used only for the Pehkolanlahti summer and winter stocking. However,in the Pehkolanlahti stocking, significant differences were also found in recapture times bothfor brown trout (Mann–WhitneyU-test, U 5 46.69, P , 0.001) and for landlocked salmon(U 5 22.59, P , 0.001). Migratory distances between summer and winter stocking in thePehkolanlahti Bay were significantly different for brown trout (Mann–WhitneyU-test, U 5
75.00, P , 0.001), but not for landlocked salmon (U 5 0.04, P . 0.05). The migratorydistances of the landlocked salmon from the Pehkolanlahti winter stocking were generallyhigher than those of the brown trout, indicating a more active dispersion from the stockingsite than with the brown trout (Fig. 2). The migration distances of the landlocked salmon inthe other winter tag group (Neuvosenniemi winter) were lower than those of the brown trout(Table 1). This was because a larger proportion of the recaptured landlocked salmon werecaught during the first 3 months at a distance of less than 10 km from the stocking site,whereas only a few brown trout were caught during the first 3 months after stocking.
Very few fish, one from the Kongasjoki stock, three from the Rautalammi stock and one of
© 1998 Blackwell Science Ltd,Fisheries Management and Ecology1998,5, 177–188

184 T. VEHANEN ET AL.
Figure 2. (Caption opposite)
© 1998 Blackwell Science Ltd,Fisheries Management and Ecology1998,5, 177–188

185DISPERSION OF BROWN TROUT AND LANDLOCKED SALMON
the landlocked salmon, were captured from the River Oulujoki, the river draining from LakeOulujarvi, indicating that almost an equal number of fish from each stock were migratingdownstream from Lake Ouluja¨rvi. The distribution of the recaptures between the brown troutstocks was fairly similar (r 5 0.56,N 5 75, P , 0.01). Based on the correlation analysis, thesimilarity between the landlocked salmon and the brown trout stocks was lower (landlockedsalmon vs. Rautalammi stock,r 5 0.37,N 5 72, P , 0.01; landlocked salmon vs. Kongasjokistock,r 5 0.35,N 5 77, P , 0.01), yet significant owing to the large number of observations.
The recaptures in each stock appeared to be highly aggregated (Fig. 1). The distribution ofthe recaptures was affected by uneven fishing effort in the lake and can therefore be used onlyto compare the distribution of recaptures between the three stocks. The mean density andindex of dispersion (Lloyds ‘patchiness’ index adjusted for quadrat size) were similar for bothbrown trout stocks. The mean density for the Kongasjoki stock was 2.50 individuals perquadrat and the index of dispersion 10.69 (SE5 6.49); the respective estimates for theRautalammi stock were 3.34 individuals per quadrat and 12.71 (SE5 8.82). Accordingly, therecaptures of both brown trout stocks were more than 10 times more crowded than in arandomly distributed situation. The mean density (1.84 individuals per quadrat) and the indexof dispersion (5.83; SE5 2.16) for the landlocked salmon were much lower, indicating a morerandom distribution of the recaptures than that of the brown trout. The indices of both browntrout stocks were outside the bootstrapped 95% confidence limits of the landlocked salmon(2.59–9.76), suggesting a higher aggregation rate for the brown trout recaptures.
Discussion
Rehabilitation of rivers and lakes includes fisheries management and rehabilitationmethodologies, such as habitat improvement, introductions and stockings, stock manipulationand water quality issues (Cowx 1994). Habitat improvement, which includes the restoration ofrivers for spawning and nursery areas, is widely in progress in Finland. The aims of thefisheries management of the salmonid stocks in Lake Ouluja¨rvi are to produce partly self-sustaining stocks and to improve yield from stocking. The results of this study revealed thatone of the bottlenecks towards these aims is current fishery management. By harvesting thesalmonids, mostly by gill nets, before they reach maturity, very few spawners are expectedeven though the associated rivers are rehabilitated. Harvesting at a larger size would also givebetter yields for recreational fishing. In Lake Ouluja¨rvi, part of the nursery areas was lostthrough the damming of large rivers, and those remaining are mainly suitable for brown trout.Thus, natural reproduction will need to be supplemented by stocking in the future. However,natural reproduction would support the genetic integrity of the stock because it is based uponthe founder gene pool.
Brown trout reach their legal size limit (40 cm) some 12–16 months after release in spring
Figure 2. The numbers of recaptured fish from five different tag groups, with the fish divided according to therecapture period after stocking and three migratory distances. Water temparature at the time of stocking and stockingsites of the tag groups are also shown. Fish stocks: BT–KON, brown trout from the Kongasjoki stock; BT–RAU,brown trout from the Rautalammi stock; and LS–VUV, landlocked salmon from the Vuoksi watercourse stock.
© 1998 Blackwell Science Ltd,Fisheries Management and Ecology1998,5, 177–188

186 T. VEHANEN ET AL.
in Lake Oulujarvi, whereas the growth of landlocked salmon is faster (Hyva¨rinen et al. 1996).Currently a large part of the stocked brown trout and landlocked salmon caught are below thelegal size limit (40 cm). The effect of the illegal harvest is damaging both the yield fromstocking and the restoration of naturally reproducing fish stocks, because only a small part ofthe stocked fish reach maturity before they are caught (Gigliotti & Taylor 1990). Most of thefish were captured by gill nets and trawls. A similar situation was observed from the stockingin the Vuoksi Watercourse in southern Finland (Pursiainen 1997). Because of the disadvantagesof Carlin-tagging, i.e. tag loss and possible easier attachment to gill nets compared withuntagged fish, the situation with untagged fish may to some extent be different from that intagged fish, but harvesting undersized fish is a problem with untagged fish. The stocking period(midsummer or early winter) did not seem to affect the recapture rate.
A large part of the tagged fish from the summer stocking was caught in the vicinity of therelease site during the first 3 months after stocking, whereas a large part of the fish stockedduring the winter was recaptured in the spring about 7–9 months after stocking. The resultsof this study indicate that two combined fishing restrictions are needed: closed areas for fishingaround the release sites, combined with a restriction on small mesh nets. Temporal and spatialrestrictions ending some 2–3 months after the release for the summer stocking and some 8–9months for the winter releases are necessary to prevent the aggregation of the recaptures inthe vicinity of the stocking site. Increasing survival with increasing smolt size has beenrecorded in several tagging studies (Lundqvist, Clarke & Johansson 1988; Eriksson 1989;Vehanen, Aspi & Pasanen 1993). However, according to this study, the stocking site can alsodramatically affect recapture rate. An open and deep release site may diminish the aggregationof recaptures around the stocking site, because the stocked fish are able to disperse to a widerarea. Such release sites may also be helpful in reducing the risk of predation on stocked smolts,as shown at sea (Hvidsten & Møkkelgjerd 1987). However, despite using deep and openstocking sites, if no restrictions are imposed on the gill net fishery, a large number of undersizedfish will still be caught. Furthermore, stocking large smolts can be counterproductive forsurvival, because the largest fish are caught first because of intense fishing pressure and theselectivity of gill nets.
No differences in the distance migrated or recapture times between the two brown troutstocks were found, and the distribution of the recaptures was also similar. The overall recapturerate for the Rautalammi stock was slightly higher than for the Kongasjoki stock. However,differences in recapture rates were significant only in one tag group (group 4) out of five.Therefore, neither of the brown trout stocks should be used exclusively for stockings, becauseof no or very little difference in their behaviour after stocking. However, the Kongasjoki browntrout stock is the original stock from the Lake Ouluja¨rvi area and is therefore preferred forbrown trout stocking.
The landlocked salmon, reared under similar conditions to the brown trout, behaveddifferently from the two brown trout stocks. The overall recapture rate for brown trout washigher than for landlocked salmon. Also migratory distances and recapture times betweenbrown trout and landlocked salmon differed significantly, mainly because of more activemovement of the latter. Either landlocked salmon migrated to a wider area than brown trout,or they were captured in a shorter time after release, mostly by passive gears.
The distribution of the recaptures, in the 141 quadrats, showed greater similarity among the
© 1998 Blackwell Science Ltd,Fisheries Management and Ecology1998,5, 177–188

187DISPERSION OF BROWN TROUT AND LANDLOCKED SALMON
brown trout stocks than between the landlocked salmon and brown trout stocks. The greatestdifference in the distribution of the recaptures was that despite the similar release sites, noneof the landlocked salmon were captured in the eastern part of the lake. This part of the lakehas the highest water colour and the heaviest nutrient loading, caused by the City of Kajaaniand a paper mill. According to Lloyd’s (1967) index of ‘patchiness’, the recaptures of all threestocks were highly aggregated. This is obvious, because the recaptures are aggregated near therelease site and fishing pressure was not evenly directed across the area of the lake. However,the fishing pressure was similarly aimed at all three fish stocks used in the study and theindices can only be used in the comparisons between the stocks. The recaptures of both browntrout stocks were more than 10 times more crowded than if the recaptures had been randomlydistributed. The level of aggregation of the landlocked salmon recaptures was about half ofthat of the brown trout stocks, which, despite the high variation in the confidence limits,supports the results that landlocked salmon are more active in dispersing from a stocking site.As an actively migrating and fast-growing species, landlocked salmon may be considered tobe an attractive game fish for recreational fishing, together with the brown trout in large lakes.
Acknowledgements
Financial support for this work was provided by IVO group, Jenny and Antti Wihurin Rahastoand Suomen Luonnonvarain Tutkimussa¨atio. We are grateful to the staff at the Kainuu FisheriesResearch and Aquaculture for help during the work. Thanks are extended to Markku Pursiainen,who promoted this study, and to Dr Anne Paarma for excellent directorship and always havingsuch a supportive attitude. Special thanks are due to Angela Gutowski and Leon Trembath forchecking the English.
References
Aitkin M., Anderson D., Francis B. & Hinde J. (1990)Statistical Modelling in GLIM.London: ClarendonPress, 374 pp.
Aneer G. & Westin L. (1990) Migration of turbot (Psetta maximaL.) in the northern Baltic proper.Fisheries Research9, 307–315.
Cowx I.G. (1994) Strategic approach to fishery rehabilitation. In: I.G. Cowx (ed.)Rehabilitation ofFreshwater Fisheries.Oxford: Fishing News Books, Blackwell Science, pp. 3–10.
Dorazio R.M., Hattala K.A., McCollough C.B. & Skjevland J.E. (1994) Tag recovery estimates of stripedbass from spawning areas of the Chesapeake Bay. Transactions of the American Fisheries Society123, 950–963.
Efron B. (1982)The Jacknife, the Bootstrap and other Resampling Plans.Philadelphia, PA: Society forIndustrial and Applied Mathematics, 225 pp.
Eriksson C. (1989) Delayed release of young salmon smolts (Salmo salarL.) in the Baltic area.Comparative releases of salmon from different salmon river stocks. Nordic Journal of FreshwaterResearch65, 88–98.
Gatz A.J. Jr & Adams S.M. (1994) Patterns of movement of centrarchids in two warmwater streams ineastern Tennessee. Ecology of Freshwater Fish3, 35–48.
Gigliotti L.M. & Taylor W.W. (1990) The effect of illegal harvest on recreational fisheries. NorthAmerican Journal of Fisheries Management10, 106–110.
Hvidsten N.A. & Møkkelgjerd P.I. (1987) Predation on salmon smolts,Salmo salarL., in the estuary ofthe River Surna, Norway. Journal of Fish Biology30, 273–280.
© 1998 Blackwell Science Ltd,Fisheries Management and Ecology1998,5, 177–188

188 T. VEHANEN ET AL.
Hyvarinen P., Virtanen K., Vehanen T., Koskiniemi T., Kannel R. & Pursiainen M. (1996) Viihtyyko¨ vieraskala Oulujarvessa¨? Finnish Game and Fisheries Institute.Kalantutkimuksia-Fiskunderso¨kningar 199.
Jonsson N., Jonsson B., Aass P. & Hansen L.P. (1995) Brown troutSalmo truttareleased to supportrecreational fishing in a Norwegian fjord. Journal of Fish Biology46, 70–84.
Kallio-Nyberg I. & Ikonen E. (1992) Migration pattern of two salmon stocks in the Baltic Sea. ICESJournal of Marine Science49, 191–198.
Lloyd M. (1967) Mean crowding. Journal of Animal Ecology36, 1–30.Lundqvist H., Clarke W.C. & Johansson H. (1988) The influence of precocious sexual maturation on
survival to adulthood of river stocked Baltic salmon,Salmo salar, smolts. Holarctic Ecology11, 60–69.Minns C.K. (1995) Allometry of home range size in lake and river fishes. Canadian Journal of Fisheries
and Aquatic Sciences52, 1499–1508.Parker J.A. (1992) Migratory patterns and exploitation of American shad in the nearshore ocean waters
of southeastern North Carolina. North American Journal of Fisheries Management12, 752–759.Pursiainen M. (1997) Maintenance and fishing of landlocked salmon,Salmo salarm. sebago,on the
basis of Carlin taggings in the Vuoksi Watercourse. In: I.G. Cowx (ed.)Stocking and Introduction ofFish. Oxford: Fishing News Books, Blackwell Science.
Vehanen T., Aspi J. & Pasanen P. (1993) The effect of size, fin erosion, body silvering and precociousmaturation on recaptures in Carlin-tagged Baltic salmon. (Salmo salarL.). Annales Zoologici Fennici30, 277–285.
Watanabe N. (1988) A new proposal for measurement of the adjusted mean crowding through considerationof size variability in habitat units. Research on Population Ecology30, 215–225.
© 1998 Blackwell Science Ltd,Fisheries Management and Ecology1998,5, 177–188