Embed Size (px)
Citation preview
1
CITATION:
E. F. Kelley, G. R. Jones, and T. A. Germer, "Display Reflectance Model Based on the BRDF."
Displays, Vol. 19, No. 1, June 30, 1998, pp. 27-34 (June 1998). Display Reflectance Model Based on the BRDF
Edward F. Kelley, George R. Jones, and Thomas A. Germer
NIST, Gaithersburg, MD 20899, USA
ABSTRACT: Many flat panel displays (FPDs) have anti-reflection surface treatments that differ in character from those
of traditional cathode-ray-tube displays. Specular reflection models (mirror-like, producing a distinct image)
combined with diffuse (Lambertian) reflection models can be entirely inadequate to characterize the reflection
properties of such displays. A third reflection component, called haze, exists between specular and diffuse. Display
metrology should account for the haze component of reflection. That is best done using the bidirectional reflectance
distribution function (BRDF). The effects of using oversimplified reflectance models are discussed in contrast with a
parameterized BRDF.
INTRODUCTION: Flat panel displays (FPDs) can have reflection properties that differ substantially from their cathode-ray-
tube (CRT) counterparts. In the case of the CRT, the necessity of the thick front glass prevents strongly diffusing
surface treatments from being used on the front surface. Such treatments, distant from the pixel surface, would
compromise readability. With FPDs the front surface can be very close to the pixel surface, permitting surfaces that
substantially diffuse incident light without seriously compromising the display’s resolution. (This is easy to see:
Take wax paper and hold it about 1 cm above some text; compare the readability for that configuration with the
readability when the wax paper is placed directly upon the text.) Therefore, CRTs are often made with very mild
surface treatments to diffuse the specular light, but their surfaces cannot be as diffusing as those that can be used
with some FPDs. Because strongly diffusing surfaces can be used in connection with FPDs, conventional reflection
measurement techniques used to characterize display reflection for CRTs may well prove to be inadequate or, at the
very least, irreproducible when applied to all FPDs.
In this paper, when we refer to diffuse reflectance, we refer to an ideal Lambertian reflector that obeys the
relation:
L = qE = Ed /, (1)
where L is the luminance, E is the illuminance, q = d / is the luminance coefficient, and d is the diffuse
(Lambertian) reflectance. That is, the luminance is independent of direction. When we refer to specular reflection,
we mean mirror-like reflection that produces a distinct virtual image of the source where the reflected luminance L
is related to the source luminance Ls by:
L = s Ls, (2)
where s is the specular reflectance. A more general way to describe reflection is through the bidirectional
reflectance distribution function (BRDF). It is the differential form of Eq. 1 and will be developed in the next
section. Using the BRDF, we can account for the above specular and diffuse (Lambertian) properties, but also
understand a third type of reflection that exists between the two extremes of specular and diffuse (Lambertian)
reflection.
This third component of reflection is quickly identified by the eye when it views electronic displays. For
want of a better term we will call it haze (see ASTM E284 1 and D-4449
2). Haze reflection is similar to diffuse
(Lambertian) reflection in that it depends upon the illuminance (source-display distance), whereas it is similar to
specular reflection in that the luminance is peaked in the specular direction. In Fig. 1 we show drawings of the three
types of reflection and their combinations. Using a bare bulb of a flashlight placed 200 mm or more in front of the
screen, the significant components of the reflection are easily observed and appear distinct from one another. The
diffuse (Lambertian) component is seen as an overall gray, as if it were a dark-gray matte paint, slightly brighter
where the screen is nearest the source and gradually darker near the edges of the display because of the 1/r2 falloff in
illuminance. The specular (mirror-like) component is the virtual image of the point source seen in the display
surface. The haze component is the distinct fuzzy ball of light that surrounds the specular image. Sometimes the
2
haze component can be very slight (as with television picture tubes), other times the haze component can be the
dominant reflection component (as with many FPDs found in laptop computers).
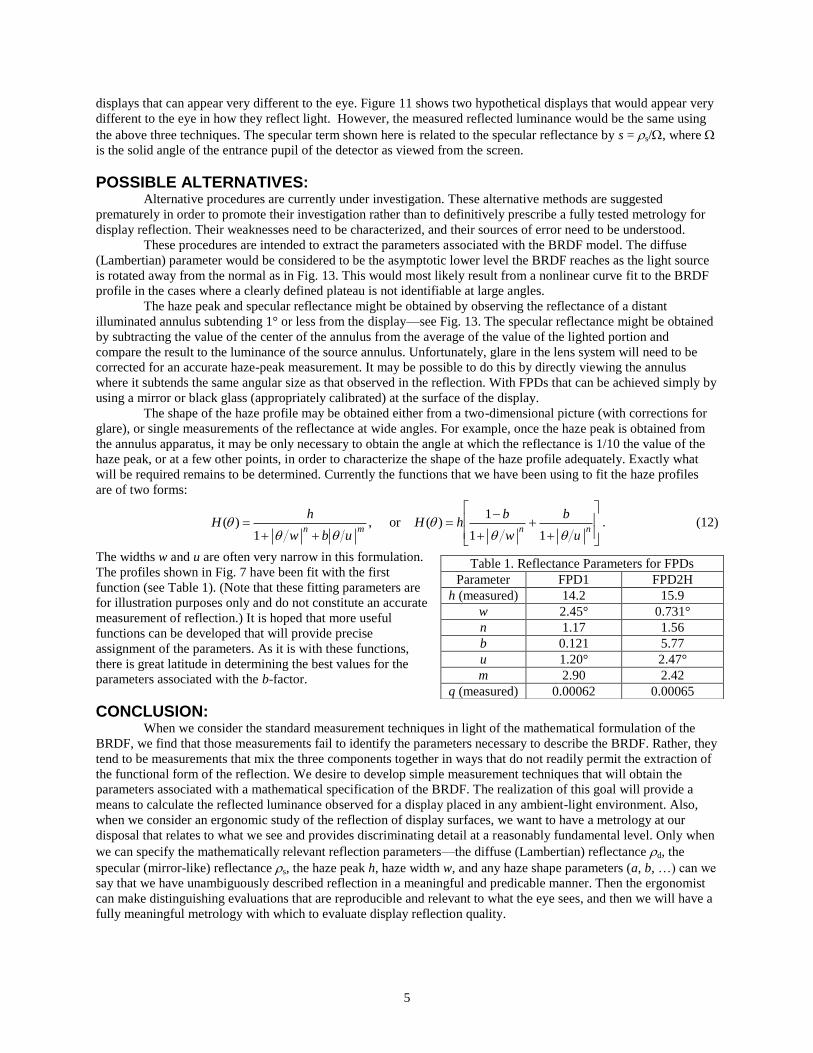
It is important to realize that not all components of reflection need to be observable. In practice, at least one
of the three components must exist (Fig. 1a, b, c). Further, any combination of all three components is possible.
There are displays that have almost entirely diffuse (Lambertian) surfaces (e.g., white copy paper—Fig. 1a). There
are displays that have no specular component and have only a haze component with the diffuse (Lambertian)
component being negligible (10-4
or less than the size of the haze reflection peak in the specular direction—Fig. 1c).
When the reflection of a point light source is observed in screens having only a haze component, only a fuzzy patch
of light is seen in the specular direction, and no distinct image of the source is observed. There are displays that do
not have a substantial haze component and exhibit only specular and diffuse (Lambertian) reflections (Fig. 1d).
Many television CRT picture tubes are of this nature. In all these cases, a thin-film antireflection coating can be
added to further reduce the reflections from the front surface of the screen, making the surface of the display appear
quite dark. This is especially true in the case of 1b, 1c, or 1f where the diffuse (Lambertian) component is either
absent or negligible. One way to view the BRDF is to direct a narrow laser beam at the screen and view the reflected
light against a large white card in a dark room. The distribution of the light on the white card is the projection of the
BRDF upon a plane.
The specular and diffuse (Lambertian) components obey the above Eqs. 1 and 2. A more elaborate
formalism is required to describe the haze component. When haze is present, the reflection measurement becomes
dependent upon virtually every configuration parameter of the apparatus and measurement instrumentation (the
distance, orientation, size, and uniformity of the light source; the distance, entrance pupil, field of view, and focus of
the light measuring device; etc.3)
BIDIRECTIONAL REFLECTANCE DISTRIBUTION FUNCTION FORMALISM: The reflection model offered here is based on the mathematical formalism for the bidirectional reflectance
distribution function (BRDF).4 Only comparatively recently has an effort been made to examine the BRDFs
associated with electronic display surfaces in order to better characterize display reflection.5,6
Neglecting any
wavelength and polarization dependence, the BRDF is a function of two directions, the direction of the incident light
(i , i in spherical coordinates) and the direction from which the reflection is observed (r , r in spherical
coordinates). Since not all screens exhibit a wavelength independent reflection and because many liquid crystal
displays (LCDs) and glare-reducing cover screens for CRTs exhibit polarizing properties, care must be exercised in
applying these assumptions. The BRDF relates how any differential element of incident illuminance, dEi from
direction (i , i), contributes to a reflected luminance dLr observed from direction (r , r):
),(),,,(),( iiirriirrr dEBdL , (3)
where B(i , i , r , r) is the BRDF. (In the literature the BRDF is often denoted by fr . We use B to avoid
complicated subscripts and confusion with other uses of “f ” within the display industry.) By integrating Eq. 3 over
all incident directions in space, the luminance Lr(r , r) observed from any direction (r , r) can be calculated. The
illuminance contributions dEi can be related to luminance sources in the room. For each element of solid angle
dAi /ri2 = d = sini di di there is a source luminance Li (i , i) at a distance ri from the screen producing
illuminance
ddLdLdE iiiiiiiiii sincos),(cos),( , (4)
where the cosine term accounts for the spreading of the illuminance over a larger area as the inclination angle from
the normal increases.
Methods for obtaining the BRDF are well documented.7,8
Most often, a collimated beam of light of radiant
flux i is allowed to be incident upon the sample from direction (i , i). The radiant flux r scattered into a
direction (r , r) and into a solid angle (the detector) is measured. The BRDF is then approximately
B = r/(i cosr ). Generally, both the source and detector cannot be along the normal at the same time since one
obscures the other. In practice, the detector is placed a few degrees s off normal, and the peak reflection is observed
when the source is s on the other side of normal.
We can capture these three types of reflection explicitly with the BRDF formalism in terms of three
additive components
HSDB , (5)
where the components are defined6 as:

3
).,,,(
),()sin(sin2
,/
rrii
iri2
r2
s
d
HH
S
qD
(6)
In the specular term the delta functions provide for a mirror-like distinct virtual image of the source in the viewed
reflection.4 When we integrate this three-component BRDF over all incident illumination directions by combining
Eqs. 3-6, the reflected luminance is given by
.)cos(),(),,,(),(),( iiiirrii
2/
0
2
0
rrssrrr dLHLqEL
(7)
The first term on the right hand side of Eq. 7 is the familiar Lambertian reflection where E is the total illuminance
from all directions. The second term is the familiar specular reflection where the specification of (r ,r ±) simply
selects the light from the viewing direction (r ,r) reflected about the normal (z-axis), i.e., the specular direction
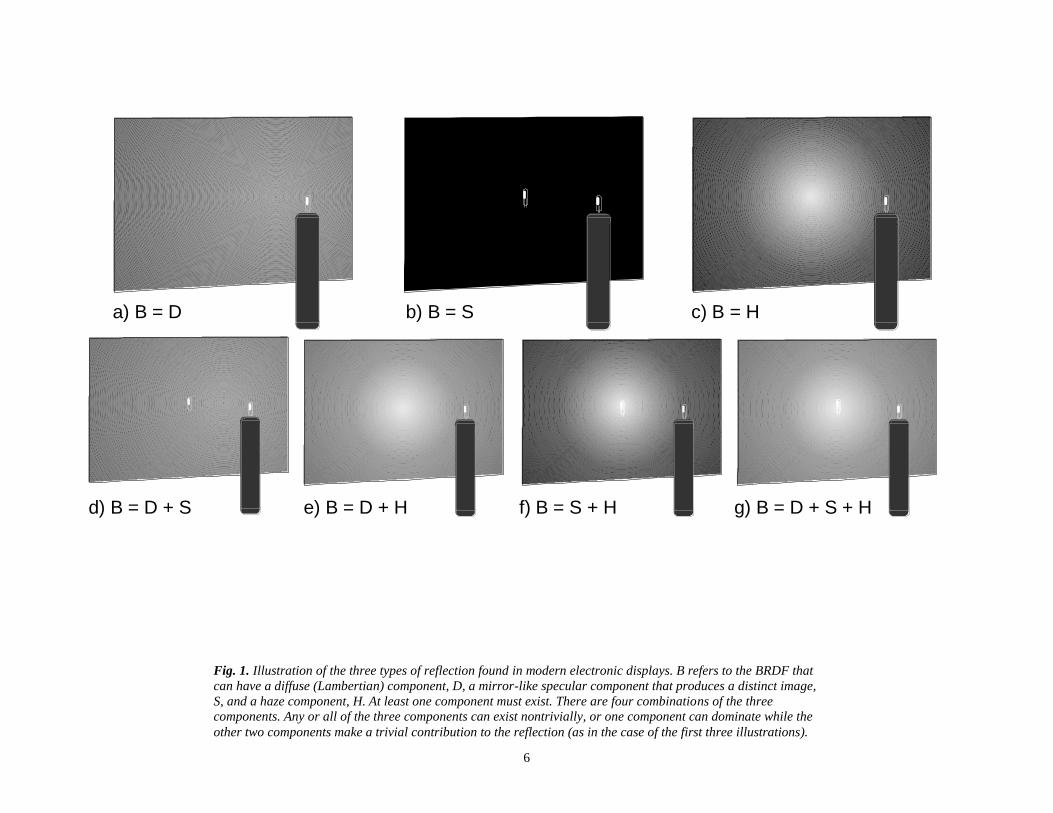
associated with the viewing direction. The last term is the haze contribution. See Fig. 2 for an example of a BRDF
taken for the case of Fig. 1g.9 The ultimate goal of this research is to provide simple methods to obtain a
parameterization for the BRDF. Two of those parameters are already familiar—the diffuse (Lambertian) reflectance
d and the specular reflectance s. We would expect the haze component to be specified by a peak h, a width w at
some level, and perhaps several shape parameters a, b, …, etc. The realization of this goal will provide a means to
calculate the reflected luminance observed for a display placed in any ambient-light environment.
Display reflections allow us to take advantage of some simplifications: Most displays are viewed from the
normal or nearly normal direction, and the range of angles to observe the entire screen from the normal position is
usually less than ±30°. It will often be found that the shape of the BRDF does not change dramatically over this
viewing-angle range. Thus, a reduced BRDF B(i , i) B(i , i , , ) is adequate for most reflection
characterizations, and we can drop the subscript “i” in the following, so we can write: B( , ) B(i , i , , ). If
the BRDF is seen to be axially symmetrical about the specular direction then the BRDF is independent of , and
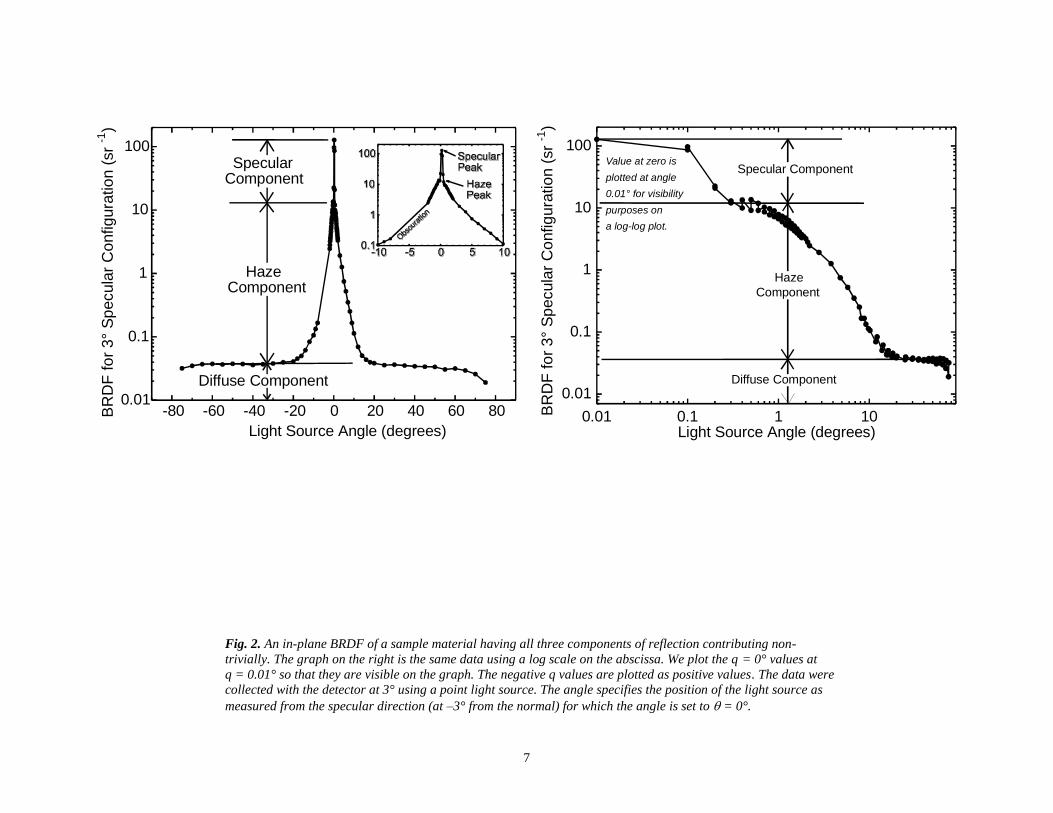
B( , ) B( ). An example of such an in-plane BRDF is shown in Fig. 2. In Fig. 3 we show a comparison of
different observation directions for in-plane BRDFs obtained using a display for which there is only a non-trivial
haze component of reflection. An illustration of the invariability of the BRDF over the entire viewing surface of the
display is found in Fig. 4.
The axial symmetry of the BRDF is one simplification that we are not always able to make for all displays.
Because of the pixel matrix structure beneath the front surface, spikes may be observed extending out of the central
BRDF profile (see Fig. 5). Such measurements are highly non-trivial. Figure 5 suggests a method to obtain the
BRDF by taking a picture of the reflectance of a point light source using a calibrated electronic camera, and
determining the needed profiles from an analysis of the picture. However, with this procedure, the measurement
might be corrupted by veiling glare from the camera-lens-detector system.
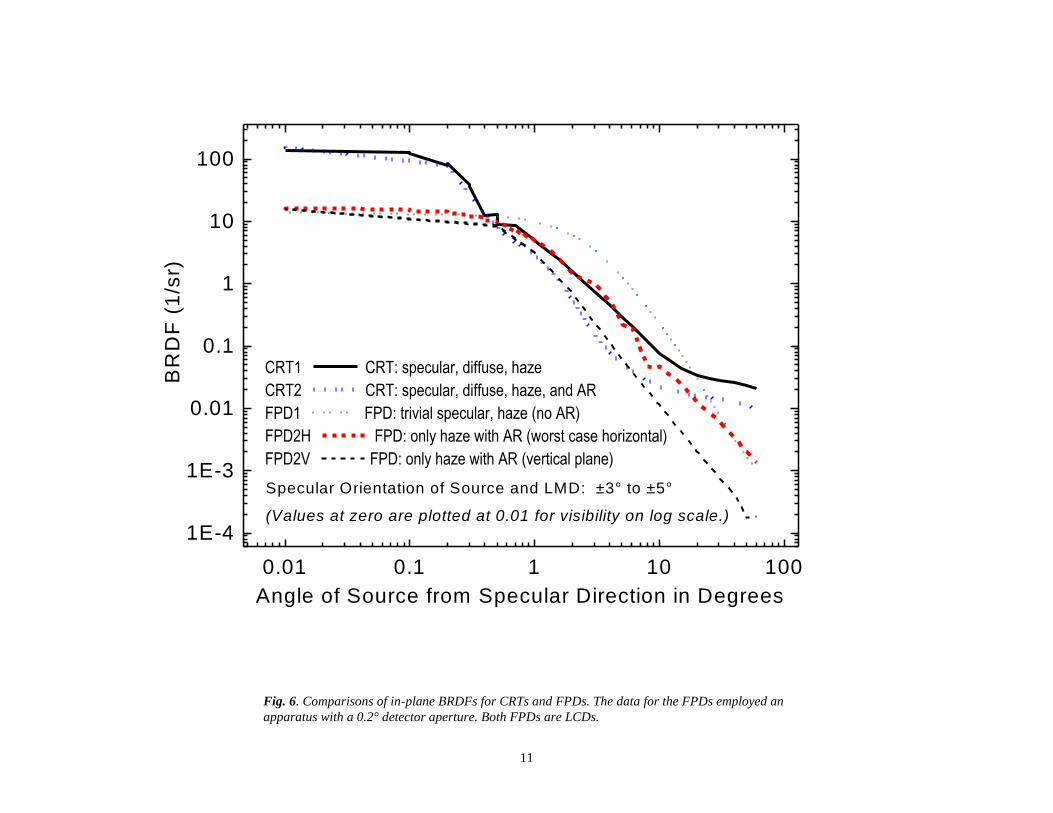
In Fig. 6 we show a comparison between several different types of CRT and FPD displays. (AR refers to a
multi-layer anti-reflection coating.) You will note that the CRTs have a specular component that is roughly a factor
of ten greater than the maximum haze peak observed for the FPDs. The width of the specular component is
indicative of the resolution of the apparatus used (<0.5°). Observe that there are two BRDFs shown for FPD2 for the
horizontal and the vertical plane. The pattern observed is very much like that shown in Fig. 5. The vertical BRDF for
FPD2 indicates that this display is almost a factor of ten lower in reflectance than the other displays for sources at
large angles from the direction of the observer. Indeed, the blackness of this display is impressive even in a bright
room. Note also that for the FPDs, the haze peaks appear relatively flat over a ±0.5° or larger region about the
specular direction, or so it would seem. This is on a log scale. However, on a linear scale a substantial change is
observed over ±0.5° from the specular direction (see Fig. 7).
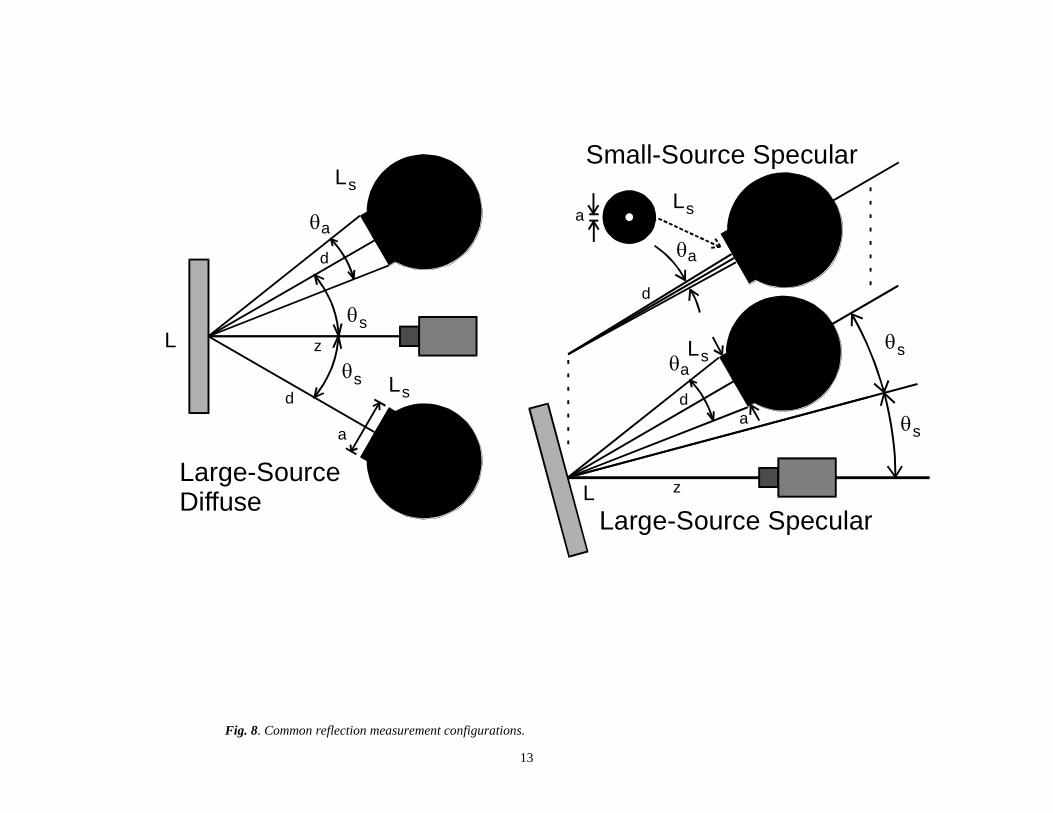
CONVENTIONAL REFLECTION MEASUREMENTS: There are three types of reflection measurements commonly employed for electronic displays: large-source
diffuse measurements, large-source specular measurements, and small-source specular measurements—see Fig. 8.
Let’s calculate the luminance measured for each apparatus using the form in Eq. 7. In doing this we will often take
advantage of the fact that for small angles, the sine and tangent are approximately equal to the angle in radians.
LARGE-SOURCE DIFFUSE MEASUREMENT: Here we have two uniform lamps each having an exit
port of diameter a (radius r = a/2 having a subtense of a from the screen, typically 15°) placed at ±s (typically 30°
or more) on each side of the normal. The detector views the center of the screen from the normal direction. From

4
Eq. 7 the luminance arises from two factors, the illuminance E = 2Ls = 2Lsr2/d
2 from the lamps, and an
integration of the haze over the surface of the lamps:
ExitPort2
2
d sincos)(2 dHd
rLL s . (8)
The first term is the luminance from the diffuse (Lambertian) component. The second term is the contribution from
the haze. Note, in Fig. 9 how much the haze can vary over the surface of the lamp (±a/2) for our two FPDs. To
obtain an order of magnitude estimate of the haze term we can use H(s)cos(s)r2/d
2. The approximate expression
for the luminance then becomes L 2Lsr2[d + H(s)cos(s)]. This expression is identical to the expression for the
luminance if we permit the diameter of the exit ports of lamps to decrease to 1° so that they can be considered as
single sources with solid angle = r2/d
2 each; then we obtain:
scos)
s(
d2
22 H
d
rs
LL , (small sources) (9)
which is very sensitive to the angle associated with the haze contribution. In Fig. 9 we see that at 30° the haze
contributes on the order of 0.007 to the diffuse (Lambertian) term that may be from 0.01 to 0.025 for CRTs and
much less (0.001) for many FPDs. The rapid change in the haze reflectance with angle shows why this measurement
is sensitive to the angular alignment of the lamps.
LARGE-SOURCE SPECULAR MEASUREMENT: In this case we look in the specular direction at one of
the large-diameter sources used in the large-source diffuse measurement (again, typically a = 15° and s is often set
at 15°). Equation 7 becomes:
drdH
d
rLL
/2/
s2
2
ds
a
sincos)(2
. (10)
Here, the main contribution for displays is from the specular component and the haze component (where we are
integrating around the peak of the haze). If we were to examine only the haze profiles, such as in Fig. 7, we might
think that since the haze functions are very small at 7.5° and beyond (the typical half angle of the lamp subtense
from the screen), that this integral would be relatively insensitive to the size and position of the light source.
However, when we look at the integrand, we see the effect of the increase in solid angle with increasing for any
increment d —see Fig. 10. Significant errors can be introduced by a change in position, distance, and uniformity of
the lamp used because of the haze contribution. For example, if the subtense of the lamp were to change from 14° to
16° (half angle 7° to 8° in Fig. 10), the haze contribution in Eq. 10 would change by 6 %.
SMALL-SOURCE SPECULAR MEASUREMENT: This is the same configuration as the large-source
specular measurement with the diameter of the source subtending approximately 1° or less as viewed from the
screen. The source has a solid angle = r2/d
2, and the luminance is:
s2
2
dsssssss )()()( d
rhLhqLLEhqhELqEL , (11)
where h is the peak of the haze profile. Note that as h is on the order of 10 sr-1
and the diffuse (Lambertian)
reflectance is rarely higher than 0.05, the diffuse term is negligible in both the large-source and small-source
specular measurements. Note also how the contribution of the haze depends upon the illuminance as does the diffuse
(Lambertian) term. The difference between the large-source and small-source measurements is primarily the extent
of the contribution of haze. It is because the diffuse (Lambertian) component is generally not an important factor in
Eqs. 10 and 11 that these three measurements can give similar results for displays that look very different to the eye.
Consider Eqs. 10 and 11. Their difference lies in how much of the width of the haze peak is used. If the
haze were not present, they would give the same result. We have essentially three variables (at least) and two
specular measurements. The three variables (the minimum number) are the haze peak h, the haze width w, and the
specular reflectance s. The large-source specular measurement is sensitive to all three variables, whereas the small-
source specular measurement is sensitive only to the specular and the haze peak. We can, therefore, get the same
measurements for different looking displays depending upon how these components mix. Adding the large-source
diffuse measurement does not alleviate the problem since it adds another variable, the diffuse (Lambertian)
reflectance, d. We then have a total of four variables (at a minimum) and three measurements. This results in the
undesirable situation that reflection properties are not sufficiently defined by these measurements to distinguish
5
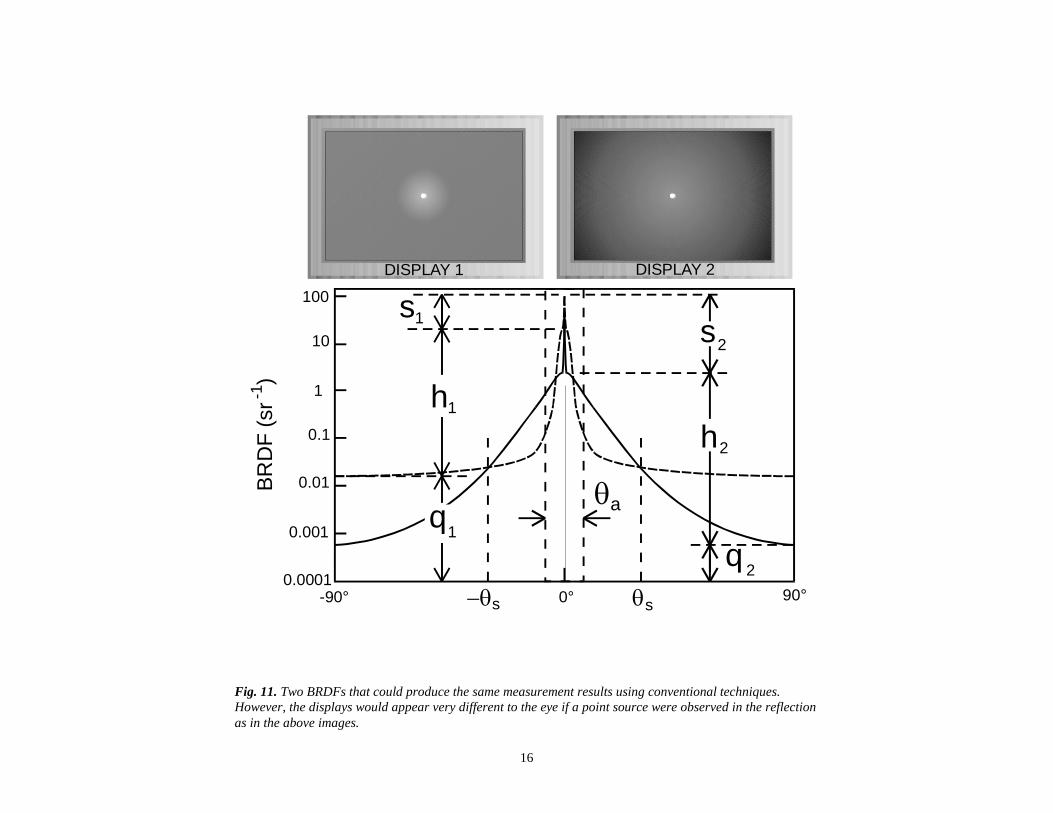
displays that can appear very different to the eye. Figure 11 shows two hypothetical displays that would appear very
different to the eye in how they reflect light. However, the measured reflected luminance would be the same using
the above three techniques. The specular term shown here is related to the specular reflectance by s = s/, where
is the solid angle of the entrance pupil of the detector as viewed from the screen.
POSSIBLE ALTERNATIVES: Alternative procedures are currently under investigation. These alternative methods are suggested
prematurely in order to promote their investigation rather than to definitively prescribe a fully tested metrology for
display reflection. Their weaknesses need to be characterized, and their sources of error need to be understood.
These procedures are intended to extract the parameters associated with the BRDF model. The diffuse
(Lambertian) parameter would be considered to be the asymptotic lower level the BRDF reaches as the light source
is rotated away from the normal as in Fig. 13. This would most likely result from a nonlinear curve fit to the BRDF
profile in the cases where a clearly defined plateau is not identifiable at large angles.
The haze peak and specular reflectance might be obtained by observing the reflectance of a distant
illuminated annulus subtending 1° or less from the display—see Fig. 13. The specular reflectance might be obtained
by subtracting the value of the center of the annulus from the average of the value of the lighted portion and
compare the result to the luminance of the source annulus. Unfortunately, glare in the lens system will need to be
corrected for an accurate haze-peak measurement. It may be possible to do this by directly viewing the annulus
where it subtends the same angular size as that observed in the reflection. With FPDs that can be achieved simply by
using a mirror or black glass (appropriately calibrated) at the surface of the display.
The shape of the haze profile may be obtained either from a two-dimensional picture (with corrections for
glare), or single measurements of the reflectance at wide angles. For example, once the haze peak is obtained from
the annulus apparatus, it may be only necessary to obtain the angle at which the reflectance is 1/10 the value of the
haze peak, or at a few other points, in order to characterize the shape of the haze profile adequately. Exactly what
will be required remains to be determined. Currently the functions that we have been using to fit the haze profiles
are of two forms:
nnmnu
b
w
bhH
ubw
hH
11
1)(or ,
1)( . (12)
The widths w and u are often very narrow in this formulation.
The profiles shown in Fig. 7 have been fit with the first
function (see Table 1). (Note that these fitting parameters are
for illustration purposes only and do not constitute an accurate
measurement of reflection.) It is hoped that more useful
functions can be developed that will provide precise
assignment of the parameters. As it is with these functions,
there is great latitude in determining the best values for the
parameters associated with the b-factor.
CONCLUSION: When we consider the standard measurement techniques in light of the mathematical formulation of the
BRDF, we find that those measurements fail to identify the parameters necessary to describe the BRDF. Rather, they
tend to be measurements that mix the three components together in ways that do not readily permit the extraction of
the functional form of the reflection. We desire to develop simple measurement techniques that will obtain the
parameters associated with a mathematical specification of the BRDF. The realization of this goal will provide a
means to calculate the reflected luminance observed for a display placed in any ambient-light environment. Also,
when we consider an ergonomic study of the reflection of display surfaces, we want to have a metrology at our
disposal that relates to what we see and provides discriminating detail at a reasonably fundamental level. Only when
we can specify the mathematically relevant reflection parameters—the diffuse (Lambertian) reflectance d, the
specular (mirror-like) reflectance s, the haze peak h, haze width w, and any haze shape parameters (a, b, …) can we
say that we have unambiguously described reflection in a meaningful and predicable manner. Then the ergonomist
can make distinguishing evaluations that are reproducible and relevant to what the eye sees, and then we will have a
fully meaningful metrology with which to evaluate display reflection quality.
Table 1. Reflectance Parameters for FPDs
Parameter FPD1 FPD2H
h (measured) 14.2 15.9
w 2.45° 0.731°
n 1.17 1.56
b 0.121 5.77
u 1.20° 2.47°
m 2.90 2.42
q (measured) 0.00062 0.00065
6
Fig. 1. Illustration of the three types of reflection found in modern electronic displays. B refers to the BRDF that
can have a diffuse (Lambertian) component, D, a mirror-like specular component that produces a distinct image,
S, and a haze component, H. At least one component must exist. There are four combinations of the three
components. Any or all of the three components can exist nontrivially, or one component can dominate while the
other two components make a trivial contribution to the reflection (as in the case of the first three illustrations).
a) B = D b) B = S
d) B = D + S f) B = S + He) B = D + H
c) B = H
g) B = D + S + H
7
-80 -60 -40 -20 0 20 40 60 800.01
0.1
1
10
100
Diffuse Component
SpecularComponent
HazeComponent
Light Source Angle (degrees)
BR
DF
fo
r 3
° S
pecula
r C
onfig
ura
tio
n (
sr
)
-1
BR
DF
fo
r 3
° S
pecula
r C
onfig
ura
tio
n (
sr
)
-1
0.01 0.1 1 10
0.01
0.1
1
10
100Value at zero is
plotted at angle
0.01° for visibility
purposes on
a log-log plot.
Diffuse Component
Specular Component
Light Source Angle (degrees)
Haze
Component
Fig. 2. An in-plane BRDF of a sample material having all three components of reflection contributing non-
trivially. The graph on the right is the same data using a log scale on the abscissa. We plot the q = 0° values at
q = 0.01° so that they are visible on the graph. The negative q values are plotted as positive values. The data were
collected with the detector at 3° using a point light source. The angle specifies the position of the light source as
measured from the specular direction (at –3° from the normal) for which the angle is set to = 0°.
8
0.01 0.1 1 10 100
1E-3
0.01
0.1
1
10
FPD1 Haze Component Dominant
Specular Configuration Angle
3°
10°
20°
30°
BR
DF
(1
/sr)
Angle from Specular Direction (degrees)
Fig. 3. Comparison of BRDFs taken at different specular angles on the same display.
Detector at 3°, 10°, 20°, and 30° from normal.

9
Fig. 4. For many displays, the image of the source appears to have approximately the same
shape as viewed at positions all over the screen from a single observation point near the
normal.

10
Fig. 5. A display BRDF that is not symmetrical about the normal.
11
0.01 0.1 1 10 100
1E-4
1E-3
0.01
0.1
1
10
100
Specular Orientation of Source and LMD: ±3° to ±5°
(Values at zero are plotted at 0.01 for visibility on log scale.)
CRT1 CRT: specular, diffuse, haze
CRT2 CRT: specular, diffuse, haze, and AR
FPD1 FPD: trivial specular, haze (no AR)
FPD2H FPD: only haze with AR (worst case horizontal)
FPD2V FPD: only haze with AR (vertical plane)
BR
DF
(1
/sr)
Angle of Source from Specular Direction in Degrees
Fig. 6. Comparisons of in-plane BRDFs for CRTs and FPDs. The data for the FPDs employed an
apparatus with a 0.2° detector aperture. Both FPDs are LCDs.

12
Fig. 7. BRDF of FPD1 and FPD2H showing that the value of the BRDF can change
substantially over even 0.5°.
0.01 0.1 1 10 100
0
5
10
15
FPD2H
FPD1
Specular Orientation of Source
and LMD: ±3°
Values at zero are plotted at 0.01°
for visibility on log scale.
BR
DF
(1
/sr)
Angle of Source from Specular Direction in Degrees
13
Fig. 8. Common reflection measurement configurations.
z
d
d
s
s
a
L
Ls
Ls
a
Large-Source Diffuse
a
z
d
s
s
a
L
Ls
d
a
Lsa
Large-Source Specular
Small-Source Specular

14
Fig. 9. BRDFs off normal for two FPD surfaces.
BR
DF
(sr
)
-1
20 22 24 26 28 30 32 34 36 38 400.000
0.005
0.010
0.015
0.020
0.025
0.030
FPD2H
FPD1
Specular Orientation of Source and LMD: ±3° of normal
Angle of Source from Specular Direction in Degrees

15
Fig. 10. Integrand for large-source specular contribution from haze using the data for FPD1.
0 1 2 3 4 5 6 7 8 9 10 11 12 13 14 15
Angle from Normal in Radians,
Angle from Normal in Degrees,
H(
) cos
sin
0
0.05
0.10
0.15
0.20
0 0.05 0.10 0.15 0.20 0.25
16
Fig. 11. Two BRDFs that could produce the same measurement results using conventional techniques.
However, the displays would appear very different to the eye if a point source were observed in the reflection
as in the above images.
0.0001
0.001
0.01
0.1
1
10
100
s s
a
90°-90° 0°
h1
q1
1ss
2
h2
q2
BR
DF
(sr
)
-1DISPLAY 1 DISPLAY 2

17
Detector
Source
Fig. 12. The diffuse (Lambertian) term, if non-trivial, will be indicated by the haze asymptotically reaching a constant as the angle of the light source from
the normal increases toward 90°. Note that the detector would have to measure the entirety of the elongated illuminated area. Otherwise, the detector
would have to measure within the illuminated area, correct the reading with 1/cos, and the illumination would have to be very uniform over its cross-
section.

18
Fig. 13. The haze peak added to the diffuse component may be observable at the center of an annulus that is sufficiently small. The specular
component would be obtained with the same apparatus by subtracting off the haze peak and the diffuse component making appropriate corrections for
glare.
D+S+HD+H
S
POSITION
< 1°
Center Cross-Section
19
FIGURE CAPTIONS: Fig. 1. Illustration of the three types of reflection found in modern electronic displays. B refers to the BRDF that can
have a diffuse (Lambertian) component, D, a mirror-like specular component that produces a distinct image, S, and a
haze component, H. At least one component must exist. There are four combinations of the three components. Any
or all of the three components can exist nontrivially, or one component can dominate while the other two
components make a trivial contribution to the reflection (as in the case of the first three illustrations).
Fig. 2. An in-plane BRDF of a sample material having all three components of reflection contributing non-trivially.
The graph on the right is the same data using a log scale on the abscissa. We plot the q = 0° values at q = 0.01° so
that they are visible on the graph. The negative q values are plotted as positive values. The data were collected with
the detector at 3° using a point light source. The angle specifies the position of the light source as measured from the
specular direction (at –3° from the normal) for which the angle is set to = 0°. Fig. 3. Comparison of BRDFs taken at different specular angles on the same display. Detector at 3°, 10°, 20°, and
30° from normal. Fig. 4. For many displays, the image of the source appears to have approximately the same shape as viewed at
positions all over the screen from a single observation point near the normal.
Fig. 5. A display BRDF that is not symmetrical about the normal.
Fig. 6. Comparisons of in-plane BRDFs for CRTs and FPDs. The data for the FPDs employed an apparatus with a
0.2° detector aperture. Both FPDs are LCDs.
Fig. 7. BRDF of FPD1 and FPD2H showing that the value of the BRDF can change substantially over even 0.5°.
Fig. 8. Common reflection measurement configurations. Fig. 9. BRDFs off normal for two FPD surfaces.
Fig. 10. Integrand for large-source specular contribution from haze using the data for FPD1.
Fig. 11. Two BRDFs that could produce the same measurement results using conventional techniques. However, the
displays would appear very different to the eye if a point source were observed in the reflection as in the above
images.
Fig. 12. The diffuse (Lambertian) term, if non-trivial, will be indicated by the haze asymptotically reaching a
constant as the angle of the light source from the normal increases toward 90°. Note that the detector would have to
measure the entirety of the elongated illuminated area. Otherwise, the detector would have to measure within the
illuminated area, correct the reading with 1/cos, and the illumination would have to be very uniform over its cross-
section.
Fig. 13. The haze peak added to the diffuse component may be observable at the center of an annulus that is
sufficiently small. The specular component would be obtained with the same apparatus by subtracting off the haze
peak and the diffuse component making appropriate corrections for glare.

20
REFERENCES:
1 ASTM Standards on Color and Appearance Measurement, 5
th edition, E 284-95a, “Standard Terminology of
Appearance,” definition of haze, p. 243, 1996. 2 ASTM Standards on Color and Appearance Measurement, 5
th edition, D 4449-90 (Reapproved 1995), “Standard
Test Method for Visual Evaluation of Gloss Differences Between Surfaces of Similar Appearance,” pp. 178-
182, 1996. This discusses distinctness-of-image gloss and reflection haze. 3 To be published.
4 F. E. Nicodemus, J. C. Richmond, J. J. Hsia, I. W. Ginsberg, and T. Limperis, Geometrical Considerations and
Nomenclature for Reflectance, NBS Monograph 160, National Bureau of Standards, Gaithersburg October
1977. 5 M. E. Becker, “Evaluation and Characterization of Display Reflectance,” Society for Information Display
International Symposium, Boston Massachusetts, May 12-15, 1997, pp 827-830. Dr. Becker also makes
reference here to the work by J. C. Stover, Optical Scattering, Measurement and Analysis, SPIE Optical
Engineering Press, Bellingham, Wash., USA, 1995. 6 E. F. Kelley and G. R. Jones, "Utilizing the Bidirectional Reflection [should be Reflectance] Distribution Function
to Predict Reflections from FPDs," Society for Information Display International Symposium, Boston
Massachusetts, May 12-15, 1997, pp 831-834. 7 ASTM Standards on Color and Appearance Measurement, 5
th edition, E 1392-90, “Standard Practice for Angle
Resolved Optical Scatter Measurements on Specular or Diffuse Surfaces,” pp. 439-444, 1996. This refers also
to reference 8. 8 ASTM Standards on Color and Appearance Measurement, 5
th edition, E 167-91, “Standard Practice for
Goniophotometry of Objects and Materials,” pp. 206-209, 1996. 9 Note that the data presented in this paper are for illustration purposes only. The combined standard uncertainty in
all the present measurements is estimated to be ±10% of the measurand using a coverage factor of two.