Embed Size (px)
Citation preview
____________________________________________ Monitoring Survey at the Western Long Island Sound Disposal Site June 2004
__________________________
Disposal Area Monitoring System DAMOS
Contribution 161 September 2005
This report should be cited as:
ENSR. 2005. Monitoring Survey at the Western Long Island Sound Disposal Site, June 2004. DAMOS Contribution No. 161. U.S. Army Corps of Engineers, New England District, Concord, MA, 79 pp.
REPORT DOCUMENTATION PAGE form approved OMB No. 0704-0188
Public reporting concern for the collection of information is estimated to average 1 hour per response including the time for reviewing instructions, searching existing data sources, gathering and measuring the data needed and correcting and reviewing the collection of information. Send comments regarding this burden estimate or any other aspect of this collection of information including suggestions for reducing this burden to Washington Headquarters Services, Directorate for information Observations and Records, 1215 Jefferson Davis Highway, Suite 1204, Arlington VA 22202-4302 and to the Office of Management and Support, Paperwork Reduction Project (0704-0188), Washington, D.C. 20503.
1. AGENCY USE ONLY (LEAVE BLANK) 2. REPORT DATE September 2005
3. REPORT TYPE AND DATES COVERED FINAL REPORT
4. TITLE AND SUBTITLE Monitoring Survey at the Western Long Island Sound Disposal Site June 2004 6. AUTHOR(S) ENSR International, Germano and Associates, CoastalVision, Ocean Surveys, Inc, and CR Environmental.
5. FUNDING NUMBERS
7. PERFORMING ORGANIZATION NAME(S) AND ADDRESS(ES) ENSR International
2 Technology Park Drive Westford, MA 01886
8. PERFORMING ORGANIZATION REPORT NUMBER ENSR-9000-361-320
9. SPONSORING/MONITORING AGENCY NAME(S) AND ADDRESS(ES) US Army Corps of Engineers-New England District 696 Virginia Rd Concord, MA 01742-2751
10. SPONSORING/MONITORING AGENCY REPORT NUMBER Contribution No. 161
11. SUPPLEMENTARY NOTES Available from DAMOS Program Manager, Regulatory Division USACE-NAE, 696 Virginia Rd, Concord, MA 01742-2751
12a. DISTRIBUTION/AVAILABILITY STATEMENT Approved for public release; distribution unlimited
12b. DISTRIBUTION CODE
13. ABSTRACT The Western Long Island Sound Disposal Site (WLDS) was monitored as part of the Disposal Area Monitoring System (DAMOS) on 19-20 June 2004 and 30 June - 1 July 2004. The 2004 field effort consisted of bathymetric and sediment-profile imaging (SPI) surveys designed to characterize seafloor topography, evaluate the physical distribution of dredged material around recent and historic disposal events and to assess the benthic conditions over recently formed and historic disposal mounds. Disposal site data were compared to reference area data and data from the June 2001 WLDS monitoring survey. Between the June 2001 and June 2004 survey, approximately 70,000 m3 of dredged material was placed at WLDS. The 2004 bathymetric survey indicated that the WLIS J Mound had increased in height by approximately 1.5 m and increased in diameter by 150 m. The spread of the WLIS J Mound towards the existing WLIS H Mound has led to the formation of the oblong-shaped WLIS J/H Mound Complex. The SPI survey, performed over the WLIS J/H Mound Complex and the historic WLIS K and WLIS L Mounds indicated that benthic recovery had proceeded better than expected at all locations. Mean apparent RPD depths at all stations were substantially greater than measured in past WLDS surveys, and Stage III assemblages were found at all stations. Performing WLDS monitoring surveys in June avoids late summer hypoxic conditions that are common in western Long Island Sound, which can complicate observations of benthic recovery.
14. SUBJECT TERMS DAMOS, Western Long Island Disposal Site, Dredged Material 15. NUMBER OF TEXT PAGES: 79
16. PRICE CODE 17. SECURITY CLASSIFICATION OF REPORT Unclassified
18. SECURITY CLASSIFICATION OF THIS PAGE
19. SECURITY CLASSIFICATION OF ABSTRACT
20. LIMITATION OF ABSTRACT
MONITORING SURVEY AT THE WESTERN LONG ISLAND SOUND DISPOSAL SITE
JUNE 2004
CONTRIBUTION #161
September 2005
Report No.
ENSR-9000-361-320
Submitted to: New England District
U.S. Army Corps of Engineers 696 Virginia Road
Concord, MA 01742-2751
Prepared by: ENSR International, Germano & Associates, CoastalVision,
Ocean Surveys, Inc., and CR Environmental
Submitted by: ENSR International
2 Technology Park Drive Westford, MA 01886
(978) 589-3000
i
TABLE OF CONTENTS Page LIST OF TABLES ..................................................................................... iii LIST OF FIGURES .....................................................................................iv EXECUTIVE SUMMARY ...........................................................................vii
1.0 INTRODUCTION .............................................................................. 1 1.1 Overview of the DAMOS Program................................................. 1 1.2 Introduction to the Western Long Island Sound Disposal Site................. 2 1.3 Historic Dredged Material Disposal Activity ..................................... 5 1.4 Previous WLDS Monitoring Events ................................................ 5 1.5 Recent Dredged Material Disposal Activity ....................................... 8 1.6 Survey Objectives ...................................................................... 8
2.0 METHODS...................................................................................... 14 2.1 Navigation and On-Board Data Acquisition ...................................... 14 2.2 Bathymetry ............................................................................. 14
2.2.1 Bathymetric Data Collection ........................................... 14 2.2.2 Bathymetric Data Processing........................................... 17 2.2.3 Bathymetric Data Analysis ............................................. 17
2.3 Sediment-Profile Imaging ............................................................ 18 2.3.1 SPI Data Acquisition .................................................... 18 2.3.2 SPI Data Analysis ........................................................ 23 2.3.3 SPI Statistical Analysis .................................................. 24
3.0 RESULTS ....................................................................................... 29 3.1 Bathymetry ............................................................................. 29
3.1.1 WLIS J/H Mound Complex ............................................ 29 3.1.2 Historic Mounds.......................................................... 29 3.1.3 Comparison with Previous Bathymetry .............................. 29
3.2 Sediment-Profile Imaging ............................................................ 34 3.2.1 WLDS Reference Areas................................................. 34 3.2.2 WLIS J/H Mound Complex ............................................ 37 3.2.3 WLIS K and WLIS L Mounds......................................... 52 3.2.4 Comparison of WLDS Mounds to Reference Area Conditions.. 58
4.0 DISCUSSION................................................................................... 71 4.1 Dredged Material Distribution ...................................................... 71 4.2 Biological Conditions and Benthic Recolonization .............................. 71
TABLE OF CONTENTS (continued) Page
ii
5.0 CONCLUSIONS ............................................................................... 72
6.0 REFERENCES ................................................................................. 72 APPENDICES A DISPOSAL BARGE LOG SUMMARY FOR WLDS – JUNE 2001 TO JUNE
2004 B SEDIMENT-PROFILE IMAGES RESULTS FOR WLDS – JUNE 2004 SURVEY INDEX
iii
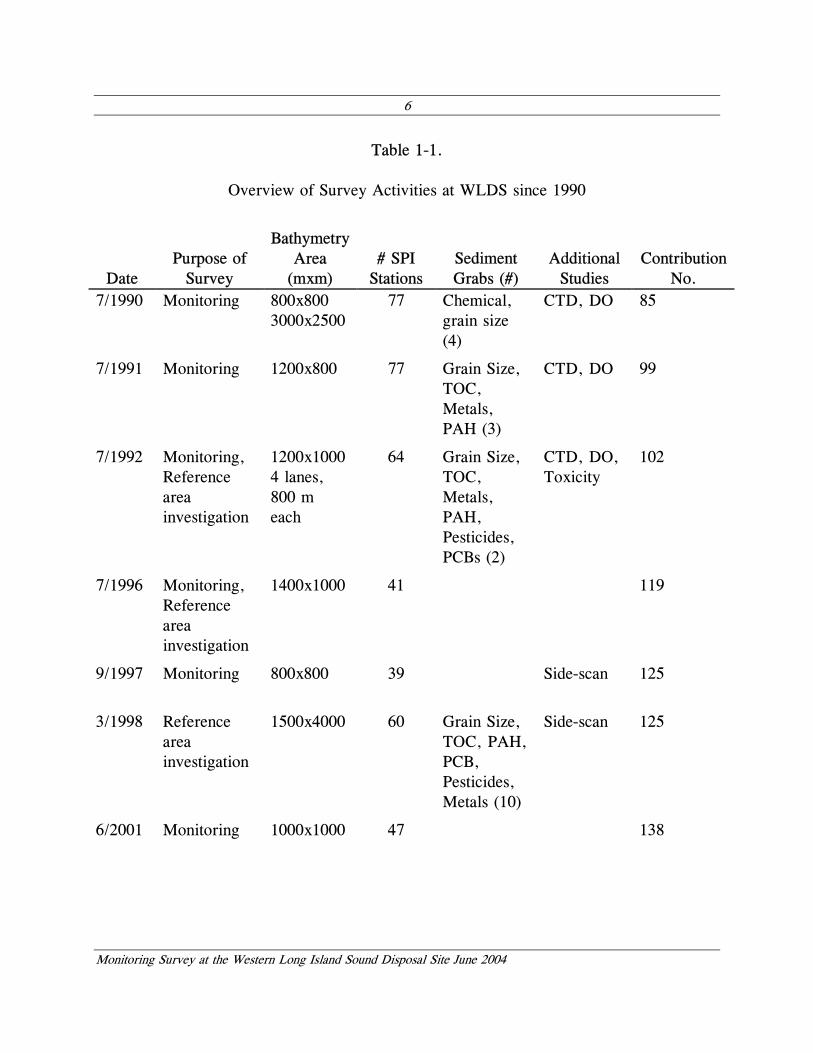
LIST OF TABLES Page Table 1-1. Overview of Survey Activities at WLDS since 1990............................ 6
Table 1-2. Overview of Recent Disposal Activity at WLDS ............................... 10
Table 1-3. Summary of Dredged Material Chemistry Data for WLDS Disposals, 2001-2004............................................................................... 11
Table 2-1. June 2004 WLDS Field Activities Summary..................................... 15
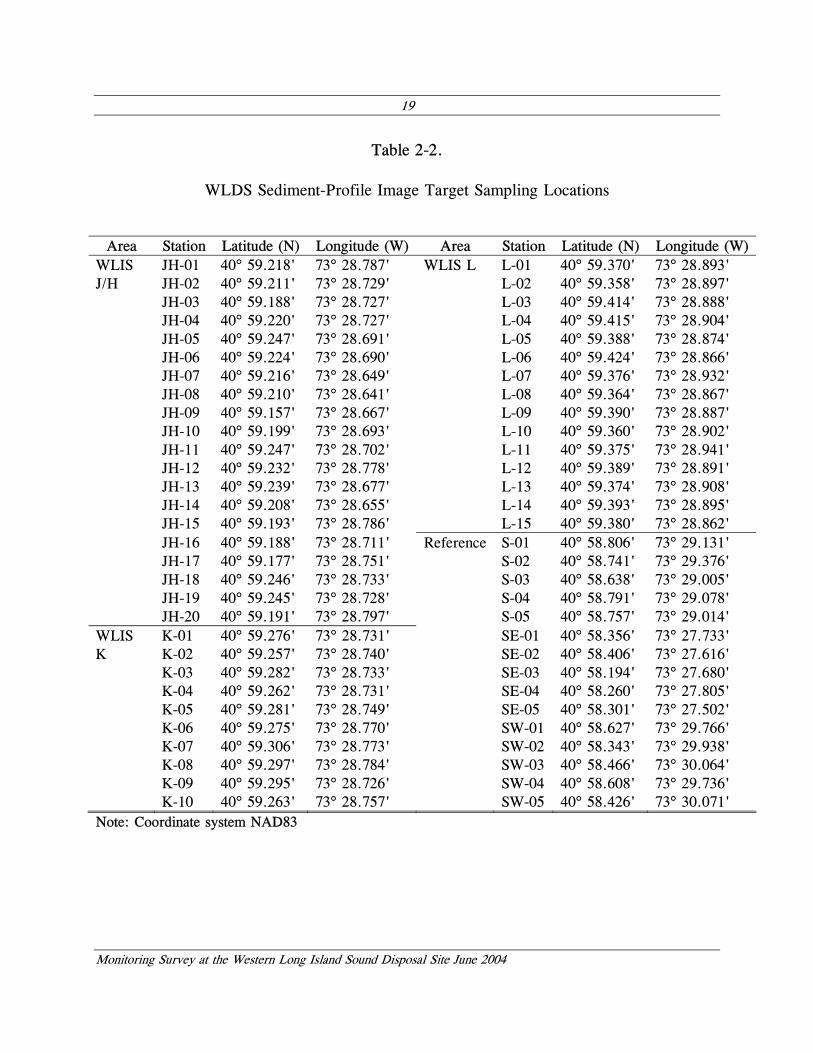
Table 2-2. WLDS Sediment-Profile Image Target Sampling Locations .................. 19
Table 2-3. Organism-Sediment Index (OSI) Terms and Formulation ..................... 25
Table 3-1. Summary of SPI Results for WLDS Reference Areas, June 2004........... 35
Table 3-2. Summary of SPI Results for the WLIS J/H Mound Complex, June 2004...................................................................................... 41
Table 3-3. Summary of SPI Results for the WLIS K Mound, June 2004 ................ 53
Table 3-4. Summary of SPI Results for the WLIS L Mound, June 2004 ................ 54
Table 3-5. Summary of Station Means by Sampling Location ............................. 64
Table 3-6. Summary of Statistics and Results of Equivalence Testing for RPD Values ................................................................................... 67
Table 3-7. Summary of Statistics and Results of Equivalence Testing for OSI Values ................................................................................... 70
iv
LIST OF FIGURES Page Figure 1-1. Location of the Western Long Island Sound Disposal Site..................... 3
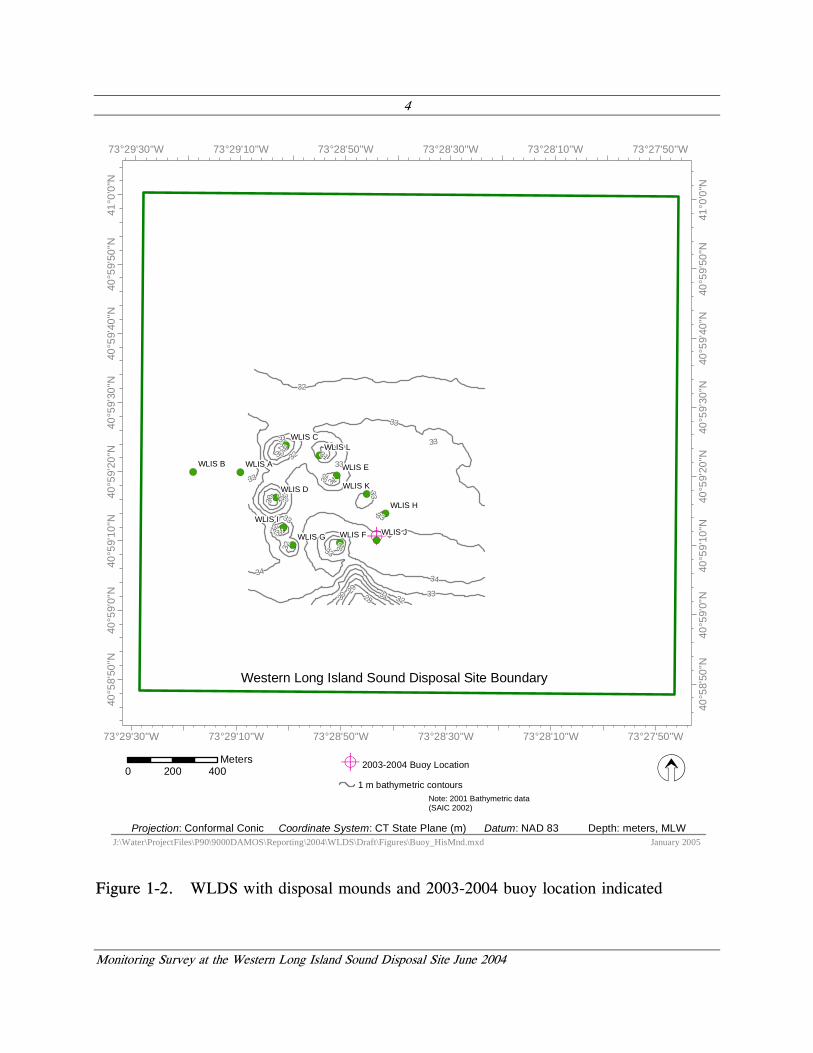
Figure 1-2. WLDS with disposal mounds and 2003-2004 buoy location indicated ....... 4
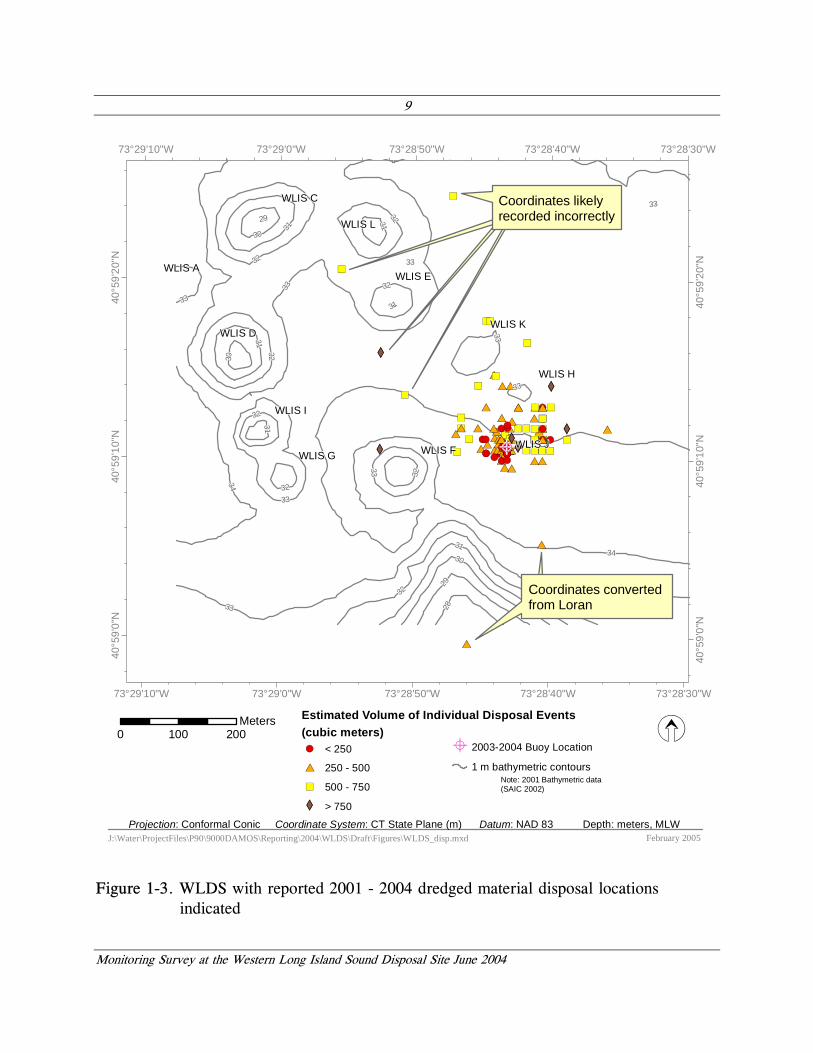
Figure 1-3. WLDS with reported 2001 - 2004 dredged material disposal locations indicated.................................................................................. 9
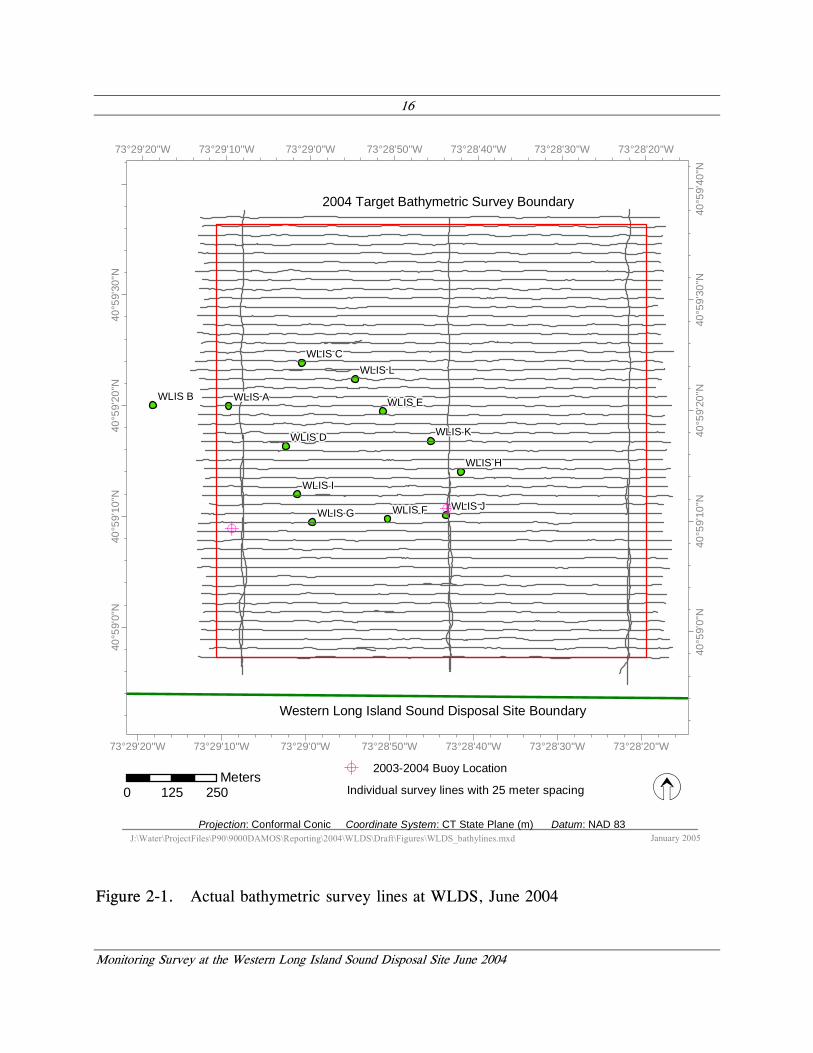
Figure 2-1. Actual bathymetric survey lines at WLDS, June 2004 ......................... 16
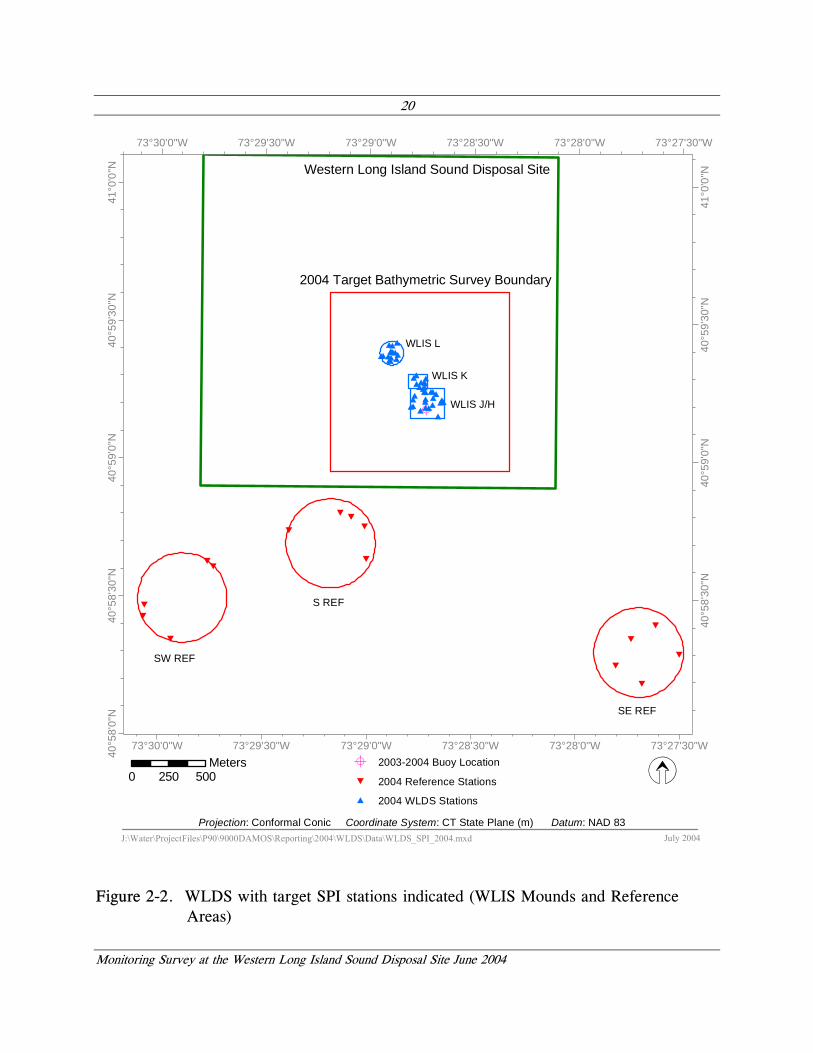
Figure 2-2. WLDS with target SPI stations indicated (WLIS Mounds and Reference Areas).................................................................................... 20
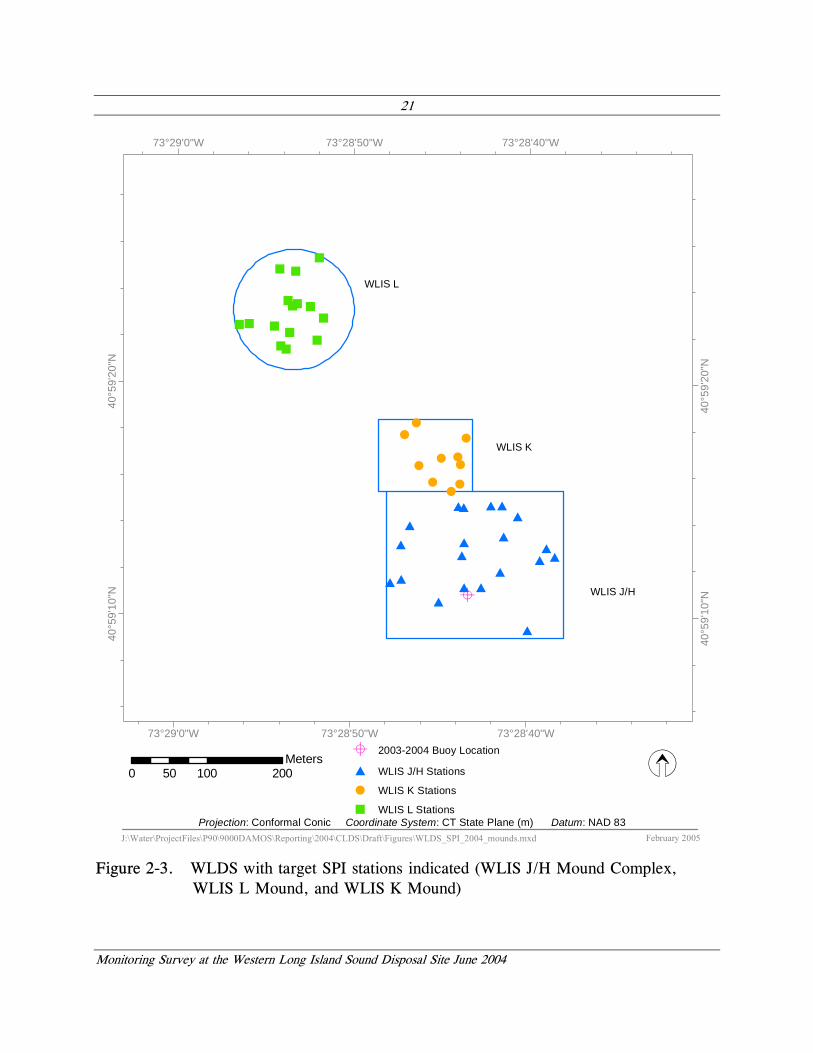
Figure 2-3. WLDS with target SPI stations indicated (WLIS J/H Mound Complex, WLIS L Mound, and WLIS K Mound) ........................................... 21
Figure 3-1. Bathymetric contour map of WLDS survey area, June 2004 (1.0-m contour interval) ................................................................................. 30
Figure 3-2. Bathymetric contour map of the WLIS J/H Mound Complex, June 2004 (0.25-m contour interval) ............................................................ 31
Figure 3-3. Bathymetric contour map of WLDS survey area, June 2001 (1.0-m contour interval) ................................................................................. 32
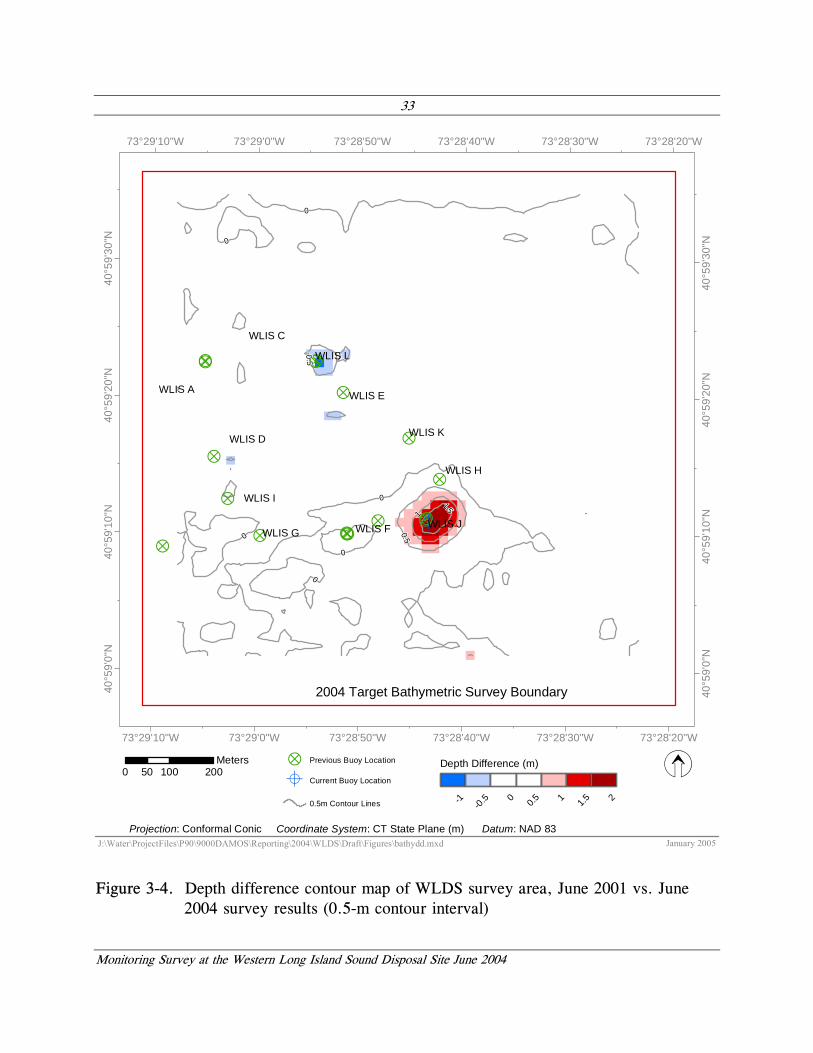
Figure 3-4. Depth difference contour map of WLDS survey area, June 2001 vs. June 2004 survey results (0.5-m contour interval) .................................... 33
Figure 3-5. Sediment-profile image from Station S-03 showing a surface layer of silty, very fine sand on top of a mud (>4 phi) facies................................. 36
Figure 3-6. Distribution of mean apparent RPD depths (cm) at the WLDS reference areas ..................................................................................... 38
Figure 3-7. SPI from S REF-03 showing a surface layer of very fine sand, a deep apparent mean RPD (4.0 cm), and a prominent burrow that is evidence of active, bioturbating infauna.......................................................... 39
Figure 3-8. Distribution of infaunal successional stages at the WLDS reference areas. 40
Figure 3-9. SPI images from WLIS J/H showing heterogeneous nature of the recently deposited dredged material.. ........................................................ 42
Figure 3-10. Examples of distinct allochthonous sediment layering from disposal activities. . .............................................................................. 43
Figure 3-11. Images showing the heterogeneity in sediment type from the recent disposal activities, which affected the camera’s prism penetration. .................. 44
LIST OF FIGURES (continued) Page
v
Figure 3-12. Sediment-profile image from Station JH-05. . .................................. 46
Figure 3-13. Map of mean apparent RPD depths (cm) at the WLIS J/H Mound Complex, June 2004 .................................................................. 47
Figure 3-14. Sediment-profile image from Station JH-7 showing highly-reduced subsurface sediments and distinct layering from recent, sequential disposal events; despite the relatively recent disturbance, advanced recolonization has already occurred with a relatively deep (2.8 cm) apparent RPD........ 48
Figure 3-15. Distribution of infaunal successional stages at the WLIS J/H Mound Complex, June 2004 .................................................................. 49
Figure 3-16. Evidence of both recent disposal activity and advanced benthic recolonization are apparent in these images from WLIS J/H.. ............... 50
Figure 3-17. Distribution of OSI values at the WLIS J/H Mound Complex, June 2004 ............................................................................... 51
Figure 3-18. Representative SPI images from the WLIS K Mound illustrating the two common sediment grain-size distributions found on this mound.. ........... 55
Figure 3-19. SPI images from the WLIS L Mound illustrating two of the sediment grain-size distributions found on this mound.. .......................................... 56
Figure 3-20. SPI image from Station L-09 showing large small-scale surface relief from a deposited clay clump; surface roughness elements such as these often provide an attractive habitat/foraging area for mobile epifauna (note shrimp in overlying water). ................................................................... 57
Figure 3-21. SPI image from Station K-07 shows a well-developed redox layer and a diverse benthic community both above and below the sediment surface. .. 59
Figure 3-22. Distribution of infaunal successional stages at the WLIS K and WLIS L Mounds, June 2004 ................................................................... 60
Figure 3-23. SPI images showing the most common successional sere found at both mounds, a Stage I on III assemblage.. ............................................ 61
Figure 3-24. Distribution of OSI values at the WLIS K and WLIS L Mounds, June 2004 ............................................................................... 62
Figure 3-25. Box plots showing distribution of OSI and RPD station measurements..... 63
Figure 3-26. Distribution of mean apparent RPD depths (cm) at the WLIS K and WLIS L Mounds, June 2004 ................................................................ 66
LIST OF FIGURES (continued) Page
vi
Figure 3-27. Normal probability plot of area residuals (observations minus area mean) for OSI values.......................................................................... 68
vii
EXECUTIVE SUMMARY
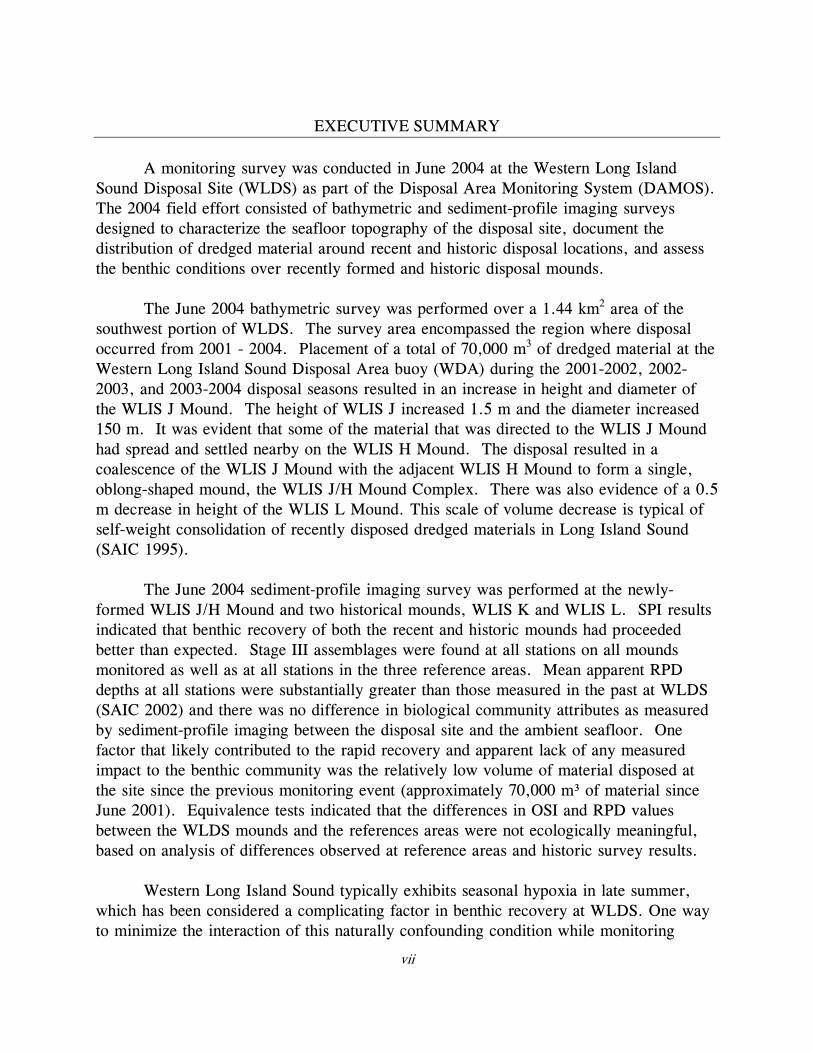
A monitoring survey was conducted in June 2004 at the Western Long Island Sound Disposal Site (WLDS) as part of the Disposal Area Monitoring System (DAMOS). The 2004 field effort consisted of bathymetric and sediment-profile imaging surveys designed to characterize the seafloor topography of the disposal site, document the distribution of dredged material around recent and historic disposal locations, and assess the benthic conditions over recently formed and historic disposal mounds.
The June 2004 bathymetric survey was performed over a 1.44 km2 area of the
southwest portion of WLDS. The survey area encompassed the region where disposal occurred from 2001 - 2004. Placement of a total of 70,000 m3 of dredged material at the Western Long Island Sound Disposal Area buoy (WDA) during the 2001-2002, 2002-2003, and 2003-2004 disposal seasons resulted in an increase in height and diameter of the WLIS J Mound. The height of WLIS J increased 1.5 m and the diameter increased 150 m. It was evident that some of the material that was directed to the WLIS J Mound had spread and settled nearby on the WLIS H Mound. The disposal resulted in a coalescence of the WLIS J Mound with the adjacent WLIS H Mound to form a single, oblong-shaped mound, the WLIS J/H Mound Complex. There was also evidence of a 0.5 m decrease in height of the WLIS L Mound. This scale of volume decrease is typical of self-weight consolidation of recently disposed dredged materials in Long Island Sound (SAIC 1995).
The June 2004 sediment-profile imaging survey was performed at the newly-
formed WLIS J/H Mound and two historical mounds, WLIS K and WLIS L. SPI results indicated that benthic recovery of both the recent and historic mounds had proceeded better than expected. Stage III assemblages were found at all stations on all mounds monitored as well as at all stations in the three reference areas. Mean apparent RPD depths at all stations were substantially greater than those measured in the past at WLDS (SAIC 2002) and there was no difference in biological community attributes as measured by sediment-profile imaging between the disposal site and the ambient seafloor. One factor that likely contributed to the rapid recovery and apparent lack of any measured impact to the benthic community was the relatively low volume of material disposed at the site since the previous monitoring event (approximately 70,000 m³ of material since June 2001). Equivalence tests indicated that the differences in OSI and RPD values between the WLDS mounds and the references areas were not ecologically meaningful, based on analysis of differences observed at reference areas and historic survey results.
Western Long Island Sound typically exhibits seasonal hypoxia in late summer, which has been considered a complicating factor in benthic recovery at WLDS. One way to minimize the interaction of this naturally confounding condition while monitoring
EXECUTIVE SUMMARY (continued)
viii
benthic community recovery at WLDS is to carry out the DAMOS monitoring surveys before dissolved oxygen concentrations drop below a critical threshold (<3 mg/l) (Diaz and Rosenberg 1995; Ritter and Montagna 1999). By conducting the 2004 WLDS monitoring survey in late June, before hypoxia set in, this critical period was avoided, and expected recovery of both the recent and historic mounds was not only met but exceeded.
1
Monitoring Survey at the Western Long Island Sound Disposal Site June 2004
1.0 INTRODUCTION
A monitoring survey was conducted at the Western Long Island Sound Disposal Site in June 2004 as part of the U.S. Army Corps of Engineers (USACE) New England District (NAE) Disposal Area Monitoring System (DAMOS). DAMOS is a comprehensive monitoring and management program designed and conducted to address environmental concerns associated with use of open-water disposal sites throughout the New England region. An introduction to the DAMOS Program and the Western Long Island Sound Disposal Site, including a brief description of previous dredged material disposal activities and previous monitoring surveys, is provided below.
1.1 Overview of the DAMOS Program
The DAMOS Program features a tiered management protocol designed to ensure that any potential adverse environmental impacts associated with dredged material disposal activities are promptly identified and addressed (Germano et al. 1994). For over 25 years, the DAMOS Program has collected and evaluated disposal site data throughout New England. Based on these data, patterns of physical, chemical, and biological responses of seafloor environments to dredged material disposal activity have been documented (Fredette and French 2004).
DAMOS monitoring surveys are designed to test hypotheses related to expected
physical and ecological response patterns following placement of dredged material on the seafloor at established disposal sites. Thus, the data collected during DAMOS monitoring surveys provide answers to strategic management questions. The results of each monitoring survey are evaluated to determine the next step in the disposal site environmental management process.
Two primary goals of DAMOS monitoring surveys have been to document the
physical location of dredged material placed on the seafloor and to evaluate the environmental impact of placement of the dredged material. Sequential bathymetric measurements are made to characterize the height and spread of discrete dredged material deposits or mounds created at disposal sites, and sediment-profile imaging (SPI) surveys are performed to help delineate the spread of dredged material and support evaluation of seafloor (benthic) habitat conditions and recovery over time. Each type of data collection activity is conducted periodically at disposal sites, and the response of the benthic community is evaluated. The conditions found after a specific set of disposal operations are compared to data from previous surveys (Germano et al. 1994). DAMOS monitoring surveys may also feature additional types of data collection activities, such as side-scan sonar and sediment coring, as deemed appropriate to achieve specific survey objectives.
2
Monitoring Survey at the Western Long Island Sound Disposal Site June 2004
1.2 Introduction to the Western Long Island Sound Disposal Site
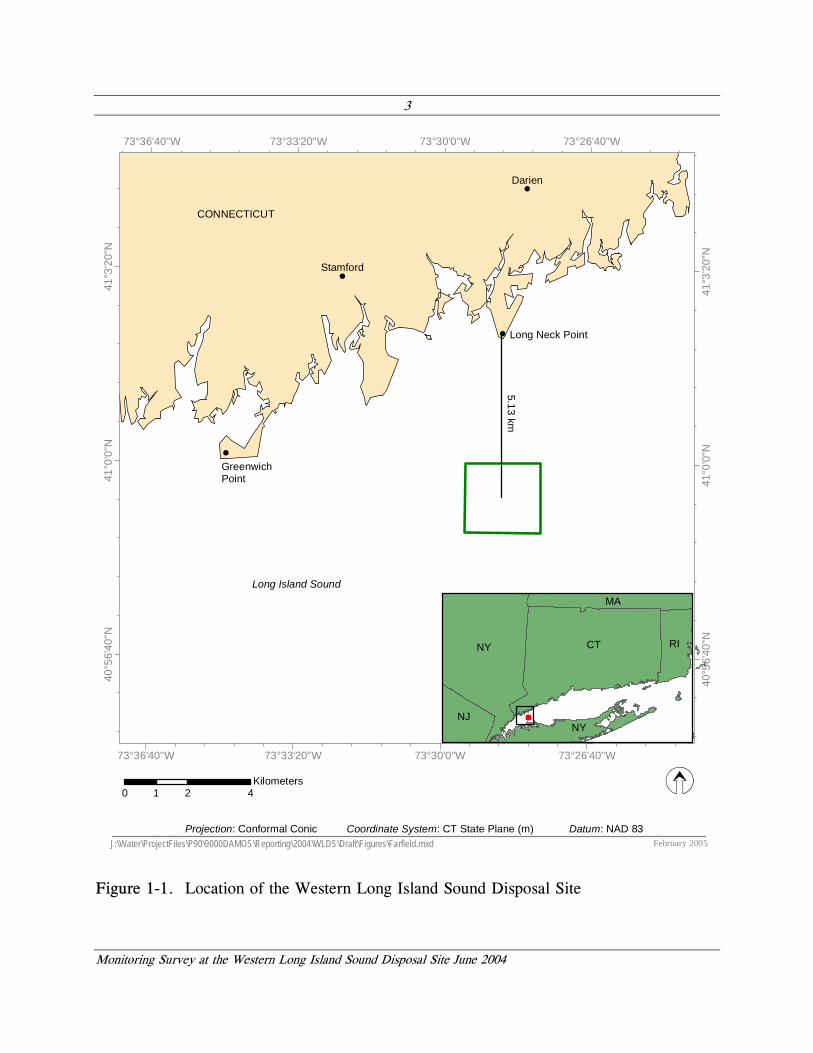
The Western Long Island Sound Disposal Site (WLDS, historically referred to as WLIS) is one of four regional dredged material disposal sites located in the waters of Long Island Sound (Figure 1-1). WLDS is situated approximately 5 km south of Long Neck Point, Noroton, Connecticut. WLDS was officially opened in 1982 as the single active dredged material disposal site in the Western Long Island Sound region (USACE 1982). This 5.29 km2 site, centered at 40° 59.406' N, 73° 28.624' W (NAD 83), has accepted small to moderate volumes of dredged material originating from Stamford, Norwalk, Mamaroneck, New Rochelle, and other coastal communities of Connecticut and New York (SAIC 2002) (Figure 1-1).
The management strategy at WLDS and other DAMOS sites in recent years has
involved the controlled placement of sediment to form individual disposal mounds arranged in a ring on the seafloor. These mounds have been monitored individually to assess stability, thickness of dredged material, and benthic recolonization status relative to previous survey results and in comparison with nearby reference areas. The ring of disposal mounds form a containment cell that could subsequently be used for large-scale confined aquatic disposal (CAD) operations. The containment cells aid in limiting the lateral spread of dredged material (Fredette, 1994). Although the first containment cell at WLDS has not been completed, such containment cells have proven useful at confining the spread of dredged material deposits and facilitating efficient coverage of unacceptably contaminated dredged material (UDM) with capping dredged material (CDM) at the NHAV 93 Mound located within the Central Long Island Sound Disposal Site (CLDS).
The majority of disposal activity at WLDS has been confined to the southwest
quadrant of the site. Twelve dredged material disposal mounds have been identified within WLDS (Figure 1-2). A brief description of the mounds and their origin is provided below. In general, the Western Long Island Sound Disposal Area buoy (WDA) is used to identify the current disposal location within the disposal site. It is typically deployed for an eight-month period, with initial deployment in the fall and recovery in the spring of the following year. The location of the buoy for each disposal season is driven by the effort to form a ring of disposal mounds for the development of containment cells and is therefore dependent on the amount of material disposed and the morphology of the mound created during the prior disposal season.
Disposal site boundaries have been established to provide a defined area for
placement of dredged material on the seafloor. Barge operators are given specific coordinates (and often visible lighted buoys) within the disposal boundaries to navigate to and release their cargo of dredged material. In practice, it is expected that barge disposal
3
Monitoring Survey at the Western Long Island Sound Disposal Site June 2004
!
!
! Long Neck Point
5.13 km
CONNECTICUT
Greenwich Point
!
Long Island Sound
Darien
Stamford
73°36'40"W
73°36'40"W
73°33'20"W
73°33'20"W
73°30'0"W
73°30'0"W
73°26'40"W
73°26'40"W
40°5
6'40
"N
40°5
6'40
"N
41°0
'0"N
41°0
'0"N
41°3
'20"
N
41°3
'20"
N
Projection: Conformal Conic Coordinate System: CT State Plane (m) Datum: NAD 83
Z
February 2005
CTNY RI
NJNY
MA
J:\Water\ProjectFiles\P90\9000DAMOS\Reporting\2004\WLDS\Draft\Figures\Farfield.mxd
0 2 41Kilometers
Figure 1-1. Location of the Western Long Island Sound Disposal Site
4
Monitoring Survey at the Western Long Island Sound Disposal Site June 2004
A
!(
!(
!(
!(
!(
!(
!(
!(
!(
!(
!( !(
Western Long Island Sound Disposal Site Boundary
33
32
34
313029 28
33
32
3233
32
3231
30
33 3232
3331
33
34
3233
3130WLIS AWLIS B
WLIS K
WLIS G
WLIS C
WLIS F
WLIS H
WLIS I
WLIS E
29 33
31
33
32
31
WLIS L
WLIS D
WLIS J
73°29'30"W
73°29'30"W
73°29'10"W
73°29'10"W
73°28'50"W
73°28'50"W
73°28'30"W
73°28'30"W
73°28'10"W
73°28'10"W
73°27'50"W
73°27'50"W
40°5
8'50
"N
40°5
8'50
"N
40°5
9'0"
N
40°5
9'0"
N
40°5
9'10
"N
40°5
9'10
"N
40°5
9'20
"N
40°5
9'20
"N
40°5
9'30
"N
40°5
9'30
"N
40°5
9'40
"N
40°5
9'40
"N
40°5
9'50
"N
40°5
9'50
"N
41°0
'0"N
41°0
'0"N
J:\Water\ProjectFiles\P90\9000DAMOS\Reporting\2004\WLDS\Draft\Figures\Buoy_HisMnd.mxd
Z
January 2005
0 400200Meters
Projection: Conformal Conic Coordinate System: CT State Plane (m) Datum: NAD 83 Depth: meters, MLW
A 2003-2004 Buoy Location
1 m bathymetric contoursNote: 2001 Bathymetric data (SAIC 2002)
Figure 1-2. WLDS with disposal mounds and 2003-2004 buoy location indicated
5
Monitoring Survey at the Western Long Island Sound Disposal Site June 2004
will occur in a cluster around the buoy location and that some dredged material will be lost in the water column during release. The Clean Water Act Section (404)(b)(1) provides guidelines for the discharge of dredged material and defines the “discharge point” as the point within the disposal site (the bottom surface area and any overlying volume of water) at which the dredged material is released. The Marine Protection, Research and Sanctuaries Act Section 102 defines the release zone as a locus of points 100 m around the barge from beginning to end of the discharge. Monitoring objectives recognize that the site boundary is a target area for release at the water’s surface, and that during descent and placement some dredged material may extend across the boundary on the seafloor.
1.3 Historic Dredged Material Disposal Activity
WLDS has been used regularly as a regional disposal site since 1982, receiving a total of over 1 million m3 of dredged material. Twelve distinct mounds (WLIS A through L Mounds, Figure 1-2) have been developed on the seafloor in the southwest quadrant of WLDS. The WLIS A and WLIS B Mounds were formed first, prior to the management decision to form a ring of mounds. Placement of dredged material at WLDS between 1986 and 1996 resulted in the formation of a ring of six disposal mounds (WLIS C, WLIS D, WLIS E, WLIS F, WLIS G, and WLIS I Mounds) partially enclosing a containment cell approximately 0.3 km2 in area in the central southwestern region of WLDS (SAIC 2002) (Figure 1-2).
Between 1997 and 2001, the WDA buoy was deployed in an effort to refine the
structure of the containment cell. During the 1997-1998 disposal season, placement of 10,700 m3 of dredged material resulted in the formation of the WLIS J Mound, between the WLIS H and WLIS F Mounds. During the 1998-1999 disposal season, placement of 33,500 m3 of dredged material resulted in the formation of WLIS K, between the WLIS E and WLIS H Mounds (Figure 1-2) (SAIC 2002).
The WLIS L Mound developed from multiple disposal events during the 1999-
2000 and 2000-2001 disposal seasons. An estimated volume of 16,500 m3 of dredged material deposited during the 1999-2000 disposal season combined with the deposit of approximately 39,000 m3 of dredged material during the 2000-2001 disposal season resulted in the formation of a moderate-sized bottom feature on the seafloor, approximately 32.5 m in diameter and 2.75 m in height (Figure 1-2) (SAIC 2002).
1.4 Previous WLDS Monitoring Events
Monitoring surveys have been conducted at WLDS since 1978. A list of monitoring events that have occurred since 1990 is presented in Table 1-1. The most
6
Monitoring Survey at the Western Long Island Sound Disposal Site June 2004
Table 1-1.
Overview of Survey Activities at WLDS since 1990
Date Purpose of
Survey
BathymetryArea
(mxm) # SPI
Stations Sediment Grabs (#)
Additional Studies
Contribution No.
7/1990 Monitoring 800x800 3000x2500
77 Chemical, grain size (4)
CTD, DO 85
7/1991 Monitoring 1200x800 77 Grain Size, TOC, Metals, PAH (3)
CTD, DO 99
7/1992 Monitoring, Reference area investigation
1200x1000 4 lanes, 800 m each
64 Grain Size, TOC, Metals, PAH, Pesticides, PCBs (2)
CTD, DO, Toxicity
102
7/1996 Monitoring, Reference area investigation
1400x1000 41 119
9/1997 Monitoring 800x800 39 Side-scan
125
3/1998 Reference area investigation
1500x4000 60 Grain Size, TOC, PAH, PCB, Pesticides, Metals (10)
Side-scan 125
6/2001 Monitoring 1000x1000 47 138
7
Monitoring Survey at the Western Long Island Sound Disposal Site June 2004
recent monitoring survey (prior to the present survey) was conducted at WLDS in June 2001 and included a single-beam bathymetric survey and sediment profile imaging survey (SAIC 2002). In 2001, the bathymetric survey was performed over a 1 km2 area near the western edge of WLDS, encompassing previously identified disposal mounds (WLIS C, WLIS D, WLIS E, WLIS F, WLIS G, WLIS H, and WLIS I) and newly formed mounds (WLIS J, WLIS K, and WLIS L) (Figure 1-2). The survey also depicted the prominent natural ridge along the seafloor in the southern portion of WLDS. The three new mounds (WLIS J, K, and L) were created as a result of disposal operations during the 1997-2001 seasons. Of the three mounds (WLIS J, K and L), the WLIS J Mound was deemed of insufficient height and width to be useful as a containment structure; the WLIS K and L Mounds were much larger in comparison. As a result, it was recommended that future disposal activity be directed to the WLIS J Mound (SAIC 2002).
The 2001 SPI survey was performed over an area of WLDS that had received dredged material since 1997, encompassing the WLIS J, K and L Mounds. RPD depths were characterized as shallow to moderate (1.1 to 2.8 cm). However, the successional stage status was advanced, with Stage III activity present at all stations and median OSI values ranging from +6 to +11 (SAIC 2002).
Sediment-profile imaging was also conducted over the WLIS I Mound to assess
benthic conditions five years after its formation, as well as two stations at the WLIS D Mound, where variable benthic conditions were observed in the past. Despite relatively shallow RPD depths (0.8 to 2.0 cm), Stage III activity was detected at all stations on both mounds, and the median OSI values were similar to values found at the reference areas.
Earlier DAMOS monitoring surveys at WLDS were conducted in July 1996
(Morris 1998), September 1997 and March 1998 (Murray and Saffert 1999). The 1996 and 1997 surveys involved the use of both single-beam bathymetric and SPI surveys to monitor the development, stability, and benthic conditions of the disposal mounds. The 1998 survey focused on investigating potential sites for a new reference area to represent ambient conditions for the region and included sediment chemistry, SPI, and side-scan sonar analysis.
Slow benthic community recovery and patchy recolonization have been
characteristic of WLDS in the past when monitored during the summer months (Germano et al. 1993; Eller and Williams 1996). The most likely causes for these past aberrant recovery profiles were the high concentrations of organic carbon in the sediment with its associated high sediment oxygen demand (Eller and Williams 1996) as well as the seasonal hypoxia which occurs in this area of the Sound in the late summer (Anderson and Taylor 2001). However, the 2001 SPI survey, conducted 24-25 June, found no
8
Monitoring Survey at the Western Long Island Sound Disposal Site June 2004
evidence of increased organic loading, and Stage III taxa were present at a majority (83%) of the stations sampled (SAIC 2002).
1.5 Recent Dredged Material Disposal Activity
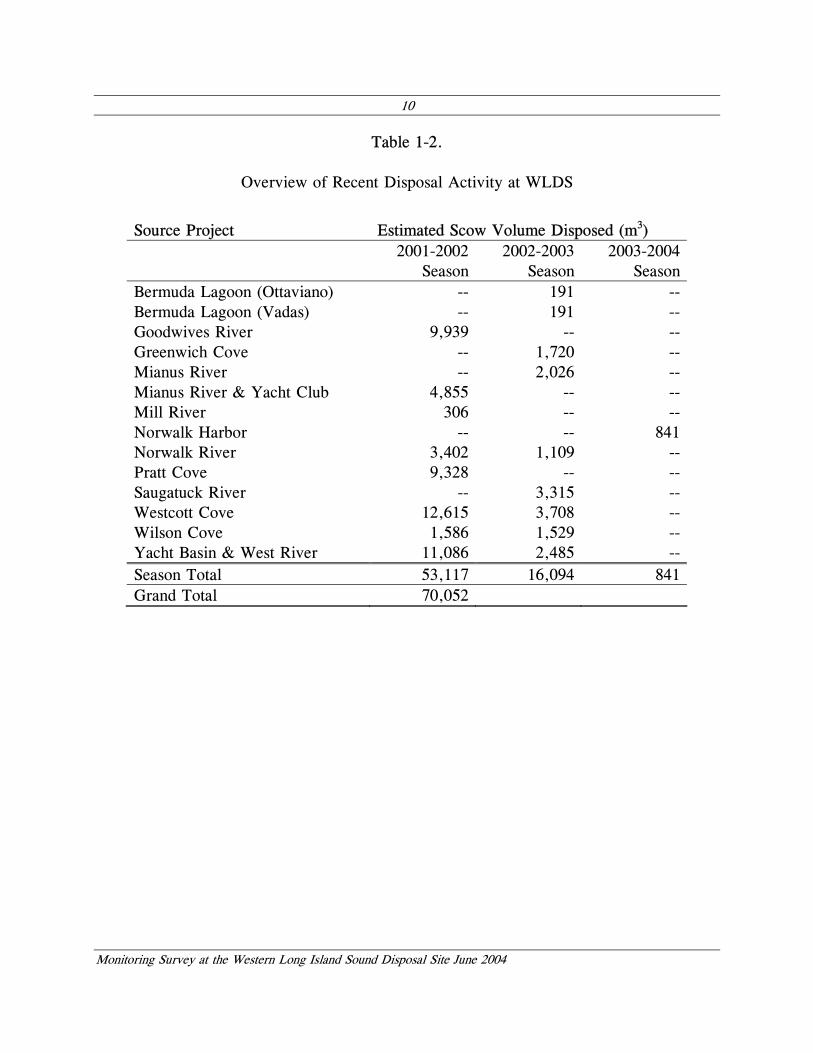
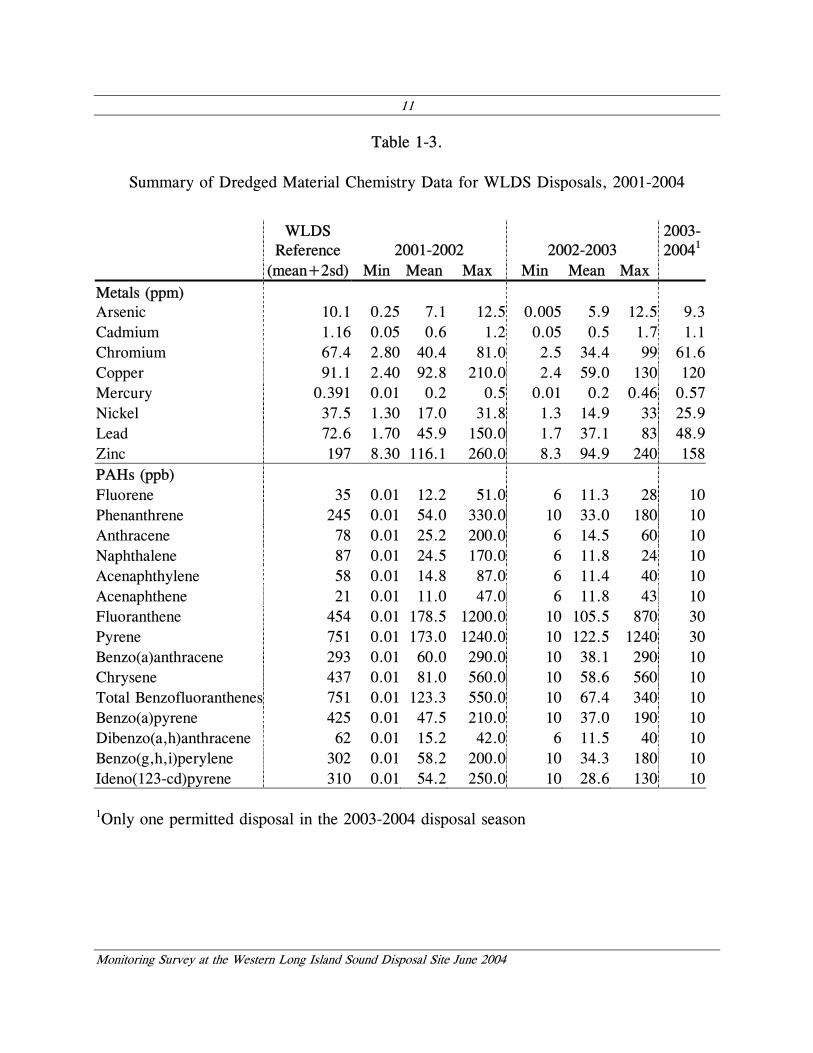
Since the June 2001 survey, approximately 70,000 m3 of dredged material has been placed at the WLIS J Mound (Figure 1-3, Table 1-2). During the 2001-2002 season, 53,000 m3 of dredged material was placed at the WDA buoy located at 40° 59.186' N, 73° 28.722' W (NAD 83). The dredged material originated from various coves, rivers, and yacht clubs. During the 2002-2003 season, approximately 16,000 m3 of dredged material was disposed at the same location as during the 2001-2002 season. During the 2003-2004 season the WDA buoy was located at 40° 59.183' N, 73° 28.692' W (NAD 83), approximately the same location as during the 2001-2002 and 2002-2003 disposal seasons (Figure 1-3). Only 840 m3 of dredged material was disposed at the WLIS J Mound during the 2003-2004 season, originating from the Norwalk Harbor dredging project. A summary of the chemical analysis data performed by each project to support the disposal permit application and a comparison of these data to WLDS reference data are presented in Table 1-3. A detailed record of barge disposal activity at WLDS for the period from June 2001 to June 2004, including the origin of dredged material, the volume deposited, and the disposal location is provided in Appendix A.
1.6 Survey Objectives
The June 2004 WLDS survey was designed to characterize the seafloor topography of the area and assess the benthic conditions over both recently formed and historic disposal mounds. Specific survey objectives included documentation of the distribution of dredged material around all recent and historical disposal locations within WLDS using single-beam bathymetry and assessment of the benthic recolonization status of the WLIS H, J, K and L Mounds relative to reference conditions using SPI.
The design of the June 2004 survey allowed assessment of the following
expectations:
• The placement of 70,000 m3 of dredged material at the WDA buoy during the 2001-2002 and 2002-2003 disposal seasons will result in an increase in height and diameter of the WLIS J Mound. The mound is expected to be approximately 500 m in diameter and 2 m in height;
• Historic mounds will show limited change in elevation except for the most recently created mounds that should show some evidence of continued consolidation; and
9
Monitoring Survey at the Western Long Island Sound Disposal Site June 2004
!(#*
!(
#*
#*#*
#*#*#* #*
#*
#*#*#*#*
#*
#*
#*
#* #*#*
#*#*#*#*#*#*#*#*#*#*#*#*#*
#*
")#*
#*#*
")
XW
XW
")
")
#*
")
")XW
")
XW
")
#*
")
")
")
")")
")
")
")
")")")
#*
")
!(
")
")")
")#*")
")")
#*
#*!(#*#*")
")")
")") #*
#*
#*#*#*#*#*#*#*
!(
!(#*#*#*#*#*#*#*#*
!(
!(
#*#* !(!(#*
#*
!(
#*
#*#*")
#*
")
#*
#*
#* ")
#*
XWXW!(#*!(!(!(
")
")
")
")
")
")
#*#* #*#*
#*
!(
#*
#*#*#*#*!(!(!(!(!(!(#*#*!(!(!(!(!(!(!(!(
!(!(
!(
!(!(!(!(!(!(!(!(!(!(!(
!(!(!(!(!(!(A
Coordinates converted from Loran
Coordinates likely recorded incorrectly
33
34
32
3130
2928
32
33
33
34
31
30
3232
33
32
31
33
33
32
31
32
32
33
33
31
30
WLIS A
WLIS K
WLIS L
WLIS G
WLIS C
WLIS D
WLIS F
WLIS H
WLIS I
WLIS J
WLIS E
29
33
31
73°29'10"W
73°29'10"W
73°29'0"W
73°29'0"W
73°28'50"W
73°28'50"W
73°28'40"W
73°28'40"W
73°28'30"W
73°28'30"W
40°5
9'0"
N
40°5
9'0"
N
40°5
9'10
"N
40°5
9'10
"N
40°5
9'20
"N
40°5
9'20
"N
J:\Water\ProjectFiles\P90\9000DAMOS\Reporting\2004\WLDS\Draft\Figures\WLDS_disp.mxd
Z
February 2005
Estimated Volume of Individual Disposal Events (cubic meters)!( < 250
#* 250 - 500
") 500 - 750
XW > 750
0 200100Meters
Projection: Conformal Conic Coordinate System: CT State Plane (m) Datum: NAD 83 Depth: meters, MLW
Note: 2001 Bathymetric data (SAIC 2002)
A 2003-2004 Buoy Location
1 m bathymetric contours
Figure 1-3. WLDS with reported 2001 - 2004 dredged material disposal locations indicated
10
Monitoring Survey at the Western Long Island Sound Disposal Site June 2004
Table 1-2.
Overview of Recent Disposal Activity at WLDS
Source Project Estimated Scow Volume Disposed (m3)
2001-2002
Season2002-2003
Season 2003-2004
SeasonBermuda Lagoon (Ottaviano) -- 191 --Bermuda Lagoon (Vadas) -- 191 --Goodwives River 9,939 -- --Greenwich Cove -- 1,720 --Mianus River -- 2,026 --Mianus River & Yacht Club 4,855 -- --Mill River 306 -- --Norwalk Harbor -- -- 841Norwalk River 3,402 1,109 --Pratt Cove 9,328 -- --Saugatuck River -- 3,315 --Westcott Cove 12,615 3,708 --Wilson Cove 1,586 1,529 --Yacht Basin & West River 11,086 2,485 --Season Total 53,117 16,094 841Grand Total 70,052
11
Monitoring Survey at the Western Long Island Sound Disposal Site June 2004
Table 1-3.
Summary of Dredged Material Chemistry Data for WLDS Disposals, 2001-2004
WLDS
Reference 2001-2002 2002-2003 2003-20041
(mean+2sd) Min Mean Max Min Mean Max Metals (ppm) Arsenic 10.1 0.25 7.1 12.5 0.005 5.9 12.5 9.3Cadmium 1.16 0.05 0.6 1.2 0.05 0.5 1.7 1.1Chromium 67.4 2.80 40.4 81.0 2.5 34.4 99 61.6Copper 91.1 2.40 92.8 210.0 2.4 59.0 130 120Mercury 0.391 0.01 0.2 0.5 0.01 0.2 0.46 0.57Nickel 37.5 1.30 17.0 31.8 1.3 14.9 33 25.9Lead 72.6 1.70 45.9 150.0 1.7 37.1 83 48.9Zinc 197 8.30 116.1 260.0 8.3 94.9 240 158PAHs (ppb) Fluorene 35 0.01 12.2 51.0 6 11.3 28 10Phenanthrene 245 0.01 54.0 330.0 10 33.0 180 10Anthracene 78 0.01 25.2 200.0 6 14.5 60 10Naphthalene 87 0.01 24.5 170.0 6 11.8 24 10Acenaphthylene 58 0.01 14.8 87.0 6 11.4 40 10Acenaphthene 21 0.01 11.0 47.0 6 11.8 43 10Fluoranthene 454 0.01 178.5 1200.0 10 105.5 870 30Pyrene 751 0.01 173.0 1240.0 10 122.5 1240 30Benzo(a)anthracene 293 0.01 60.0 290.0 10 38.1 290 10Chrysene 437 0.01 81.0 560.0 10 58.6 560 10Total Benzofluoranthenes 751 0.01 123.3 550.0 10 67.4 340 10Benzo(a)pyrene 425 0.01 47.5 210.0 10 37.0 190 10Dibenzo(a,h)anthracene 62 0.01 15.2 42.0 6 11.5 40 10Benzo(g,h,i)perylene 302 0.01 58.2 200.0 10 34.3 180 10Ideno(123-cd)pyrene 310 0.01 54.2 250.0 10 28.6 130 10
1Only one permitted disposal in the 2003-2004 disposal season
12
Monitoring Survey at the Western Long Island Sound Disposal Site June 2004
Table 1-3 (continued)
Summary of Dredged Material Chemistry Data for WLDS Disposals, 2001-2004
WLDS
Reference 2001-2002 2002-2003 2003-20041
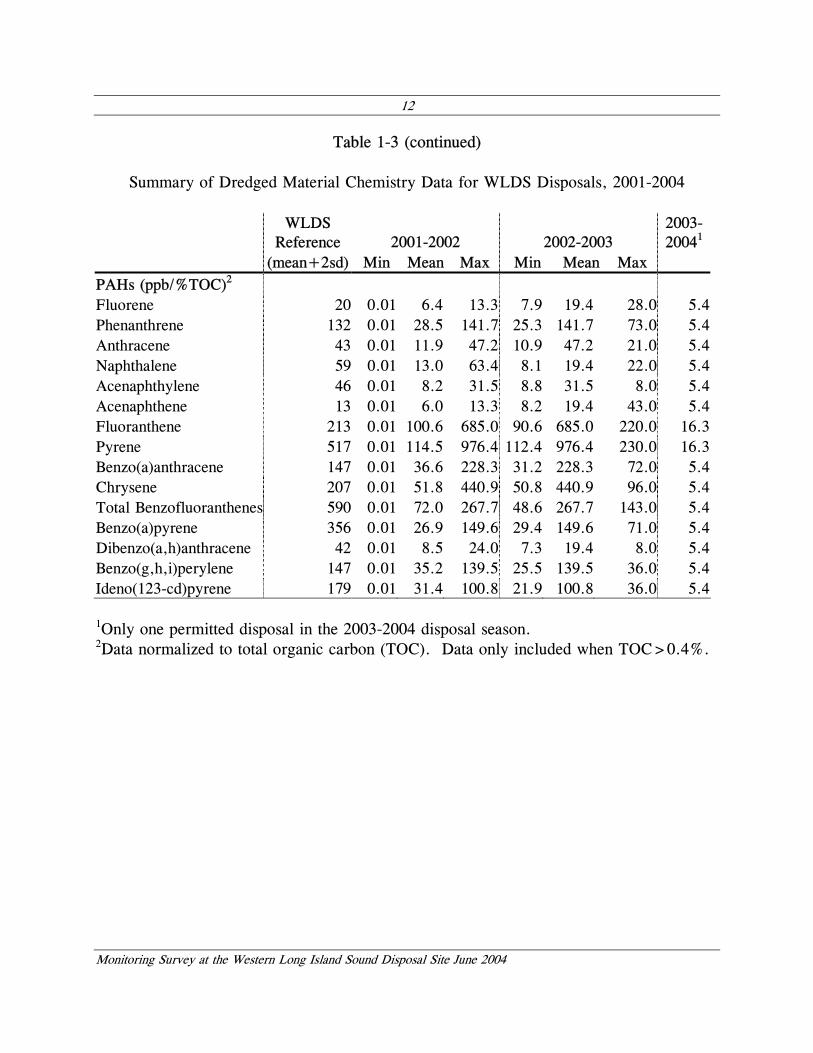
(mean+2sd) Min Mean Max Min Mean Max PAHs (ppb/%TOC)2 Fluorene 20 0.01 6.4 13.3 7.9 19.4 28.0 5.4Phenanthrene 132 0.01 28.5 141.7 25.3 141.7 73.0 5.4Anthracene 43 0.01 11.9 47.2 10.9 47.2 21.0 5.4Naphthalene 59 0.01 13.0 63.4 8.1 19.4 22.0 5.4Acenaphthylene 46 0.01 8.2 31.5 8.8 31.5 8.0 5.4Acenaphthene 13 0.01 6.0 13.3 8.2 19.4 43.0 5.4Fluoranthene 213 0.01 100.6 685.0 90.6 685.0 220.0 16.3Pyrene 517 0.01 114.5 976.4 112.4 976.4 230.0 16.3Benzo(a)anthracene 147 0.01 36.6 228.3 31.2 228.3 72.0 5.4Chrysene 207 0.01 51.8 440.9 50.8 440.9 96.0 5.4Total Benzofluoranthenes 590 0.01 72.0 267.7 48.6 267.7 143.0 5.4Benzo(a)pyrene 356 0.01 26.9 149.6 29.4 149.6 71.0 5.4Dibenzo(a,h)anthracene 42 0.01 8.5 24.0 7.3 19.4 8.0 5.4Benzo(g,h,i)perylene 147 0.01 35.2 139.5 25.5 139.5 36.0 5.4Ideno(123-cd)pyrene 179 0.01 31.4 100.8 21.9 100.8 36.0 5.4
1Only one permitted disposal in the 2003-2004 disposal season. 2Data normalized to total organic carbon (TOC). Data only included when TOC>0.4%.
13
Monitoring Survey at the Western Long Island Sound Disposal Site June 2004
• Historic mounds WLIS K and WLIS L will support an advanced benthic community relative to the 2001 survey, dominated by Stage III organisms. The historic WLIS H Mound has been subject to nearby disposal activity; as a result, the recolonization process may have slowed down, with fewer Stage III organisms expected. The directed placement of dredged material at the WLIS J Mound has likely slowed the recolonization process, and the successional status is expected to be at Stage I or II.
14
Monitoring Survey at the Western Long Island Sound Disposal Site June 2004
2.0 METHODS
A team of investigators from ENSR International, Germano and Associates, Ocean Surveys, Inc., and CR Environmental performed the June 2004 survey at WLDS. The bathymetric survey was conducted 19-20 June 2004 to assess the distribution of dredged material at WLDS. The sediment-profile imaging (SPI) survey was conducted 30 June through 1 July 2004 to assess the benthic recolonization status of the WLIS H, J, K, and L Mounds. Field activities are summarized in Table 2-1, and an overview of the methods used to collect, process, and analyze the survey data is provided below. A more detailed description of methodology and the related terminology can be found in ENSR (2004).
2.1 Navigation and On-Board Data Acquisition
Positional data, comprised of horizontal positioning (x- and y-dimensional data) and time (t-dimensional data), were collected using a Trimble 4000 series Global Positional System (GPS) receiver interfaced with a Trimble Probeacon differential beacon receiver. This system received and processed satellite and land-based beacon data and provided real-time vessel position, typically to sub-meter accuracy. Coastal Oceanographics, Inc. HYPACK® hydrographic survey software was used to acquire, integrate, and store all positional data from the DGPS as well as bathymetric and station data. The HYPACK® software also displayed real-time vessel position, bathymetric data, and SPI stations over a background electronic chart of the study area, thus enabling survey scientists to review and evaluate survey data on a real-time basis.
2.2 Bathymetry
Bathymetric surveys provide measurements of water depth that, when processed, can be used to map the seafloor topography. The processed data can also be compared with previous surveys to track changes in the size and location of seafloor features. This technique is the primary tool in the DAMOS Program for mapping the distribution of dredged material at disposal sites.
2.2.1 Bathymetric Data Collection
The 2004 single-beam bathymetric survey was designed to cover a 1200 x 1200 m area, representing approximately 1.44 km2 of the southwest portion of WLDS (Figure 2-1). The survey area encompassed the region where disposal occurred during the 2001-2002, 2002-2003 and 2003-2004 disposal seasons. The bathymetric survey was conducted 19-20 June 2004 aboard the R/V Parker. A total of 49 survey lines, each
15
Monitoring Survey at the Western Long Island Sound Disposal Site June 2004
Table 2-1.
June 2004 WLDS Field Activities Summary
Survey Type Date Summary
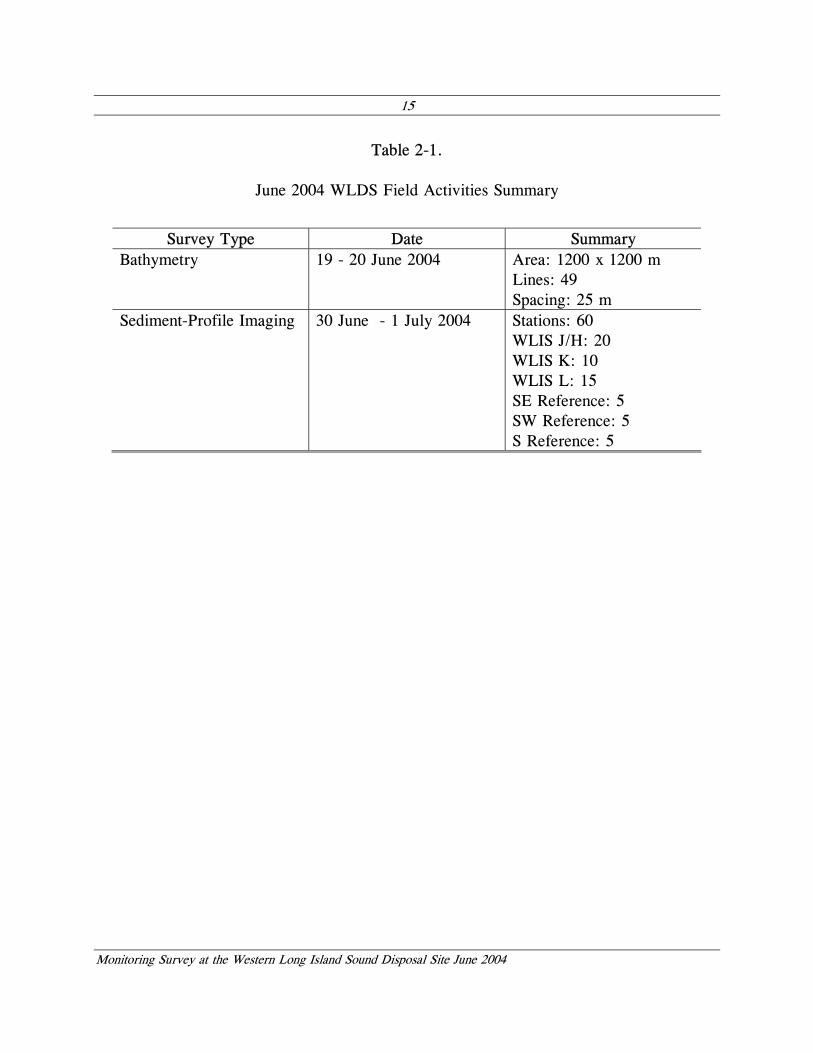
Bathymetry 19 - 20 June 2004 Area: 1200 x 1200 m Lines: 49 Spacing: 25 m
Sediment-Profile Imaging 30 June - 1 July 2004 Stations: 60 WLIS J/H: 20 WLIS K: 10 WLIS L: 15 SE Reference: 5 SW Reference: 5 S Reference: 5
16
Monitoring Survey at the Western Long Island Sound Disposal Site June 2004
!
!
!
!
!
!
!
!
!
!
! !
A
A
Western Long Island Sound Disposal Site Boundary
2004 Target Bathymetric Survey Boundary
WLIS AWLIS B
WLIS K
WLIS L
WLIS G
WLIS C
WLIS D
WLIS F
WLIS H
WLIS I
WLIS J
WLIS E
73°29'20"W
73°29'20"W
73°29'10"W
73°29'10"W
73°29'0"W
73°29'0"W
73°28'50"W
73°28'50"W
73°28'40"W
73°28'40"W
73°28'30"W
73°28'30"W
73°28'20"W
73°28'20"W
40°5
9'0"
N
40°5
9'0"
N
40°5
9'10
"N
40°5
9'10
"N
40°5
9'20
"N
40°5
9'20
"N
40°5
9'30
"N
40°5
9'30
"N40
°59'
40"N
J:\Water\ProjectFiles\P90\9000DAMOS\Reporting\2004\WLDS\Draft\Figures\WLDS_bathylines.mxd
ZJanuary 2005
0 250125Meters
Projection: Conformal Conic Coordinate System: CT State Plane (m) Datum: NAD 83
Individual survey lines with 25 meter spacingA 2003-2004 Buoy Location
Figure 2-1. Actual bathymetric survey lines at WLDS, June 2004
17
Monitoring Survey at the Western Long Island Sound Disposal Site June 2004
25 m apart, were occupied as part of the survey (Figure 2-1). Additional tie-lines were occupied perpendicular to the main survey lines to assess data quality.
Bathymetric data were collected using an Innerspace Model 448 Echo Sounder outfitted with an 8º beam, 208 kHz transducer, which achieved an accuracy of approximately 3 cm in the water depths at WLDS. Data were collected at a rate of 17 to 18 soundings per second at boat speeds of 4 to 4.5 knots, resulting in soundings spaced at less than 0.2 meter intervals along each survey transect line. Bathymetric data were recorded in feet by means of a high-resolution trace on a thermal printer in addition to the digital data stored within Hypack®. Hypack® managed data acquisition and storage of data from the echosounder and the Trimble DGPS. In addition, Hypack® recorded depth, vessel heave, heading, position, and time along each survey transect line.
Calibration procedures were conducted on-site prior to data collection as well as at
the conclusion of each survey day. The average speed of sound through the water column was calculated from salinity and temperature data obtained from a full depth cast of a CTD profiler. Additional calibration information was obtained from a bar check.
2.2.2 Bathymetric Data Processing
The bathymetric data were processed using the HYPACK® software program and included corrections for tidal conditions, local speed of sound, and spurious data points. Tidal correction consisted of transforming the raw measurements of depth below the transducer to seafloor elevation measurements relative to mean low water (MLW) using predicted tidal elevation data from Stamford, CT. Heave data supplied by the vessel’s motion reference unit was incorporated into the raw data to minimize the effects of vessel motion. The bathymetric data were also reviewed for spurious data points (clearly unrealistic measurements resulting from signal interference), and these points were removed. Once processed, the water depth data were converted to meters.
2.2.3 Bathymetric Data Analysis
Bathymetric data were analyzed to gain a better understanding of the existing conditions at the site and to document changes in seafloor topography in comparison with previous surveys. The corrected bathymetric data were analyzed using a combination of the contouring and surface plotting software program, Surfer® 8.0 and the GIS-based software package ArcView® 9.0. Using Surfer®, the processed WLDS 2004 data were gridded to a cell size of 25 m2, consistent with the bathymetric grid created for the previous (June 2001) survey (SAIC 2002). Bathymetric contour lines were then generated and displayed using ArcView®.
18
Monitoring Survey at the Western Long Island Sound Disposal Site June 2004
Surfer® was also used to calculate a depth-difference grid based on the June 2001 and June 2004 bathymetric data sets. This grid was calculated by subtracting the June 2001 interpolated depth estimates from the June 2004 depth estimates at each point throughout the grid. The resulting depth differences were contoured and displayed using ArcView®.
2.3 Sediment-Profile Imaging
Sediment-profile imaging is a monitoring technique used to provide data on the physical characteristics of the seafloor as well as the status of the benthic biological community. The technique involves deploying an underwater camera system that photographs a cross section of the sediment-water interface. Computer-aided analysis of the resulting images provides a set of standard measurements that can be compared between different locations and different surveys. The DAMOS Program has successfully used this technique for over 20 years to map the distribution of disposed dredged material and to monitor benthic recolonization at disposal sites. For a detailed discussion of SPI methodology, see ENSR (2004).
2.3.1 SPI Data Acquisition
The 2004 SPI survey design included 60 locations: 45 stations located within WLDS and 15 stations distributed within three reference areas (Table 2-2, Figure 2-2). Based on analysis of barge disposal activity, it was hypothesized that disposal directed at the WLIS J Mound had spread and was likely to have an impact on the historic WLIS H Mound. Preliminary bathymetric data confirmed that the WLIS H and WLIS J Mounds had coalesced and, as a result, the two mounds were assessed as one area (the WLIS J/H Mound Complex). The 45 stations within WLDS were distributed as follows: 20 stations at the combined WLIS J/H Mound Complex, 10 stations at the WLIS K Mound, and 15 stations at the WLIS L Mound. Stations were randomly located across each of these mounds (Figure 2-3). Three previously established reference areas located south of the disposal site (S REF), southeast of the disposal site (SE REF), and southwest of the disposal site (SW REF), were also surveyed to provide a basis of comparison between WLDS sediment conditions and the ambient sediment conditions in Western Long Island Sound. Five sampling stations were randomly selected within a 300-m radius of each of the three reference areas (Table 2-2, Figure 2-2).
The sediment-profile imaging survey was conducted 30 June through 1 July 2004
aboard the F/V Shanna Rose. At each station, the vessel was positioned at the target coordinates and the camera was deployed within a defined station tolerance of 10 m.
19
Monitoring Survey at the Western Long Island Sound Disposal Site June 2004
Table 2-2.
WLDS Sediment-Profile Image Target Sampling Locations
Area Station Latitude (N) Longitude (W) Area Station Latitude (N) Longitude (W) WLIS JH-01 40° 59.218' 73° 28.787' WLIS L L-01 40° 59.370' 73° 28.893' J/H JH-02 40° 59.211' 73° 28.729' L-02 40° 59.358' 73° 28.897' JH-03 40° 59.188' 73° 28.727' L-03 40° 59.414' 73° 28.888' JH-04 40° 59.220' 73° 28.727' L-04 40° 59.415' 73° 28.904' JH-05 40° 59.247' 73° 28.691' L-05 40° 59.388' 73° 28.874' JH-06 40° 59.224' 73° 28.690' L-06 40° 59.424' 73° 28.866' JH-07 40° 59.216' 73° 28.649' L-07 40° 59.376' 73° 28.932' JH-08 40° 59.210' 73° 28.641' L-08 40° 59.364' 73° 28.867' JH-09 40° 59.157' 73° 28.667' L-09 40° 59.390' 73° 28.887' JH-10 40° 59.199' 73° 28.693' L-10 40° 59.360' 73° 28.902' JH-11 40° 59.247' 73° 28.702' L-11 40° 59.375' 73° 28.941' JH-12 40° 59.232' 73° 28.778' L-12 40° 59.389' 73° 28.891' JH-13 40° 59.239' 73° 28.677' L-13 40° 59.374' 73° 28.908' JH-14 40° 59.208' 73° 28.655' L-14 40° 59.393' 73° 28.895' JH-15 40° 59.193' 73° 28.786' L-15 40° 59.380' 73° 28.862' JH-16 40° 59.188' 73° 28.711' Reference S-01 40° 58.806' 73° 29.131' JH-17 40° 59.177' 73° 28.751' S-02 40° 58.741' 73° 29.376' JH-18 40° 59.246' 73° 28.733' S-03 40° 58.638' 73° 29.005' JH-19 40° 59.245' 73° 28.728' S-04 40° 58.791' 73° 29.078' JH-20 40° 59.191' 73° 28.797' S-05 40° 58.757' 73° 29.014' WLIS K-01 40° 59.276' 73° 28.731' SE-01 40° 58.356' 73° 27.733' K K-02 40° 59.257' 73° 28.740' SE-02 40° 58.406' 73° 27.616' K-03 40° 59.282' 73° 28.733' SE-03 40° 58.194' 73° 27.680' K-04 40° 59.262' 73° 28.731' SE-04 40° 58.260' 73° 27.805' K-05 40° 59.281' 73° 28.749' SE-05 40° 58.301' 73° 27.502' K-06 40° 59.275' 73° 28.770' SW-01 40° 58.627' 73° 29.766' K-07 40° 59.306' 73° 28.773' SW-02 40° 58.343' 73° 29.938' K-08 40° 59.297' 73° 28.784' SW-03 40° 58.466' 73° 30.064' K-09 40° 59.295' 73° 28.726' SW-04 40° 58.608' 73° 29.736' K-10 40° 59.263' 73° 28.757' SW-05 40° 58.426' 73° 30.071' Note: Coordinate system NAD83
20
Monitoring Survey at the Western Long Island Sound Disposal Site June 2004
A# #
######
#
#
## ### ##
##
#
######## ##
##
####
# #### ####
#
#
#
##
#
#
#
##
#
#
#
#
#
Western Long Island Sound Disposal Site
SW REF
S REF
SE REF
WLIS L
WLIS K
WLIS J/H
73°30'0"W
73°30'0"W
73°29'30"W
73°29'30"W
73°29'0"W
73°29'0"W
73°28'30"W
73°28'30"W
73°28'0"W
73°28'0"W
73°27'30"W
73°27'30"W
40°5
8'0"
N40
°58'
30"N
40°5
8'30
"N
40°5
9'0"
N
40°5
9'0"
N
40°5
9'30
"N
40°5
9'30
"N
41°0
'0"N
41°0
'0"N
J:\Water\ProjectFiles\P90\9000DAMOS\Reporting\2004\WLDS\Data\WLDS_SPI_2004.mxd
Z
July 2004
A 2003-2004 Buoy Location
#
2004 Reference Stations
# 2004 WLDS Stations
0 500250Meters
Projection: Conformal Conic Coordinate System: CT State Plane (m) Datum: NAD 83
2004 Target Bathymetric Survey Boundary
Figure 2-2. WLDS with target SPI stations indicated (WLIS Mounds and Reference Areas)
21
Monitoring Survey at the Western Long Island Sound Disposal Site June 2004
A
##
#
#
#
###
#
#
#
##
#
##
#
##
#
!
!
!
!
!!
!! !
!
"
"
""
"
"
"
"
"
"
"
"
"
"
"
WLIS L
WLIS K
WLIS J/H
73°29'0"W
73°29'0"W
73°28'50"W
73°28'50"W
73°28'40"W
73°28'40"W
40°5
9'10
"N
40°5
9'10
"N
40°5
9'20
"N
40°5
9'20
"N
J:\Water\ProjectFiles\P90\9000DAMOS\Reporting\2004\CLDS\Draft\Figures\WLDS_SPI_2004_mounds.mxd
Z
February 2005
A 2003-2004 Buoy Location
# WLIS J/H Stations
! WLIS K Stations
" WLIS L Stations
0 100 20050Meters
Projection: Conformal Conic Coordinate System: CT State Plane (m) Datum: NAD 83
Figure 2-3. WLDS with target SPI stations indicated (WLIS J/H Mound Complex,
WLIS L Mound, and WLIS K Mound)

22
Monitoring Survey at the Western Long Island Sound Disposal Site June 2004
Three or more replicate sediment-profile images were collected at each of the 45 stations for characterization of small-scale (i.e. within-station) spatial variability.
Acquisition of high-resolution SPI images was accomplished using an Ocean Imaging Model 3731 pressure housing system with a Nikon D100 digital single-lens reflex camera. The camera was mounted inside the pressure housing and sat atop a wedge-shaped prism with a front faceplate and a back mirror. The mirror was mounted at a 45° angle to reflect the profile of the sediment-water interface. As the prism penetrated the seafloor, a trigger activated a time-delay circuit that fired an internal strobe to obtain a cross-sectional image of the upper 15 to 20 cm of the sediment column. The camera remained on the seafloor for approximately 20 seconds to ensure that a successful image had been obtained.
Two types of adjustments to the SPI system are typically made in the field:
1) physical adjustments of the frame stop collars, adding/subtracting lead weights to the frame, and adding mud doors to control penetration in harder or softer sediments, and 2) electronic software adjustments to the Nikon D100 to control camera settings. Each image was assigned a unique time stamp in the digital file attributes by the camera’s data logger and cross-checked with the time stamp in the navigational system’s computer data file. In addition, the field crew kept redundant written sample logs. Images were downloaded periodically to verify successful sample acquisition or to assess what type of sediment/depositional layer was present at a particular station. Digital image files were re-named with the appropriate station name immediately after downloading on deck as a further quality assurance step.
Test exposures of the Kodak® Color Separation Guide (Publication No. Q-13)
were made on deck at the beginning and end of each survey to verify that all internal electronic systems were working to design specifications and to provide a color standard against which final images could be checked for proper color balance. After deployment of the camera at each station, the frame counter was checked to ensure that the requisite number of replicates had been obtained. In addition, a prism penetration depth indicator on the camera frame was checked to verify that the optical prism had actually penetrated the bottom to a sufficient depth. If images were missed or the penetration depth was insufficient, the camera frame stop collars were adjusted and/or weights were added or removed, and additional replicate images were taken. Changes in prism weight amounts, the presence or absence of mud doors, and frame stop collar positions were recorded for each replicate image.
23
Monitoring Survey at the Western Long Island Sound Disposal Site June 2004
2.3.2 SPI Data Analysis
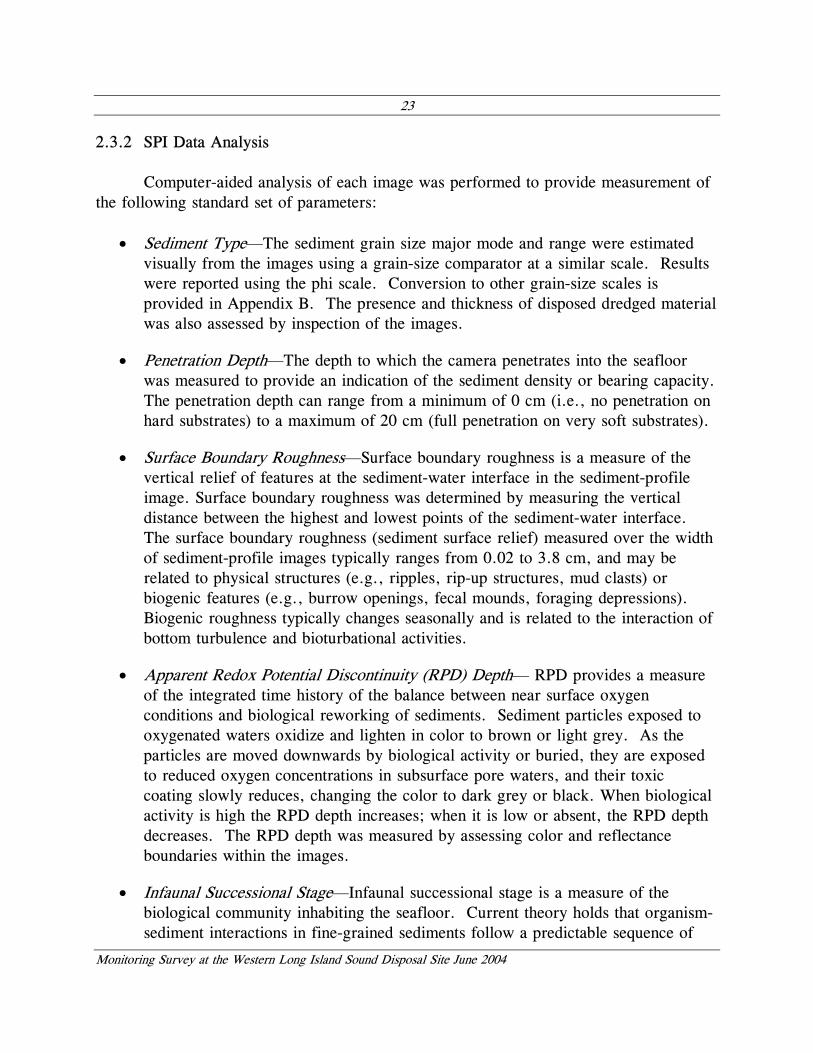
Computer-aided analysis of each image was performed to provide measurement of the following standard set of parameters:
• Sediment Type—The sediment grain size major mode and range were estimated
visually from the images using a grain-size comparator at a similar scale. Results were reported using the phi scale. Conversion to other grain-size scales is provided in Appendix B. The presence and thickness of disposed dredged material was also assessed by inspection of the images.
• Penetration Depth—The depth to which the camera penetrates into the seafloor was measured to provide an indication of the sediment density or bearing capacity. The penetration depth can range from a minimum of 0 cm (i.e., no penetration on hard substrates) to a maximum of 20 cm (full penetration on very soft substrates).
• Surface Boundary Roughness—Surface boundary roughness is a measure of the vertical relief of features at the sediment-water interface in the sediment-profile image. Surface boundary roughness was determined by measuring the vertical distance between the highest and lowest points of the sediment-water interface. The surface boundary roughness (sediment surface relief) measured over the width of sediment-profile images typically ranges from 0.02 to 3.8 cm, and may be related to physical structures (e.g., ripples, rip-up structures, mud clasts) or biogenic features (e.g., burrow openings, fecal mounds, foraging depressions). Biogenic roughness typically changes seasonally and is related to the interaction of bottom turbulence and bioturbational activities.
• Apparent Redox Potential Discontinuity (RPD) Depth— RPD provides a measure of the integrated time history of the balance between near surface oxygen conditions and biological reworking of sediments. Sediment particles exposed to oxygenated waters oxidize and lighten in color to brown or light grey. As the particles are moved downwards by biological activity or buried, they are exposed to reduced oxygen concentrations in subsurface pore waters, and their toxic coating slowly reduces, changing the color to dark grey or black. When biological activity is high the RPD depth increases; when it is low or absent, the RPD depth decreases. The RPD depth was measured by assessing color and reflectance boundaries within the images.
• Infaunal Successional Stage—Infaunal successional stage is a measure of the biological community inhabiting the seafloor. Current theory holds that organism-sediment interactions in fine-grained sediments follow a predictable sequence of
24
Monitoring Survey at the Western Long Island Sound Disposal Site June 2004
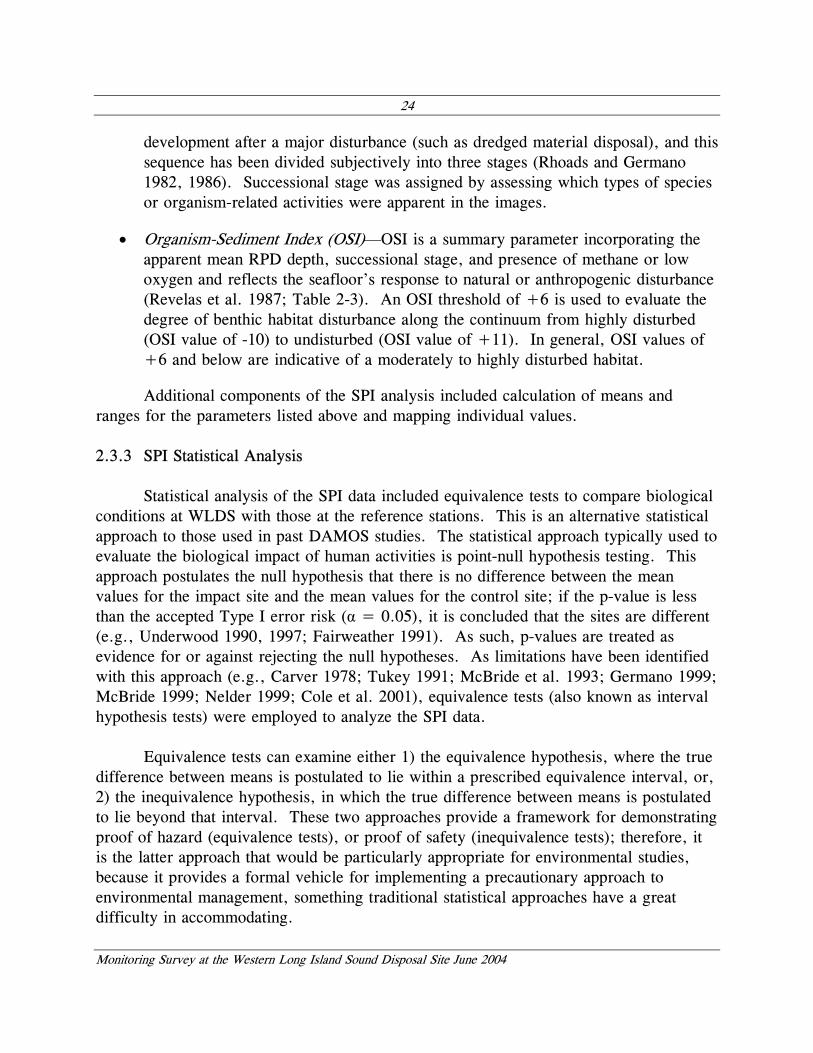
development after a major disturbance (such as dredged material disposal), and this sequence has been divided subjectively into three stages (Rhoads and Germano 1982, 1986). Successional stage was assigned by assessing which types of species or organism-related activities were apparent in the images.
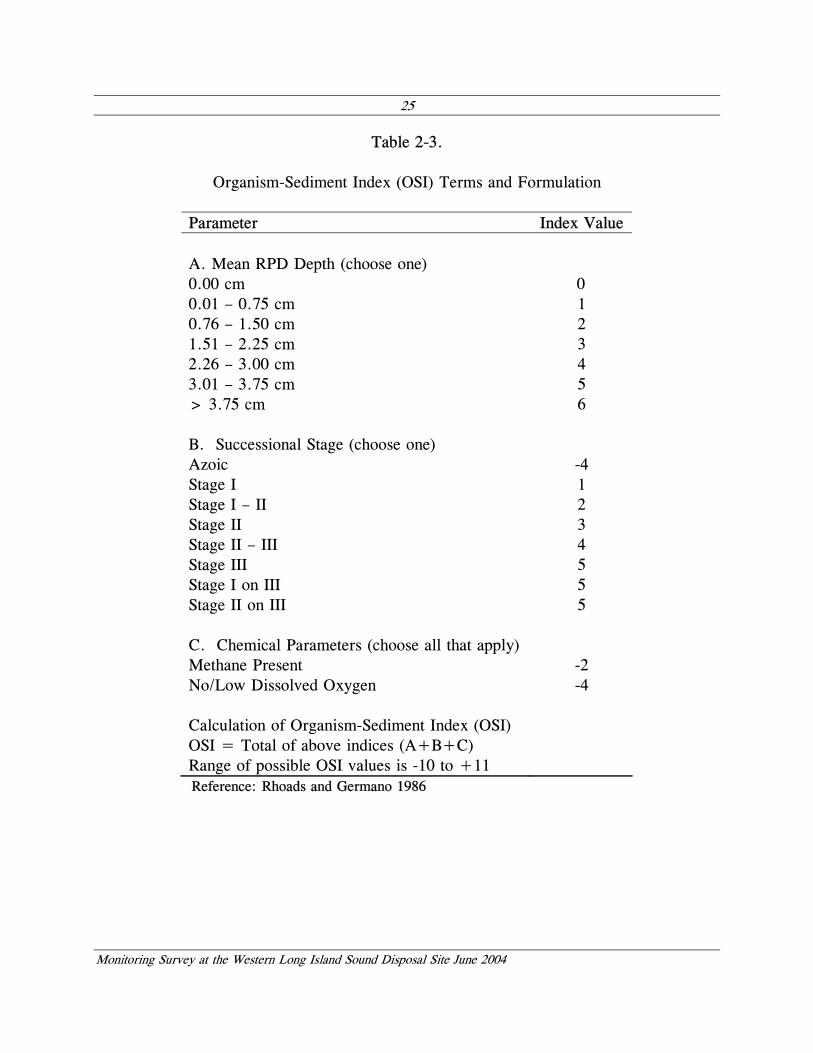
• Organism-Sediment Index (OSI)—OSI is a summary parameter incorporating the apparent mean RPD depth, successional stage, and presence of methane or low oxygen and reflects the seafloor’s response to natural or anthropogenic disturbance (Revelas et al. 1987; Table 2-3). An OSI threshold of +6 is used to evaluate the degree of benthic habitat disturbance along the continuum from highly disturbed (OSI value of -10) to undisturbed (OSI value of +11). In general, OSI values of +6 and below are indicative of a moderately to highly disturbed habitat.
Additional components of the SPI analysis included calculation of means and ranges for the parameters listed above and mapping individual values.
2.3.3 SPI Statistical Analysis
Statistical analysis of the SPI data included equivalence tests to compare biological conditions at WLDS with those at the reference stations. This is an alternative statistical approach to those used in past DAMOS studies. The statistical approach typically used to evaluate the biological impact of human activities is point-null hypothesis testing. This approach postulates the null hypothesis that there is no difference between the mean values for the impact site and the mean values for the control site; if the p-value is less than the accepted Type I error risk (α = 0.05), it is concluded that the sites are different (e.g., Underwood 1990, 1997; Fairweather 1991). As such, p-values are treated as evidence for or against rejecting the null hypotheses. As limitations have been identified with this approach (e.g., Carver 1978; Tukey 1991; McBride et al. 1993; Germano 1999; McBride 1999; Nelder 1999; Cole et al. 2001), equivalence tests (also known as interval hypothesis tests) were employed to analyze the SPI data.
Equivalence tests can examine either 1) the equivalence hypothesis, where the true
difference between means is postulated to lie within a prescribed equivalence interval, or, 2) the inequivalence hypothesis, in which the true difference between means is postulated to lie beyond that interval. These two approaches provide a framework for demonstrating proof of hazard (equivalence tests), or proof of safety (inequivalence tests); therefore, it is the latter approach that would be particularly appropriate for environmental studies, because it provides a formal vehicle for implementing a precautionary approach to environmental management, something traditional statistical approaches have a great difficulty in accommodating.
25
Monitoring Survey at the Western Long Island Sound Disposal Site June 2004
Table 2-3.
Organism-Sediment Index (OSI) Terms and Formulation
Parameter Index Value A. Mean RPD Depth (choose one) 0.00 cm 0 0.01 – 0.75 cm 1 0.76 – 1.50 cm 2 1.51 – 2.25 cm 3 2.26 – 3.00 cm 4 3.01 – 3.75 cm 5 > 3.75 cm 6 B. Successional Stage (choose one) Azoic -4 Stage I 1 Stage I – II 2 Stage II 3 Stage II – III 4 Stage III 5 Stage I on III 5 Stage II on III 5 C. Chemical Parameters (choose all that apply) Methane Present -2 No/Low Dissolved Oxygen -4 Calculation of Organism-Sediment Index (OSI) OSI = Total of above indices (A+B+C) Range of possible OSI values is -10 to +11
Reference: Rhoads and Germano 1986
26
Monitoring Survey at the Western Long Island Sound Disposal Site June 2004
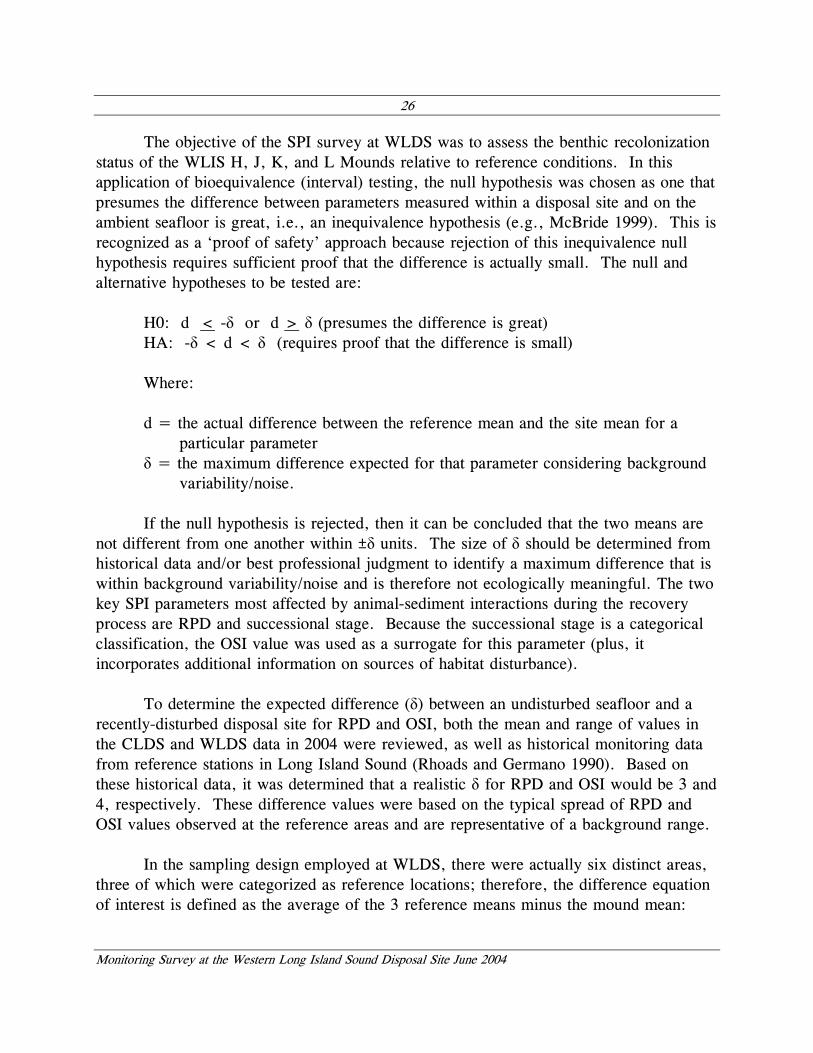
The objective of the SPI survey at WLDS was to assess the benthic recolonization status of the WLIS H, J, K, and L Mounds relative to reference conditions. In this application of bioequivalence (interval) testing, the null hypothesis was chosen as one that presumes the difference between parameters measured within a disposal site and on the ambient seafloor is great, i.e., an inequivalence hypothesis (e.g., McBride 1999). This is recognized as a ‘proof of safety’ approach because rejection of this inequivalence null hypothesis requires sufficient proof that the difference is actually small. The null and alternative hypotheses to be tested are:
H0: d < -δ or d > δ (presumes the difference is great) HA: -δ < d < δ (requires proof that the difference is small) Where: d = the actual difference between the reference mean and the site mean for a
particular parameter δ = the maximum difference expected for that parameter considering background
variability/noise. If the null hypothesis is rejected, then it can be concluded that the two means are
not different from one another within ±δ units. The size of δ should be determined from historical data and/or best professional judgment to identify a maximum difference that is within background variability/noise and is therefore not ecologically meaningful. The two key SPI parameters most affected by animal-sediment interactions during the recovery process are RPD and successional stage. Because the successional stage is a categorical classification, the OSI value was used as a surrogate for this parameter (plus, it incorporates additional information on sources of habitat disturbance).
To determine the expected difference (δ) between an undisturbed seafloor and a
recently-disturbed disposal site for RPD and OSI, both the mean and range of values in the CLDS and WLDS data in 2004 were reviewed, as well as historical monitoring data from reference stations in Long Island Sound (Rhoads and Germano 1990). Based on these historical data, it was determined that a realistic δ for RPD and OSI would be 3 and 4, respectively. These difference values were based on the typical spread of RPD and OSI values observed at the reference areas and are representative of a background range.
In the sampling design employed at WLDS, there were actually six distinct areas,
three of which were categorized as reference locations; therefore, the difference equation of interest is defined as the average of the 3 reference means minus the mound mean:
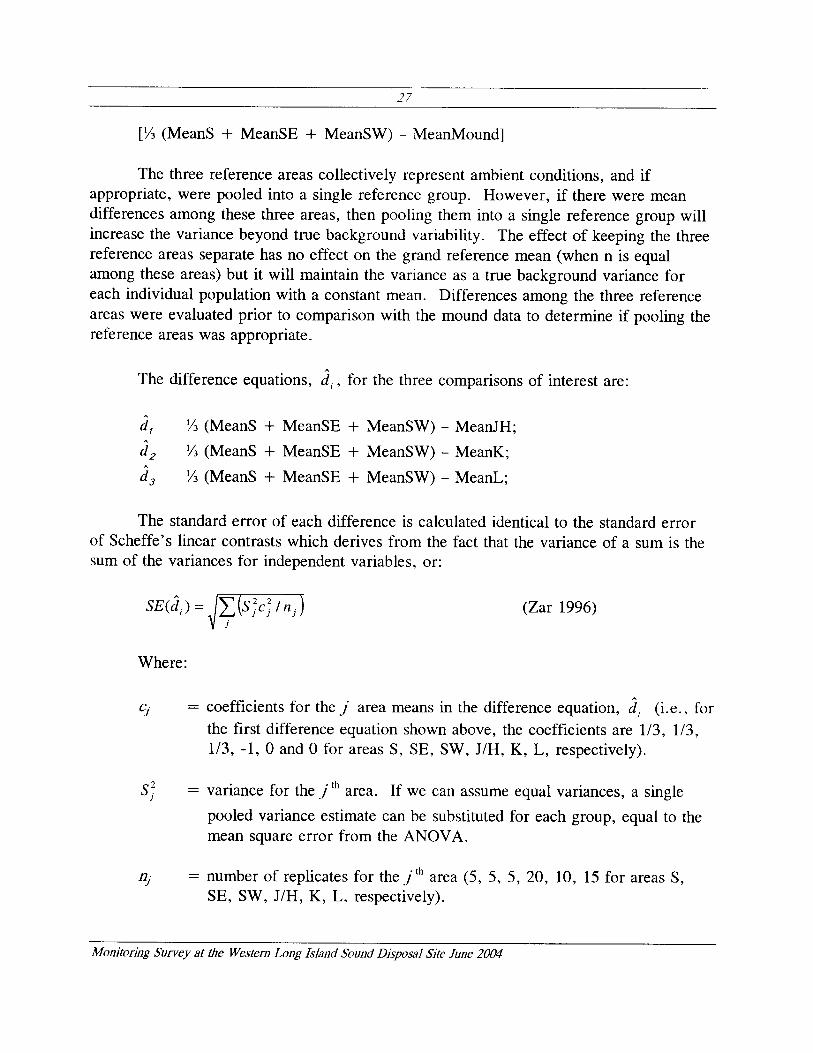
29
Monitoring Survey at the Western Long Island Sound Disposal Site June 2004
3.0 RESULTS
3.1 Bathymetry
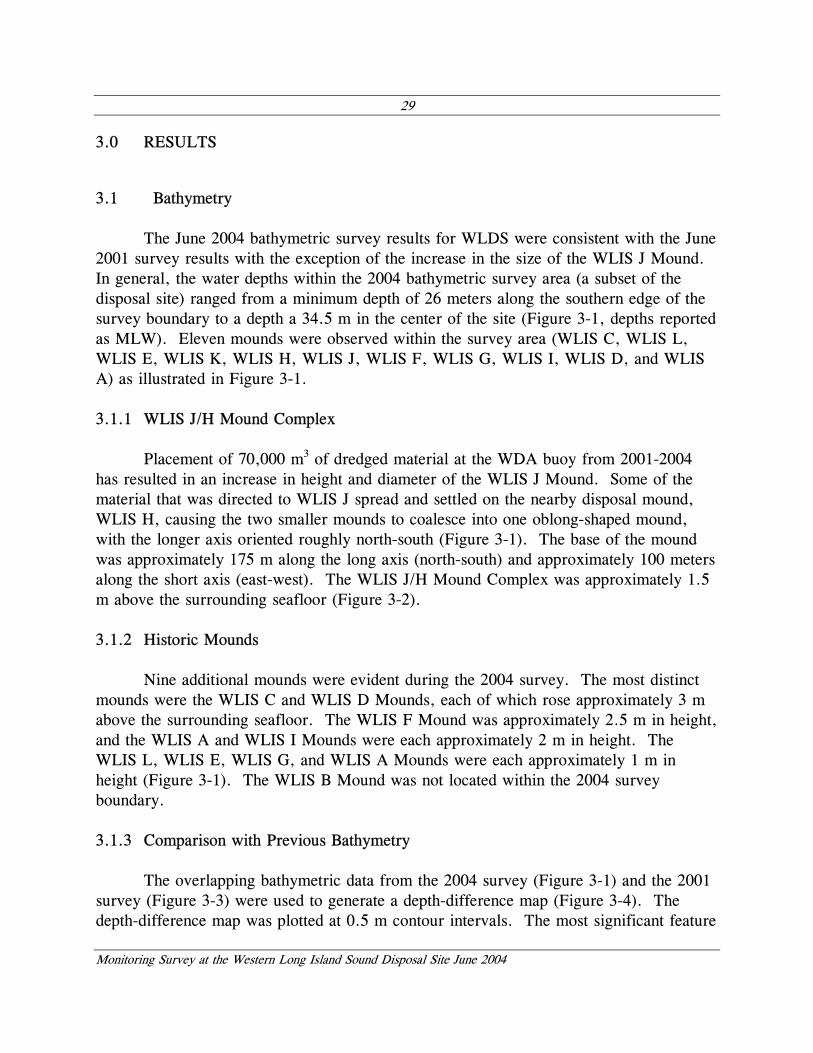
The June 2004 bathymetric survey results for WLDS were consistent with the June 2001 survey results with the exception of the increase in the size of the WLIS J Mound. In general, the water depths within the 2004 bathymetric survey area (a subset of the disposal site) ranged from a minimum depth of 26 meters along the southern edge of the survey boundary to a depth a 34.5 m in the center of the site (Figure 3-1, depths reported as MLW). Eleven mounds were observed within the survey area (WLIS C, WLIS L, WLIS E, WLIS K, WLIS H, WLIS J, WLIS F, WLIS G, WLIS I, WLIS D, and WLIS A) as illustrated in Figure 3-1.
3.1.1 WLIS J/H Mound Complex
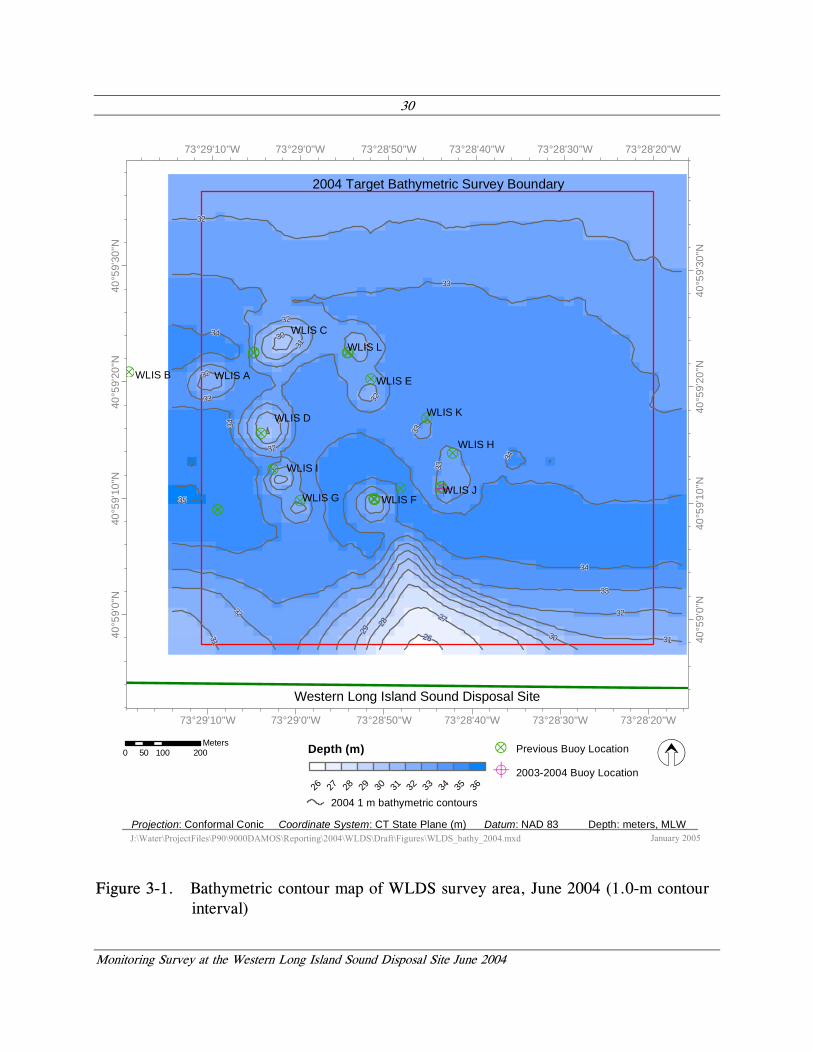
Placement of 70,000 m3 of dredged material at the WDA buoy from 2001-2004 has resulted in an increase in height and diameter of the WLIS J Mound. Some of the material that was directed to WLIS J spread and settled on the nearby disposal mound, WLIS H, causing the two smaller mounds to coalesce into one oblong-shaped mound, with the longer axis oriented roughly north-south (Figure 3-1). The base of the mound was approximately 175 m along the long axis (north-south) and approximately 100 meters along the short axis (east-west). The WLIS J/H Mound Complex was approximately 1.5 m above the surrounding seafloor (Figure 3-2).
3.1.2 Historic Mounds
Nine additional mounds were evident during the 2004 survey. The most distinct mounds were the WLIS C and WLIS D Mounds, each of which rose approximately 3 m above the surrounding seafloor. The WLIS F Mound was approximately 2.5 m in height, and the WLIS A and WLIS I Mounds were each approximately 2 m in height. The WLIS L, WLIS E, WLIS G, and WLIS A Mounds were each approximately 1 m in height (Figure 3-1). The WLIS B Mound was not located within the 2004 survey boundary.
3.1.3 Comparison with Previous Bathymetry
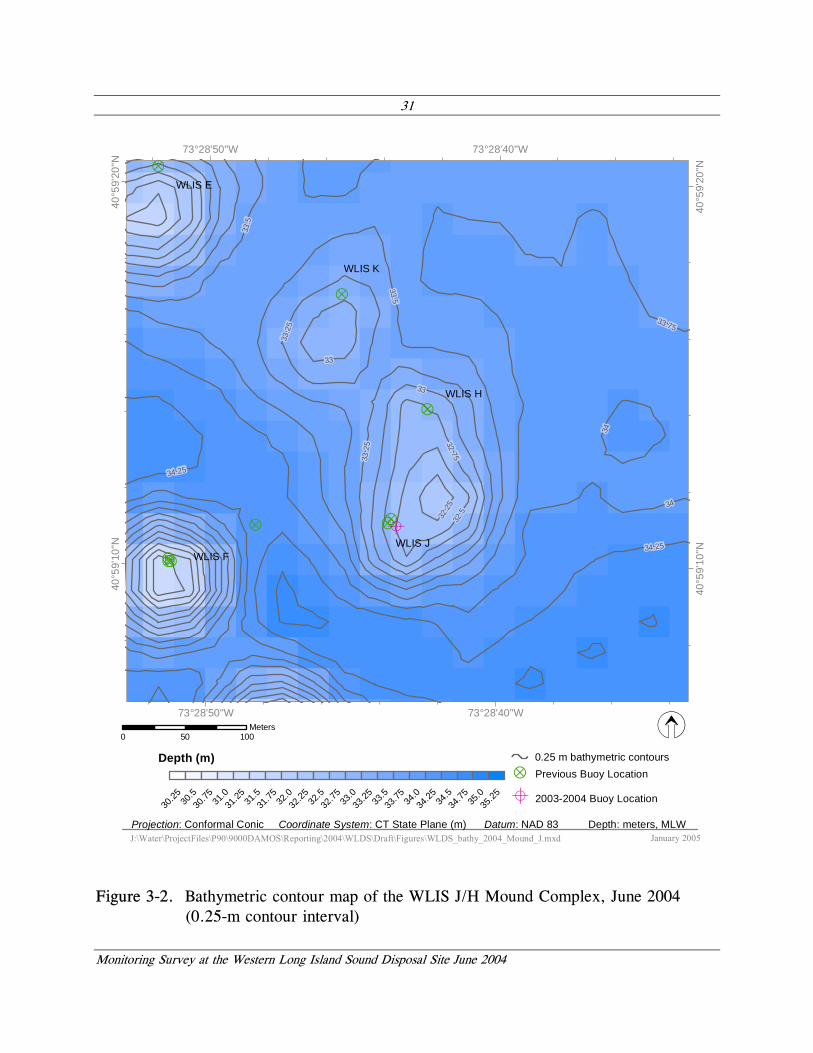
The overlapping bathymetric data from the 2004 survey (Figure 3-1) and the 2001 survey (Figure 3-3) were used to generate a depth-difference map (Figure 3-4). The depth-difference map was plotted at 0.5 m contour intervals. The most significant feature
30
Monitoring Survey at the Western Long Island Sound Disposal Site June 2004
??
?
?
?
????
??
?
?
??
?A?
?
Western Long Island Sound Disposal Site
2004 Target Bathymetric Survey Boundary
33
32
34
313029
28
27
26
35
33
30 32
32
34
33
31
33
31
32
32
34
3232
33
32
34
31
WLIS AWLIS B
WLIS C
WLIS F
WLIS I
WLIS K
WLIS L
WLIS G
WLIS D
WLIS H
WLIS J
WLIS E
73°29'10"W
73°29'10"W
73°29'0"W
73°29'0"W
73°28'50"W
73°28'50"W
73°28'40"W
73°28'40"W
73°28'30"W
73°28'30"W
73°28'20"W
73°28'20"W
40°5
9'0"
N
40°5
9'0"
N
40°5
9'10
"N
40°5
9'10
"N
40°5
9'20
"N
40°5
9'20
"N
40°5
9'30
"N
40°5
9'30
"N
J:\Water\ProjectFiles\P90\9000DAMOS\Reporting\2004\WLDS\Draft\Figures\WLDS_bathy_2004.mxd
Z
January 2005
Depth (m)
26 27 28 29 30 31 32 33 34 35 36
2004 1 m bathymetric contours
? Previous Buoy Location
A 2003-2004 Buoy Location
0 100 20050Meters
Projection: Conformal Conic Coordinate System: CT State Plane (m) Datum: NAD 83 Depth: meters, MLW
Figure 3-1. Bathymetric contour map of WLDS survey area, June 2004 (1.0-m contour interval)
31
Monitoring Survey at the Western Long Island Sound Disposal Site June 2004
?
???
?
?
?
?A?
WLIS F
WLIS H
WLIS J
WLIS E
34
33.75
33.5
33
34.25
33.2
5 32.75
32.532.2
5
34.25
33.5
33
34
33.2
5
73°28'50"W
73°28'50"W
73°28'40"W
73°28'40"W
40°5
9'10
"N
40°5
9'10
"N
40°5
9'20
"N
40°5
9'20
"N
J:\Water\ProjectFiles\P90\9000DAMOS\Reporting\2004\WLDS\Draft\Figures\WLDS_bathy_2004_Mound_J.mxd
Z
January 2005
Depth (m)
30.25 30
.530
.75 31.0
31.25 31
.531
.75 32.0
32.25 32
.532
.75 33.0
33.25 33
.533
.75 34.0
34.25 34
.534
.75 35.0
35.25
0.25 m bathymetric contours
? Previous Buoy Location
A 2003-2004 Buoy Location
0 10050Meters
Projection: Conformal Conic Coordinate System: CT State Plane (m) Datum: NAD 83 Depth: meters, MLW
WLIS K
Figure 3-2. Bathymetric contour map of the WLIS J/H Mound Complex, June 2004 (0.25-m contour interval)
32
Monitoring Survey at the Western Long Island Sound Disposal Site June 2004
??
?
?
????
?
?
?
?
??
?A
?
?
WLIS A
WLIS K
WLIS L
WLIS G
WLIS C
WLIS D
WLIS F
WLIS H
WLIS I
WLIS J
WLIS E
33
32
34
31
3029
28
33
32
3233
32
32
31
30
33
32
32
33
31
33
34
32
32
31
33
3130
2933
31
33
73°29'10"W
73°29'10"W
73°29'0"W
73°29'0"W
73°28'50"W
73°28'50"W
73°28'40"W
73°28'40"W
73°28'30"W
73°28'30"W
40°5
9'0"
N
40°5
9'10
"N
40°5
9'10
"N
40°5
9'20
"N
40°5
9'20
"N
40°5
9'30
"N
40°5
9'30
"N
0 200100Meters
J:\Water\ProjectFiles\P90\9000DAMOS\Reporting\2004\WLDS\Draft\Figures\bathy_2001.mxdProjection: Conformal Conic Coordinate System: CT State Plane (m) Datum: NAD 83 Depth: meters, MLW
Z
January 2005
Depth (m)
26 27 28 29 30 31 32 33 34 35 36
1 m bathymetric contours
? Previous Buoy Location
A 2003-2004 Buoy Location
Note: 2001 Bathymetric data (SAIC 2002)
Figure 3-3. Bathymetric contour map of WLDS survey area, June 2001 (1.0-m contour interval)
33
Monitoring Survey at the Western Long Island Sound Disposal Site June 2004
??
?
?
????
?
?
?
?
??
?A
?
?
WLIS A
WLIS K
WLIS L
WLIS G
WLIS C
WLIS D
WLIS F
WLIS H
WLIS I
WLIS J
WLIS E
0
10.5
1.5
0
0
0
0
0
-0.5
73°29'10"W
73°29'10"W
73°29'0"W
73°29'0"W
73°28'50"W
73°28'50"W
73°28'40"W
73°28'40"W
73°28'30"W
73°28'30"W
73°28'20"W
73°28'20"W
40°5
9'0"
N
40°5
9'0"
N
40°5
9'10
"N
40°5
9'10
"N
40°5
9'20
"N
40°5
9'20
"N
40°5
9'30
"N
40°5
9'30
"N
0 100 20050Meters
J:\Water\ProjectFiles\P90\9000DAMOS\Reporting\2004\WLDS\Draft\Figures\bathydd.mxdProjection: Conformal Conic Coordinate System: CT State Plane (m) Datum: NAD 83
Z
January 2005
Depth Difference (m)
-1 -0.5 0 0.5 1 1.5 2
? Previous Buoy Location
A Current Buoy Location
0.5m Contour Lines
2004 Target Bathymetric Survey Boundary
Figure 3-4. Depth difference contour map of WLDS survey area, June 2001 vs. June 2004 survey results (0.5-m contour interval)
34
Monitoring Survey at the Western Long Island Sound Disposal Site June 2004
was the increase in size of the WLIS J Mound, which was barely discernable in the 2001 survey; this mound had increased in height approximately 1.5 m. There was also evidence of a 0.5 m decrease in height of the WLIS L Mound (Figure 3-4). This scale of volume decrease is typical of the self-weight consolidation of recently disposed dredged materials in Long Island Sound (SAIC 1995).
3.2 Sediment-Profile Imaging
The objective of the June 2004 SPI survey was to compare the recolonization status and benthic conditions within WLDS with those at the reference areas. A complete set of results for the SPI image analysis is presented in Appendix B; the summary results are presented below.
3.2.1 WLDS Reference Areas
The summary data from the stations at the three reference areas are presented in Table 3-1. Reference areas were previously established as areas unaffected by dredged material disposal and representative of ambient seafloor conditions. These areas were surveyed to provide reference area data to compare with data collected within the disposal site.
Sediment Physical Characteristics
The sediment grain-size major mode at all stations was primarily fine-grained sediments (>4 phi), with most of the stations at SW REF and all of the stations at S REF having a surface layer of silty, very fine sand overlying the mud facies (Figure 3-5). This very fine sand layer is typical of conditions seen at SW REF and S REF in previous surveys (SAIC 2002). All of the sediments at the SE REF area stations had a major grain-size mode of silt-clay (>4 phi).
The overall average prism penetration for the three reference areas was 13.1 cm
(Table 3-1), with station-averaged values ranging from 8.1 to 17.2 cm. Small-scale boundary roughness ranged from 0.6 to 1.5 cm, with the majority of the small-scale topographic relief caused by biogenic activity. No stations showed any evidence of low dissolved oxygen in the overlying water or sub-surface methanogenesis. The reduced mud clasts found in many of the images were attributed to sampling artifacts of the camera operation and not indicative of any recent sediment transport activity. There was no evidence of recent or historic dredged material in the images collected from the three reference areas.
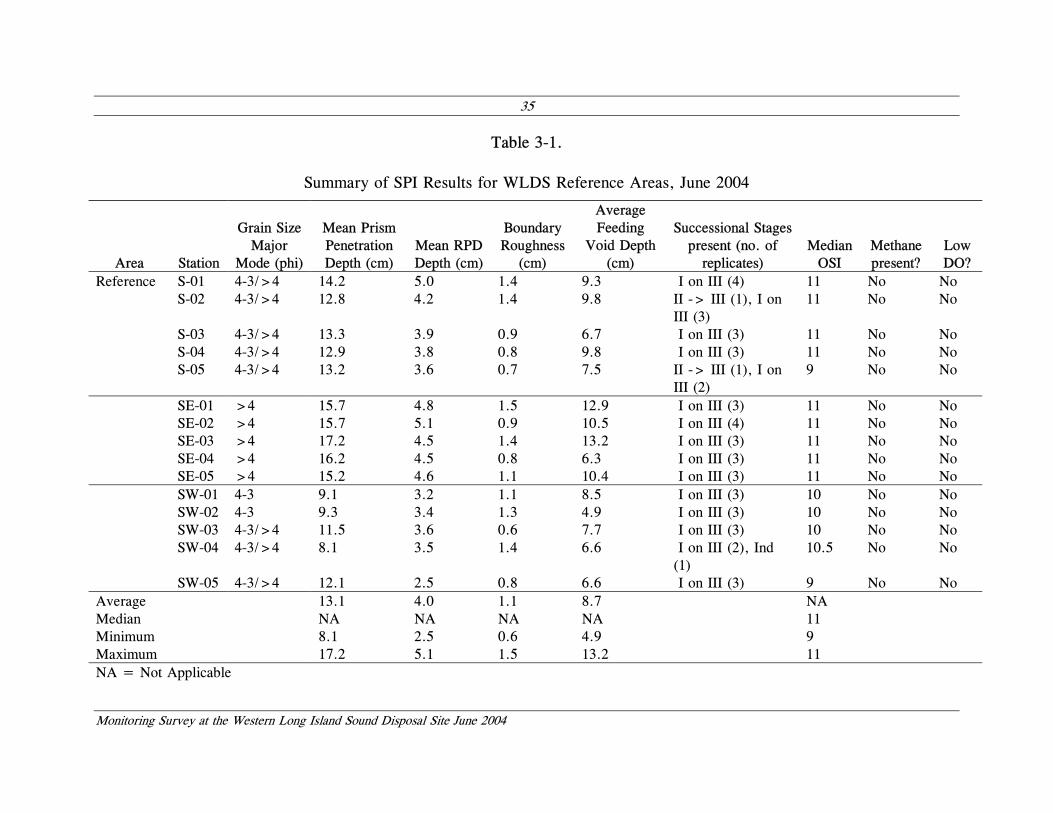
35
Monitoring Survey at the Western Long Island Sound Disposal Site June 2004
Table 3-1.
Summary of SPI Results for WLDS Reference Areas, June 2004
Area Station
Grain Size Major
Mode (phi)
Mean Prism Penetration Depth (cm)
Mean RPD Depth (cm)
Boundary Roughness
(cm)
Average Feeding
Void Depth (cm)
Successional Stages present (no. of
replicates) Median
OSI Methane present?
Low DO?
Reference S-01 4-3/>4 14.2 5.0 1.4 9.3 I on III (4) 11 No No S-02 4-3/>4 12.8 4.2 1.4 9.8 II -> III (1), I on
III (3) 11 No No
S-03 4-3/>4 13.3 3.9 0.9 6.7 I on III (3) 11 No No S-04 4-3/>4 12.9 3.8 0.8 9.8 I on III (3) 11 No No S-05 4-3/>4 13.2 3.6 0.7 7.5 II -> III (1), I on
III (2) 9 No No
SE-01 >4 15.7 4.8 1.5 12.9 I on III (3) 11 No No SE-02 >4 15.7 5.1 0.9 10.5 I on III (4) 11 No No SE-03 >4 17.2 4.5 1.4 13.2 I on III (3) 11 No No SE-04 >4 16.2 4.5 0.8 6.3 I on III (3) 11 No No SE-05 >4 15.2 4.6 1.1 10.4 I on III (3) 11 No No SW-01 4-3 9.1 3.2 1.1 8.5 I on III (3) 10 No No SW-02 4-3 9.3 3.4 1.3 4.9 I on III (3) 10 No No SW-03 4-3/>4 11.5 3.6 0.6 7.7 I on III (3) 10 No No SW-04 4-3/>4 8.1 3.5 1.4 6.6 I on III (2), Ind
(1) 10.5 No No
SW-05 4-3/>4 12.1 2.5 0.8 6.6 I on III (3) 9 No No Average 13.1 4.0 1.1 8.7 NA Median NA NA NA NA 11 Minimum 8.1 2.5 0.6 4.9 9 Maximum 17.2 5.1 1.5 13.2 11 NA = Not Applicable
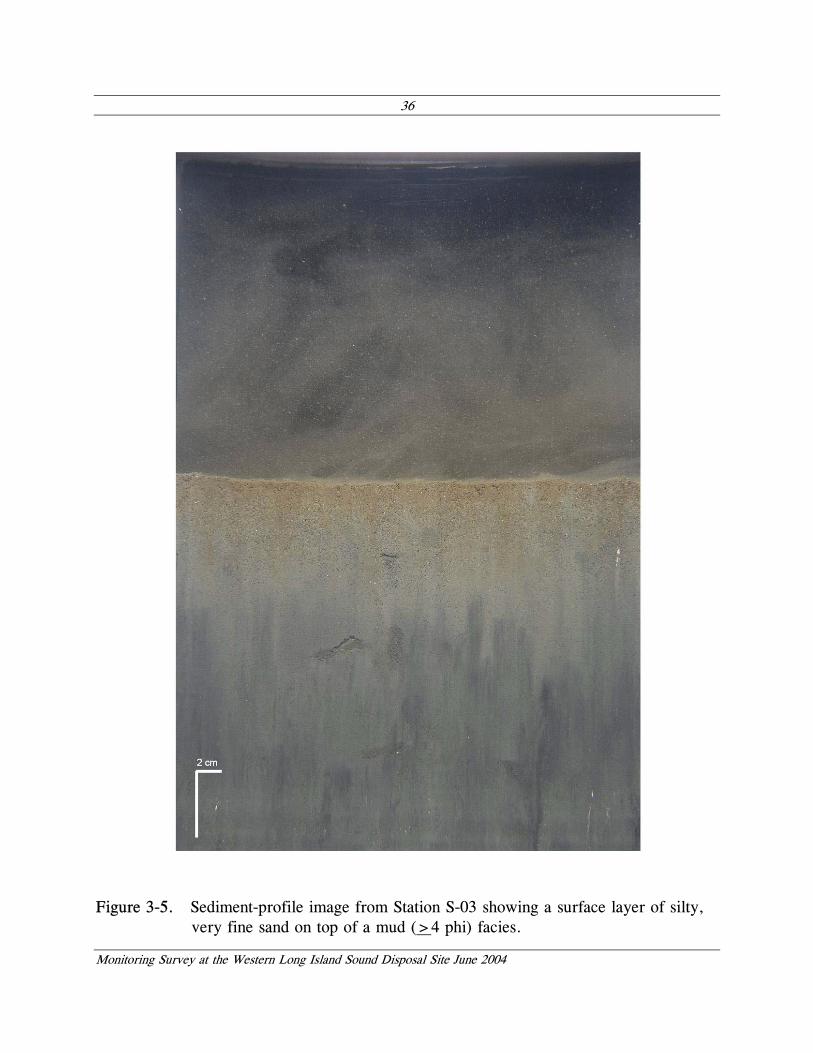
36
Monitoring Survey at the Western Long Island Sound Disposal Site June 2004
Figure 3-5. Sediment-profile image from Station S-03 showing a surface layer of silty, very fine sand on top of a mud (>4 phi) facies.
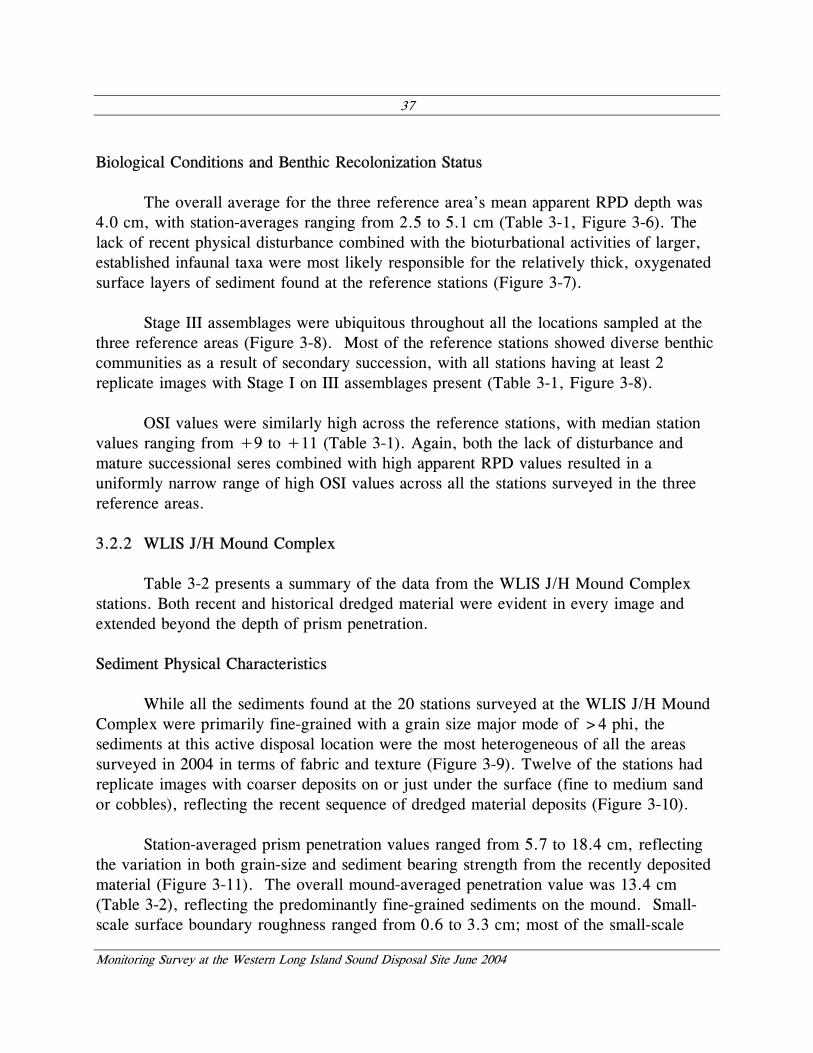
37
Monitoring Survey at the Western Long Island Sound Disposal Site June 2004
Biological Conditions and Benthic Recolonization Status
The overall average for the three reference area’s mean apparent RPD depth was 4.0 cm, with station-averages ranging from 2.5 to 5.1 cm (Table 3-1, Figure 3-6). The lack of recent physical disturbance combined with the bioturbational activities of larger, established infaunal taxa were most likely responsible for the relatively thick, oxygenated surface layers of sediment found at the reference stations (Figure 3-7).
Stage III assemblages were ubiquitous throughout all the locations sampled at the
three reference areas (Figure 3-8). Most of the reference stations showed diverse benthic communities as a result of secondary succession, with all stations having at least 2 replicate images with Stage I on III assemblages present (Table 3-1, Figure 3-8).
OSI values were similarly high across the reference stations, with median station
values ranging from +9 to +11 (Table 3-1). Again, both the lack of disturbance and mature successional seres combined with high apparent RPD values resulted in a uniformly narrow range of high OSI values across all the stations surveyed in the three reference areas.
3.2.2 WLIS J/H Mound Complex
Table 3-2 presents a summary of the data from the WLIS J/H Mound Complex stations. Both recent and historical dredged material were evident in every image and extended beyond the depth of prism penetration.
Sediment Physical Characteristics
While all the sediments found at the 20 stations surveyed at the WLIS J/H Mound Complex were primarily fine-grained with a grain size major mode of >4 phi, the sediments at this active disposal location were the most heterogeneous of all the areas surveyed in 2004 in terms of fabric and texture (Figure 3-9). Twelve of the stations had replicate images with coarser deposits on or just under the surface (fine to medium sand or cobbles), reflecting the recent sequence of dredged material deposits (Figure 3-10).
Station-averaged prism penetration values ranged from 5.7 to 18.4 cm, reflecting
the variation in both grain-size and sediment bearing strength from the recently deposited material (Figure 3-11). The overall mound-averaged penetration value was 13.4 cm (Table 3-2), reflecting the predominantly fine-grained sediments on the mound. Small-scale surface boundary roughness ranged from 0.6 to 3.3 cm; most of the small-scale
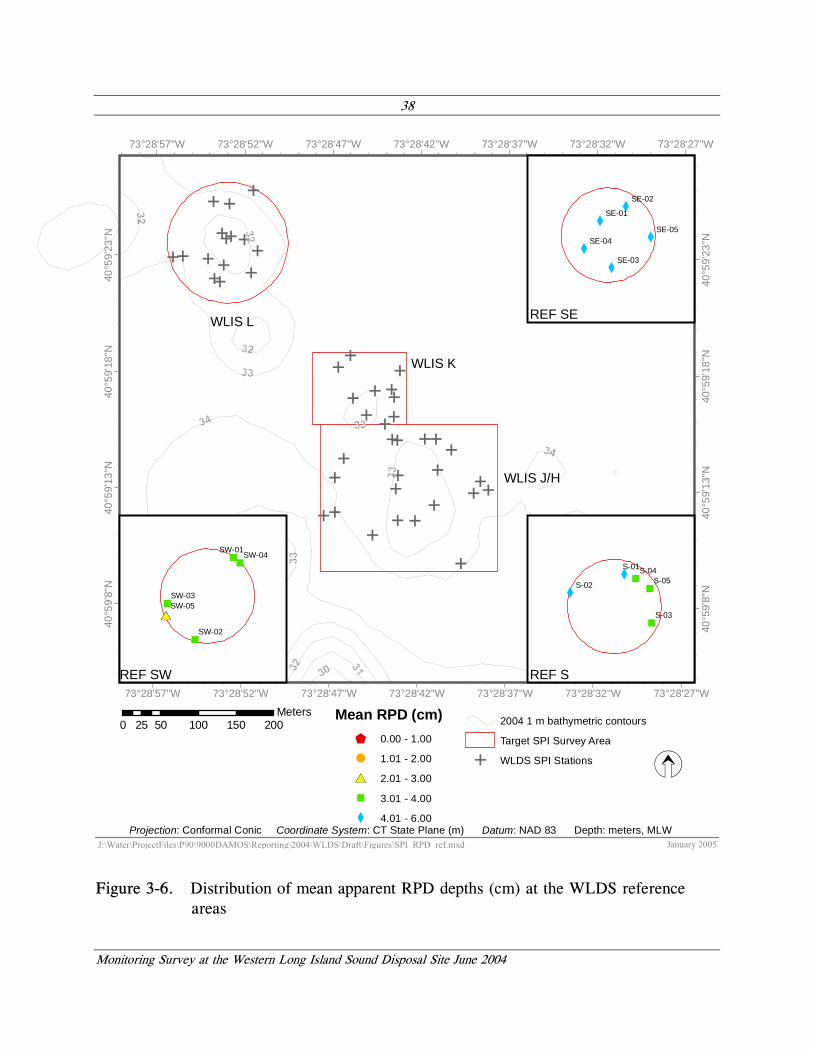
38
Monitoring Survey at the Western Long Island Sound Disposal Site June 2004
E
E
EE
E
E
E
E
E
E
E
E
E
E
E
E
E
E
E
EE
EE E
E
EE
E
E
E
EEE
E
E
E
EE
E
EE
E
EE
E
73°28'57"W
73°28'57"W
73°28'52"W
73°28'52"W
73°28'47"W
73°28'47"W
73°28'42"W
73°28'42"W
73°28'37"W
73°28'37"W
73°28'32"W
73°28'32"W
73°28'27"W
73°28'27"W
40°5
9'8"
N
40°5
9'8"
N
40°5
9'13
"N
40°5
9'13
"N
40°5
9'18
"N
40°5
9'18
"N
40°5
9'23
"N
40°5
9'23
"N
"
"
"
"
#*SW-05
SW-04
SW-03
SW-02
SW-01
X
X
"
""
S-05S-04
S-03
S-02
S-01
WLIS L
WLIS K
WLIS J/H
XX
X
XX
SE-05SE-04
SE-03
SE-02
SE-01
REF SW REF S
REF SE
0 50 100 150 20025Meters
2004 1 m bathymetric contours
Target SPI Survey Area
E WLDS SPI Stations
J:\Water\ProjectFiles\P90\9000DAMOS\Reporting\2004\WLDS\Draft\Figures\SPI_RPD_ref.mxdProjection: Conformal Conic Coordinate System: CT State Plane (m) Datum: NAD 83 Depth: meters, MLW
January 2005
Z
Mean RPD (cm)$ 0.00 - 1.00
! 1.01 - 2.00
#* 2.01 - 3.00
" 3.01 - 4.00
X 4.01 - 6.00
Figure 3-6. Distribution of mean apparent RPD depths (cm) at the WLDS reference areas
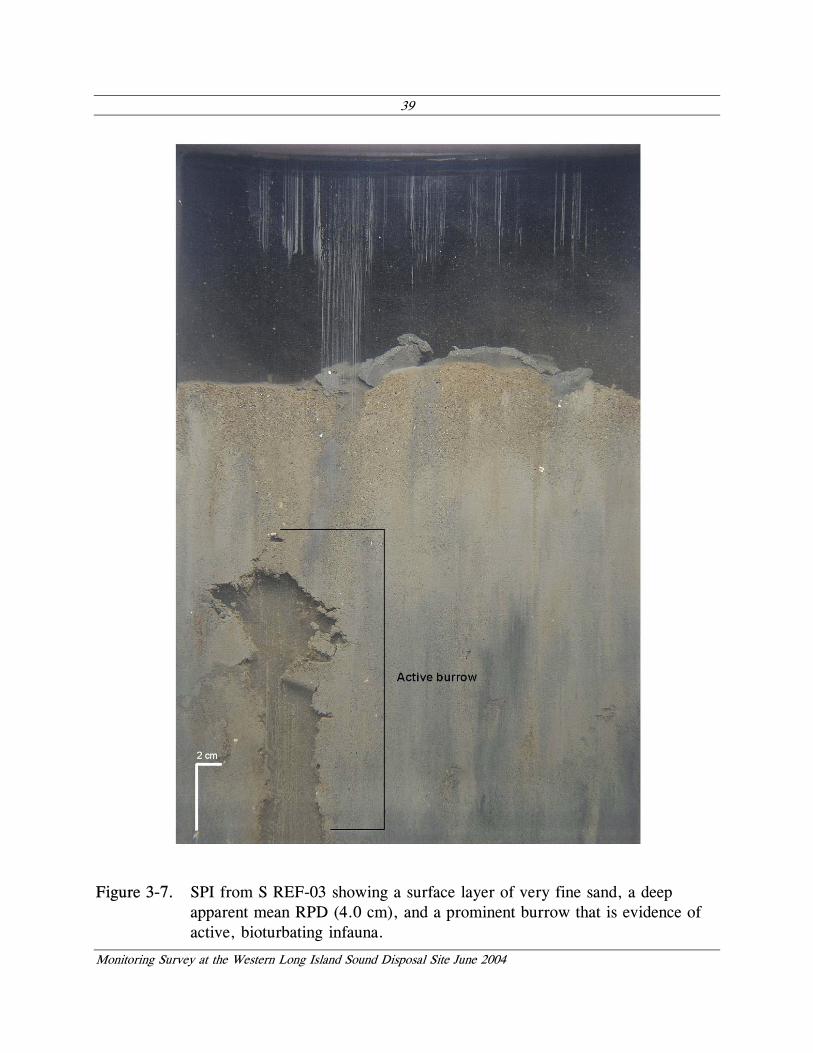
39
Monitoring Survey at the Western Long Island Sound Disposal Site June 2004
Figure 3-7. SPI from S REF-03 showing a surface layer of very fine sand, a deep apparent mean RPD (4.0 cm), and a prominent burrow that is evidence of active, bioturbating infauna.
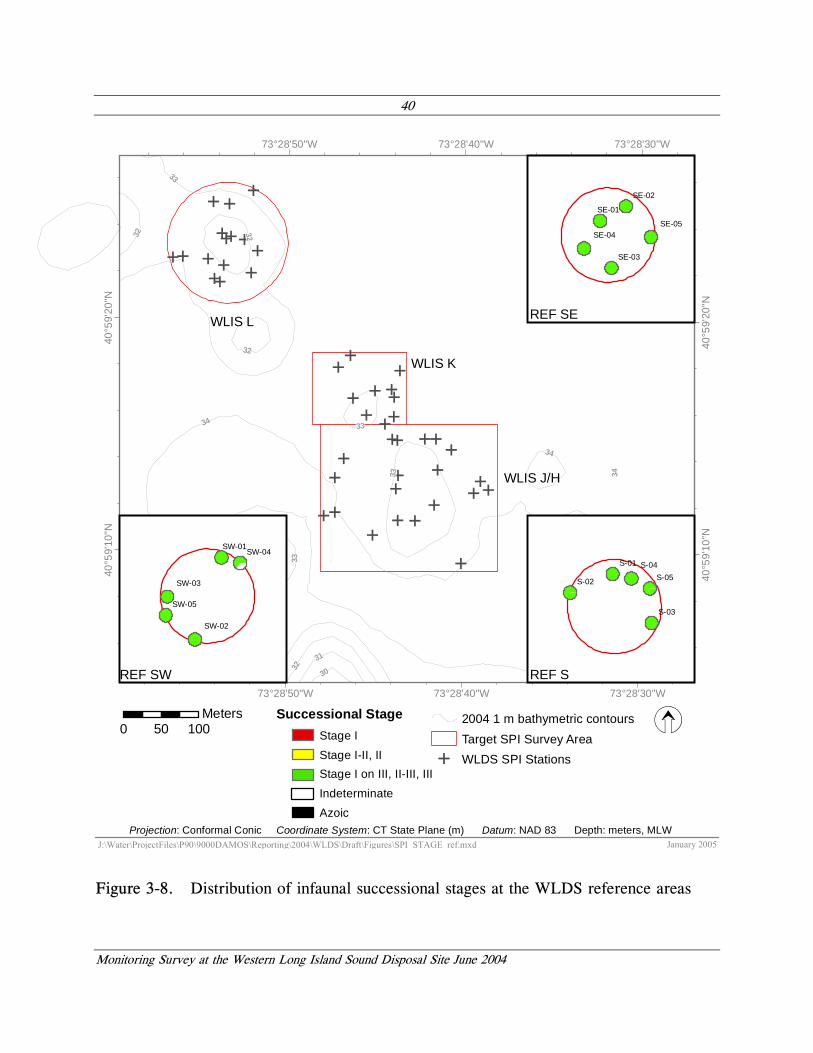
40
Monitoring Survey at the Western Long Island Sound Disposal Site June 2004
E
E
EE
E
E
E
E
E
E
E
E
E
E
E
E
E
E
E
EE
EE E
E
EE
E
E
E
EEE
E
E
E
EE
E
EE
E
EE
E
34
33
32
31
30
32
34
33
32
33
33
32
3433
32
73°28'50"W
73°28'50"W
73°28'40"W
73°28'40"W
73°28'30"W
73°28'30"W
40°5
9'10
"N
40°5
9'10
"N
40°5
9'20
"N
40°5
9'20
"N
SW-05
SW-04
SW-03
SW-02
SW-01
S-05S-04
S-03
S-02
S-01
WLIS L
WLIS K
WLIS J/H
SE-05SE-04
SE-03
SE-02
SE-01
REF SW REF S
REF SE
0 10050Meters 2004 1 m bathymetric contours
Target SPI Survey Area
E WLDS SPI Stations
J:\Water\ProjectFiles\P90\9000DAMOS\Reporting\2004\WLDS\Draft\Figures\SPI_STAGE_ref.mxdProjection: Conformal Conic Coordinate System: CT State Plane (m) Datum: NAD 83 Depth: meters, MLW
January 2005
ZSuccessional StageStage IStage I-II, IIStage I on III, II-III, IIIIndeterminateAzoic
Figure 3-8. Distribution of infaunal successional stages at the WLDS reference areas
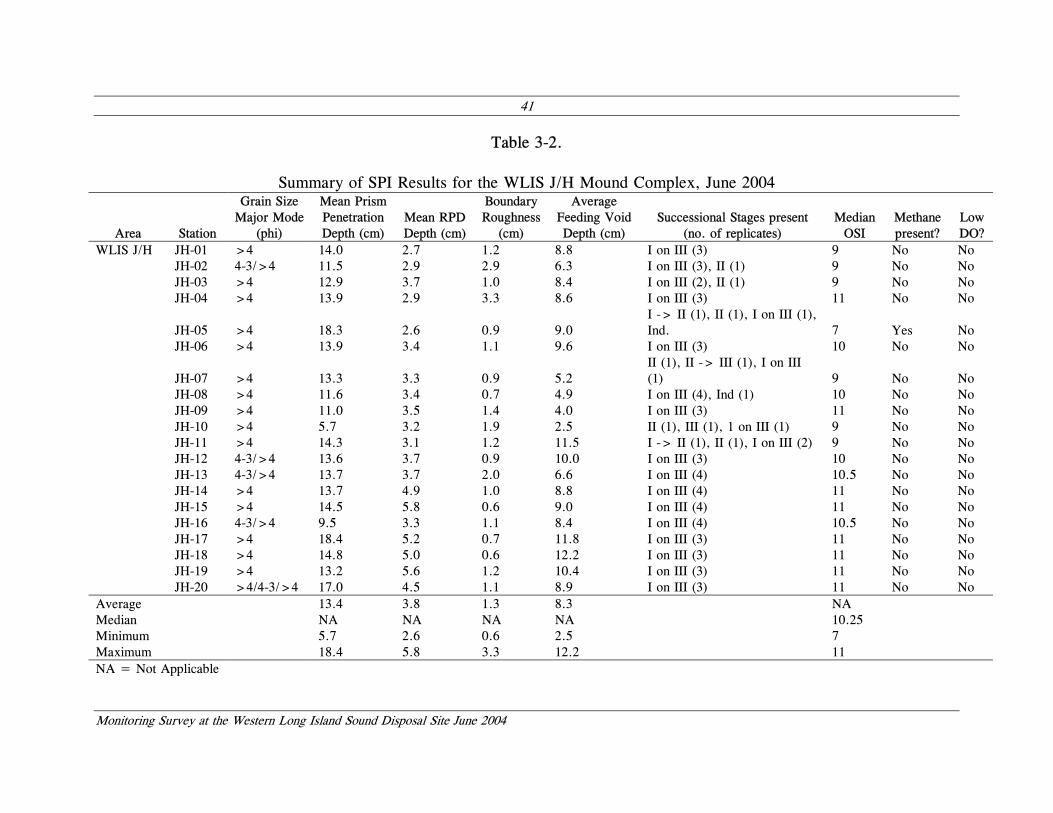
41
Monitoring Survey at the Western Long Island Sound Disposal Site June 2004
Table 3-2.
Summary of SPI Results for the WLIS J/H Mound Complex, June 2004
Area Station
Grain Size Major Mode
(phi)
Mean Prism Penetration Depth (cm)
Mean RPD Depth (cm)
Boundary Roughness
(cm)
Average Feeding Void Depth (cm)
Successional Stages present (no. of replicates)
Median OSI
Methane present?
Low DO?
WLIS J/H JH-01 >4 14.0 2.7 1.2 8.8 I on III (3) 9 No No JH-02 4-3/>4 11.5 2.9 2.9 6.3 I on III (3), II (1) 9 No No JH-03 >4 12.9 3.7 1.0 8.4 I on III (2), II (1) 9 No No JH-04 >4 13.9 2.9 3.3 8.6 I on III (3) 11 No No
JH-05 >4 18.3 2.6 0.9 9.0 I -> II (1), II (1), I on III (1), Ind. 7 Yes No
JH-06 >4 13.9 3.4 1.1 9.6 I on III (3) 10 No No
JH-07 >4 13.3 3.3 0.9 5.2 II (1), II -> III (1), I on III (1) 9 No No
JH-08 >4 11.6 3.4 0.7 4.9 I on III (4), Ind (1) 10 No No JH-09 >4 11.0 3.5 1.4 4.0 I on III (3) 11 No No JH-10 >4 5.7 3.2 1.9 2.5 II (1), III (1), 1 on III (1) 9 No No JH-11 >4 14.3 3.1 1.2 11.5 I -> II (1), II (1), I on III (2) 9 No No JH-12 4-3/>4 13.6 3.7 0.9 10.0 I on III (3) 10 No No JH-13 4-3/>4 13.7 3.7 2.0 6.6 I on III (4) 10.5 No No JH-14 >4 13.7 4.9 1.0 8.8 I on III (4) 11 No No JH-15 >4 14.5 5.8 0.6 9.0 I on III (4) 11 No No JH-16 4-3/>4 9.5 3.3 1.1 8.4 I on III (4) 10.5 No No JH-17 >4 18.4 5.2 0.7 11.8 I on III (3) 11 No No JH-18 >4 14.8 5.0 0.6 12.2 I on III (3) 11 No No JH-19 >4 13.2 5.6 1.2 10.4 I on III (3) 11 No No JH-20 >4/4-3/>4 17.0 4.5 1.1 8.9 I on III (3) 11 No No Average 13.4 3.8 1.3 8.3 NA Median NA NA NA NA 10.25 Minimum 5.7 2.6 0.6 2.5 7 Maximum 18.4 5.8 3.3 12.2 11 NA = Not Applicable
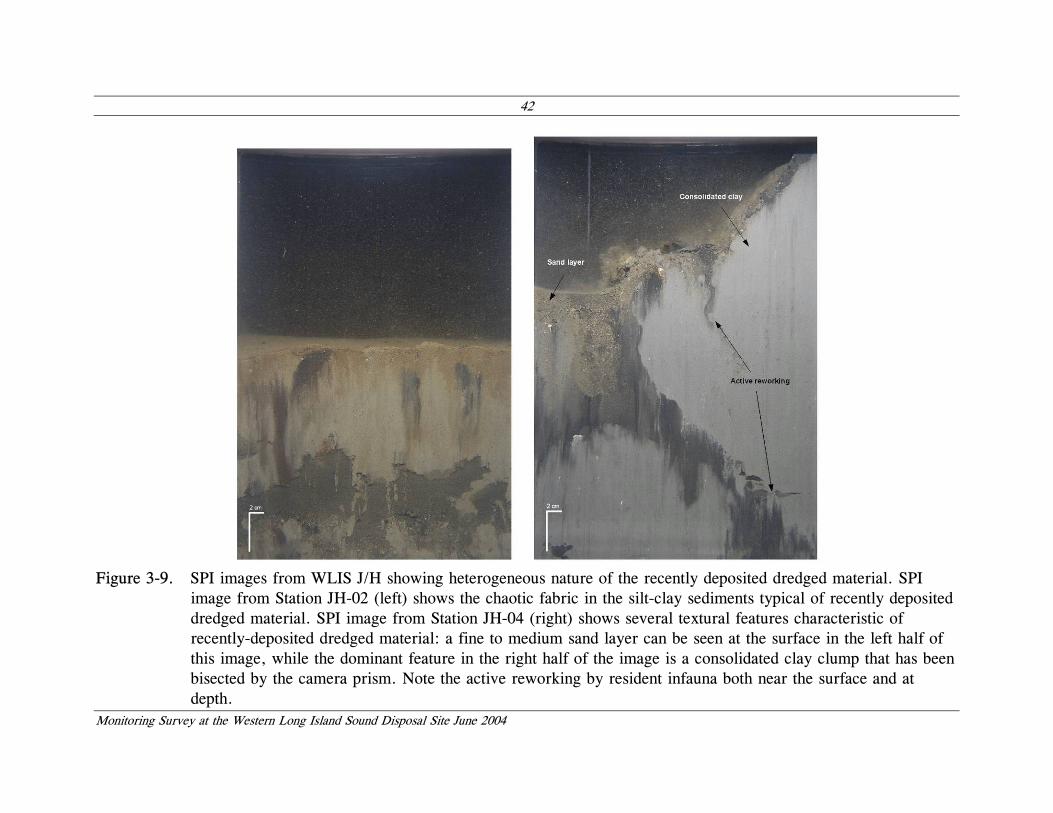
42
Monitoring Survey at the Western Long Island Sound Disposal Site June 2004
Figure 3-9. SPI images from WLIS J/H showing heterogeneous nature of the recently deposited dredged material. SPI
image from Station JH-02 (left) shows the chaotic fabric in the silt-clay sediments typical of recently deposited dredged material. SPI image from Station JH-04 (right) shows several textural features characteristic of recently-deposited dredged material: a fine to medium sand layer can be seen at the surface in the left half of this image, while the dominant feature in the right half of the image is a consolidated clay clump that has been bisected by the camera prism. Note the active reworking by resident infauna both near the surface and at depth.
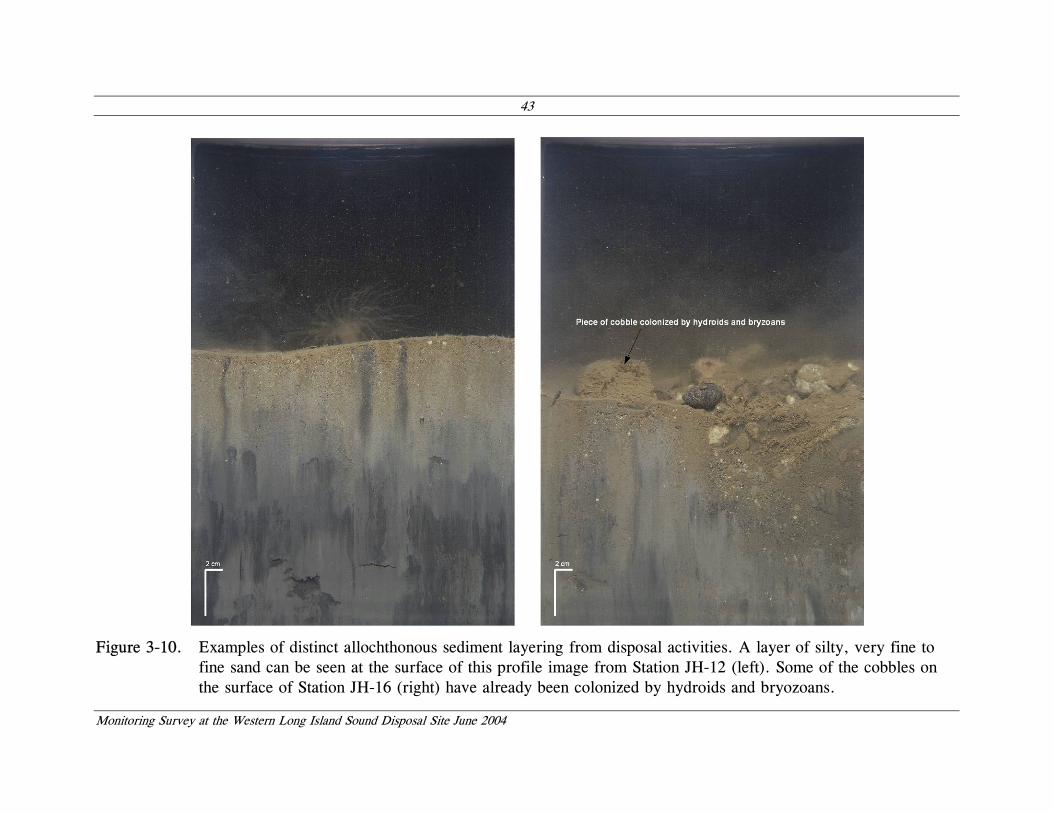
43
Monitoring Survey at the Western Long Island Sound Disposal Site June 2004
Figure 3-10. Examples of distinct allochthonous sediment layering from disposal activities. A layer of silty, very fine to
fine sand can be seen at the surface of this profile image from Station JH-12 (left). Some of the cobbles on the surface of Station JH-16 (right) have already been colonized by hydroids and bryozoans.
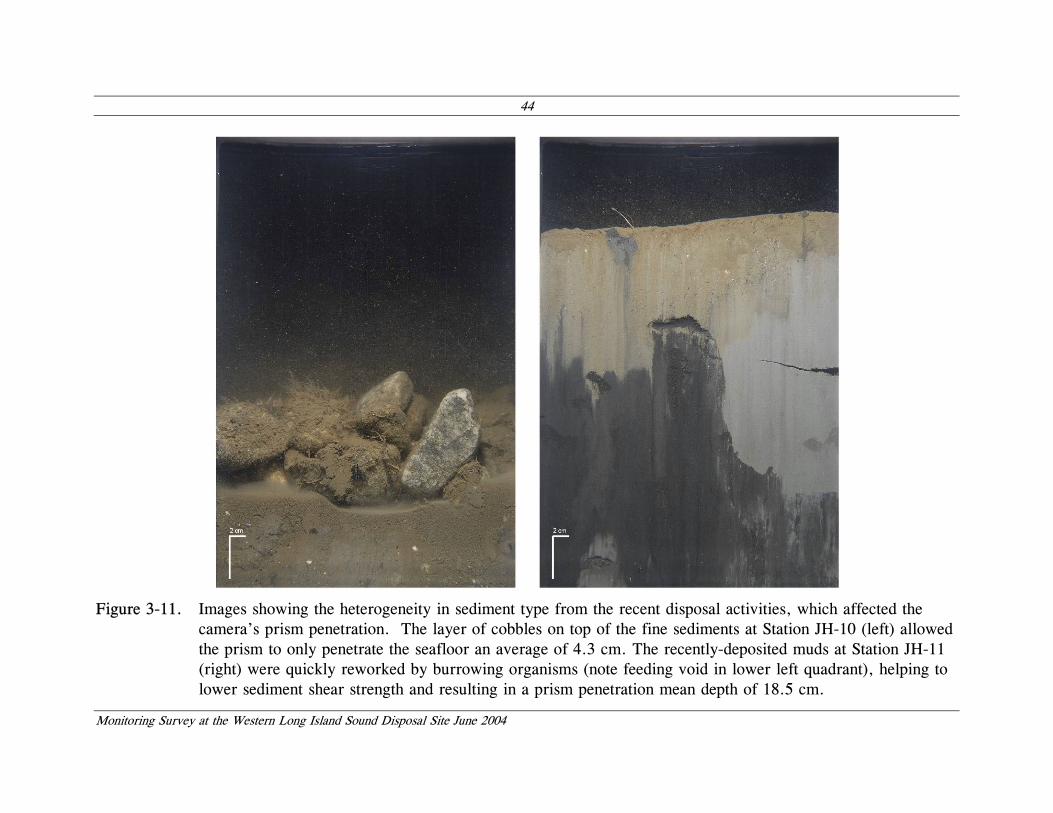
44
Monitoring Survey at the Western Long Island Sound Disposal Site June 2004
Figure 3-11. Images showing the heterogeneity in sediment type from the recent disposal activities, which affected the
camera’s prism penetration. The layer of cobbles on top of the fine sediments at Station JH-10 (left) allowed the prism to only penetrate the seafloor an average of 4.3 cm. The recently-deposited muds at Station JH-11 (right) were quickly reworked by burrowing organisms (note feeding void in lower left quadrant), helping to lower sediment shear strength and resulting in a prism penetration mean depth of 18.5 cm.
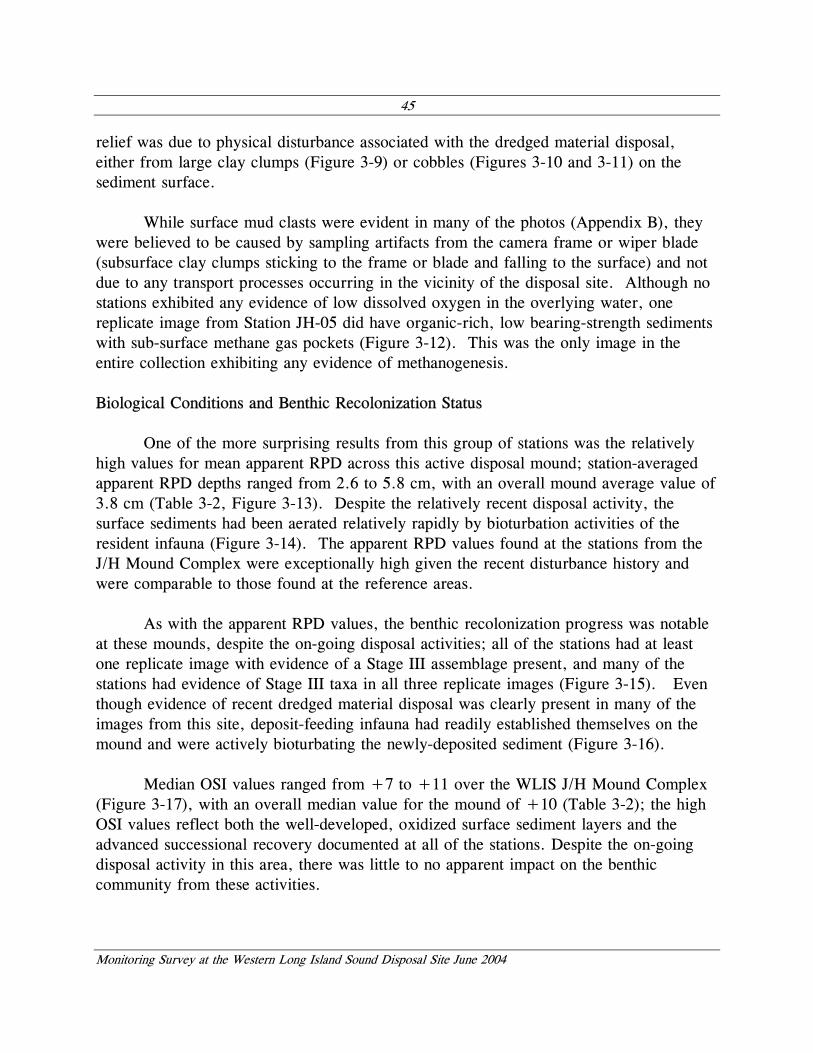
45
Monitoring Survey at the Western Long Island Sound Disposal Site June 2004
relief was due to physical disturbance associated with the dredged material disposal, either from large clay clumps (Figure 3-9) or cobbles (Figures 3-10 and 3-11) on the sediment surface.
While surface mud clasts were evident in many of the photos (Appendix B), they were believed to be caused by sampling artifacts from the camera frame or wiper blade (subsurface clay clumps sticking to the frame or blade and falling to the surface) and not due to any transport processes occurring in the vicinity of the disposal site. Although no stations exhibited any evidence of low dissolved oxygen in the overlying water, one replicate image from Station JH-05 did have organic-rich, low bearing-strength sediments with sub-surface methane gas pockets (Figure 3-12). This was the only image in the entire collection exhibiting any evidence of methanogenesis.
Biological Conditions and Benthic Recolonization Status
One of the more surprising results from this group of stations was the relatively high values for mean apparent RPD across this active disposal mound; station-averaged apparent RPD depths ranged from 2.6 to 5.8 cm, with an overall mound average value of 3.8 cm (Table 3-2, Figure 3-13). Despite the relatively recent disposal activity, the surface sediments had been aerated relatively rapidly by bioturbation activities of the resident infauna (Figure 3-14). The apparent RPD values found at the stations from the J/H Mound Complex were exceptionally high given the recent disturbance history and were comparable to those found at the reference areas.
As with the apparent RPD values, the benthic recolonization progress was notable
at these mounds, despite the on-going disposal activities; all of the stations had at least one replicate image with evidence of a Stage III assemblage present, and many of the stations had evidence of Stage III taxa in all three replicate images (Figure 3-15). Even though evidence of recent dredged material disposal was clearly present in many of the images from this site, deposit-feeding infauna had readily established themselves on the mound and were actively bioturbating the newly-deposited sediment (Figure 3-16).
Median OSI values ranged from +7 to +11 over the WLIS J/H Mound Complex
(Figure 3-17), with an overall median value for the mound of +10 (Table 3-2); the high OSI values reflect both the well-developed, oxidized surface sediment layers and the advanced successional recovery documented at all of the stations. Despite the on-going disposal activity in this area, there was little to no apparent impact on the benthic community from these activities.
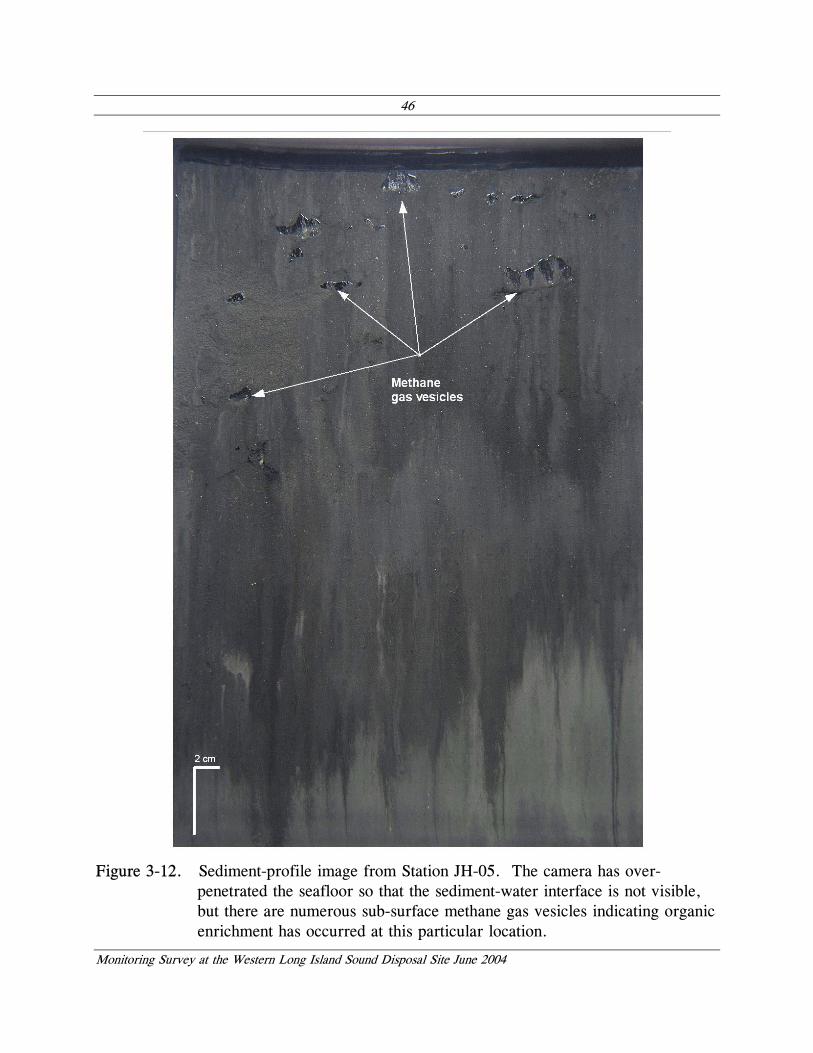
46
Monitoring Survey at the Western Long Island Sound Disposal Site June 2004
Figure 3-12. Sediment-profile image from Station JH-05. The camera has over-
penetrated the seafloor so that the sediment-water interface is not visible, but there are numerous sub-surface methane gas vesicles indicating organic enrichment has occurred at this particular location.
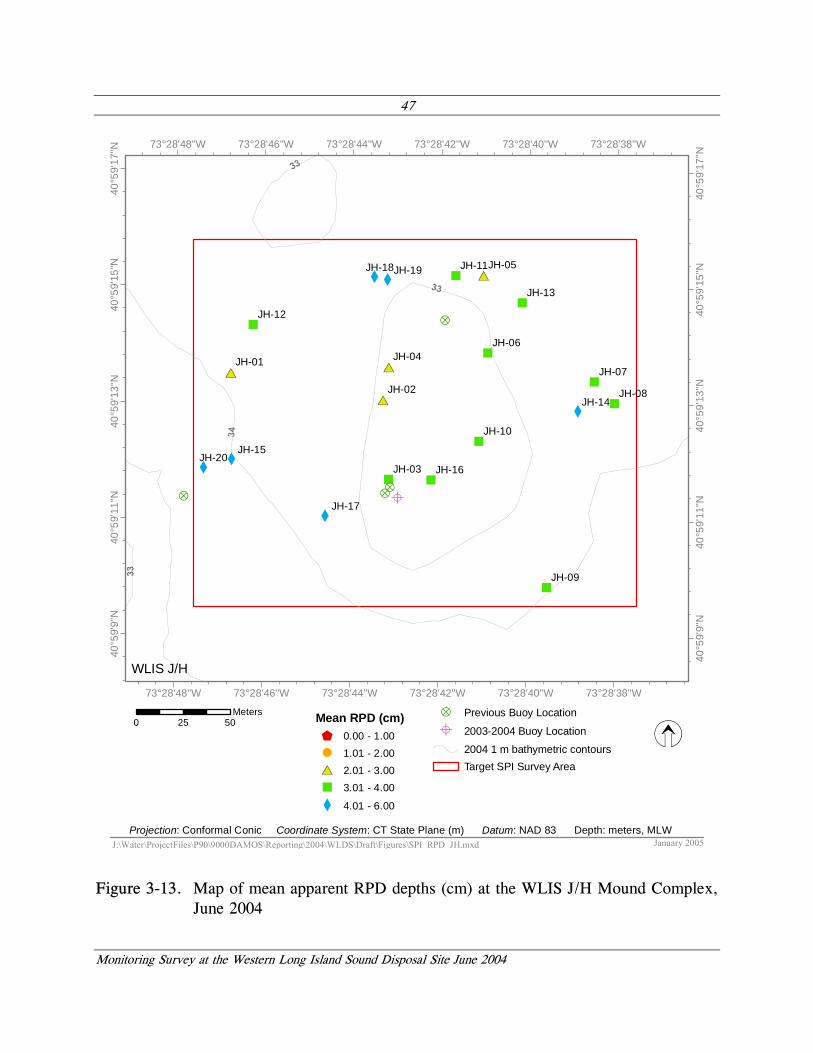
47
Monitoring Survey at the Western Long Island Sound Disposal Site June 2004
J:\Water\ProjectFiles\P90\9000DAMOS\Reporting\2004\WLDS\Draft\Figures\SPI_RPD_JH.mxdProjection: Conformal Conic Coordinate System: CT State Plane (m) Datum: NAD 83 Depth: meters, MLW
January 2005
Z
WLIS J/H
#*
#*
"
#*
#*
"
"
"
"
"
"
"
"
X
X
"
X
XX
X
?
??A?
JH-20
JH-19JH-18
JH-17
JH-16
JH-15
JH-14
JH-13
JH-12
JH-11
JH-10
JH-09
JH-08
JH-07
JH-06
JH-05
JH-04
JH-03
JH-02
JH-01
73°28'48"W
73°28'48"W
73°28'46"W
73°28'46"W
73°28'44"W
73°28'44"W
73°28'42"W
73°28'42"W
73°28'40"W
73°28'40"W
73°28'38"W
73°28'38"W
40°5
9'9"
N
40°5
9'9"
N
40°5
9'11
"N
40°5
9'11
"N
40°5
9'13
"N
40°5
9'13
"N
40°5
9'15
"N
40°5
9'15
"N
40°5
9'17
"N
40°5
9'17
"N
0 5025Meters ? Previous Buoy Location
A 2003-2004 Buoy Location
2004 1 m bathymetric contoursTarget SPI Survey Area
Mean RPD (cm)$ 0.00 - 1.00
! 1.01 - 2.00
#* 2.01 - 3.00
" 3.01 - 4.00
X 4.01 - 6.00
Figure 3-13. Map of mean apparent RPD depths (cm) at the WLIS J/H Mound Complex, June 2004
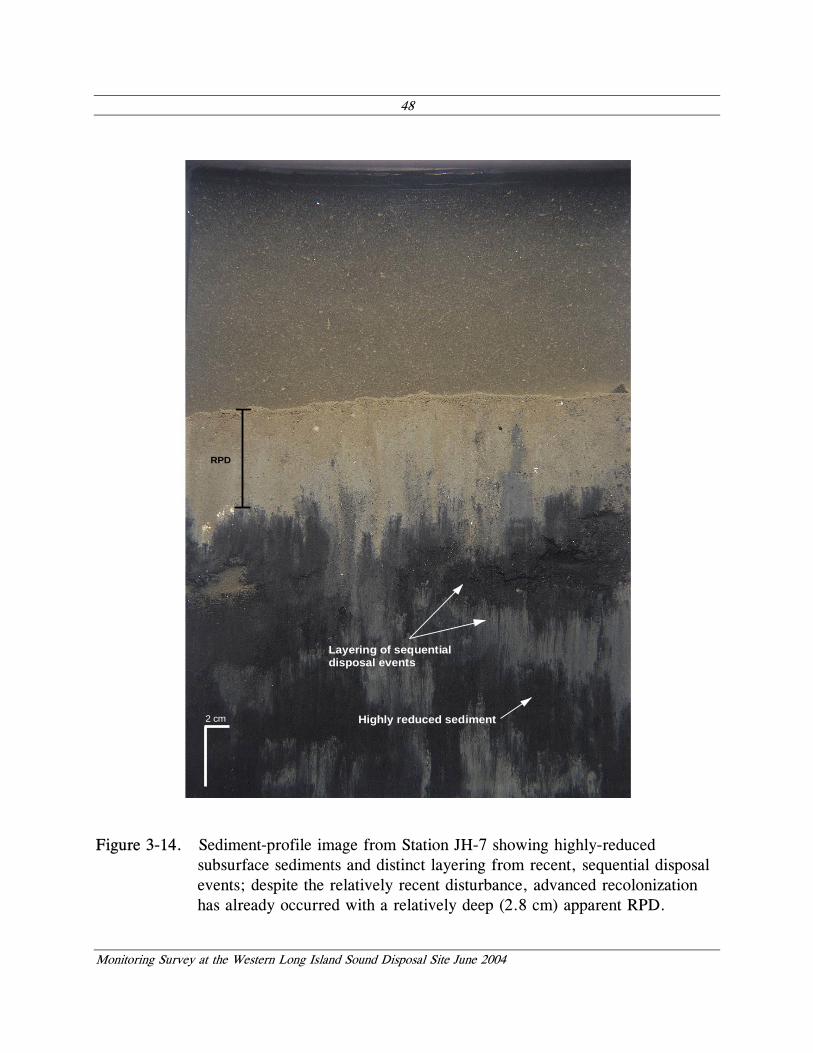
48
Monitoring Survey at the Western Long Island Sound Disposal Site June 2004
Layering of sequentialdisposal events
2 cm Highly reduced sediment
RPD
Figure 3-14. Sediment-profile image from Station JH-7 showing highly-reduced
subsurface sediments and distinct layering from recent, sequential disposal events; despite the relatively recent disturbance, advanced recolonization has already occurred with a relatively deep (2.8 cm) apparent RPD.
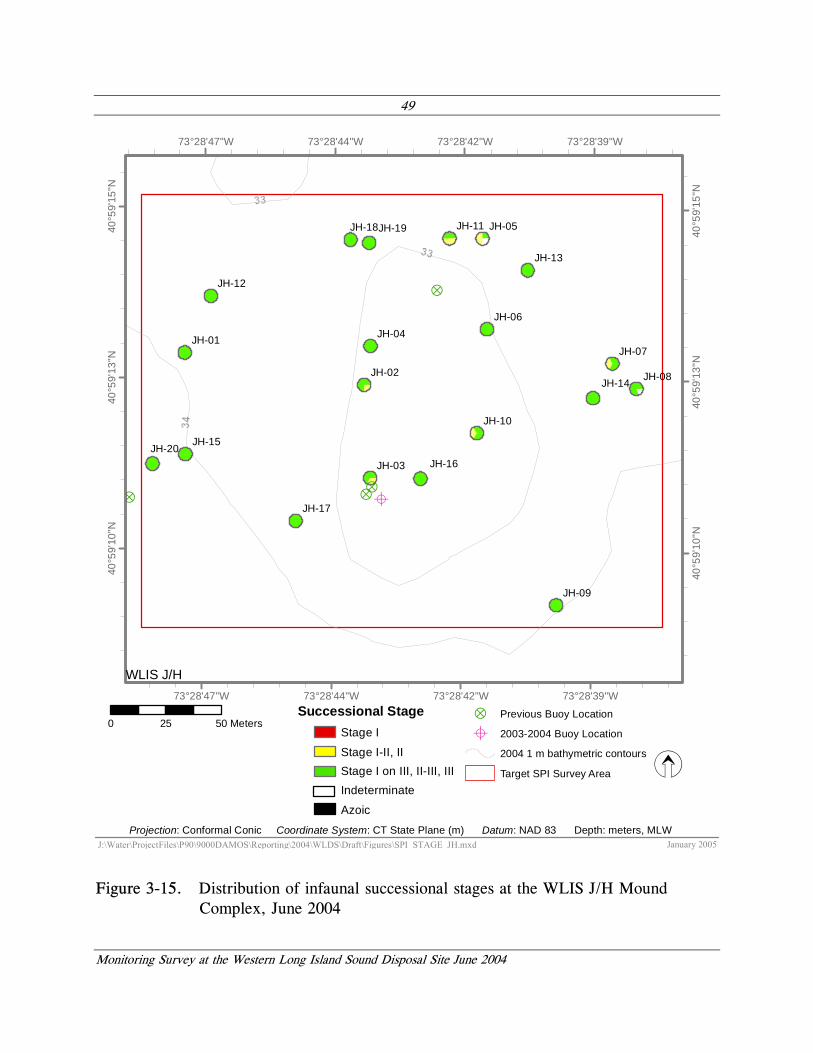
49
Monitoring Survey at the Western Long Island Sound Disposal Site June 2004
?
??A?
JH-20
JH-19JH-18
JH-17
JH-16
JH-15
JH-14
JH-13
JH-12
JH-11
JH-10
JH-09
JH-08
JH-07
JH-06
JH-05
JH-04
JH-03
JH-02
JH-01
73°28'47"W
73°28'47"W
73°28'44"W
73°28'44"W
73°28'42"W
73°28'42"W
73°28'39"W
73°28'39"W
40°5
9'10
"N
40°5
9'10
"N
40°5
9'13
"N
40°5
9'13
"N
40°5
9'15
"N
40°5
9'15
"N
WLIS J/H
J:\Water\ProjectFiles\P90\9000DAMOS\Reporting\2004\WLDS\Draft\Figures\SPI_STAGE_JH.mxdProjection: Conformal Conic Coordinate System: CT State Plane (m) Datum: NAD 83 Depth: meters, MLW
January 2005
Z
Successional StageStage I
Stage I-II, IIStage I on III, II-III, IIIIndeterminate
Azoic
0 5025 Meters? Previous Buoy Location
A 2003-2004 Buoy Location
2004 1 m bathymetric contours
Target SPI Survey Area
Figure 3-15. Distribution of infaunal successional stages at the WLIS J/H Mound Complex, June 2004
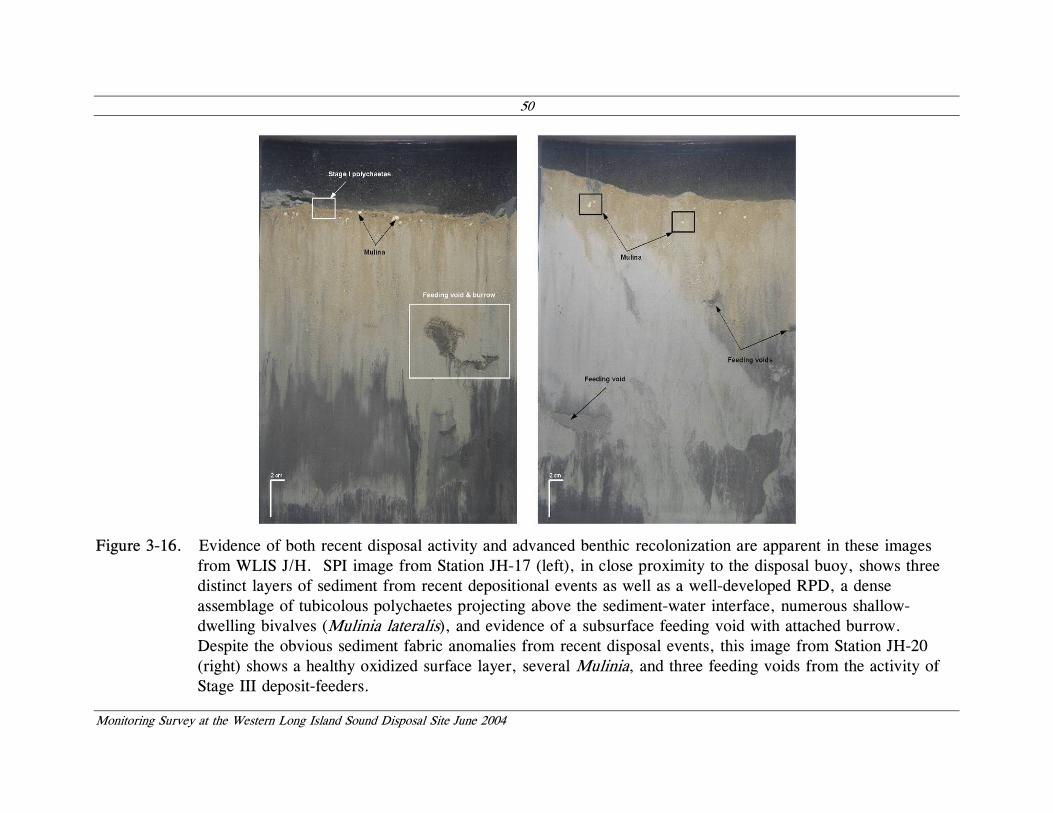
50
Monitoring Survey at the Western Long Island Sound Disposal Site June 2004
Figure 3-16. Evidence of both recent disposal activity and advanced benthic recolonization are apparent in these images
from WLIS J/H. SPI image from Station JH-17 (left), in close proximity to the disposal buoy, shows three distinct layers of sediment from recent depositional events as well as a well-developed RPD, a dense assemblage of tubicolous polychaetes projecting above the sediment-water interface, numerous shallow-dwelling bivalves (Mulinia lateralis), and evidence of a subsurface feeding void with attached burrow. Despite the obvious sediment fabric anomalies from recent disposal events, this image from Station JH-20 (right) shows a healthy oxidized surface layer, several Mulinia, and three feeding voids from the activity of Stage III deposit-feeders.
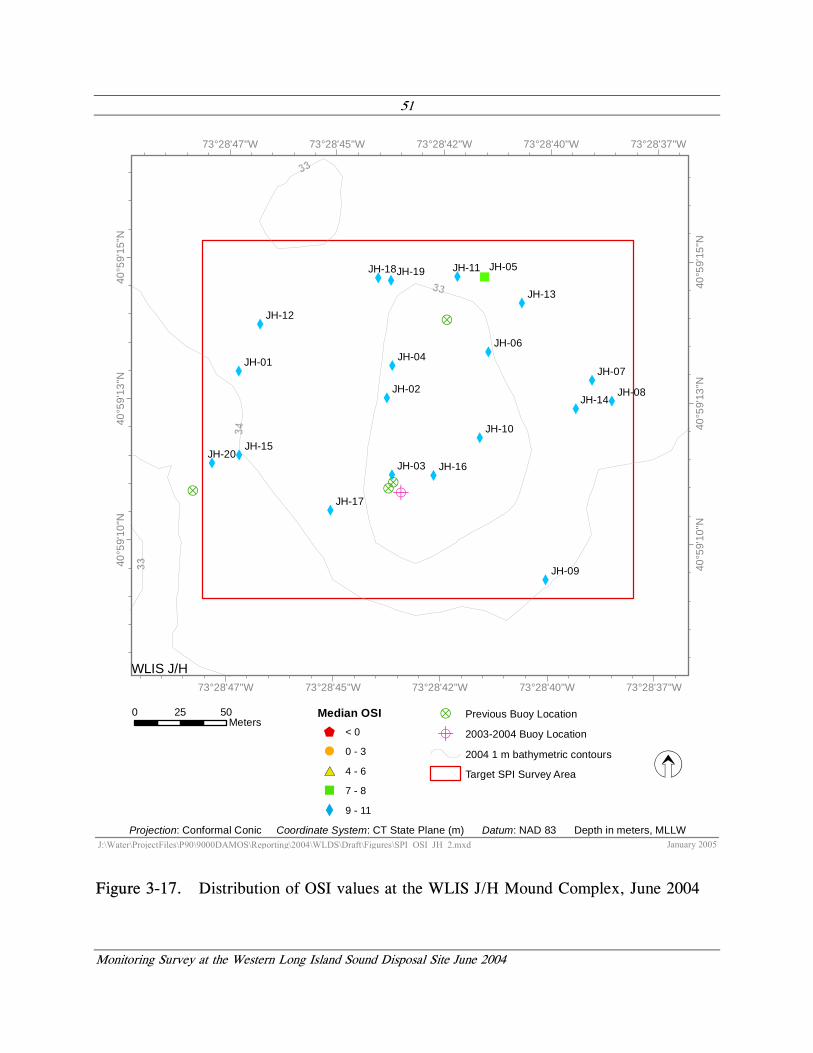
51
Monitoring Survey at the Western Long Island Sound Disposal Site June 2004
J:\Water\ProjectFiles\P90\9000DAMOS\Reporting\2004\WLDS\Draft\Figures\SPI_OSI_JH_2.mxdProjection: Conformal Conic Coordinate System: CT State Plane (m) Datum: NAD 83 Depth in meters, MLLW
January 2005
Z
WLIS J/H
X
X
X
X
"
X
X
X
X
X
X
X
X
X
X
X
X
XX
X
?
??A?
JH-20
JH-19JH-18
JH-17
JH-16
JH-15
JH-14
JH-13
JH-12
JH-11
JH-10
JH-09
JH-08
JH-07
JH-06
JH-05
JH-04
JH-03
JH-02
JH-01
73°28'47"W
73°28'47"W
73°28'45"W
73°28'45"W
73°28'42"W
73°28'42"W
73°28'40"W
73°28'40"W
73°28'37"W
73°28'37"W
40°5
9'10
"N
40°5
9'10
"N
40°5
9'13
"N
40°5
9'13
"N
40°5
9'15
"N
40°5
9'15
"N0 5025
Meters? Previous Buoy Location
A 2003-2004 Buoy Location
2004 1 m bathymetric contours
Target SPI Survey Area
Median OSI$ < 0
! 0 - 3
#* 4 - 6
" 7 - 8
X 9 - 11
Figure 3-17. Distribution of OSI values at the WLIS J/H Mound Complex, June 2004

52
Monitoring Survey at the Western Long Island Sound Disposal Site June 2004
3.2.3 WLIS K and WLIS L Mounds
The summary data for the WLIS K and L Mounds are presented in Tables 3-3 and 3-4, respectively. These historic disposal mounds are located to the north (WLIS K) and northwest (WLIS L) of the active disposal buoy (Figure 1-2). Because these two mounds are older and in close spatial vicinity to each other, their results are discussed together. As expected, evidence of historic dredged material greater than prism penetration was observed in all the images collected on both mounds.
Sediment Physical Characteristics
The sediments at the WLIS K Mound, the mound closest to the active disposal area, were primarily muds, with a grain-size major mode of >4 phi. At least one or more replicate image from six of the ten stations surveyed had a coarser surface layer of silty, very fine sand overlying the silt-clay muds (Appendix B, Figure 3-18). The sediments at the WLIS L Mound were similar, with surface layers of silty fine or very fine sand found at eight of the fifteen stations sampled; one station (L-05) had a layer of larger pebbles/cobbles on the sediment surface from the historical disposal activity (Figure 3-19).
With the similarity of the sediment types at both mounds, it was not unexpected
that camera prism penetration would be similar at both areas; station-averaged prism penetration at the WLIS K Mound ranged from 10.5 to 15.8 cm (Table 3-3), while average penetration at the WLIS L Mound ranged from 10.4 to 14.8 cm (Table 3-4). Small-scale boundary roughness values ranged from 0.5 to 1.4 cm on the WLIS K Mound and 0.6 to 3.4 cm on the WLIS L Mound; the majority of the small scale topographic features were caused by physical processes associated with the historic disposal activities. Some consolidated clay clumps from disposal operations were still evident on the WLIS L Mound (Figure 3-20).
Small, reduced mud clasts were evident on the seafloor surface in many of the
images, but as with the WLIS J/H Mound Complex, these were not indicative of recent sediment transport, but instead were attributed to artifacts deposited on the surface from the camera (mud clinging to the wiper blade or base sled). None of the images from the 35 stations on both mounds showed evidence of low dissolved oxygen in the overlying water, and no evidence of subsurface methane production was detected in any of the replicate images.
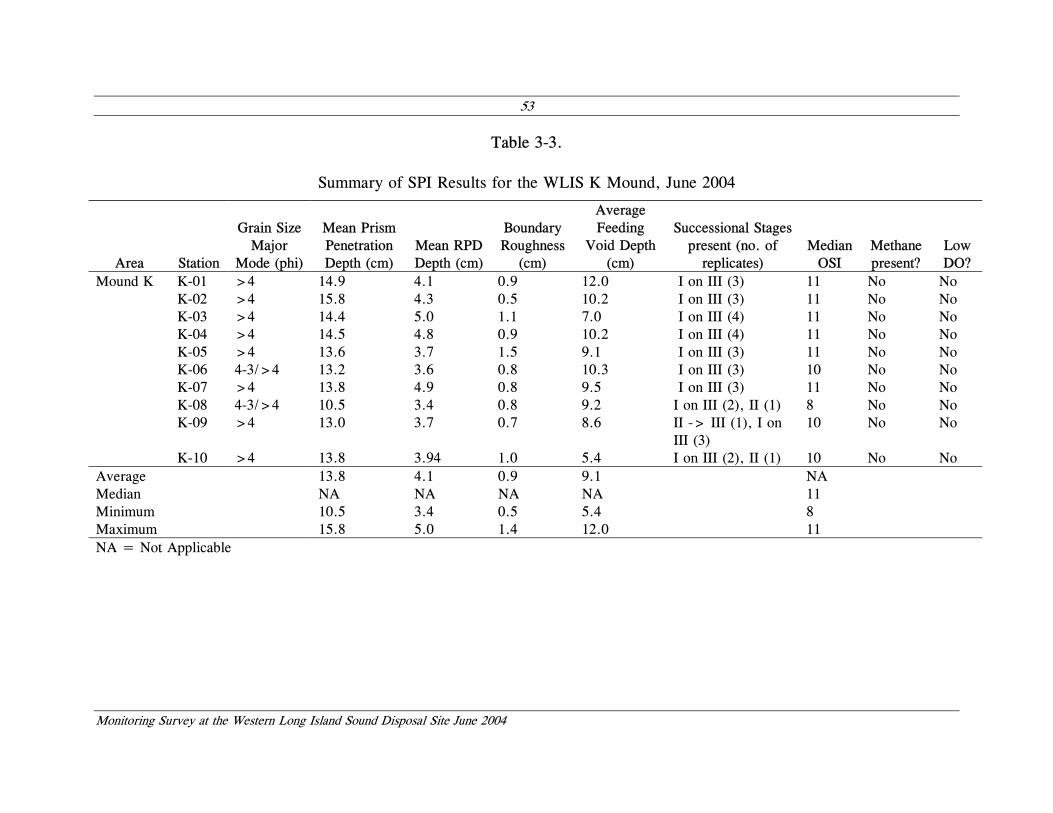
53
Monitoring Survey at the Western Long Island Sound Disposal Site June 2004
Table 3-3.
Summary of SPI Results for the WLIS K Mound, June 2004
Area Station
Grain Size Major
Mode (phi)
Mean Prism Penetration Depth (cm)
Mean RPD Depth (cm)
Boundary Roughness
(cm)
Average Feeding
Void Depth (cm)
Successional Stages present (no. of
replicates) Median
OSI Methane present?
Low DO?
Mound K K-01 >4 14.9 4.1 0.9 12.0 I on III (3) 11 No No K-02 >4 15.8 4.3 0.5 10.2 I on III (3) 11 No No K-03 >4 14.4 5.0 1.1 7.0 I on III (4) 11 No No K-04 >4 14.5 4.8 0.9 10.2 I on III (4) 11 No No K-05 >4 13.6 3.7 1.5 9.1 I on III (3) 11 No No K-06 4-3/>4 13.2 3.6 0.8 10.3 I on III (3) 10 No No K-07 >4 13.8 4.9 0.8 9.5 I on III (3) 11 No No K-08 4-3/>4 10.5 3.4 0.8 9.2 I on III (2), II (1) 8 No No K-09 >4 13.0 3.7 0.7 8.6 II -> III (1), I on
III (3) 10 No No
K-10 >4 13.8 3.94 1.0 5.4 I on III (2), II (1) 10 No No Average 13.8 4.1 0.9 9.1 NA Median NA NA NA NA 11 Minimum 10.5 3.4 0.5 5.4 8 Maximum 15.8 5.0 1.4 12.0 11 NA = Not Applicable
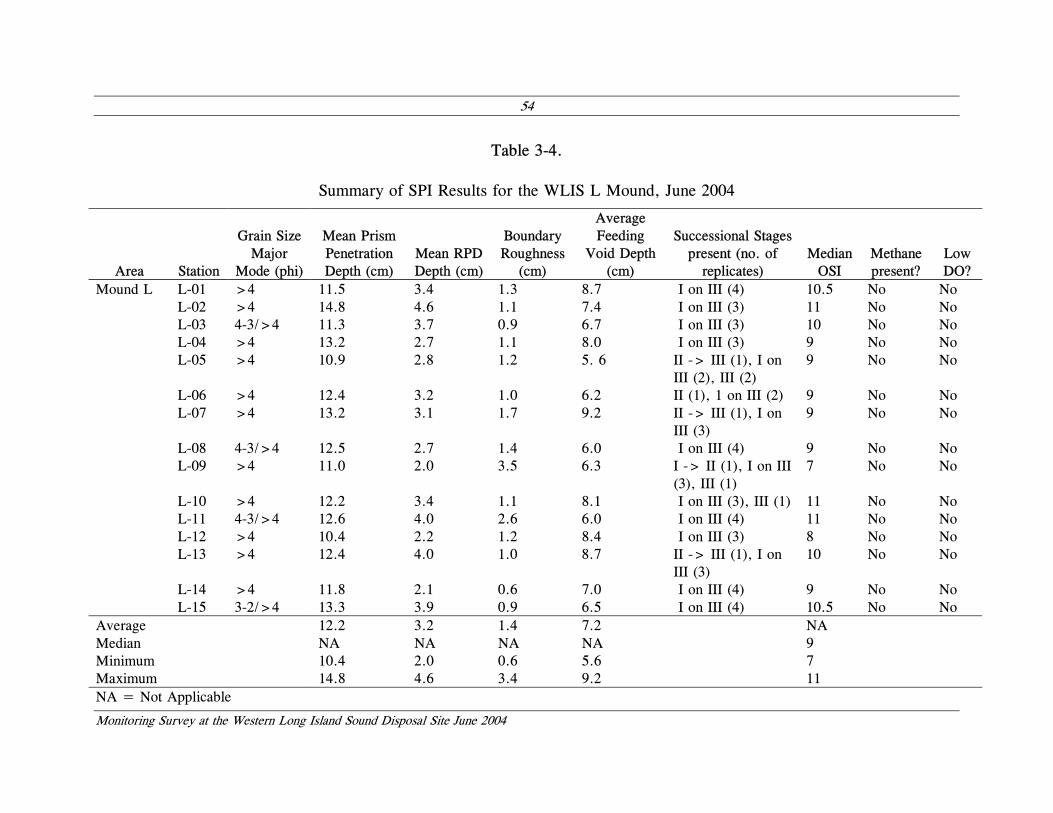
54
Monitoring Survey at the Western Long Island Sound Disposal Site June 2004
Table 3-4.
Summary of SPI Results for the WLIS L Mound, June 2004
Area Station
Grain Size Major
Mode (phi)
Mean Prism Penetration Depth (cm)
Mean RPD Depth (cm)
Boundary Roughness
(cm)
Average Feeding
Void Depth (cm)
Successional Stages present (no. of
replicates) Median
OSI Methane present?
Low DO?
Mound L L-01 >4 11.5 3.4 1.3 8.7 I on III (4) 10.5 No No L-02 >4 14.8 4.6 1.1 7.4 I on III (3) 11 No No L-03 4-3/>4 11.3 3.7 0.9 6.7 I on III (3) 10 No No L-04 >4 13.2 2.7 1.1 8.0 I on III (3) 9 No No L-05 >4 10.9 2.8 1.2 5. 6 II -> III (1), I on
III (2), III (2) 9 No No
L-06 >4 12.4 3.2 1.0 6.2 II (1), 1 on III (2) 9 No No L-07 >4 13.2 3.1 1.7 9.2 II -> III (1), I on
III (3) 9 No No
L-08 4-3/>4 12.5 2.7 1.4 6.0 I on III (4) 9 No No L-09 >4 11.0 2.0 3.5 6.3 I -> II (1), I on III
(3), III (1) 7 No No
L-10 >4 12.2 3.4 1.1 8.1 I on III (3), III (1) 11 No No L-11 4-3/>4 12.6 4.0 2.6 6.0 I on III (4) 11 No No L-12 >4 10.4 2.2 1.2 8.4 I on III (3) 8 No No L-13 >4 12.4 4.0 1.0 8.7 II -> III (1), I on
III (3) 10 No No
L-14 >4 11.8 2.1 0.6 7.0 I on III (4) 9 No No L-15 3-2/>4 13.3 3.9 0.9 6.5 I on III (4) 10.5 No No Average 12.2 3.2 1.4 7.2 NA Median NA NA NA NA 9 Minimum 10.4 2.0 0.6 5.6 7 Maximum 14.8 4.6 3.4 9.2 11 NA = Not Applicable
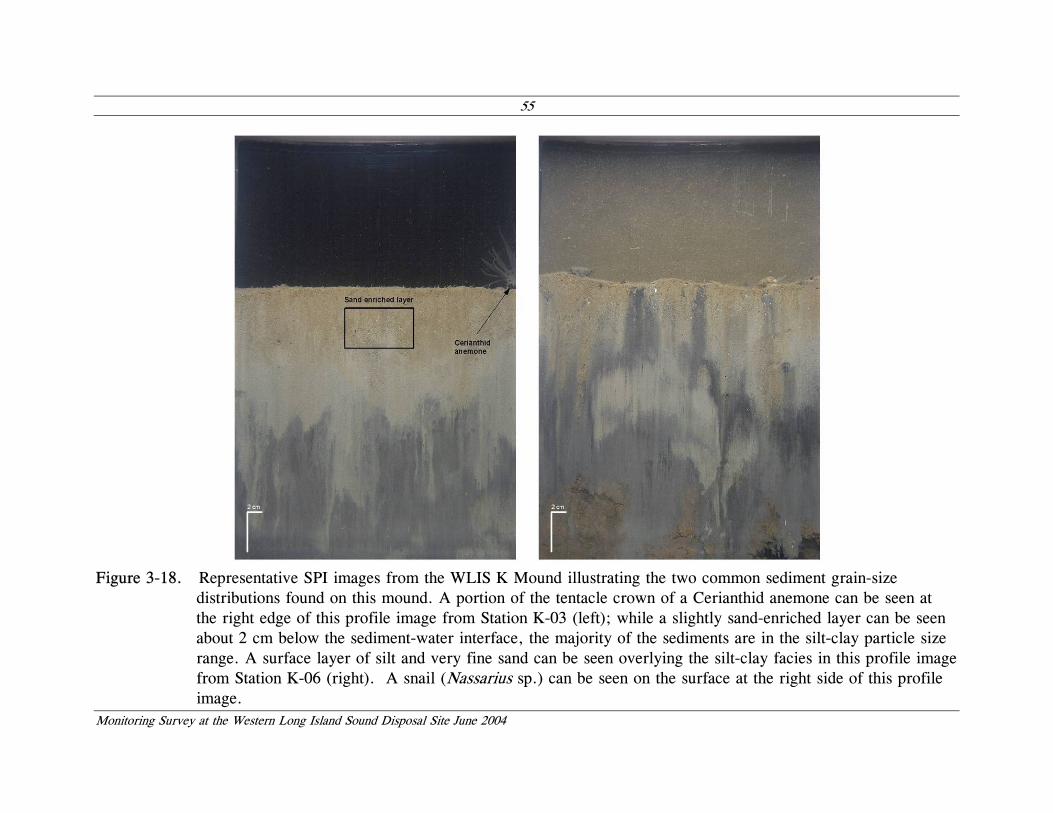
55
Monitoring Survey at the Western Long Island Sound Disposal Site June 2004
Figure 3-18. Representative SPI images from the WLIS K Mound illustrating the two common sediment grain-size
distributions found on this mound. A portion of the tentacle crown of a Cerianthid anemone can be seen at the right edge of this profile image from Station K-03 (left); while a slightly sand-enriched layer can be seen about 2 cm below the sediment-water interface, the majority of the sediments are in the silt-clay particle size range. A surface layer of silt and very fine sand can be seen overlying the silt-clay facies in this profile image from Station K-06 (right). A snail (Nassarius sp.) can be seen on the surface at the right side of this profile image.
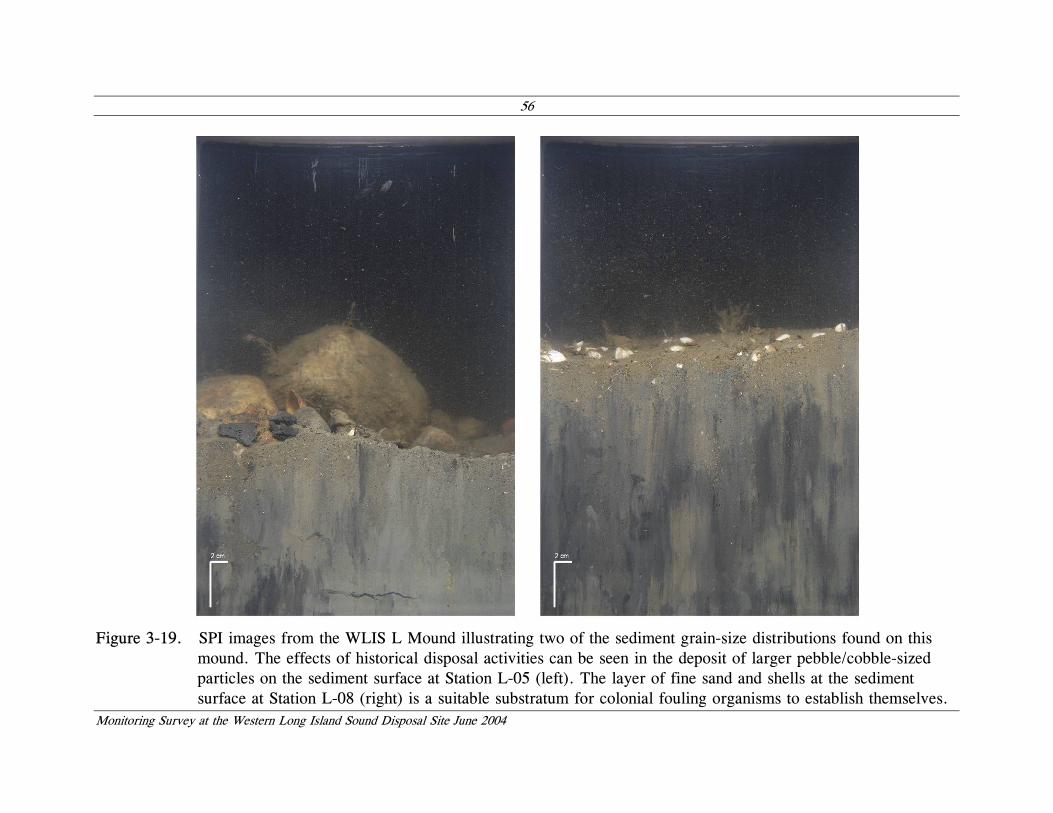
56
Monitoring Survey at the Western Long Island Sound Disposal Site June 2004
Figure 3-19. SPI images from the WLIS L Mound illustrating two of the sediment grain-size distributions found on this
mound. The effects of historical disposal activities can be seen in the deposit of larger pebble/cobble-sized particles on the sediment surface at Station L-05 (left). The layer of fine sand and shells at the sediment surface at Station L-08 (right) is a suitable substratum for colonial fouling organisms to establish themselves.
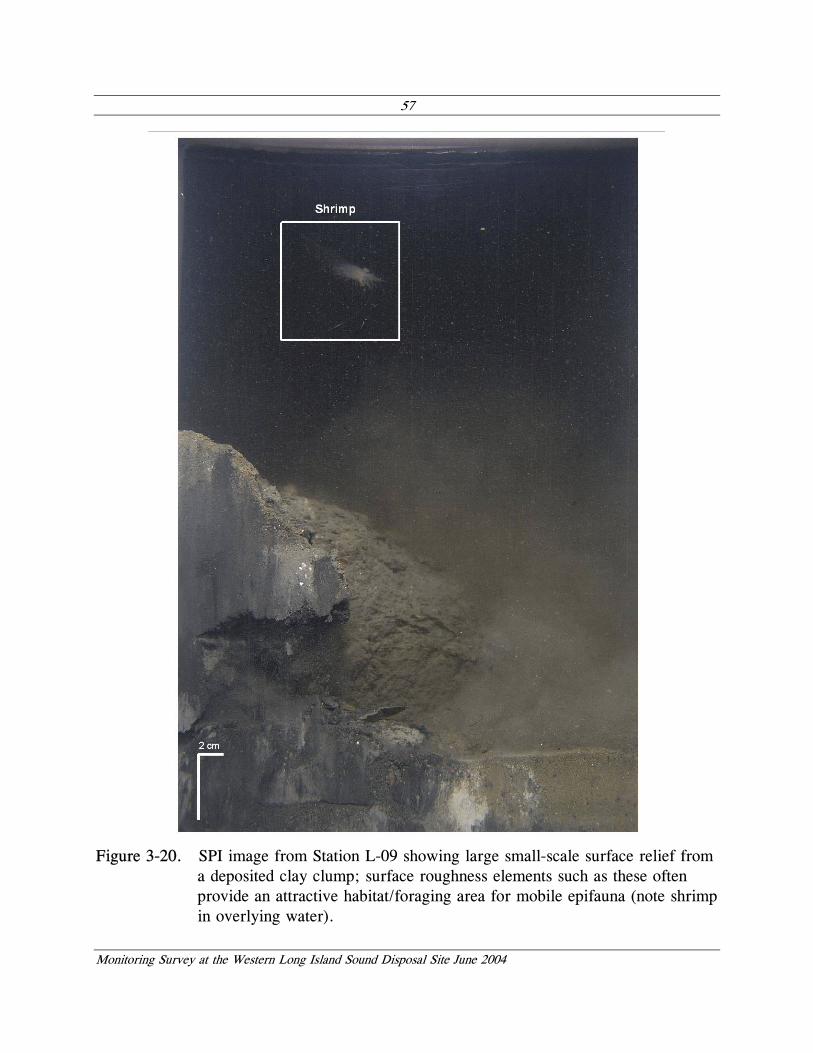
57
Monitoring Survey at the Western Long Island Sound Disposal Site June 2004
Figure 3-20. SPI image from Station L-09 showing large small-scale surface relief from
a deposited clay clump; surface roughness elements such as these often provide an attractive habitat/foraging area for mobile epifauna (note shrimp in overlying water).
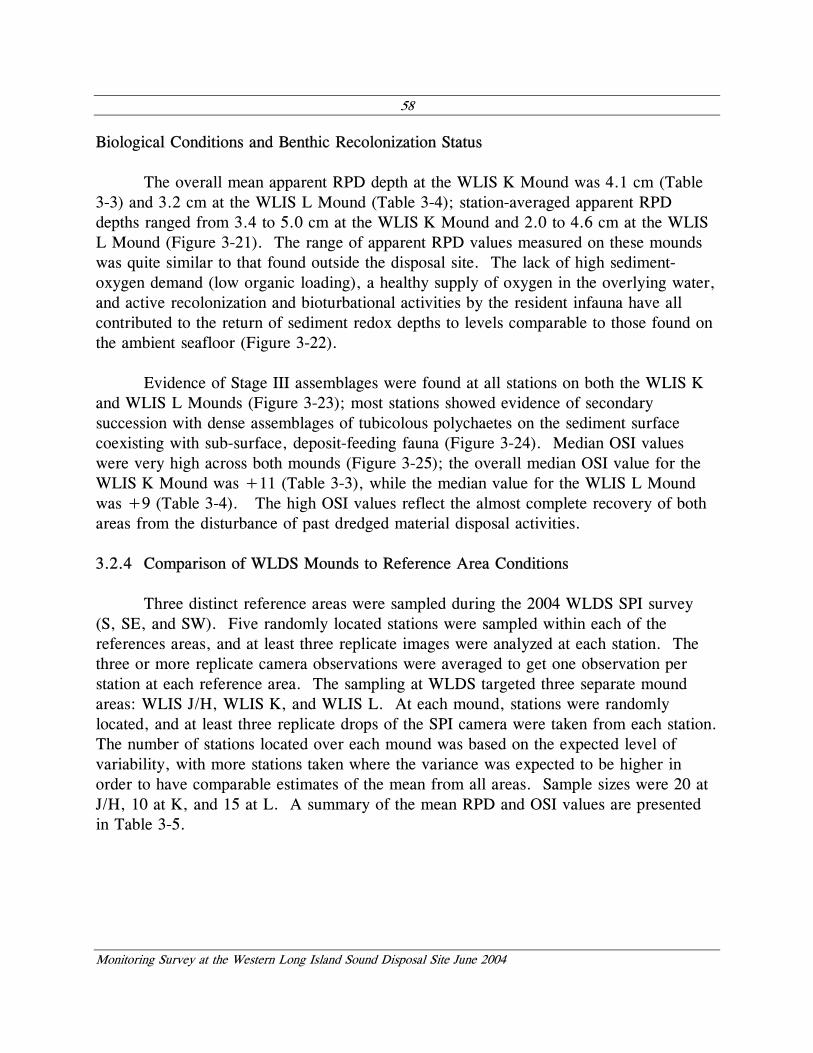
58
Monitoring Survey at the Western Long Island Sound Disposal Site June 2004
Biological Conditions and Benthic Recolonization Status
The overall mean apparent RPD depth at the WLIS K Mound was 4.1 cm (Table 3-3) and 3.2 cm at the WLIS L Mound (Table 3-4); station-averaged apparent RPD depths ranged from 3.4 to 5.0 cm at the WLIS K Mound and 2.0 to 4.6 cm at the WLIS L Mound (Figure 3-21). The range of apparent RPD values measured on these mounds was quite similar to that found outside the disposal site. The lack of high sediment-oxygen demand (low organic loading), a healthy supply of oxygen in the overlying water, and active recolonization and bioturbational activities by the resident infauna have all contributed to the return of sediment redox depths to levels comparable to those found on the ambient seafloor (Figure 3-22).
Evidence of Stage III assemblages were found at all stations on both the WLIS K
and WLIS L Mounds (Figure 3-23); most stations showed evidence of secondary succession with dense assemblages of tubicolous polychaetes on the sediment surface coexisting with sub-surface, deposit-feeding fauna (Figure 3-24). Median OSI values were very high across both mounds (Figure 3-25); the overall median OSI value for the WLIS K Mound was +11 (Table 3-3), while the median value for the WLIS L Mound was +9 (Table 3-4). The high OSI values reflect the almost complete recovery of both areas from the disturbance of past dredged material disposal activities.
3.2.4 Comparison of WLDS Mounds to Reference Area Conditions
Three distinct reference areas were sampled during the 2004 WLDS SPI survey (S, SE, and SW). Five randomly located stations were sampled within each of the references areas, and at least three replicate images were analyzed at each station. The three or more replicate camera observations were averaged to get one observation per station at each reference area. The sampling at WLDS targeted three separate mound areas: WLIS J/H, WLIS K, and WLIS L. At each mound, stations were randomly located, and at least three replicate drops of the SPI camera were taken from each station. The number of stations located over each mound was based on the expected level of variability, with more stations taken where the variance was expected to be higher in order to have comparable estimates of the mean from all areas. Sample sizes were 20 at J/H, 10 at K, and 15 at L. A summary of the mean RPD and OSI values are presented in Table 3-5.
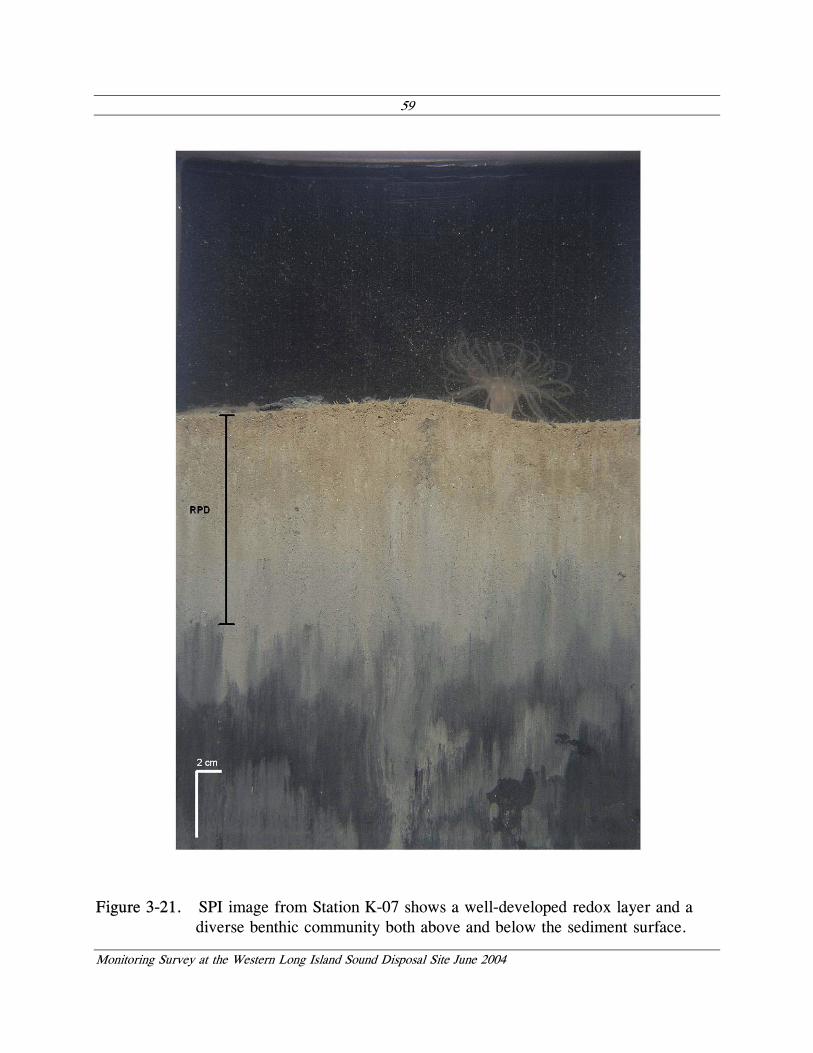
59
Monitoring Survey at the Western Long Island Sound Disposal Site June 2004
Figure 3-21. SPI image from Station K-07 shows a well-developed redox layer and a diverse benthic community both above and below the sediment surface.
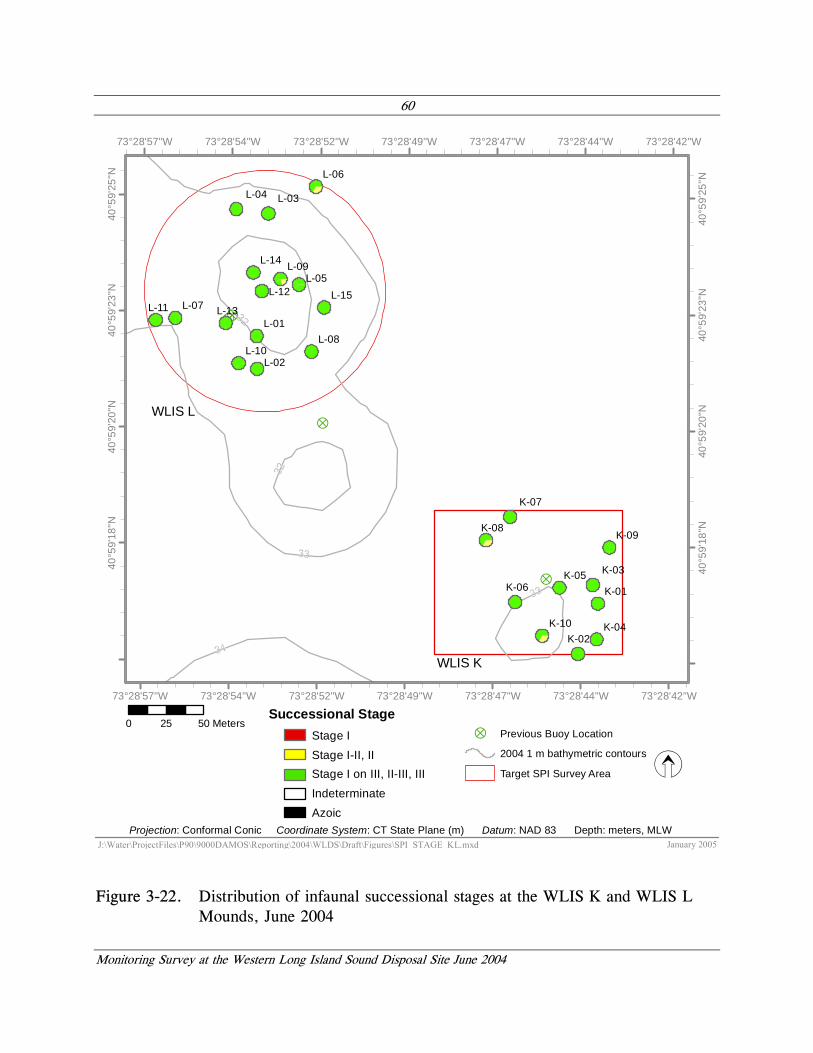
60
Monitoring Survey at the Western Long Island Sound Disposal Site June 2004
?
?
??
K-10
K-09K-08
K-07
K-06K-05
K-04
K-03
K-02
K-01
L-15
L-14
L-13
L-12L-11
L-10
L-09
L-08
L-07
L-06
L-05
L-04 L-03
L-02
L-01
73°28'57"W
73°28'57"W
73°28'54"W
73°28'54"W
73°28'52"W
73°28'52"W
73°28'49"W
73°28'49"W
73°28'47"W
73°28'47"W
73°28'44"W
73°28'44"W
73°28'42"W
73°28'42"W
40°5
9'18
"N
40°5
9'18
"N
40°5
9'20
"N
40°5
9'20
"N
40°5
9'23
"N
40°5
9'23
"N
40°5
9'25
"N
40°5
9'25
"N
WLIS K
J:\Water\ProjectFiles\P90\9000DAMOS\Reporting\2004\WLDS\Draft\Figures\SPI_STAGE_KL.mxdProjection: Conformal Conic Coordinate System: CT State Plane (m) Datum: NAD 83 Depth: meters, MLW
January 2005
Z
Successional StageStage IStage I-II, IIStage I on III, II-III, IIIIndeterminateAzoic
0 5025 Meters? Previous Buoy Location
2004 1 m bathymetric contours
Target SPI Survey Area
WLIS L
Figure 3-22. Distribution of infaunal successional stages at the WLIS K and WLIS L Mounds, June 2004
61
Monitoring Survey at the Western Long Island Sound Disposal Site June 2004
Figure 3-23. SPI images showing the most common successional sere found at both mounds, a Stage I on III assemblage.
This profile image from Station K-09 (left) shows a dense assemblage of tubicolous surface fauna as well as an errant polychaete at depth and an active burrow filled with oxidized fecal pellets from a sub-surface organism. This profile image from Station L-09 (right) shows a dense assemblage of Stage I polychaetes living on top of a relatively thick oxygenated surface layer (4.2 cm); evidence of an active burrow can be seen on the left side of the image leading down to an excavated cavity about halfway down in the sediment profile.
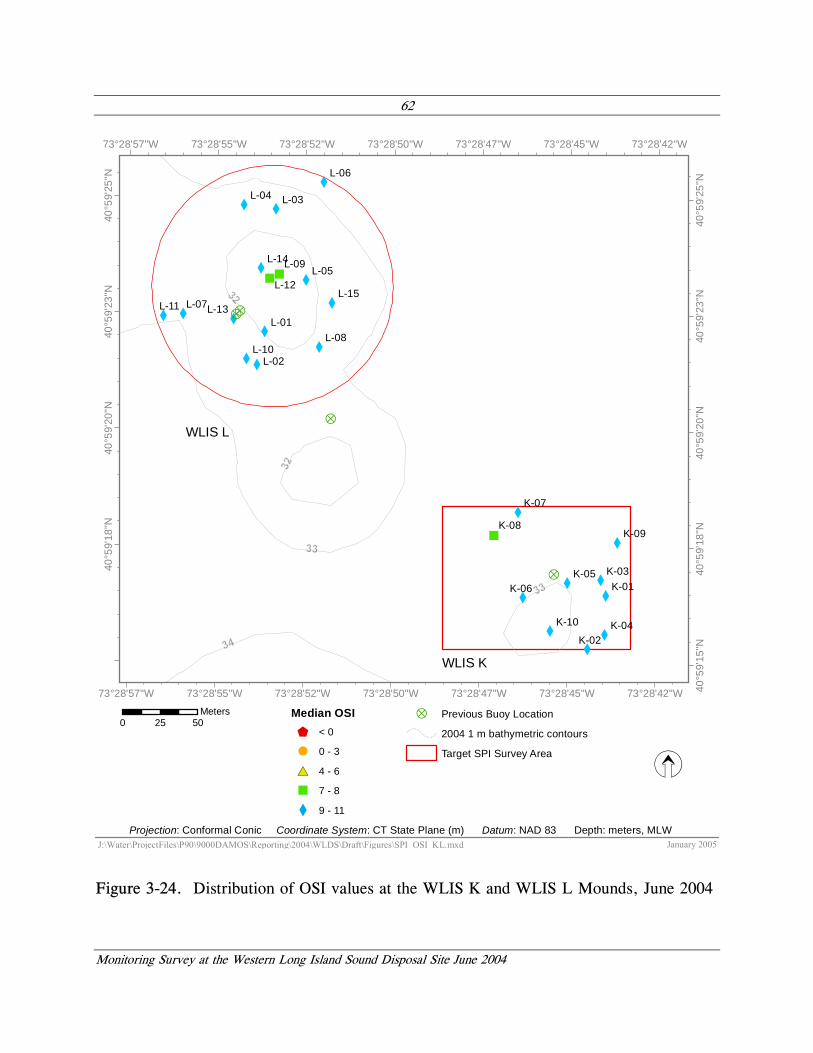
62
Monitoring Survey at the Western Long Island Sound Disposal Site June 2004
X
X
XX
X
X
X
X
"
X
X
"
X
X
X
?
?
??
X
X
X
X
XX
X
"X
X
L-15
L-14
L-13
L-12
L-11
L-10L-08
L-07
L-06
L-05
L-04 L-03
L-02
L-01
K-10
K-09K-08
K-07
K-06K-05
K-04
K-03
K-02
K-01
L-09
73°28'57"W
73°28'57"W
73°28'55"W
73°28'55"W
73°28'52"W
73°28'52"W
73°28'50"W
73°28'50"W
73°28'47"W
73°28'47"W
73°28'45"W
73°28'45"W
73°28'42"W
73°28'42"W
40°5
9'15
"N
40°5
9'18
"N
40°5
9'18
"N
40°5
9'20
"N
40°5
9'20
"N
40°5
9'23
"N
40°5
9'23
"N
40°5
9'25
"N
40°5
9'25
"N
WLIS L
? Previous Buoy Location
2004 1 m bathymetric contours
Target SPI Survey Area
J:\Water\ProjectFiles\P90\9000DAMOS\Reporting\2004\WLDS\Draft\Figures\SPI_OSI_KL.mxdProjection: Conformal Conic Coordinate System: CT State Plane (m) Datum: NAD 83 Depth: meters, MLW
January 2005
Z
0 5025Meters Median OSI
$ < 0
! 0 - 3
#* 4 - 6
" 7 - 8
X 9 - 11
WLIS K
Figure 3-24. Distribution of OSI values at the WLIS K and WLIS L Mounds, June 2004
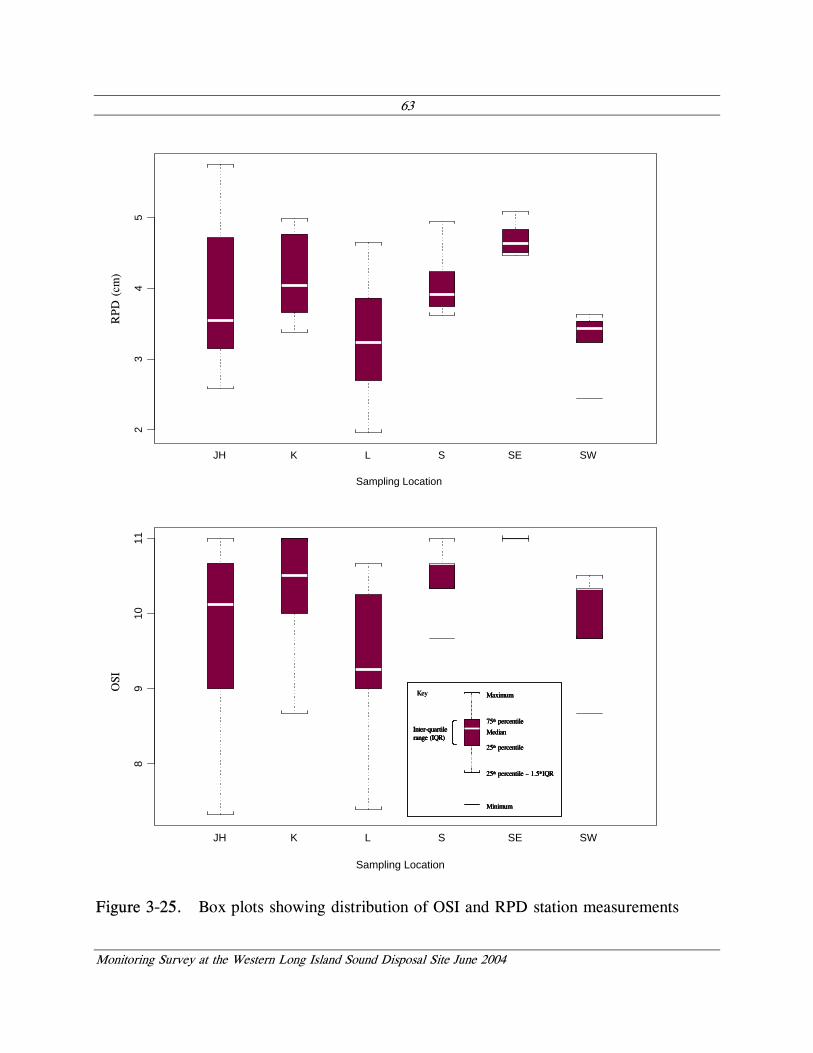
63
Monitoring Survey at the Western Long Island Sound Disposal Site June 2004
23
45
Mea
n R
PD
(cm
) by
Sta
tion
JH K L S SE SW
Sampling Location
89
1011
Mea
n O
SI b
y S
tatio
n
JH K L S SE SW
Sampling Location
Figure 3-25. Box plots showing distribution of OSI and RPD station measurements
Maximum
75th percentile
Median
25th percentile
25th percentile – 1.5*IQR
Minimum
Inter-quartile range (IQR)
Key Maximum
75th percentile
Median
25th percentile
25th percentile – 1.5*IQR
Minimum
Inter-quartile range (IQR)
Maximum
75th percentile
Median
25th percentile
25th percentile – 1.5*IQR
Minimum
Inter-quartile range (IQR)
Key
RPD
(cm
) O
SI
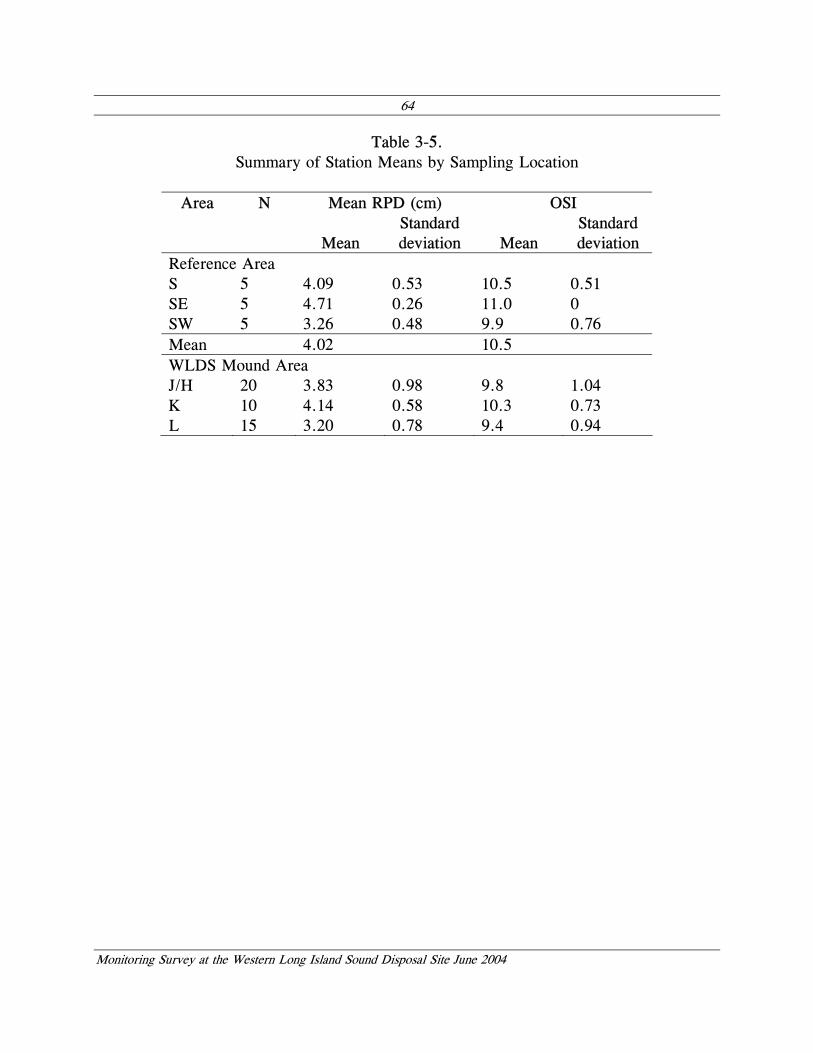
64
Monitoring Survey at the Western Long Island Sound Disposal Site June 2004
Table 3-5. Summary of Station Means by Sampling Location
Area N Mean RPD (cm) OSI
Mean Standard deviation Mean
Standard deviation
Reference Area S 5 4.09 0.53 10.5 0.51 SE 5 4.71 0.26 11.0 0 SW 5 3.26 0.48 9.9 0.76 Mean 4.02 10.5 WLDS Mound Area J/H 20 3.83 0.98 9.8 1.04 K 10 4.14 0.58 10.3 0.73 L 15 3.20 0.78 9.4 0.94
65
Monitoring Survey at the Western Long Island Sound Disposal Site June 2004
Mean RPD Variable
Results for the normality test indicate that normality was not rejected by the Shapiro-Wilk’s test (p=0.10), but the assumption of equality of variances was rejected by Levene’s test (p=0.03) (Figure 3-26). Consequently, separate group variances were used to compute the variance of each difference equation.
The specified δ value of 3 was outside of the 95% lower and upper confidence
bounds for all observed differences (Table 3-6). This indicates that the true difference between the mean RPD values from the reference areas and mean RPD values from each of the disposal mounds was within 3 RPD units, and therefore, the group means are equivalent within the working definition of ecologically meaningful.
Mean OSI Variable
The assumption of normality was rejected by the Shapiro-Wilk’s test (p=0.02). Evaluation of the normal probability plot (Figure 3-27) reveals that deviation from normality is not systematic, but is due to four influential data points at the lower end of the distribution (two from WLIS J/H Mound Complex, and one each from WLIS K and WLIS L Mounds). Without these four data points the data are not different from normal (Shapiro-Wilk's p= 0.08). Four data points at the upper end of the distribution also appear to deviate substantially, however, upon removal of those points, the data still deviate from a normal distribution. The assumption of equal variances was clearly violated (Figure 3-26) and was rejected by Levene’s test (p=0.01), so separate group variances were used to compute the variance of each difference equation.
The effect in a dataset of such influential data points as these four outliers is to
increase the variance, but if we have general symmetry in the data, then the basis for the t-distribution confidence interval is not completely invalidated, although the test of inequivalence will have a slightly lower Type I error (risk to the environment) than the stated α suggests (McBride 1999). A higher variance has the effect of increasing the width of the confidence interval, thereby making it more likely to contain δ (thus decreasing the probability that equivalence would be concluded, i.e., lowering the risk to the environment). If α is maintained at 0.05, then there will be increased certainty of any conclusions that might be made about equivalence.
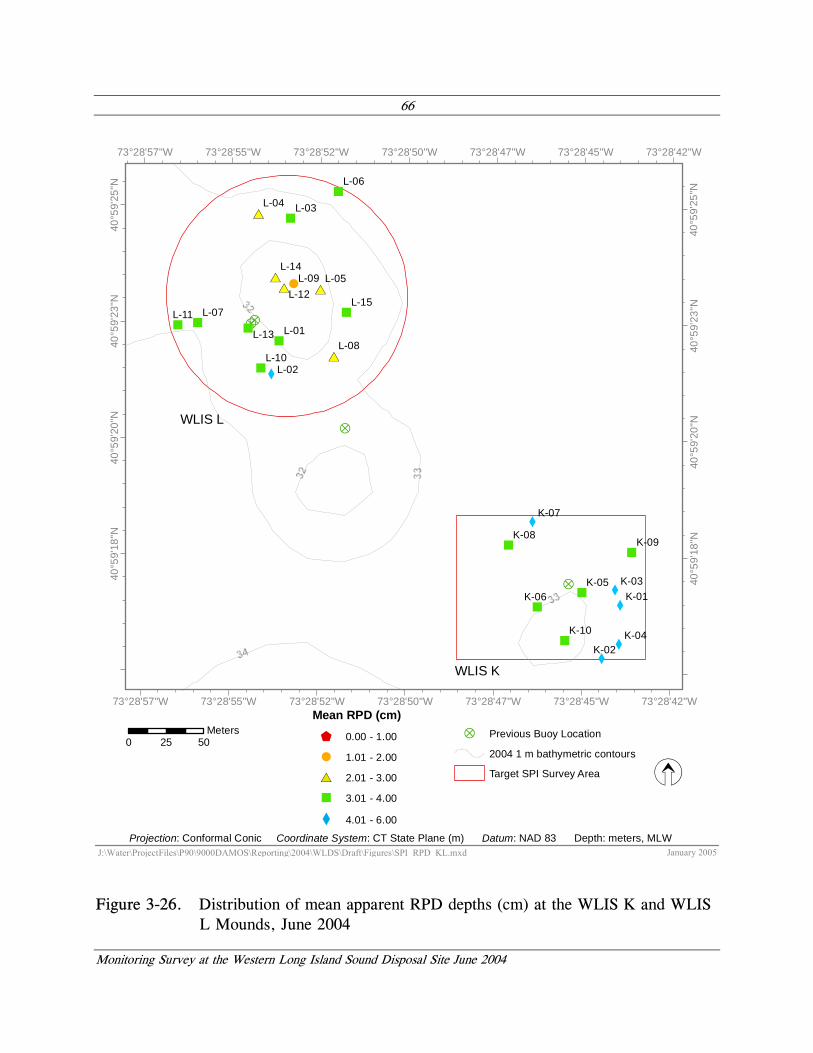
66
Monitoring Survey at the Western Long Island Sound Disposal Site June 2004
WLIS K
J:\Water\ProjectFiles\P90\9000DAMOS\Reporting\2004\WLDS\Draft\Figures\SPI_RPD_KL.mxdProjection: Conformal Conic Coordinate System: CT State Plane (m) Datum: NAD 83 Depth: meters, MLW
January 2005
Z
X
X
X
X
"
"
X
""
"
?
?
??
"
X
"#*
#*
"
"
#*
!
"
"
#*
"
#*
"
K-10
K-09K-08
K-07
K-06K-05
K-04
K-03
K-02
K-01
L-15
L-14
L-13
L-12
L-11
L-10
L-09
L-08
L-07
L-06
L-05
L-04 L-03
L-02
L-01
73°28'57"W
73°28'57"W
73°28'55"W
73°28'55"W
73°28'52"W
73°28'52"W
73°28'50"W
73°28'50"W
73°28'47"W
73°28'47"W
73°28'45"W
73°28'45"W
73°28'42"W
73°28'42"W
40°5
9'18
"N
40°5
9'18
"N
40°5
9'20
"N
40°5
9'20
"N
40°5
9'23
"N
40°5
9'23
"N
40°5
9'25
"N
40°5
9'25
"N
? Previous Buoy Location
2004 1 m bathymetric contours
Target SPI Survey Area
0 5025Meters
Mean RPD (cm)
$ 0.00 - 1.00
! 1.01 - 2.00
#* 2.01 - 3.00
" 3.01 - 4.00
X 4.01 - 6.00
WLIS L
Figure 3-26. Distribution of mean apparent RPD depths (cm) at the WLIS K and WLIS L Mounds, June 2004

67
Monitoring Survey at the Western Long Island Sound Disposal Site June 2004
Table 3-6.
Summary of Statistics and Results of Equivalence Testing for RPD Values
Difference Equation
Observed Difference
( d̂ ) SE ( d̂ )
Degrees of Freedom
for SE ( d̂ )
95% Lower Confidence
Bound
95% Upper Confidence
Bound 1. Ref – JH 0.19 0.246 24 -0.23 0.61 2. Ref – K -0.12 0.215 16 -0.50 0.25 3. Ref – L 0.82 0.231 20 0.42 1.22
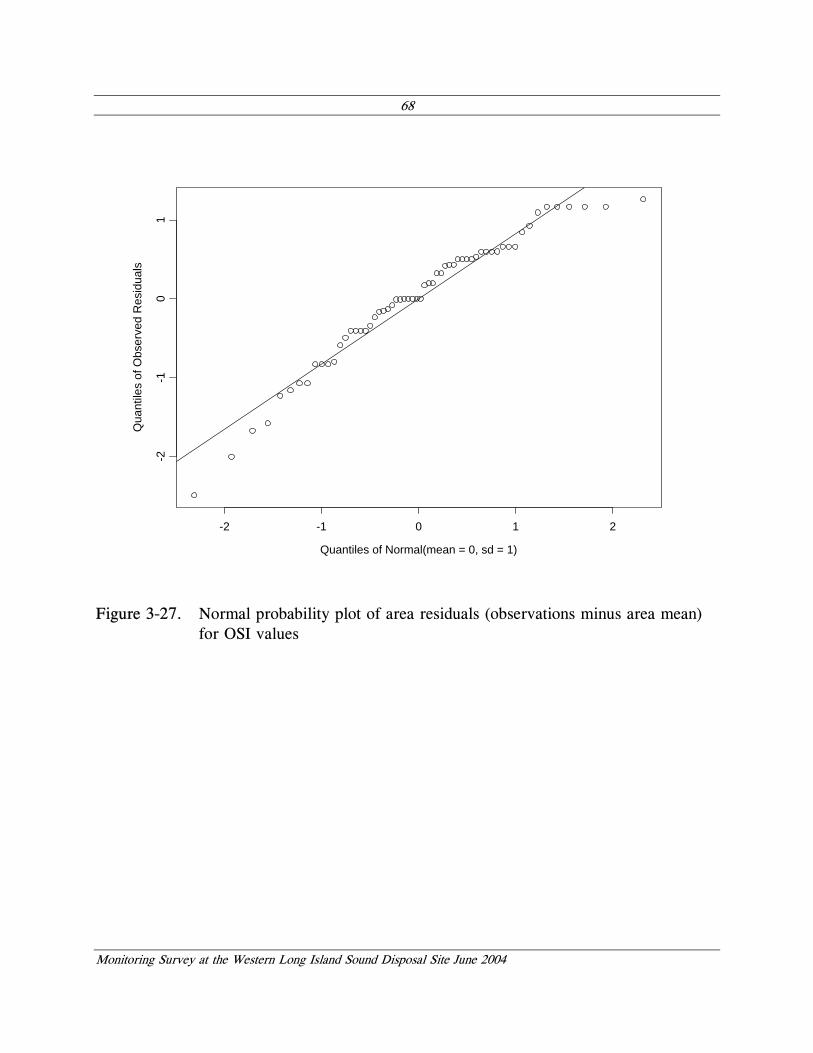
68
Monitoring Survey at the Western Long Island Sound Disposal Site June 2004
Quantiles of Normal(mean = 0, sd = 1)
Qua
ntile
s of
Obs
erve
d R
esid
uals
-2 -1 0 1 2
-2-1
01
Figure 3-27. Normal probability plot of area residuals (observations minus area mean) for OSI values
69
Monitoring Survey at the Western Long Island Sound Disposal Site June 2004
The specified δ value of 4 was outside of the 95% lower and upper confidence bounds for all observed differences (Table 3-7). This indicates that the true difference between the mean OSI values from the reference areas and mean OSI values from each of the disposal mounds was within 4 OSI units, and therefore the group means are equivalent within the working definition of ecologically meaningful.
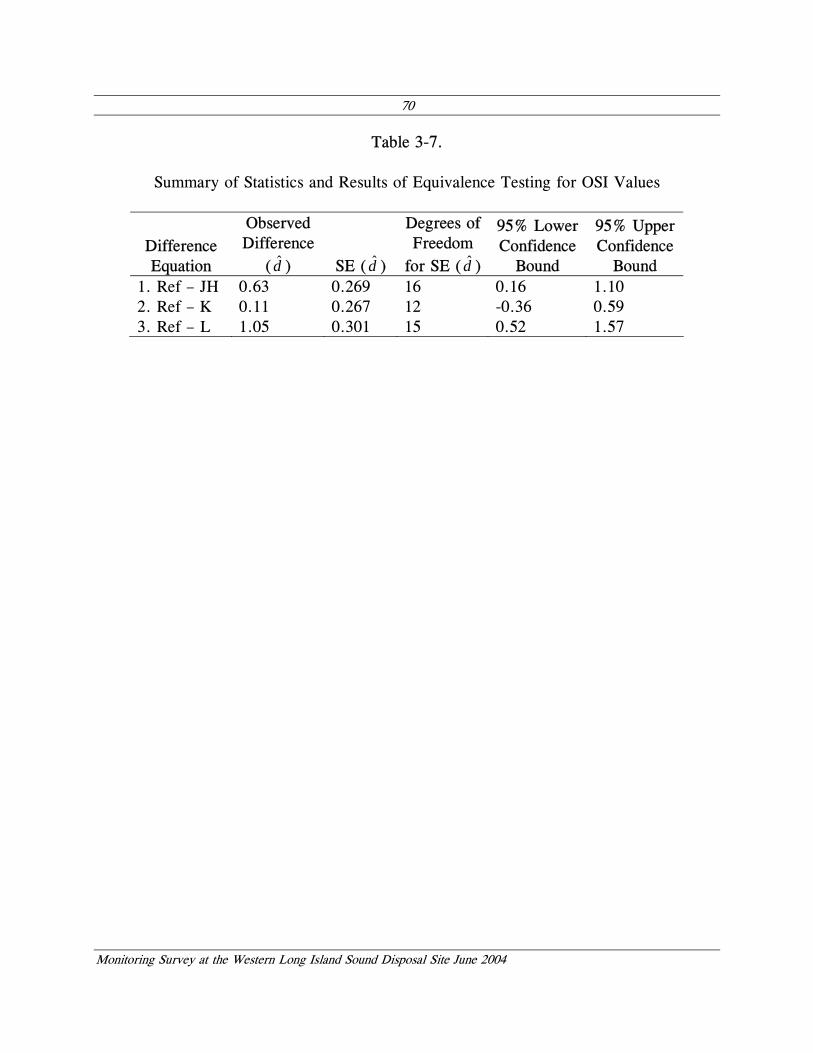
70
Monitoring Survey at the Western Long Island Sound Disposal Site June 2004
Table 3-7.
Summary of Statistics and Results of Equivalence Testing for OSI Values
Difference Equation
Observed Difference
( d̂ ) SE ( d̂ )
Degrees of Freedom
for SE ( d̂ )
95% Lower Confidence
Bound
95% Upper Confidence
Bound 1. Ref – JH 0.63 0.269 16 0.16 1.10 2. Ref – K 0.11 0.267 12 -0.36 0.59 3. Ref – L 1.05 0.301 15 0.52 1.57
71
Monitoring Survey at the Western Long Island Sound Disposal Site June 2004
4.0 DISCUSSION
The objectives of the June 2004 survey at WLDS included characterization of the seafloor topography of the disposal site, documentation of the distribution of dredged material around all recent and several historic disposal locations, and assessment of the benthic conditions over recently formed (WLIS J/H Mound Complex) and historic disposal mounds (WLIS K and WLIS L). These objectives were accomplished using bathymetric and SPI survey techniques.
4.1 Dredged Material Distribution
The June 2004 bathymetric survey at WLDS was intended to assess the seafloor topography of the disposal site and evaluate the distribution of dredged material at all recent and several historic disposal locations. Evidence of recent and historic dredged material was observed in all the SPI images collected from WLDS stations. Placement of 70,000 m3 of dredged material at the WDA buoy during the 2001-2002, 2002-2003, and 2003-2004 disposal seasons resulted in an increase in height and diameter of the WLIS J Mound, but not quite to the extent expected. The height increased 1.5 m and the diameter increased 150 m. It was evident that some of the material that was directed to the WLIS J Mound had spread and settled nearby, on the WLIS H Mound. The disposal resulted in a coalescence of the WLIS J Mound with the adjacent WLIS H Mound to form a single, oblong-shaped mound. The lower than expected increase in size of the WLIS J Mound may have been the result of consolidation as the majority of material placed at this location was disposed in the 2001-2002 season. The only other significant bathymetric change beyond the WLIS J Mound was a 0.5 m decrease in height of the WLIS L Mound. This scale of volume decrease is typical of self-weight consolidation of recently disposed dredged materials in Long Island Sound (SAIC 1995).
The management strategy at WLDS involves targeting the disposal of small to
moderate volumes of dredged material in the shape of a ring to form a containment cell. Continuing with this management strategy, for the 2004-2005 disposal season the WDA buoy has been deployed to further the development of the ring structure.
4.2 Biological Conditions and Benthic Recolonization
The primary objective of the June 2004 SPI survey was to assess the recolonization status of the newly-formed mound (WLIS J/H) as well as the status of benthic community recovery on two of the historical mounds (WLIS K and WLIS L). Since 1985, DAMOS surveys have documented complications with benthic community recovery on the disposal mounds within WLDS in association with seasonal hypoxia
72
Monitoring Survey at the Western Long Island Sound Disposal Site June 2004
(SAIC 1987, 1988, 1990a, 1990b, 2002; Germano et al. 1993; Eller and Williams 1996; Morris 1998; Murray and Saffert 1999). This area of the Sound has exhibited seasonal hypoxia since at least the early 1970’s (Parker and O’Reilly 1991), and quite likely before that, although details of monitoring prior to 1970 are sketchy and unreliable (Anderson and Taylor 2001). The lateral extent of hypoxia in western Long Island Sound varies interannually and is highly unpredictable; however, it is generally accepted that this annual phenomenon will continue to occur and usually extends over at least a 50 square mile area from near the Throgs Neck Bridge to approximately the Connecticut border (USEPA 1994). The processes responsible for causing hypoxia are assumed to be much like those of Chesapeake Bay and other estuaries (high nutrient input with stratified waters in the warm summer months), although there have been few direct studies to actually verify these assumptions (Anderson and Taylor 2001). The linkage between benthic community recovery over the disposal mounds and time/duration of the most recent hypoxic events are not straightforward (SAIC 2002); none-the-less, this seasonal phenomenon is expected to play an important role in benthic ecosystem recovery at the WLDS.
One way to minimize the interaction of this naturally confounding condition while
monitoring benthic community recovery at WLDS is to carry out the DAMOS monitoring surveys before dissolved oxygen concentrations drop below a critical threshold (<3 mg/l) where benthic organisms start experiencing physiological stress (Diaz and Rosenberg 1995; Ritter and Montagna 1999). Timing DAMOS monitoring surveys to avoid hypoxic conditions allows for better comparison of benthic recovery patterns with other disposal sites. Bottom waters in western Long Island Sound usually do not approach these critical dissolved oxygen thresholds until the August-September timeframe. By conducting the 2004 WLDS monitoring survey in late June, this critical period was avoided, and expected recovery of both the recent and historic mounds was not only met but exceeded. Stage III assemblages were found at all stations on all mounds monitored as well as at all the stations in the three reference areas. Mean apparent RPD depths at all stations were substantially greater than those measured in the past at WLDS (SAIC 2002), and there was no difference in biological community attributes as measured by sediment-profile imaging between the disposal site and the ambient seafloor.
Equivalence tests were performed to determine if the differences in the SPI
parameter measurements (RPD and OSI) between the disposal mounds and the references areas were ecologically meaningful. Ecologically meaningful differences were defined as 3 RPD units and 4 OSI units based on differences observed at the reference areas and from analysis of historic survey results of WLDS and CLDS. Comparisons were made between each of the disposal mounds (J/H, K and L) and the three references areas, which were assumed to collectively represent ambient seafloor conditions. The null
73
Monitoring Survey at the Western Long Island Sound Disposal Site June 2004
hypothesis for each comparison assumed the difference between the parameters measured at the WLDS mound and at the reference areas were greater than 3 RPD units or 4 OSI units. The null hypothesis was rejected for all comparisons indicating that the difference in OSI and RPD values between the WLDS mounds and the references areas were not ecologically meaningful.
One of the factors that likely contributed to the rapid recovery and apparent lack
of any measured impact to the benthic community was the relatively low volume of material disposed at the site since the previous monitoring event. Approximately 70,000 m³ of material was placed at the disposal buoy between the previous survey (conducted in June 2001) and the current June 2004 survey. Over 53,000 m3 of material was placed at the disposal buoy during the 2001-2002 season, followed by the placement of 16,000 m3 of material during the 2002-2003 season. Only 800 m3 of material was deposited at the disposal site during the 2003-2004 season. This disposal timeline represents a relatively minor pulse of recent disturbance over the area that would allow the benthic community sufficient time to recover prior to the 2004 survey (Rhoads et al. 1978).
Finding suitable reference areas for this disposal site has been a challenge because of the proximity of historical disposal grounds (see Figure 1-2 in SAIC 2002) and the lower rigor for navigational accuracy that was common at the time these historical disposal sites were in use. The presence of historic deposits of dredged material is quite common and widespread outside the current boundaries of the WLDS. Even though some evidence of dredged material was found in one of the fifteen replicate images collected within the SE REF area, abandoning this location as a reference site for future DAMOS monitoring surveys is not recommended; all measured parameters are comparable to those found in ambient sediments.
74
Monitoring Survey at the Western Long Island Sound Disposal Site June 2004
5.0 CONCLUSIONS
The June 2004 survey included bathymetry and SPI components. General survey objectives were to document the distribution of dredged material around recent and historic disposal locations and to assess the benthic recolonization status of a newly created disposal mound and three historic mounds.
The 2004 survey was designed to assess the following expectations:
• The placement of 70,000 m3 of dredged material at the WDA buoy between June 2001 and June 2004 will result in an increase in height and diameter of the WLIS J Mound. The mound is expected to be approximately 500 m in diameter and 2 m in height;
• Historic mounds will show limited change in elevation except for the most recently created mounds that should show some evidence of continued consolidation; and
• Historic WLIS K and WLIS L Mounds will support an advanced benthic community relative to the 2001 survey, dominated by Stage III organisms. The historic mound, WLIS H, has been subject to nearby disposal activity; as a result, the recolonization process may have slowed down, with fewer Stage III organisms expected. The directed placement of dredged material at the WLIS J Mound Complex has likely slowed the recolonization process, and the successional status is expected to be at Stage I or II.
Following the disposal of 70,000 m3 of dredged material during the 2001-2002, 2002-2003 and 2003-2004 disposal seasons, the WLIS J Mound had increased in size, but not quite to the extent expected. Disposal at the WLIS J Mound resulted in coalescence with the adjacent WLIS H Mound to form the WLIS J/H Mound Complex, an oblong feature approximately 175 m long and 100 meters wide, rising approximately 1.5 m above the seafloor. The lower than expected increase in size of the WLIS J Mound may have been the result of consolidation as the majority of material placed at this location was disposed in the 2001-2002 season. The only other significant bathymetric change beyond the WLIS J Mound was a 0.5 m decrease in height of the WLIS L Mound, also likely the result of consolidation, as expected.
The three WLDS mound areas and three WLDS reference areas examined during
the SPI survey all exhibited healthy benthic communities. An infaunal community comprised of both surface-dwelling opportunists (Stage I) and sub-surface deposit-feeders (Stage III) was observed consistently in both the reference and disposal mound areas. By
75
Monitoring Survey at the Western Long Island Sound Disposal Site June 2004
all measures, conditions over the surface of WLIS J/H, WLIS K, and WLIS L were comparable to those observed in the reference areas.
Given the results of the June 2004 survey, no specific follow up investigations are
warranted. Rather, periodic bathymetry and SPI surveys to assess the continued development of the containment cell and the normal pattern of benthic recolonization process are recommended. It is also recommended that SPI surveys continue to be performed in June for comparability.
76
Monitoring Survey at the Western Long Island Sound Disposal Site June 2004
6.0 REFERENCES
Anderson, T. H.; Taylor, G. T. 2001. Nutrient pulses, plankton blooms, and seasonal hypoxia in Western Long Island Sound. Estuaries 24: 228-243.
Carver, R. P. 1978. The case against statistical significance testing. Harvard Educational
Review 48: 378-399. Cole, R. G.; McBride, G. 2004. Assessing impacts of dredge spoil disposal using
equivalence tests: implications of a precautionary (proof of safety) approach. Marine Ecology Progress Series 279: 63-72.
Cole, R. G.; McBride, G.; Healy, T. R.. 2001. Equivalence tests and sedimentary data:
Dredge spoil disposal at Pine Harbour Marina, Auckland. Journal of Coastal Research Special Issue 34: 611-622.
Diaz, R.J.; Rosenberg, R. 1995. Marine benthic hypoxia: A review of its ecological
effects and the behavioural responses of benthic macrofauna. Oceanography and Marine Biology: an Annual Review 33:245-303.
Eller, F. C.; Williams, R. W. 1996. Monitoring cruise at the Western Long Island Sound
Disposal Site, July 1992. DAMOS Contribution No. 102 (SAIC Report No. C108). U.S. Army Corps of Engineers, New England Division, Waltham, MA.
ENSR. 2004. Monitoring Survey at the Rockland Disposal Site, September 2003.
DAMOS Contribution No. 156. U.S. Army Corps of Engineers, New England District, Concord, MA, p. 66.
Fairweather, P. G. 1991. Statistical power and design requirements for environmental
monitoring. Australian Journal of Marine and Freshwater Research 42: 555-567. Fredette, T. J. 1994. Disposal Site Capping Management: New Haven Harbor. In:
McNair, E.C. ed. Dredging ’94, Proceedings of the Second International Conference on Dredging and Dredged Material Placement (Vol. 2). , New York: American Society of Civil Engineers. pp.1142–1151
Fredette, T. J.; French, G. 2004. Understanding the physical and environmental
consequences of dredged material disposal: history in New England and current perspectives. Marine Pollution Bulletin 49: 93-102.
77
Monitoring Survey at the Western Long Island Sound Disposal Site June 2004
Germano, J. D. 1999. Ecology, statistics, and the art of misdiagnosis: The need for a
paradigm shift. Environmental Reviews 7: 167-190. Germano, J. D.; Rhoads, D. C.; Lunz, J. D. 1994. An integrated, tiered approach to
monitoring and management of dredged material disposal sites in New England region. DAMOS Contribution No. 87. U.S. Army Corps of Engineers, New England Division. Waltham, MA.
Germano, J. D.; Parker, J.; Williams, R. W. 1993. Monitoring cruise at the Western
Long Island Sound Disposal Site, July 1990. DAMOS Contribution No. 85. U.S. Army Corps of Engineers, New England Division, Waltham, MA.
Krebs, C. J. 1989. Ecological methodology. Harper & Row, New York. McBride, G. B. 1999. Equivalence tests can enhance environmental science and
management. Australian and New Zealand Journal of Statistics 41: 19-29. McBride, G. B., Lofits, J. C.; Adkins, N. C. 1993. What do significance tests really tell
us about the environment? Environmental Management 17: 423-432. Errata in 18: 317.
Morris, J. 1998. Monitoring Cruise at the Western Long Island Sound Disposal Site, July
1996. SAIC Report No. 383. Final report submitted to New England District, U.S. Army Corps of Engineers, Waltham, MA.
Murray, P. M.; Saffert, H. L. 1999. Monitoring cruises at the Western Long Island
Sound Disposal Site, September 1997 and March 1998. DAMOS Contribution No. 125. U.S. Army Corps of Engineers, New England District, Concord, MA.
Nelder, J. A. 1999. Statistics for the millennium: from statistics to statistical science. The
Statistician 48: 257-269. Parker, C. A.; O’Reilly, J. E. 1991. Oxygen depletion in Long Island Sound: A
historical perspective. Estuaries 14: 248-264. Revelas, E.C.; Germano, J.D.; Rhoads, D.C. 1987. REMOTS® Reconnaissance of
benthic environments. Coastal Zone ’87: Proceedings of the Conference, WW DIV/ASCE/May 26-29, Seattle, WA, pp. 2069–2083.
78
Monitoring Survey at the Western Long Island Sound Disposal Site June 2004
Rhoads, D. C.; Germano, J. D. 1982. Characterization of organisms-sediment relation using sediment-profile imaging: An effective method of Remote Ecological Monitoring of the Seafloor (REMOTS® System). Mar. Ecol. Prog. Ser. 8: 115-128.
Rhoads, D. C.; Germano, J. D. 1986. Interpreting long-term changes in benthic
community structure: a new protocol. Hydrobiologia 142: 291-308. Rhoads, D. C.; Germano, J. D. 1990. The use of REMOTS® imaging technology for
disposal site selection and monitoring. pp. 50-64. In: Geotechnical Engineering of Ocean Waste Disposal, K. Demars and R. Chaney (eds). ASTM Symposium Volume, January, 1989. Orlando, FL.
Rhoads, D. C.; McCall, P. L.; Yingst, J. Y. 1978. Disturbance and production on the
estuarine seafloor. American Scientist 66: 577-586. Ritter, C.; Montagna, P. A. 1999. Seasonal hypoxia and models of benthic response in a
Texas bay. Estuaries 22: 7-20. SAIC. 1987. Monitoring Surveys at the Western Long Island Sound Disposal Site August
and October 1985. DAMOS Contribution No. 55. U.S. Army Corps of Engineers, New England Division, Waltham, MA, 45 pp
SAIC. 1988. Seasonal Monitoring Cruise at the Western Long Island Sound Disposal
Site, August 1986. DAMOS Contribution No. 61. U.S. Army Corps of Engineers, New England Division, Waltham, MA, 20 pp.
SAIC. 1990a. Monitoring Cruise at the Western Long Island Sound Disposal Site,
November 1987. DAMOS Contribution No. 74. U.S. Army Corps of Engineers, New England Division, Waltham, MA, 90 pp.
SAIC. 1990b. Monitoring Cruise at the Western Long Island Sound Disposal Site, July
1988. DAMOS Contribution No. 76. U.S. Army Corps of Engineers, New England Division, Waltham, MA, 68 pp.
SAIC. 1995. Monitoring Cruise at the Central Long Island Sound Disposal Site, June
1990. DAMOS Contribution No. 94 (SAIC Report No. SAIC-90/7594&C89). US Army Corps of Engineers, New England Division, Concord, MA.
79
Monitoring Survey at the Western Long Island Sound Disposal Site June 2004
SAIC. 2002. Monitoring at the Western Long Island Sound Disposal Site, June 2001. DAMOS Contribution No. 138. U.S. Army Corps of Engineers, New England District, Concord, MA.
Tukey, J. W. 1991. The philosophy of multiple comparisons. Statistical Science 6: 100-
116. Underwood, A. J. 1990. Experiments in ecology and management: their logics, functions
and interpretations. Australian Journal of Ecology 15: 365-389. Underwood, A. J. 1997. Experiments in ecology: their logical design and interpretation
using analysis of variance. Cambridge University Press, Cambridge. USACE. 1982. Final environmental impact statement (FEIS) for the designation of a
disposal site for dredged material in Western Long Island Sound: WLIS III. U.S. Army Corps of Engineers, New England Division.
USEPA. 1994. Long Island Sound Study: Summary of the Comprehensive Conservation
and Management Plan July 1994. U.S. Environmental Protection Agency 842-94-001. Washington, D.C.
Wellek, S. 2002. Testing statistical hypotheses of equivalence. Chapman & Hall/CRC,
Boca Raton. Zar, J. H. 1996. Biostatistical Analysis, Third Edition. Prentice Hall, New Jersey.
662 pp. + Appendices
INDEX
Monitoring Survey at the Western Long Island Sound Disposal Site June 2004
azoic, 25 barge, 2, 5, 8, 18 bathymetry, i, 6, 8, 14, 15, 29, 74, 75 boundary roughness, 23, 34, 35, 37, 41,
52, 53, 54 carbon, 7, 12 confined aquatic disposal (CAD), 2 density, 23 disposal site, i, iv, vii, 1, 2, 3, 5, 14,
18, 26, 29, 34, 45, 58, 71, 72, 73, 76, 77, 78, 79 Western Long Island (WLDS), 2, 78
dissolved oxygen (DO), 25 feeding void, 44, 50 grain size, 6, 23, 35, 37, 41, 53, 54 habitat, v, 1, 24, 26, 57 hypoxia, vii, 7, 71, 72, 76, 78 hypoxic, 72 Long Island Sound, i, iv, vii, 1, 2, 3,
18, 26, 34, 71, 72, 76, 77, 78, 79 methane, 25, 35, 41, 53, 54 Mounds
WLIS J/H, i, iii, iv, v, vii, 15, 18, 21, 29, 31, 37, 41, 42, 45, 47, 49, 50, 51, 52, 58, 65, 71, 74, 75
WLIS K, i, iii, iv, v, vii, 5, 7, 13, 15, 18, 21, 29, 52, 53, 55, 58, 60, 62, 65, 66, 71, 74, 75
WLIS L, i, iii, iv, v, vii, 5, 7, 13, 15, 18, 19, 21, 29, 34, 52, 54, 56, 58, 60, 62, 65, 66, 71, 74, 75
Organism-Sediment Index (OSI), iii, 24, 25
reference area, i, iii, iv, vii, 2, 7, 18, 20, 26, 27, 34, 35, 37, 38, 40, 45, 58, 64, 65, 69, 72, 73, 74
RPD, iii, iv, v, vii, 7, 23, 24, 25, 26, 35, 37, 38, 39, 41, 45, 47, 48, 50, 53, 54, 58, 63, 64, 65, 66, 67, 72
sediment clay, v, 34, 42, 45, 52, 55, 57 cobble, 56 sand, iv, 34, 36, 37, 39, 42, 43, 52,
55, 56 silt, 34, 42, 52, 55
sediment-profile imaging, i, vii, 1, 7, 14, 15, 18, 22, 23, 34, 72, 78
side-scan sonar, 1, 7 successional stage, iv, v, 7, 23, 24, 25,
26, 35, 40, 41, 49, 53, 54, 60 temperature, 17 topography, vii, 8, 14, 17, 71
Monitoring Survey at the Western Long Island Sound Disposal Site June 2004
Appendix A
Disposal Barge Log Summary for WLDS
June 2001 to June 2004
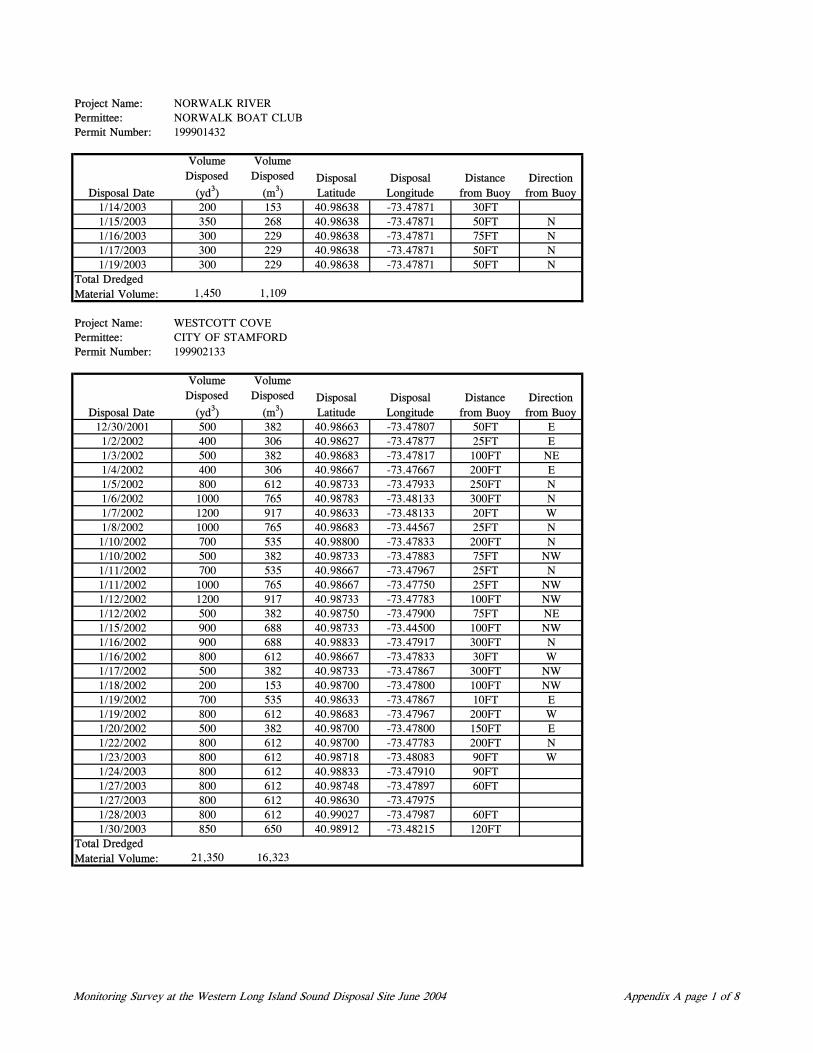
Project Name: NORWALK RIVERPermittee: NORWALK BOAT CLUBPermit Number: 199901432
Disposal Date
Volume Disposed
(yd3)
Volume Disposed
(m3)Disposal Latitude
Disposal Longitude
Distance from Buoy
Direction from Buoy
1/14/2003 200 153 40.98638 -73.47871 30FT1/15/2003 350 268 40.98638 -73.47871 50FT N1/16/2003 300 229 40.98638 -73.47871 75FT N1/17/2003 300 229 40.98638 -73.47871 50FT N1/19/2003 300 229 40.98638 -73.47871 50FT N
1,450 1,109
Project Name: WESTCOTT COVEPermittee: CITY OF STAMFORDPermit Number: 199902133
Disposal Date
Volume Disposed
(yd3)
Volume Disposed
(m3)Disposal Latitude
Disposal Longitude
Distance from Buoy
Direction from Buoy
12/30/2001 500 382 40.98663 -73.47807 50FT E1/2/2002 400 306 40.98627 -73.47877 25FT E1/3/2002 500 382 40.98683 -73.47817 100FT NE1/4/2002 400 306 40.98667 -73.47667 200FT E1/5/2002 800 612 40.98733 -73.47933 250FT N1/6/2002 1000 765 40.98783 -73.48133 300FT N1/7/2002 1200 917 40.98633 -73.48133 20FT W1/8/2002 1000 765 40.98683 -73.44567 25FT N1/10/2002 700 535 40.98800 -73.47833 200FT N1/10/2002 500 382 40.98733 -73.47883 75FT NW1/11/2002 700 535 40.98667 -73.47967 25FT N1/11/2002 1000 765 40.98667 -73.47750 25FT NW1/12/2002 1200 917 40.98733 -73.47783 100FT NW1/12/2002 500 382 40.98750 -73.47900 75FT NE1/15/2002 900 688 40.98733 -73.44500 100FT NW1/16/2002 900 688 40.98833 -73.47917 300FT N1/16/2002 800 612 40.98667 -73.47833 30FT W1/17/2002 500 382 40.98733 -73.47867 300FT NW1/18/2002 200 153 40.98700 -73.47800 100FT NW1/19/2002 700 535 40.98633 -73.47867 10FT E1/19/2002 800 612 40.98683 -73.47967 200FT W1/20/2002 500 382 40.98700 -73.47800 150FT E1/22/2002 800 612 40.98700 -73.47783 200FT N1/23/2003 800 612 40.98718 -73.48083 90FT W1/24/2003 800 612 40.98833 -73.47910 90FT1/27/2003 800 612 40.98748 -73.47897 60FT1/27/2003 800 612 40.98630 -73.479751/28/2003 800 612 40.99027 -73.47987 60FT1/30/2003 850 650 40.98912 -73.48215 120FT
21,350 16,323
Total Dredged Material Volume:
Total Dredged Material Volume:
Monitoring Survey at the Western Long Island Sound Disposal Site June 2004 Appendix A page 1 of 8
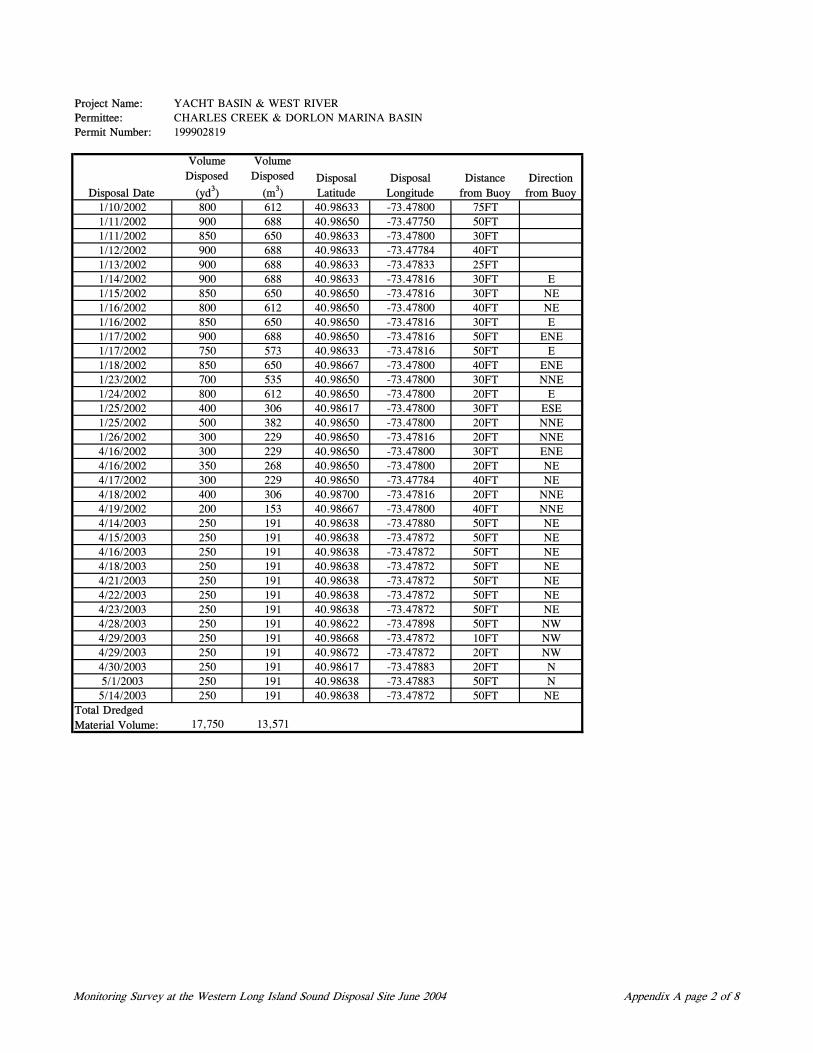
Project Name: YACHT BASIN & WEST RIVERPermittee: CHARLES CREEK & DORLON MARINA BASINPermit Number: 199902819
Disposal Date
Volume Disposed
(yd3)
Volume Disposed
(m3)Disposal Latitude
Disposal Longitude
Distance from Buoy
Direction from Buoy
1/10/2002 800 612 40.98633 -73.47800 75FT1/11/2002 900 688 40.98650 -73.47750 50FT1/11/2002 850 650 40.98633 -73.47800 30FT1/12/2002 900 688 40.98633 -73.47784 40FT1/13/2002 900 688 40.98633 -73.47833 25FT1/14/2002 900 688 40.98633 -73.47816 30FT E1/15/2002 850 650 40.98650 -73.47816 30FT NE1/16/2002 800 612 40.98650 -73.47800 40FT NE1/16/2002 850 650 40.98650 -73.47816 30FT E1/17/2002 900 688 40.98650 -73.47816 50FT ENE1/17/2002 750 573 40.98633 -73.47816 50FT E1/18/2002 850 650 40.98667 -73.47800 40FT ENE1/23/2002 700 535 40.98650 -73.47800 30FT NNE1/24/2002 800 612 40.98650 -73.47800 20FT E1/25/2002 400 306 40.98617 -73.47800 30FT ESE1/25/2002 500 382 40.98650 -73.47800 20FT NNE1/26/2002 300 229 40.98650 -73.47816 20FT NNE4/16/2002 300 229 40.98650 -73.47800 30FT ENE4/16/2002 350 268 40.98650 -73.47800 20FT NE4/17/2002 300 229 40.98650 -73.47784 40FT NE4/18/2002 400 306 40.98700 -73.47816 20FT NNE4/19/2002 200 153 40.98667 -73.47800 40FT NNE4/14/2003 250 191 40.98638 -73.47880 50FT NE4/15/2003 250 191 40.98638 -73.47872 50FT NE4/16/2003 250 191 40.98638 -73.47872 50FT NE4/18/2003 250 191 40.98638 -73.47872 50FT NE4/21/2003 250 191 40.98638 -73.47872 50FT NE4/22/2003 250 191 40.98638 -73.47872 50FT NE4/23/2003 250 191 40.98638 -73.47872 50FT NE4/28/2003 250 191 40.98622 -73.47898 50FT NW4/29/2003 250 191 40.98668 -73.47872 10FT NW4/29/2003 250 191 40.98672 -73.47872 20FT NW4/30/2003 250 191 40.98617 -73.47883 20FT N5/1/2003 250 191 40.98638 -73.47883 50FT N5/14/2003 250 191 40.98638 -73.47872 50FT NE
17,750 13,571Total Dredged Material Volume:
Monitoring Survey at the Western Long Island Sound Disposal Site June 2004 Appendix A page 2 of 8
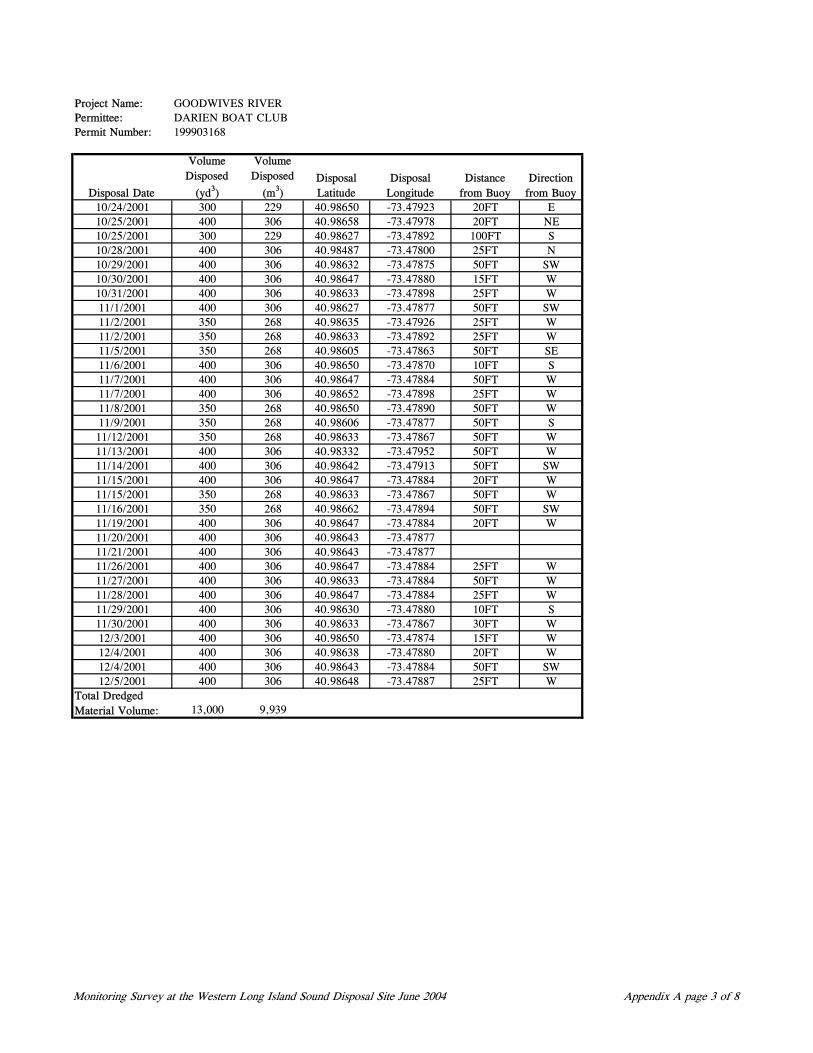
Project Name: GOODWIVES RIVERPermittee: DARIEN BOAT CLUBPermit Number: 199903168
Disposal Date
Volume Disposed
(yd3)
Volume Disposed
(m3)Disposal Latitude
Disposal Longitude
Distance from Buoy
Direction from Buoy
10/24/2001 300 229 40.98650 -73.47923 20FT E10/25/2001 400 306 40.98658 -73.47978 20FT NE10/25/2001 300 229 40.98627 -73.47892 100FT S10/28/2001 400 306 40.98487 -73.47800 25FT N10/29/2001 400 306 40.98632 -73.47875 50FT SW10/30/2001 400 306 40.98647 -73.47880 15FT W10/31/2001 400 306 40.98633 -73.47898 25FT W11/1/2001 400 306 40.98627 -73.47877 50FT SW11/2/2001 350 268 40.98635 -73.47926 25FT W11/2/2001 350 268 40.98633 -73.47892 25FT W11/5/2001 350 268 40.98605 -73.47863 50FT SE11/6/2001 400 306 40.98650 -73.47870 10FT S11/7/2001 400 306 40.98647 -73.47884 50FT W11/7/2001 400 306 40.98652 -73.47898 25FT W11/8/2001 350 268 40.98650 -73.47890 50FT W11/9/2001 350 268 40.98606 -73.47877 50FT S11/12/2001 350 268 40.98633 -73.47867 50FT W11/13/2001 400 306 40.98332 -73.47952 50FT W11/14/2001 400 306 40.98642 -73.47913 50FT SW11/15/2001 400 306 40.98647 -73.47884 20FT W11/15/2001 350 268 40.98633 -73.47867 50FT W11/16/2001 350 268 40.98662 -73.47894 50FT SW11/19/2001 400 306 40.98647 -73.47884 20FT W11/20/2001 400 306 40.98643 -73.4787711/21/2001 400 306 40.98643 -73.4787711/26/2001 400 306 40.98647 -73.47884 25FT W11/27/2001 400 306 40.98633 -73.47884 50FT W11/28/2001 400 306 40.98647 -73.47884 25FT W11/29/2001 400 306 40.98630 -73.47880 10FT S11/30/2001 400 306 40.98633 -73.47867 30FT W12/3/2001 400 306 40.98650 -73.47874 15FT W12/4/2001 400 306 40.98638 -73.47880 20FT W12/4/2001 400 306 40.98643 -73.47884 50FT SW12/5/2001 400 306 40.98648 -73.47887 25FT W
13,000 9,939Total Dredged Material Volume:
Monitoring Survey at the Western Long Island Sound Disposal Site June 2004 Appendix A page 3 of 8
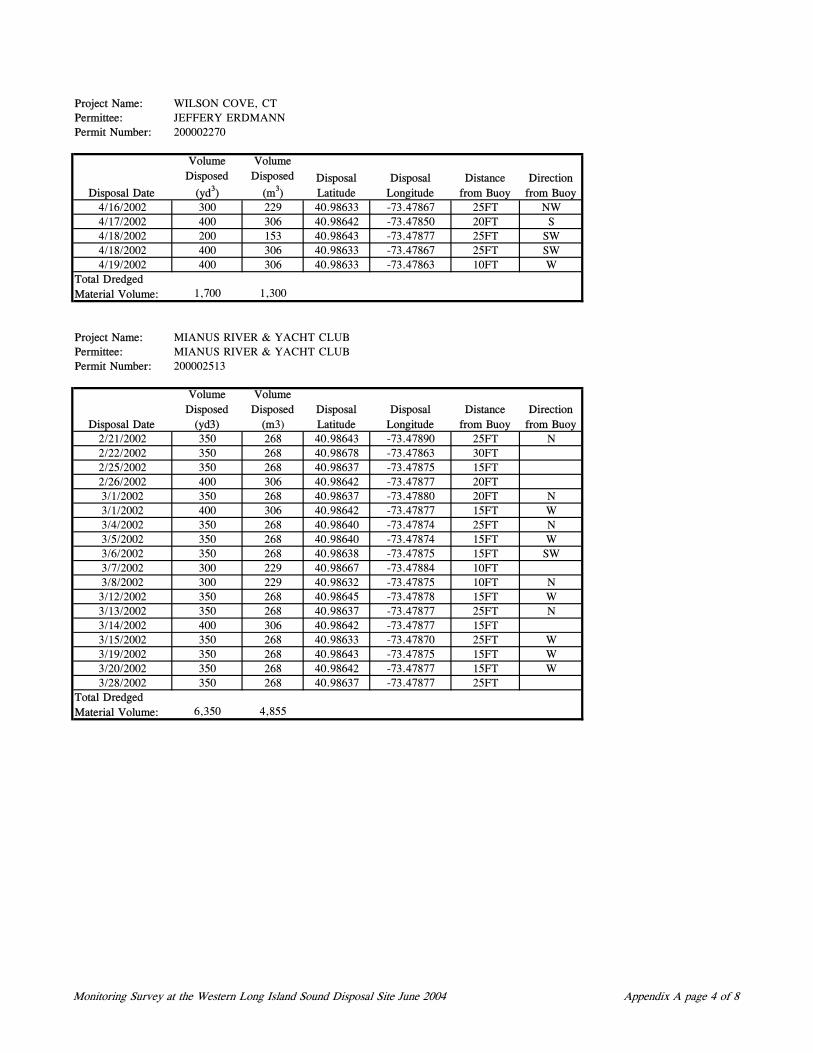
Project Name: WILSON COVE, CTPermittee: JEFFERY ERDMANNPermit Number: 200002270
Disposal Date
Volume Disposed
(yd3)
Volume Disposed
(m3)Disposal Latitude
Disposal Longitude
Distance from Buoy
Direction from Buoy
4/16/2002 300 229 40.98633 -73.47867 25FT NW4/17/2002 400 306 40.98642 -73.47850 20FT S4/18/2002 200 153 40.98643 -73.47877 25FT SW4/18/2002 400 306 40.98633 -73.47867 25FT SW4/19/2002 400 306 40.98633 -73.47863 10FT W
1,700 1,300
Project Name: MIANUS RIVER & YACHT CLUBPermittee: MIANUS RIVER & YACHT CLUBPermit Number: 200002513
Disposal Date
Volume Disposed
(yd3)
Volume Disposed
(m3)Disposal Latitude
Disposal Longitude
Distance from Buoy
Direction from Buoy
2/21/2002 350 268 40.98643 -73.47890 25FT N2/22/2002 350 268 40.98678 -73.47863 30FT2/25/2002 350 268 40.98637 -73.47875 15FT2/26/2002 400 306 40.98642 -73.47877 20FT3/1/2002 350 268 40.98637 -73.47880 20FT N3/1/2002 400 306 40.98642 -73.47877 15FT W3/4/2002 350 268 40.98640 -73.47874 25FT N3/5/2002 350 268 40.98640 -73.47874 15FT W3/6/2002 350 268 40.98638 -73.47875 15FT SW3/7/2002 300 229 40.98667 -73.47884 10FT3/8/2002 300 229 40.98632 -73.47875 10FT N3/12/2002 350 268 40.98645 -73.47878 15FT W3/13/2002 350 268 40.98637 -73.47877 25FT N3/14/2002 400 306 40.98642 -73.47877 15FT3/15/2002 350 268 40.98633 -73.47870 25FT W3/19/2002 350 268 40.98643 -73.47875 15FT W3/20/2002 350 268 40.98642 -73.47877 15FT W3/28/2002 350 268 40.98637 -73.47877 25FT
6,350 4,855
Total Dredged Material Volume:
Total Dredged Material Volume:
Monitoring Survey at the Western Long Island Sound Disposal Site June 2004 Appendix A page 4 of 8
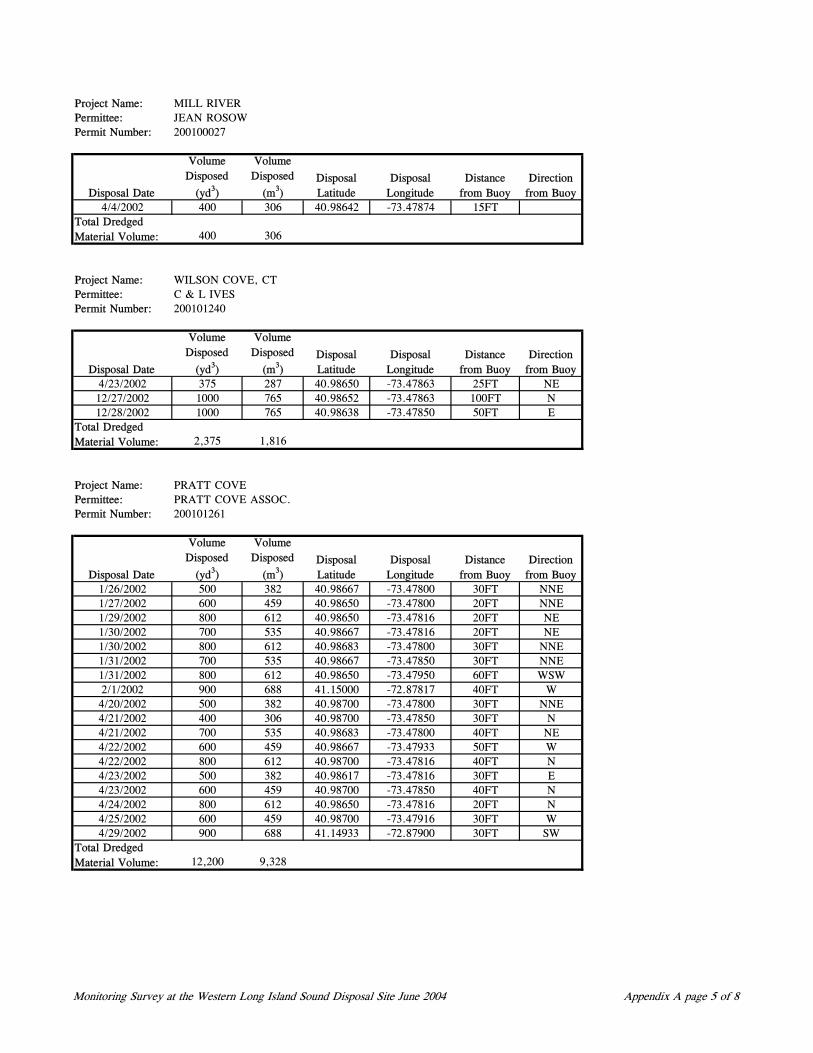
Project Name: MILL RIVERPermittee: JEAN ROSOWPermit Number: 200100027
Disposal Date
Volume Disposed
(yd3)
Volume Disposed
(m3)Disposal Latitude
Disposal Longitude
Distance from Buoy
Direction from Buoy
4/4/2002 400 306 40.98642 -73.47874 15FT
400 306
Project Name: WILSON COVE, CTPermittee: C & L IVESPermit Number: 200101240
Disposal Date
Volume Disposed
(yd3)
Volume Disposed
(m3)Disposal Latitude
Disposal Longitude
Distance from Buoy
Direction from Buoy
4/23/2002 375 287 40.98650 -73.47863 25FT NE12/27/2002 1000 765 40.98652 -73.47863 100FT N12/28/2002 1000 765 40.98638 -73.47850 50FT E
2,375 1,816
Project Name: PRATT COVEPermittee: PRATT COVE ASSOC.Permit Number: 200101261
Disposal Date
Volume Disposed
(yd3)
Volume Disposed
(m3)Disposal Latitude
Disposal Longitude
Distance from Buoy
Direction from Buoy
1/26/2002 500 382 40.98667 -73.47800 30FT NNE1/27/2002 600 459 40.98650 -73.47800 20FT NNE1/29/2002 800 612 40.98650 -73.47816 20FT NE1/30/2002 700 535 40.98667 -73.47816 20FT NE1/30/2002 800 612 40.98683 -73.47800 30FT NNE1/31/2002 700 535 40.98667 -73.47850 30FT NNE1/31/2002 800 612 40.98650 -73.47950 60FT WSW2/1/2002 900 688 41.15000 -72.87817 40FT W4/20/2002 500 382 40.98700 -73.47800 30FT NNE4/21/2002 400 306 40.98700 -73.47850 30FT N4/21/2002 700 535 40.98683 -73.47800 40FT NE4/22/2002 600 459 40.98667 -73.47933 50FT W4/22/2002 800 612 40.98700 -73.47816 40FT N4/23/2002 500 382 40.98617 -73.47816 30FT E4/23/2002 600 459 40.98700 -73.47850 40FT N4/24/2002 800 612 40.98650 -73.47816 20FT N4/25/2002 600 459 40.98700 -73.47916 30FT W4/29/2002 900 688 41.14933 -72.87900 30FT SW
12,200 9,328Total Dredged Material Volume:
Total Dredged Material Volume:
Total Dredged Material Volume:
Monitoring Survey at the Western Long Island Sound Disposal Site June 2004 Appendix A page 5 of 8
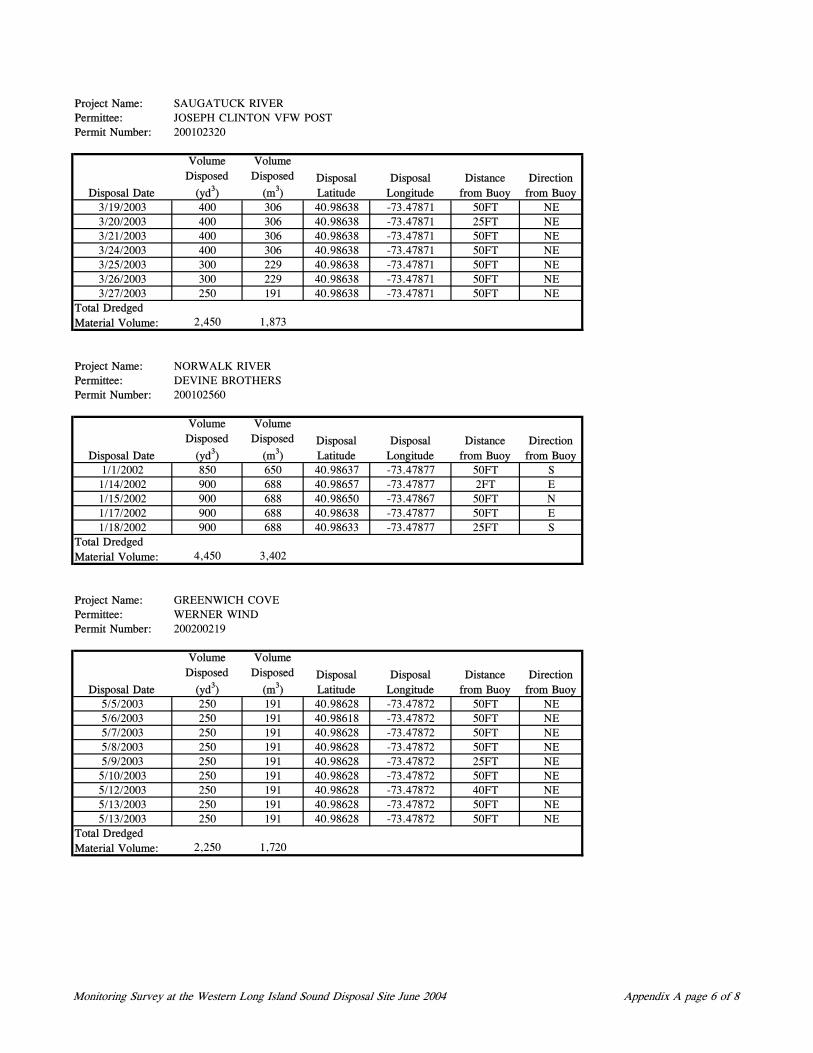
Project Name: SAUGATUCK RIVERPermittee: JOSEPH CLINTON VFW POSTPermit Number: 200102320
Disposal Date
Volume Disposed
(yd3)
Volume Disposed
(m3)Disposal Latitude
Disposal Longitude
Distance from Buoy
Direction from Buoy
3/19/2003 400 306 40.98638 -73.47871 50FT NE3/20/2003 400 306 40.98638 -73.47871 25FT NE3/21/2003 400 306 40.98638 -73.47871 50FT NE3/24/2003 400 306 40.98638 -73.47871 50FT NE3/25/2003 300 229 40.98638 -73.47871 50FT NE3/26/2003 300 229 40.98638 -73.47871 50FT NE3/27/2003 250 191 40.98638 -73.47871 50FT NE
2,450 1,873
Project Name: NORWALK RIVERPermittee: DEVINE BROTHERSPermit Number: 200102560
Disposal Date
Volume Disposed
(yd3)
Volume Disposed
(m3)Disposal Latitude
Disposal Longitude
Distance from Buoy
Direction from Buoy
1/1/2002 850 650 40.98637 -73.47877 50FT S1/14/2002 900 688 40.98657 -73.47877 2FT E1/15/2002 900 688 40.98650 -73.47867 50FT N1/17/2002 900 688 40.98638 -73.47877 50FT E1/18/2002 900 688 40.98633 -73.47877 25FT S
4,450 3,402
Project Name: GREENWICH COVEPermittee: WERNER WINDPermit Number: 200200219
Disposal Date
Volume Disposed
(yd3)
Volume Disposed
(m3)Disposal Latitude
Disposal Longitude
Distance from Buoy
Direction from Buoy
5/5/2003 250 191 40.98628 -73.47872 50FT NE5/6/2003 250 191 40.98618 -73.47872 50FT NE5/7/2003 250 191 40.98628 -73.47872 50FT NE5/8/2003 250 191 40.98628 -73.47872 50FT NE5/9/2003 250 191 40.98628 -73.47872 25FT NE5/10/2003 250 191 40.98628 -73.47872 50FT NE5/12/2003 250 191 40.98628 -73.47872 40FT NE5/13/2003 250 191 40.98628 -73.47872 50FT NE5/13/2003 250 191 40.98628 -73.47872 50FT NE
2,250 1,720
Total Dredged Material Volume:
Total Dredged Material Volume:
Total Dredged Material Volume:
Monitoring Survey at the Western Long Island Sound Disposal Site June 2004 Appendix A page 6 of 8
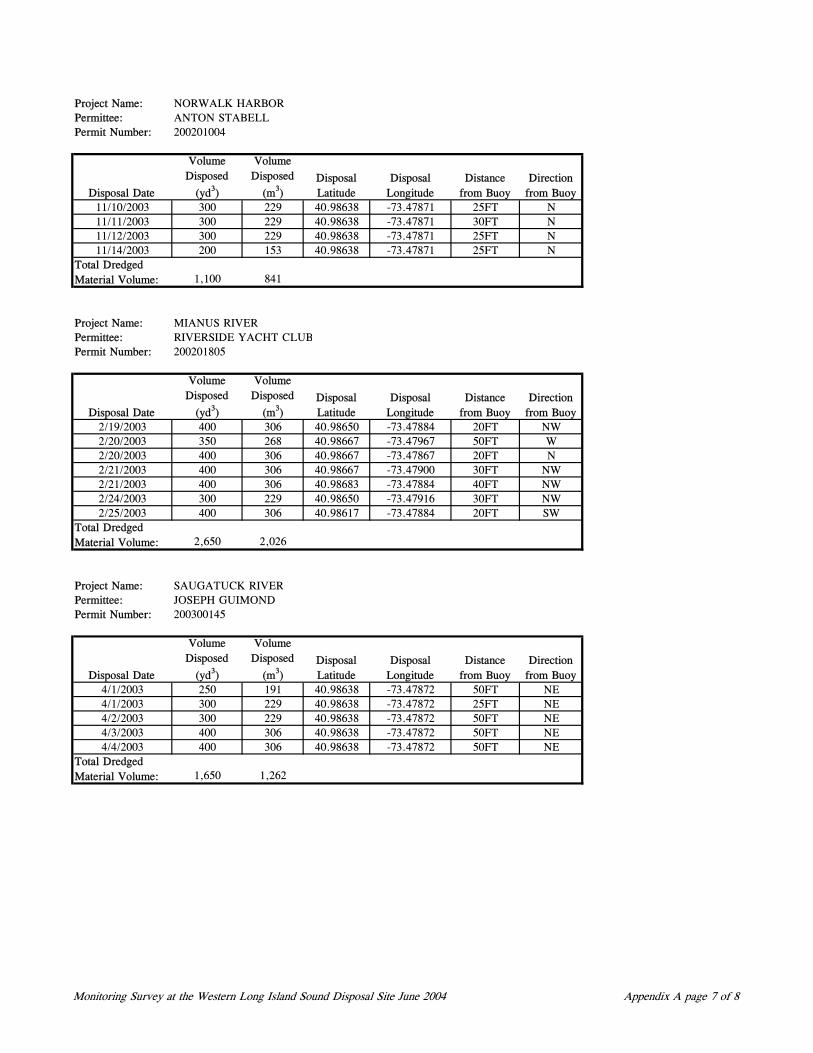
Project Name: NORWALK HARBORPermittee: ANTON STABELLPermit Number: 200201004
Disposal Date
Volume Disposed
(yd3)
Volume Disposed
(m3)Disposal Latitude
Disposal Longitude
Distance from Buoy
Direction from Buoy
11/10/2003 300 229 40.98638 -73.47871 25FT N11/11/2003 300 229 40.98638 -73.47871 30FT N11/12/2003 300 229 40.98638 -73.47871 25FT N11/14/2003 200 153 40.98638 -73.47871 25FT N
1,100 841
Project Name: MIANUS RIVERPermittee: RIVERSIDE YACHT CLUBPermit Number: 200201805
Disposal Date
Volume Disposed
(yd3)
Volume Disposed
(m3)Disposal Latitude
Disposal Longitude
Distance from Buoy
Direction from Buoy
2/19/2003 400 306 40.98650 -73.47884 20FT NW2/20/2003 350 268 40.98667 -73.47967 50FT W2/20/2003 400 306 40.98667 -73.47867 20FT N2/21/2003 400 306 40.98667 -73.47900 30FT NW2/21/2003 400 306 40.98683 -73.47884 40FT NW2/24/2003 300 229 40.98650 -73.47916 30FT NW2/25/2003 400 306 40.98617 -73.47884 20FT SW
2,650 2,026
Project Name: SAUGATUCK RIVERPermittee: JOSEPH GUIMONDPermit Number: 200300145
Disposal Date
Volume Disposed
(yd3)
Volume Disposed
(m3)Disposal Latitude
Disposal Longitude
Distance from Buoy
Direction from Buoy
4/1/2003 250 191 40.98638 -73.47872 50FT NE4/1/2003 300 229 40.98638 -73.47872 25FT NE4/2/2003 300 229 40.98638 -73.47872 50FT NE4/3/2003 400 306 40.98638 -73.47872 50FT NE4/4/2003 400 306 40.98638 -73.47872 50FT NE
1,650 1,262
Total Dredged Material Volume:
Total Dredged Material Volume:
Total Dredged Material Volume:
Monitoring Survey at the Western Long Island Sound Disposal Site June 2004 Appendix A page 7 of 8
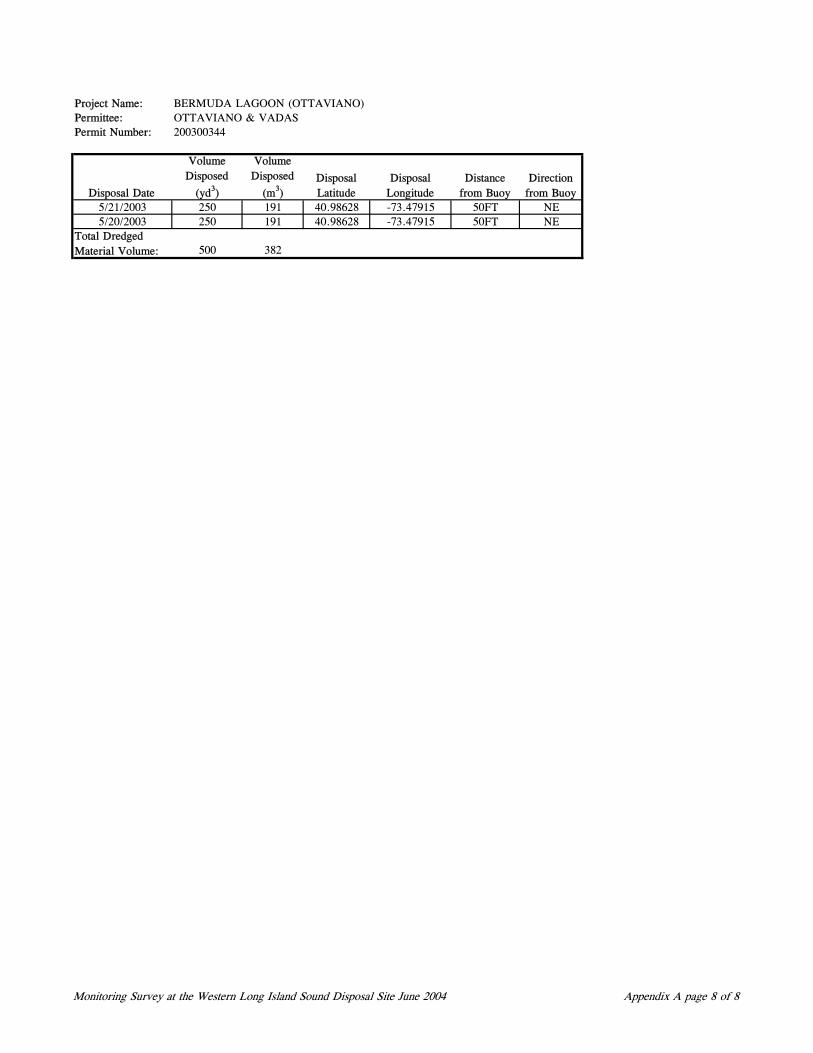
Project Name: BERMUDA LAGOON (OTTAVIANO)Permittee: OTTAVIANO & VADASPermit Number: 200300344
Disposal Date
Volume Disposed
(yd3)
Volume Disposed
(m3)Disposal Latitude
Disposal Longitude
Distance from Buoy
Direction from Buoy
5/21/2003 250 191 40.98628 -73.47915 50FT NE5/20/2003 250 191 40.98628 -73.47915 50FT NE
500 382Total Dredged Material Volume:
Monitoring Survey at the Western Long Island Sound Disposal Site June 2004 Appendix A page 8 of 8
Monitoring Survey at the Western Long Island Sound Disposal Site June 2004
Appendix B
Sediment-Profile Image Results for WLDS
June 2004 Survey
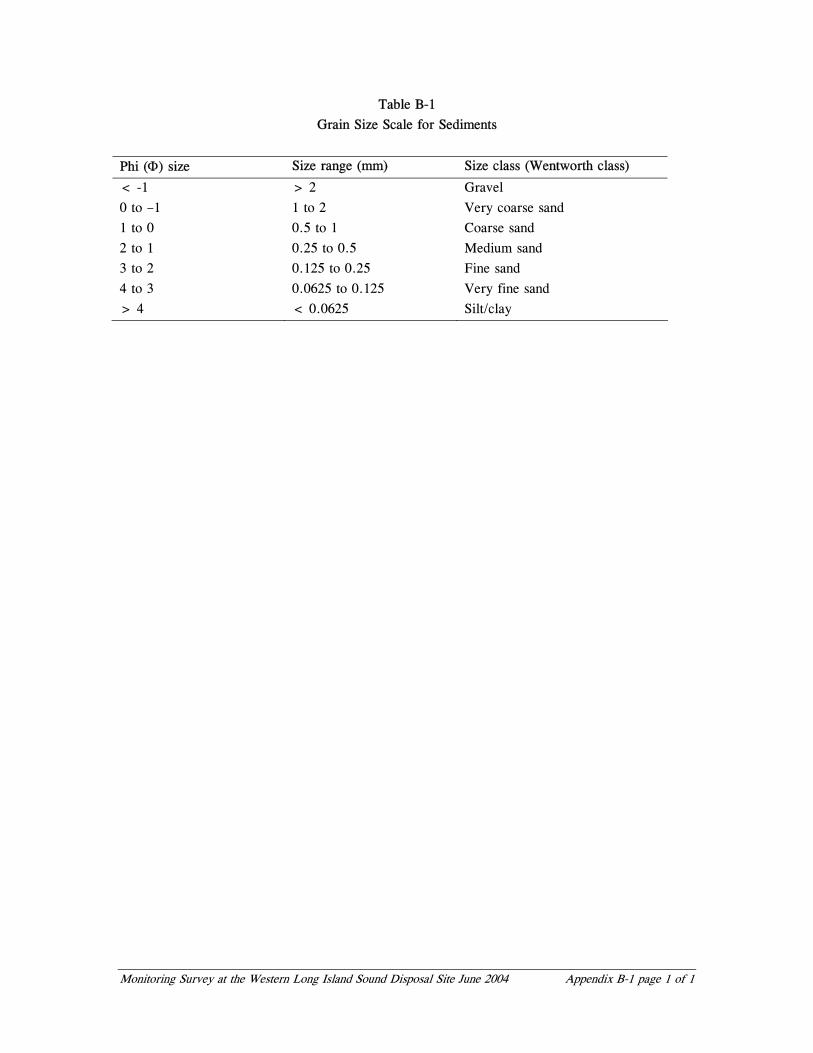
Monitoring Survey at the Western Long Island Sound Disposal Site June 2004 Appendix B-1 page 1 of 1
Table B-1
Grain Size Scale for Sediments
Phi (Φ) size Size range (mm) Size class (Wentworth class)
< -1 > 2 Gravel
0 to –1 1 to 2 Very coarse sand
1 to 0 0.5 to 1 Coarse sand
2 to 1 0.25 to 0.5 Medium sand
3 to 2 0.125 to 0.25 Fine sand
4 to 3 0.0625 to 0.125 Very fine sand
> 4 < 0.0625 Silt/clay
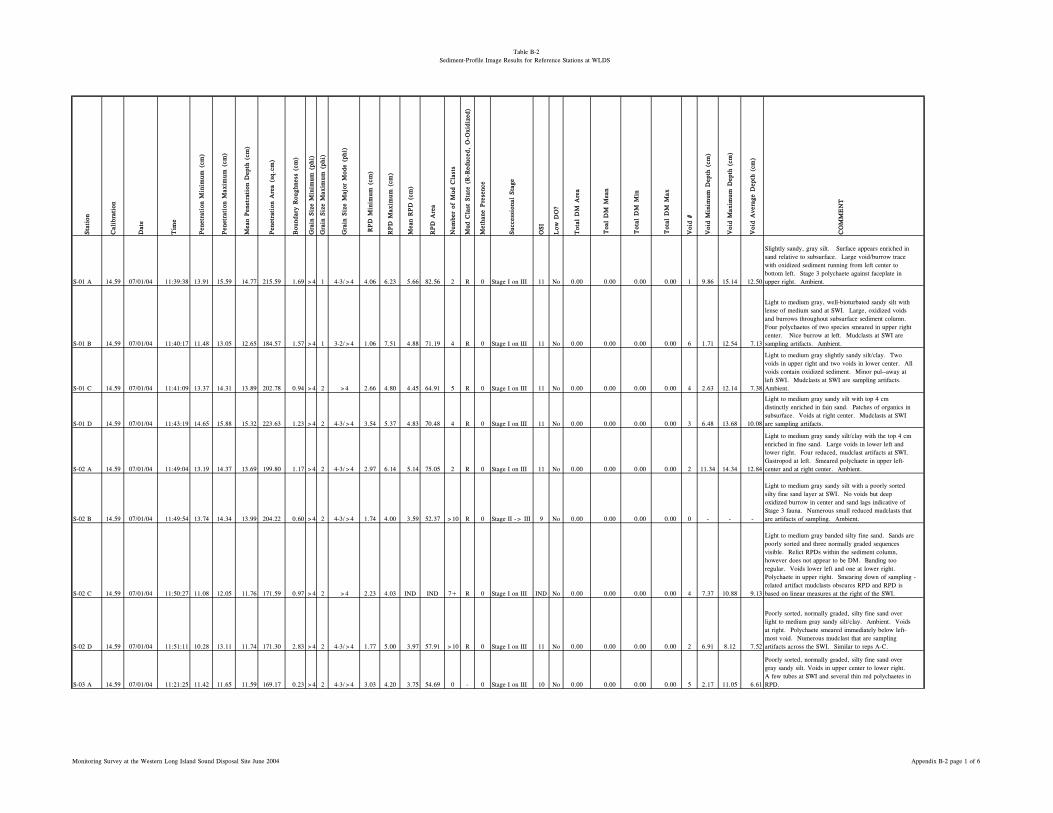
Table B-2Sediment-Profile Image Results for Reference Stations at WLDS
Sta
tion
Cal
ibra
tion
Dat
e
Tim
e
Pen
etra
tion
Min
imum
(cm
)
Pen
etra
tion
Max
imum
(cm
)
Mea
n Pen
etra
tion
Dep
th (
cm)
Pen
etra
tion
Are
a (s
q.cm
)
Bou
ndar
y R
ough
ness
(cm
)
Gra
in S
ize
Min
imum
(ph
i)
Gra
in S
ize
Max
imum
(ph
i)
Gra
in S
ize
Maj
or M
ode
(phi
)
RPD
Min
imum
(cm
)
RPD
Max
imum
(cm
)
Mea
n R
PD
(cm
)
RPD
Are
a
Num
ber
of M
ud C
last
s
Mud
Cla
st S
tate
(R
-Red
uced
, O
-Oxi
dize
d)
Met
hane
Pre
senc
e
Suc
cess
iona
l Sta
ge
OSI
Low
DO
?
Tot
al D
M A
rea
Voi
d #
Voi
d M
inim
um D
epth
(cm
)
Voi
d M
axim
um D
epth
(cm
)
Voi
d A
vera
ge D
epth
(cm
)
CO
MM
EN
T
S-01 A 14.59 07/01/04 11:39:38 13.91 15.59 14.77 215.59 1.69 >4 1 4-3/>4 4.06 6.23 5.66 82.56 2 R 0 Stage I on III 11 No 0.00 0.00 0.00 0.00 1 9.86 15.14 12.50
Slightly sandy, gray silt. Surface appears enriched in sand relative to subsurface. Large void/burrow trace with oxidized sediment running from left center to bottom left. Stage 3 polychaete against faceplate in upper right. Ambient.
S-01 B 14.59 07/01/04 11:40:17 11.48 13.05 12.65 184.57 1.57 >4 1 3-2/>4 1.06 7.51 4.88 71.19 4 R 0 Stage I on III 11 No 0.00 0.00 0.00 0.00 6 1.71 12.54 7.13
Light to medium gray, well-bioturbated sandy silt with lense of medium sand at SWI. Large, oxidized voids and burrows throughout subsurface sediment column. Four polychaetes of two species smeared in upper right center. Nice burrow at left. Mudclasts at SWI are sampling artifacts. Ambient.
S-01 C 14.59 07/01/04 11:41:09 13.37 14.31 13.89 202.78 0.94 >4 2 >4 2.66 4.80 4.45 64.91 5 R 0 Stage I on III 11 No 0.00 0.00 0.00 0.00 4 2.63 12.14 7.38
Light to medium gray slightly sandy silt/clay. Two voids in upper right and two voids in lower center. All voids contain oxidized sediment. Minor pul--away at left SWI. Mudclasts at SWI are sampling artifacts. Ambient.
S-01 D 14.59 07/01/04 11:43:19 14.65 15.88 15.32 223.63 1.23 >4 2 4-3/>4 3.54 5.37 4.83 70.48 4 R 0 Stage I on III 11 No 0.00 0.00 0.00 0.00 3 6.48 13.68 10.08
Light to medium gray sandy silt with top 4 cm distinctly enriched in fain sand. Patches of organics in subsurface. Voids at right center. Mudclasts at SWI are sampling artifacts.
S-02 A 14.59 07/01/04 11:49:04 13.19 14.37 13.69 199.80 1.17 >4 2 4-3/>4 2.97 6.14 5.14 75.05 2 R 0 Stage I on III 11 No 0.00 0.00 0.00 0.00 2 11.34 14.34 12.84
Light to medium gray sandy silt/clay with the top 4 cm enriched in fine sand. Large voids in lower left and lower right. Four reduced, mudclast artifacts at SWI. Gastropod at left. Smeared polychaete in upper left-center and at right center. Ambient.
S-02 B 14.59 07/01/04 11:49:54 13.74 14.34 13.99 204.22 0.60 >4 2 4-3/>4 1.74 4.00 3.59 52.37 >10 R 0 Stage II -> III 9 No 0.00 0.00 0.00 0.00 0 - - -
Light to medium gray sandy silt with a poorly sorted silty fine sand layer at SWI. No voids but deep oxidized burrow in center and sand lags indicative of Stage 3 fauna. Numerous small reduced mudclasts that are artifacts of sampling. Ambient.
S-02 C 14.59 07/01/04 11:50:27 11.08 12.05 11.76 171.59 0.97 >4 2 >4 2.23 4.03 IND IND 7+ R 0 Stage I on III IND No 0.00 0.00 0.00 0.00 4 7.37 10.88 9.13
Light to medium gray banded silty fine sand. Sands are poorly sorted and three normally graded sequences visible. Relict RPDs within the sediment column, however does not appear to be DM. Banding too regular. Voids lower left and one at lower right. Polychaete in upper right. Smearing down of sampling -related artifact mudclasts obscures RPD and RPD is based on linear measures at the right of the SWI.
S-02 D 14.59 07/01/04 11:51:11 10.28 13.11 11.74 171.30 2.83 >4 2 4-3/>4 1.77 5.00 3.97 57.91 >10 R 0 Stage I on III 11 No 0.00 0.00 0.00 0.00 2 6.91 8.12 7.52
Poorly sorted, normally graded, silty fine sand over light to medium gray sandy silt/clay. Ambient. Voids at right. Polychaete smeared immediately below left-most void. Numerous mudclast that are sampling artifacts across the SWI. Similar to reps A-C.
S-03 A 14.59 07/01/04 11:21:25 11.42 11.65 11.59 169.17 0.23 >4 2 4-3/>4 3.03 4.20 3.75 54.69 0 - 0 Stage I on III 10 No 0.00 0.00 0.00 0.00 5 2.17 11.05 6.61
Poorly sorted, normally graded, silty fine sand over gray sandy silt. Voids in upper center to lower right. A few tubes at SWI and several thin red polychaetes in RPD.
Tot
al D
M M
in
Tot
al D
M M
ax
Toa
l D
M M
ean
Monitoring Survey at the Western Long Island Sound Disposal Site June 2004 Appendix B-2 page 1 of 6
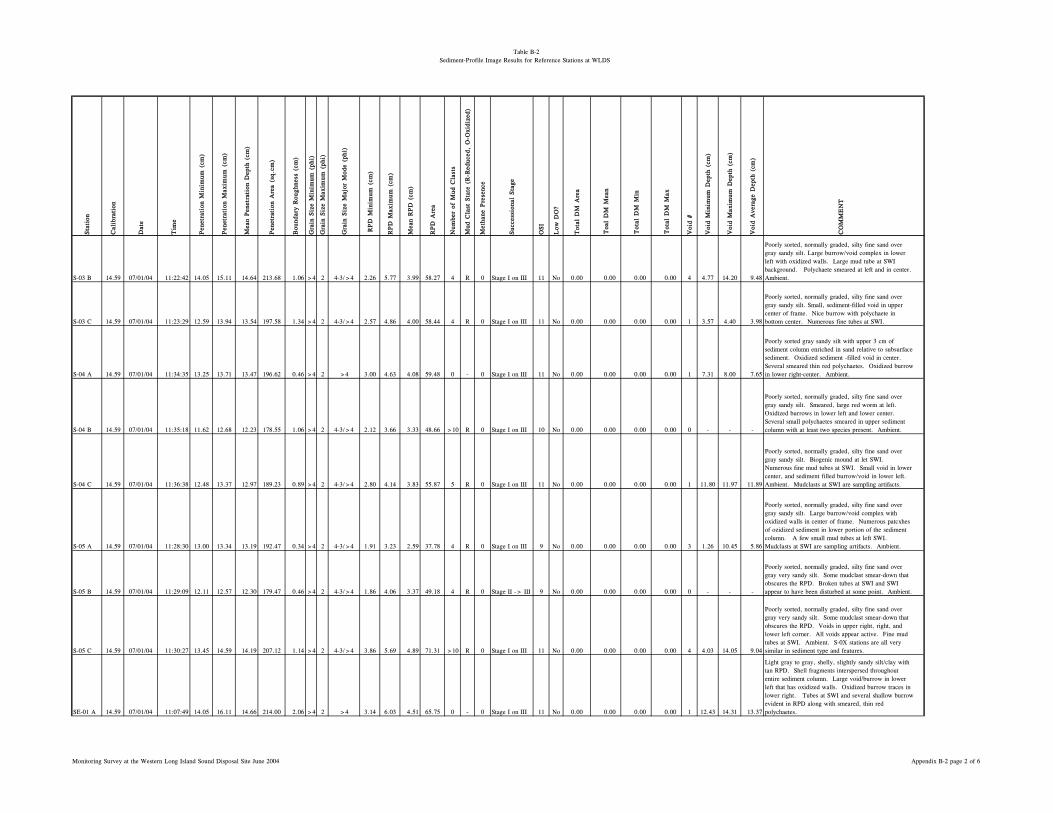
Table B-2Sediment-Profile Image Results for Reference Stations at WLDS
Sta
tion
Cal
ibra
tion
Dat
e
Tim
e
Pen
etra
tion
Min
imum
(cm
)
Pen
etra
tion
Max
imum
(cm
)
Mea
n Pen
etra
tion
Dep
th (
cm)
Pen
etra
tion
Are
a (s
q.cm
)
Bou
ndar
y R
ough
ness
(cm
)
Gra
in S
ize
Min
imum
(ph
i)
Gra
in S
ize
Max
imum
(ph
i)
Gra
in S
ize
Maj
or M
ode
(phi
)
RPD
Min
imum
(cm
)
RPD
Max
imum
(cm
)
Mea
n R
PD
(cm
)
RPD
Are
a
Num
ber
of M
ud C
last
s
Mud
Cla
st S
tate
(R
-Red
uced
, O
-Oxi
dize
d)
Met
hane
Pre
senc
e
Suc
cess
iona
l Sta
ge
OSI
Low
DO
?
Tot
al D
M A
rea
Voi
d #
Voi
d M
inim
um D
epth
(cm
)
Voi
d M
axim
um D
epth
(cm
)
Voi
d A
vera
ge D
epth
(cm
)
CO
MM
EN
T
Tot
al D
M M
in
Tot
al D
M M
ax
Toa
l D
M M
ean
S-03 B 14.59 07/01/04 11:22:42 14.05 15.11 14.64 213.68 1.06 >4 2 4-3/>4 2.26 5.77 3.99 58.27 4 R 0 Stage I on III 11 No 0.00 0.00 0.00 0.00 4 4.77 14.20 9.48
Poorly sorted, normally graded, silty fine sand over gray sandy silt. Large burrow/void complex in lower left with oxidized walls. Large mud tube at SWI background. Polychaete smeared at left and in center. Ambient.
S-03 C 14.59 07/01/04 11:23:29 12.59 13.94 13.54 197.58 1.34 >4 2 4-3/>4 2.57 4.86 4.00 58.44 4 R 0 Stage I on III 11 No 0.00 0.00 0.00 0.00 1 3.57 4.40 3.98
Poorly sorted, normally graded, silty fine sand over gray sandy silt. Small, sediment-filled void in upper center of frame. Nice burrow with polychaete in bottom center. Numerous fine tubes at SWI.
S-04 A 14.59 07/01/04 11:34:35 13.25 13.71 13.47 196.62 0.46 >4 2 >4 3.00 4.63 4.08 59.48 0 - 0 Stage I on III 11 No 0.00 0.00 0.00 0.00 1 7.31 8.00 7.65
Poorly sorted gray sandy silt with upper 3 cm of sediment column enriched in sand relative to subsurface sediment. Oxidized sediment -filled void in center. Several smeared thin red polychaetes. Oxidized burrow in lower right-center. Ambient.
S-04 B 14.59 07/01/04 11:35:18 11.62 12.68 12.23 178.55 1.06 >4 2 4-3/>4 2.12 3.66 3.33 48.66 >10 R 0 Stage I on III 10 No 0.00 0.00 0.00 0.00 0 - - -
Poorly sorted, normally graded, silty fine sand over gray sandy silt. Smeared, large red worm at left. Oxidized burrows in lower left and lower center. Several small polychaetes smeared in upper sediment column with at least two species present. Ambient.
S-04 C 14.59 07/01/04 11:36:38 12.48 13.37 12.97 189.23 0.89 >4 2 4-3/>4 2.80 4.14 3.83 55.87 5 R 0 Stage I on III 11 No 0.00 0.00 0.00 0.00 1 11.80 11.97 11.89
Poorly sorted, normally graded, silty fine sand over gray sandy silt. Biogenic mound at let SWI. Numerous fine mud tubes at SWI. Small void in lower center, and sediment filled burrow/void in lower left. Ambient. Mudclasts at SWI are sampling artifacts.
S-05 A 14.59 07/01/04 11:28:30 13.00 13.34 13.19 192.47 0.34 >4 2 4-3/>4 1.91 3.23 2.59 37.78 4 R 0 Stage I on III 9 No 0.00 0.00 0.00 0.00 3 1.26 10.45 5.86
Poorly sorted, normally graded, silty fine sand over gray sandy silt. Large burrow/void complex with oxidized walls in center of frame. Numerous patcxhes of ozidized sediment in lower portion of the sediment column. A few small mud tubes at left SWI. Mudclasts at SWI are sampling artifacts. Ambient.
S-05 B 14.59 07/01/04 11:29:09 12.11 12.57 12.30 179.47 0.46 >4 2 4-3/>4 1.86 4.06 3.37 49.18 4 R 0 Stage II -> III 9 No 0.00 0.00 0.00 0.00 0 - - -
Poorly sorted, normally graded, silty fine sand over gray very sandy silt. Some mudclast smear-down that obscures the RPD. Broken tubes at SWI and SWI appear to have been disturbed at some point. Ambient.
S-05 C 14.59 07/01/04 11:30:27 13.45 14.59 14.19 207.12 1.14 >4 2 4-3/>4 3.86 5.69 4.89 71.31 >10 R 0 Stage I on III 11 No 0.00 0.00 0.00 0.00 4 4.03 14.05 9.04
Poorly sorted, normally graded, silty fine sand over gray very sandy silt. Some mudclast smear-down that obscures the RPD. Voids in upper right, right, and lower left corner. All voids appear active. Fine mud tubes at SWI. Ambient. S-0X stations are all very similar in sediment type and features.
SE-01 A 14.59 07/01/04 11:07:49 14.05 16.11 14.66 214.00 2.06 >4 2 >4 3.14 6.03 4.51 65.75 0 - 0 Stage I on III 11 No 0.00 0.00 0.00 0.00 1 12.43 14.31 13.37
Light gray to gray, shelly, slightly sandy silt/clay with tan RPD. Shell fragments interspersed throughout entire sediment column. Large void/burrow in lower left that has oxidized walls. Oxidized burrow traces in lower right. Tubes at SWI and several shallow burrow evident in RPD along with smeared, thin red polychaetes.
Monitoring Survey at the Western Long Island Sound Disposal Site June 2004 Appendix B-2 page 2 of 6
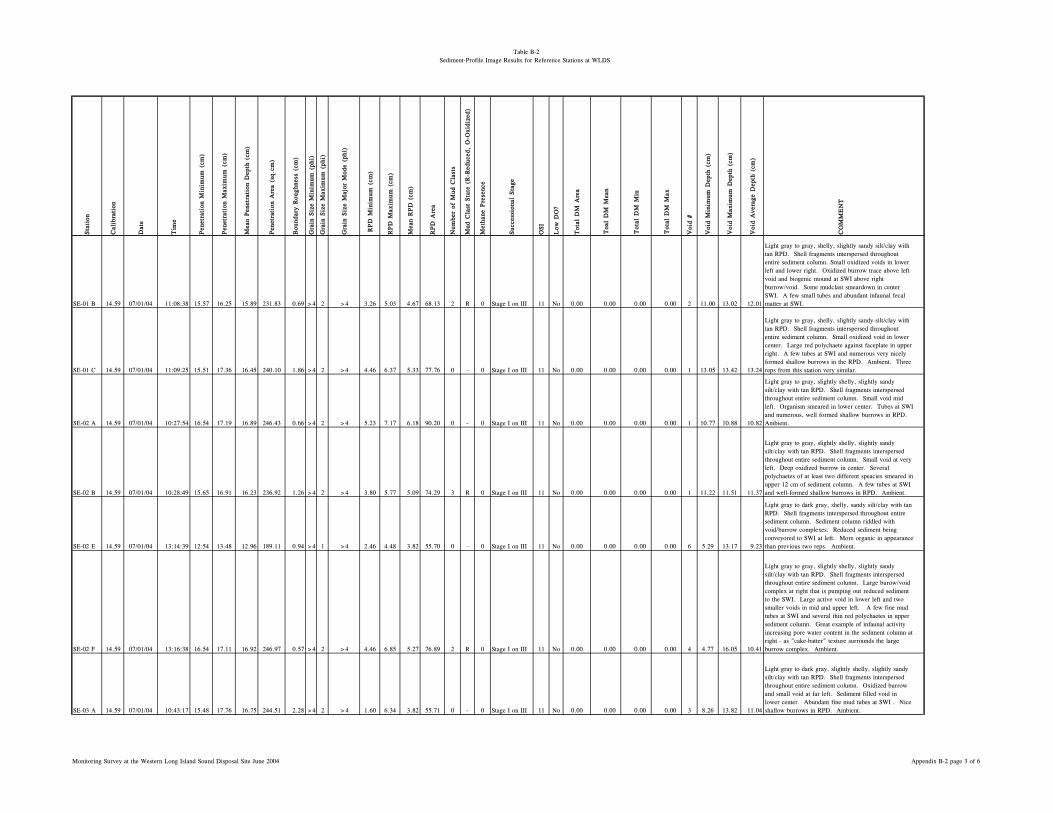
Table B-2Sediment-Profile Image Results for Reference Stations at WLDS
Sta
tion
Cal
ibra
tion
Dat
e
Tim
e
Pen
etra
tion
Min
imum
(cm
)
Pen
etra
tion
Max
imum
(cm
)
Mea
n Pen
etra
tion
Dep
th (
cm)
Pen
etra
tion
Are
a (s
q.cm
)
Bou
ndar
y R
ough
ness
(cm
)
Gra
in S
ize
Min
imum
(ph
i)
Gra
in S
ize
Max
imum
(ph
i)
Gra
in S
ize
Maj
or M
ode
(phi
)
RPD
Min
imum
(cm
)
RPD
Max
imum
(cm
)
Mea
n R
PD
(cm
)
RPD
Are
a
Num
ber
of M
ud C
last
s
Mud
Cla
st S
tate
(R
-Red
uced
, O
-Oxi
dize
d)
Met
hane
Pre
senc
e
Suc
cess
iona
l Sta
ge
OSI
Low
DO
?
Tot
al D
M A
rea
Voi
d #
Voi
d M
inim
um D
epth
(cm
)
Voi
d M
axim
um D
epth
(cm
)
Voi
d A
vera
ge D
epth
(cm
)
CO
MM
EN
T
Tot
al D
M M
in
Tot
al D
M M
ax
Toa
l D
M M
ean
SE-01 B 14.59 07/01/04 11:08:38 15.57 16.25 15.89 231.83 0.69 >4 2 >4 3.26 5.03 4.67 68.13 2 R 0 Stage I on III 11 No 0.00 0.00 0.00 0.00 2 11.00 13.02 12.01
Light gray to gray, shelly, slightly sandy silt/clay with tan RPD. Shell fragments interspersed throughout entire sediment column. Small oxidized voids in lower left and lower right. Oxidized burrow trace above left void and biogenic mound at SWI above right burrow/void. Some mudclast smeardown in center SWI. A few small tubes and abundant infaunal fecal matter at SWI.
SE-01 C 14.59 07/01/04 11:09:25 15.51 17.36 16.45 240.10 1.86 >4 2 >4 4.46 6.37 5.33 77.76 0 - 0 Stage I on III 11 No 0.00 0.00 0.00 0.00 1 13.05 13.42 13.24
Light gray to gray, shelly, slightly sandy silt/clay with tan RPD. Shell fragments interspersed throughout entire sediment column. Small oxidized void in lower center. Large red polychaete against faceplate in upper right. A few tubes at SWI and numerous very nicely formed shallow burrows in the RPD. Ambient. Three reps from this station very similar.
SE-02 A 14.59 07/01/04 10:27:54 16.54 17.19 16.89 246.43 0.66 >4 2 >4 5.23 7.17 6.18 90.20 0 - 0 Stage I on III 11 No 0.00 0.00 0.00 0.00 1 10.77 10.88 10.82
Light gray to gray, slightly shelly, slightly sandy silt/clay with tan RPD. Shell fragments interspersed throughout entire sediment column. Small void mid left. Organism smeared in lower center. Tubes at SWI and numerous, well formed shallow burrows in RPD. Ambient.
SE-02 B 14.59 07/01/04 10:28:49 15.65 16.91 16.23 236.92 1.26 >4 2 >4 3.80 5.77 5.09 74.29 3 R 0 Stage I on III 11 No 0.00 0.00 0.00 0.00 1 11.22 11.51 11.37
Light gray to gray, slightly shelly, slightly sandy silt/clay with tan RPD. Shell fragments interspersed throughout entire sediment column. Small void at very left. Deep oxidized burrow in center. Several polychaetes of at least two different speacies smeared in upper 12 cm of sediment column. A few tubes at SWI and well-formed shallow burrows in RPD. Ambient.
SE-02 E 14.59 07/01/04 13:14:39 12.54 13.48 12.96 189.11 0.94 >4 1 >4 2.46 4.48 3.82 55.70 0 - 0 Stage I on III 11 No 0.00 0.00 0.00 0.00 6 5.29 13.17 9.23
Light gray to dark gray, shelly, sandy silt/clay with tan RPD. Shell fragments interspersed throughout entire sediment column. Sediment column riddled with void/burrow complexes. Reduced sediment being conveyored to SWI at left. More organic in appearance than previous two reps. Ambient.
SE-02 F 14.59 07/01/04 13:16:38 16.54 17.11 16.92 246.97 0.57 >4 2 >4 4.46 6.85 5.27 76.89 2 R 0 Stage I on III 11 No 0.00 0.00 0.00 0.00 4 4.77 16.05 10.41
Light gray to gray, slightly shelly, slightly sandy silt/clay with tan RPD. Shell fragments interspersed throughout entire sediment column. Large burow/void complex at right that is pumping out reduced sediment to the SWI. Large active void in lower left and two smaller voids in mid and upper left. A few fine mud tubes at SWI and several thin red polychaetes in upper sediment column. Great example of infaunal activity increasing pore water content in the sediment column at right - as "cake-batter" texture surrounds the large burrow complex. Ambient.
SE-03 A 14.59 07/01/04 10:43:17 15.48 17.76 16.75 244.51 2.28 >4 2 >4 1.60 6.34 3.82 55.71 0 - 0 Stage I on III 11 No 0.00 0.00 0.00 0.00 3 8.26 13.82 11.04
Light gray to dark gray, slightly shelly, slightly sandy silt/clay with tan RPD. Shell fragments interspersed throughout entire sediment column. Oxidized burrow and small void at far left. Sediment filled void in lower center. Abundant fine mud tubes at SWI . Nice shallow burrows in RPD. Ambient.
Monitoring Survey at the Western Long Island Sound Disposal Site June 2004 Appendix B-2 page 3 of 6
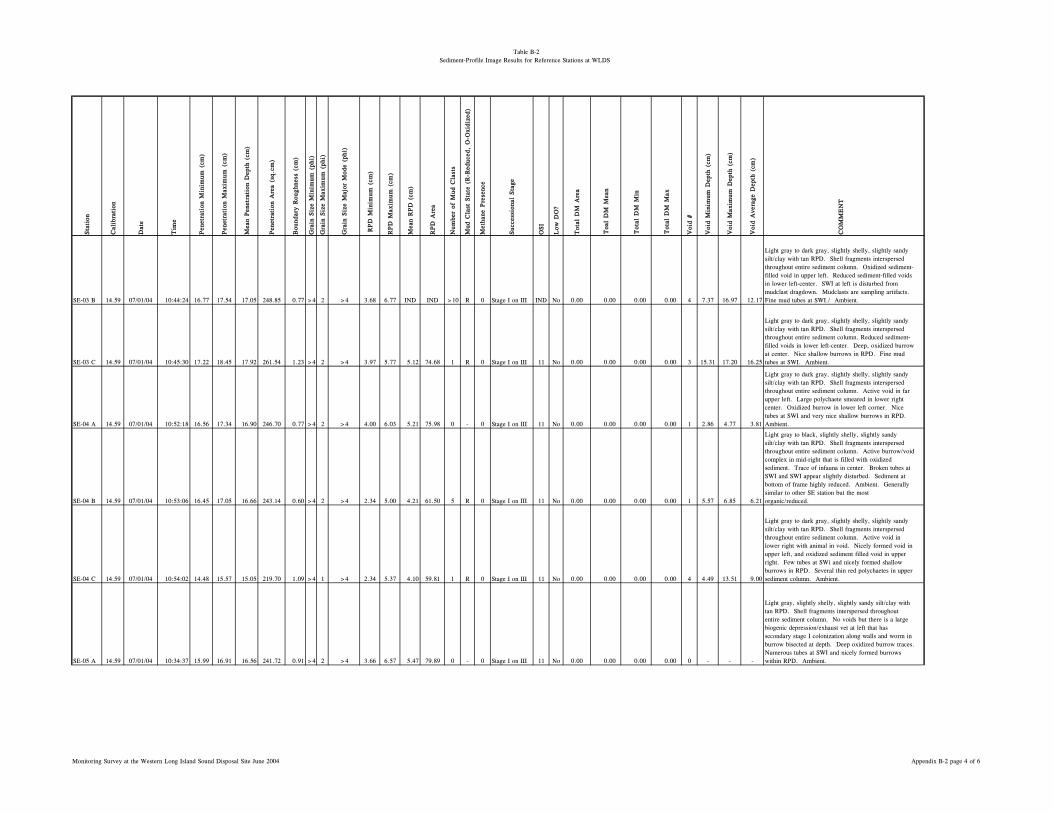
Table B-2Sediment-Profile Image Results for Reference Stations at WLDS
Sta
tion
Cal
ibra
tion
Dat
e
Tim
e
Pen
etra
tion
Min
imum
(cm
)
Pen
etra
tion
Max
imum
(cm
)
Mea
n Pen
etra
tion
Dep
th (
cm)
Pen
etra
tion
Are
a (s
q.cm
)
Bou
ndar
y R
ough
ness
(cm
)
Gra
in S
ize
Min
imum
(ph
i)
Gra
in S
ize
Max
imum
(ph
i)
Gra
in S
ize
Maj
or M
ode
(phi
)
RPD
Min
imum
(cm
)
RPD
Max
imum
(cm
)
Mea
n R
PD
(cm
)
RPD
Are
a
Num
ber
of M
ud C
last
s
Mud
Cla
st S
tate
(R
-Red
uced
, O
-Oxi
dize
d)
Met
hane
Pre
senc
e
Suc
cess
iona
l Sta
ge
OSI
Low
DO
?
Tot
al D
M A
rea
Voi
d #
Voi
d M
inim
um D
epth
(cm
)
Voi
d M
axim
um D
epth
(cm
)
Voi
d A
vera
ge D
epth
(cm
)
CO
MM
EN
T
Tot
al D
M M
in
Tot
al D
M M
ax
Toa
l D
M M
ean
SE-03 B 14.59 07/01/04 10:44:24 16.77 17.54 17.05 248.85 0.77 >4 2 >4 3.68 6.77 IND IND >10 R 0 Stage I on III IND No 0.00 0.00 0.00 0.00 4 7.37 16.97 12.17
Light gray to dark gray, slightly shelly, slightly sandy silt/clay with tan RPD. Shell fragments interspersed throughout entire sediment column. Oxidized sediment-filled void in upper left. Reduced sediment-filled voids in lower left-center. SWI at left is disturbed from mudclast dragdown. Mudclasts are sampling artifacts. Fine mud tubes at SWI./ Ambient.
SE-03 C 14.59 07/01/04 10:45:30 17.22 18.45 17.92 261.54 1.23 >4 2 >4 3.97 5.77 5.12 74.68 1 R 0 Stage I on III 11 No 0.00 0.00 0.00 0.00 3 15.31 17.20 16.25
Light gray to dark gray, slightly shelly, slightly sandy silt/clay with tan RPD. Shell fragments interspersed throughout entire sediment column. Reduced sediment-filled voids in lower left-center. Deep, oxidized burrow at center. Nice shallow burrows in RPD. Fine mud tubes at SWI. Ambient.
SE-04 A 14.59 07/01/04 10:52:18 16.56 17.34 16.90 246.70 0.77 >4 2 >4 4.00 6.03 5.21 75.98 0 - 0 Stage I on III 11 No 0.00 0.00 0.00 0.00 1 2.86 4.77 3.81
Light gray to dark gray, slightly shelly, slightly sandy silt/clay with tan RPD. Shell fragments interspersed throughout entire sediment column. Active void in far upper left. Large polychaete smeared in lower right center. Oxidized burrow in lower left corner. Nice tubes at SWI and very nice shallow burrows in RPD. Ambient.
SE-04 B 14.59 07/01/04 10:53:06 16.45 17.05 16.66 243.14 0.60 >4 2 >4 2.34 5.00 4.21 61.50 5 R 0 Stage I on III 11 No 0.00 0.00 0.00 0.00 1 5.57 6.85 6.21
Light gray to black, slightly shelly, slightly sandy silt/clay with tan RPD. Shell fragments interspersed throughout entire sediment column. Active burrow/void complex in mid-right that is filled with oxidized sediment. Trace of infauna in center. Broken tubes at SWI and SWI appear slightly disturbed. Sediment at bottom of frame highly reduced. Ambient. Generally similar to other SE station but the most organic/reduced.
SE-04 C 14.59 07/01/04 10:54:02 14.48 15.57 15.05 219.70 1.09 >4 1 >4 2.34 5.37 4.10 59.81 1 R 0 Stage I on III 11 No 0.00 0.00 0.00 0.00 4 4.49 13.51 9.00
Light gray to dark gray, slightly shelly, slightly sandy silt/clay with tan RPD. Shell fragments interspersed throughout entire sediment column. Active void in lower right with animal in void. Nicely formed void in upper left, and oxidized sediment filled void in upper right. Few tubes at SWi and nicely formed shallow burrows in RPD. Several thin red polychaetes in upper sediment column. Ambient.
SE-05 A 14.59 07/01/04 10:34:37 15.99 16.91 16.56 241.72 0.91 >4 2 >4 3.66 6.57 5.47 79.89 0 - 0 Stage I on III 11 No 0.00 0.00 0.00 0.00 0 - - -
Light gray, slightly shelly, slightly sandy silt/clay with tan RPD. Shell fragments interspersed throughout entire sediment column. No voids but there is a large biogenic depression/exhaust vet at left that has secondary stage I colonization along walls and worm in burrow bisected at depth. Deep oxidized burrow traces. Numerous tubes at SWI and nicely formed burrows within RPD. Ambient.
Monitoring Survey at the Western Long Island Sound Disposal Site June 2004 Appendix B-2 page 4 of 6
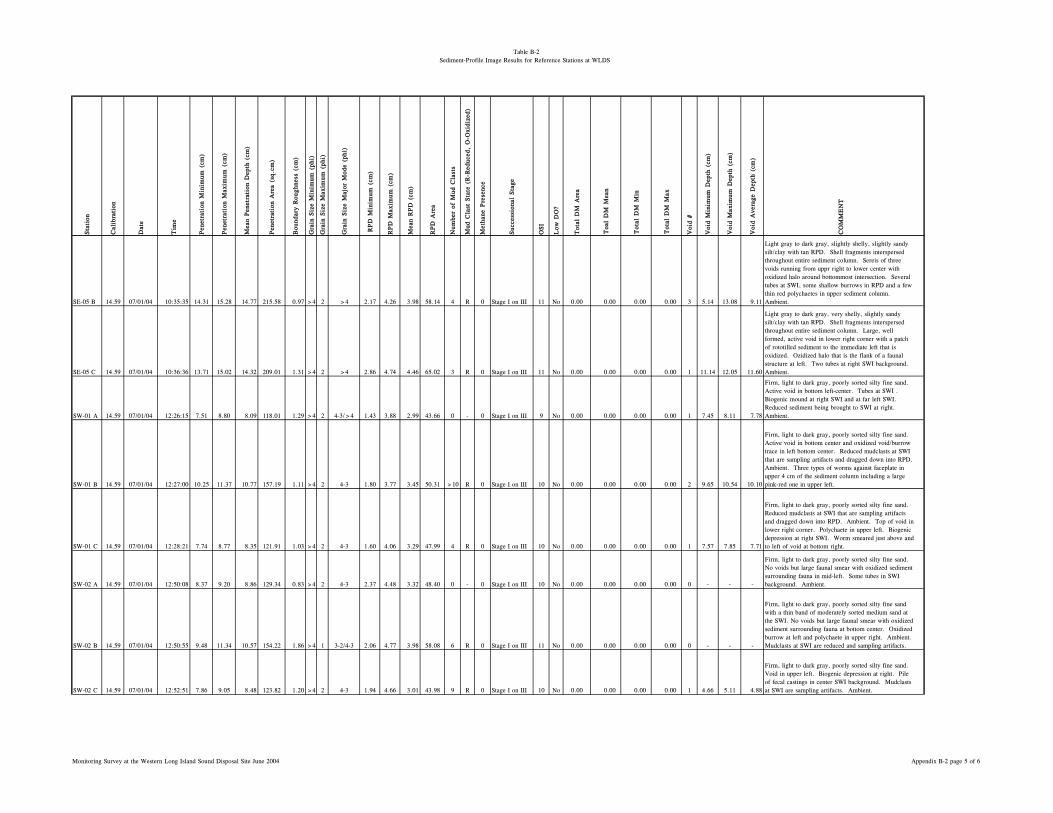
Table B-2Sediment-Profile Image Results for Reference Stations at WLDS
Sta
tion
Cal
ibra
tion
Dat
e
Tim
e
Pen
etra
tion
Min
imum
(cm
)
Pen
etra
tion
Max
imum
(cm
)
Mea
n Pen
etra
tion
Dep
th (
cm)
Pen
etra
tion
Are
a (s
q.cm
)
Bou
ndar
y R
ough
ness
(cm
)
Gra
in S
ize
Min
imum
(ph
i)
Gra
in S
ize
Max
imum
(ph
i)
Gra
in S
ize
Maj
or M
ode
(phi
)
RPD
Min
imum
(cm
)
RPD
Max
imum
(cm
)
Mea
n R
PD
(cm
)
RPD
Are
a
Num
ber
of M
ud C
last
s
Mud
Cla
st S
tate
(R
-Red
uced
, O
-Oxi
dize
d)
Met
hane
Pre
senc
e
Suc
cess
iona
l Sta
ge
OSI
Low
DO
?
Tot
al D
M A
rea
Voi
d #
Voi
d M
inim
um D
epth
(cm
)
Voi
d M
axim
um D
epth
(cm
)
Voi
d A
vera
ge D
epth
(cm
)
CO
MM
EN
T
Tot
al D
M M
in
Tot
al D
M M
ax
Toa
l D
M M
ean
SE-05 B 14.59 07/01/04 10:35:35 14.31 15.28 14.77 215.58 0.97 >4 2 >4 2.17 4.26 3.98 58.14 4 R 0 Stage I on III 11 No 0.00 0.00 0.00 0.00 3 5.14 13.08 9.11
Light gray to dark gray, slightly shelly, slightly sandy silt/clay with tan RPD. Shell fragments interspersed throughout entire sediment column. Sereis of three voids running from uppr right to lower center with oxidized halo around bottommost intersection. Several tubes at SWI, some shallow burrows in RPD and a few thin red polychaetes in upper sediment column. Ambient.
SE-05 C 14.59 07/01/04 10:36:36 13.71 15.02 14.32 209.01 1.31 >4 2 >4 2.86 4.74 4.46 65.02 3 R 0 Stage I on III 11 No 0.00 0.00 0.00 0.00 1 11.14 12.05 11.60
Light gray to dark gray, very shelly, slightly sandy silt/clay with tan RPD. Shell fragments interspersed throughout entire sediment column. Large, well formed, active void in lower right corner with a patch of rototilled sediment to the immediate left that is oxidized. Ozidized halo that is the flank of a faunal structure at left. Two tubes at right SWI background. Ambient.
SW-01 A 14.59 07/01/04 12:26:15 7.51 8.80 8.09 118.01 1.29 >4 2 4-3/>4 1.43 3.88 2.99 43.66 0 - 0 Stage I on III 9 No 0.00 0.00 0.00 0.00 1 7.45 8.11 7.78
Firm, light to dark gray, poorly sorted silty fine sand. Active void in bottom left-center. Tubes at SWI . Biogenic mound at right SWI and at far left SWI. Reduced sediment being brought to SWI at right. Ambient.
SW-01 B 14.59 07/01/04 12:27:00 10.25 11.37 10.77 157.19 1.11 >4 2 4-3 1.80 3.77 3.45 50.31 >10 R 0 Stage I on III 10 No 0.00 0.00 0.00 0.00 2 9.65 10.54 10.10
Firm, light to dark gray, poorly sorted silty fine sand. Active void in bottom center and oxidized void/burrow trace in left bottom center. Reduced mudclasts at SWI that are sampling artifacts and dragged down into RPD. Ambient. Three types of worms against faceplate in upper 4 cm of the sediment column including a large pink-red one in upper left.
SW-01 C 14.59 07/01/04 12:28:21 7.74 8.77 8.35 121.91 1.03 >4 2 4-3 1.60 4.06 3.29 47.99 4 R 0 Stage I on III 10 No 0.00 0.00 0.00 0.00 1 7.57 7.85 7.71
Firm, light to dark gray, poorly sorted silty fine sand. Reduced mudclasts at SWI that are sampling artifacts and dragged down into RPD. Ambient. Top of void in lower right corner. Polychaete in upper left. Biogenic depression at right SWI. Worm smeared just above and to left of void at bottom right.
SW-02 A 14.59 07/01/04 12:50:08 8.37 9.20 8.86 129.34 0.83 >4 2 4-3 2.37 4.48 3.32 48.40 0 - 0 Stage I on III 10 No 0.00 0.00 0.00 0.00 0 - - -
Firm, light to dark gray, poorly sorted silty fine sand. No voids but large faunal smear with oxidized sediment surrounding fauna in mid-left. Some tubes in SWI background. Ambient.
SW-02 B 14.59 07/01/04 12:50:55 9.48 11.34 10.57 154.22 1.86 >4 1 3-2/4-3 2.06 4.77 3.98 58.08 6 R 0 Stage I on III 11 No 0.00 0.00 0.00 0.00 0 - - -
Firm, light to dark gray, poorly sorted silty fine sand with a thin band of moderately sorted medium sand at the SWI. No voids but large faunal smear with oxidized sediment surrounding fauna at bottom center. Oxidized burrow at left and polychaete in upper right. Ambient. Mudclasts at SWI are reduced and sampling artifacts.
SW-02 C 14.59 07/01/04 12:52:51 7.86 9.05 8.48 123.82 1.20 >4 2 4-3 1.94 4.66 3.01 43.98 9 R 0 Stage I on III 10 No 0.00 0.00 0.00 0.00 1 4.66 5.11 4.88
Firm, light to dark gray, poorly sorted silty fine sand. Void in upper left. Biogenic depression at right. Pile of fecal castings in center SWI background. Mudclasts at SWI are sampling artifacts. Ambient.
Monitoring Survey at the Western Long Island Sound Disposal Site June 2004 Appendix B-2 page 5 of 6
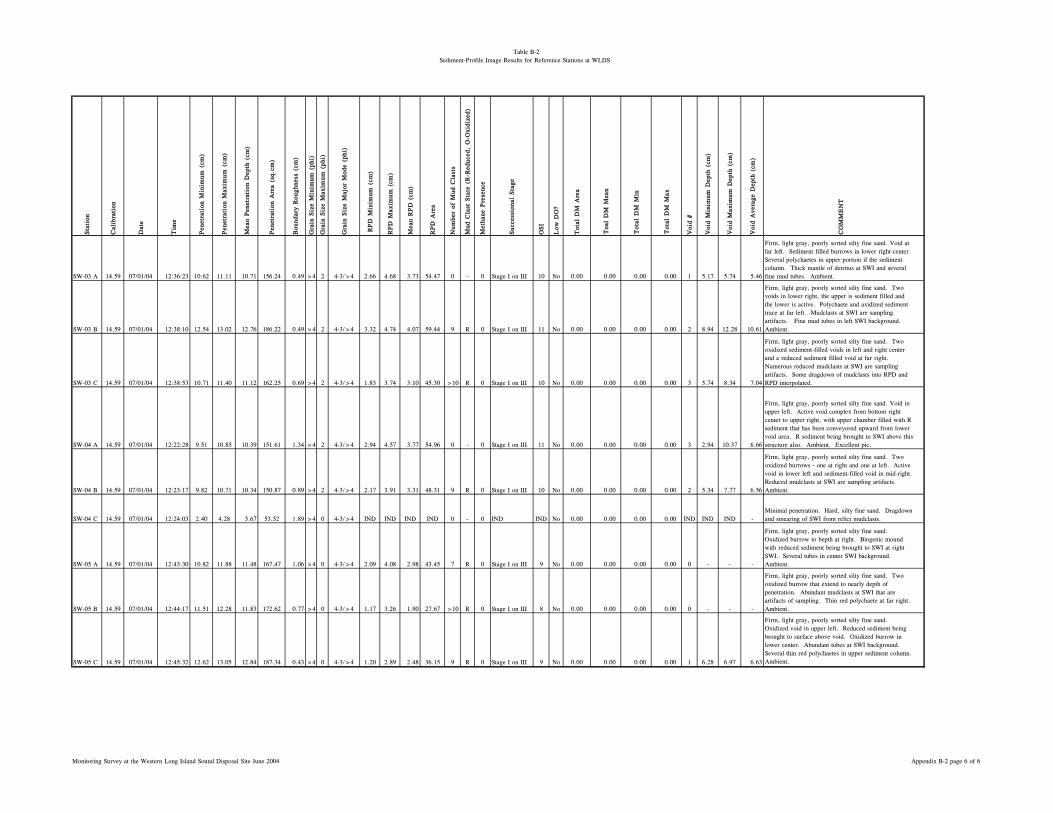
Table B-2Sediment-Profile Image Results for Reference Stations at WLDS
Sta
tion
Cal
ibra
tion
Dat
e
Tim
e
Pen
etra
tion
Min
imum
(cm
)
Pen
etra
tion
Max
imum
(cm
)
Mea
n Pen
etra
tion
Dep
th (
cm)
Pen
etra
tion
Are
a (s
q.cm
)
Bou
ndar
y R
ough
ness
(cm
)
Gra
in S
ize
Min
imum
(ph
i)
Gra
in S
ize
Max
imum
(ph
i)
Gra
in S
ize
Maj
or M
ode
(phi
)
RPD
Min
imum
(cm
)
RPD
Max
imum
(cm
)
Mea
n R
PD
(cm
)
RPD
Are
a
Num
ber
of M
ud C
last
s
Mud
Cla
st S
tate
(R
-Red
uced
, O
-Oxi
dize
d)
Met
hane
Pre
senc
e
Suc
cess
iona
l Sta
ge
OSI
Low
DO
?
Tot
al D
M A
rea
Voi
d #
Voi
d M
inim
um D
epth
(cm
)
Voi
d M
axim
um D
epth
(cm
)
Voi
d A
vera
ge D
epth
(cm
)
CO
MM
EN
T
Tot
al D
M M
in
Tot
al D
M M
ax
Toa
l D
M M
ean
SW-03 A 14.59 07/01/04 12:36:23 10.62 11.11 10.71 156.24 0.49 >4 2 4-3/>4 2.66 4.68 3.73 54.47 0 - 0 Stage I on III 10 No 0.00 0.00 0.00 0.00 1 5.17 5.74 5.46
Firm, light gray, poorly sorted silty fine sand. Void at far left. Sediment filled burrows in lower right-center. Several polychaetes in upper portion if the sediment column. Thick mantle of detritus at SWI and several fine mud tubes. Ambient.
SW-03 B 14.59 07/01/04 12:38:10 12.54 13.02 12.76 186.22 0.49 >4 2 4-3/>4 3.32 4.74 4.07 59.44 9 R 0 Stage I on III 11 No 0.00 0.00 0.00 0.00 2 8.94 12.28 10.61
Firm, light gray, poorly sorted silty fine sand. Two voids in lower right, the upper is sediment filled and the lower is active. Polychaete and axidized sediment trace at far left. Mudclasts at SWI are sampling artifacts. Fine mud tubes in left SWI background. Ambient.
SW-03 C 14.59 07/01/04 12:38:53 10.71 11.40 11.12 162.25 0.69 >4 2 4-3/>4 1.83 3.74 3.10 45.30 >10 R 0 Stage I on III 10 No 0.00 0.00 0.00 0.00 3 5.74 8.34 7.04
Firm, light gray, poorly sorted silty fine sand. Two oxidized sediment-filled voids in left and right center and a reduced sediment filled void at far right. Numerous reduced mudclasts at SWI are sampling artifacts. Some dragdown of mudclasts into RPD and RPD interpolated.
SW-04 A 14.59 07/01/04 12:22:28 9.51 10.85 10.39 151.61 1.34 >4 2 4-3/>4 2.94 4.57 3.77 54.96 0 - 0 Stage I on III 11 No 0.00 0.00 0.00 0.00 3 2.94 10.37 6.66
Firm, light gray, poorly sorted silty fine sand. Void in upper left. Active void complex from bottom right center to upper right, with upper chamber filled with R sediment that has been conveyored upward from lower void area. R sediment being brought to SWI above this structure also. Ambient. Excellent pic.
SW-04 B 14.59 07/01/04 12:23:17 9.82 10.71 10.34 150.87 0.89 >4 2 4-3/>4 2.17 3.91 3.31 48.31 9 R 0 Stage I on III 10 No 0.00 0.00 0.00 0.00 2 5.34 7.77 6.56
Firm, light gray, poorly sorted silty fine sand. Two oxidized burrows - one at right and one at left. Active void in lower left and sediment-filled void in mid-right. Reduced mudclasts at SWI are sampling artifacts. Ambient.
SW-04 C 14.59 07/01/04 12:24:03 2.40 4.28 3.67 53.52 1.89 >4 0 4-3/>4 IND IND IND IND 0 - 0 IND IND No 0.00 0.00 0.00 0.00 IND IND IND -Minimal penetration. Hard, silty fine sand. Dragdown and smearing of SWI from relict mudclasts.
SW-05 A 14.59 07/01/04 12:43:30 10.82 11.88 11.48 167.47 1.06 >4 0 4-3/>4 2.09 4.08 2.98 43.45 7 R 0 Stage I on III 9 No 0.00 0.00 0.00 0.00 0 - - -
Firm, light gray, poorly sorted silty fine sand. Oxidized burrow to bepth at right. Biogenic mound with reduced sediment being brought to SWI at right SWI. Several tubes in center SWI background. Ambient.
SW-05 B 14.59 07/01/04 12:44:17 11.51 12.28 11.83 172.62 0.77 >4 0 4-3/>4 1.17 3.26 1.90 27.67 >10 R 0 Stage I on III 8 No 0.00 0.00 0.00 0.00 0 - - -
Firm, light gray, poorly sorted silty fine sand. Two oxidized burrow that extend to nearly depth of penetration. Abundant mudclasts at SWI that are artifacts of sampling. Thin red polychaete at far right. Ambient.
SW-05 C 14.59 07/01/04 12:45:32 12.62 13.05 12.84 187.34 0.43 >4 0 4-3/>4 1.20 2.89 2.48 36.15 9 R 0 Stage I on III 9 No 0.00 0.00 0.00 0.00 1 6.28 6.97 6.63
Firm, light gray, poorly sorted silty fine sand. Oxidized void in upper left. Reduced sediment being brought to surface above void. Oxidized burrow in lower center. Abundant tubes at SWI background. Several thin red polychaetes in upper sediment column. Ambient.
Monitoring Survey at the Western Long Island Sound Disposal Site June 2004 Appendix B-2 page 6 of 6
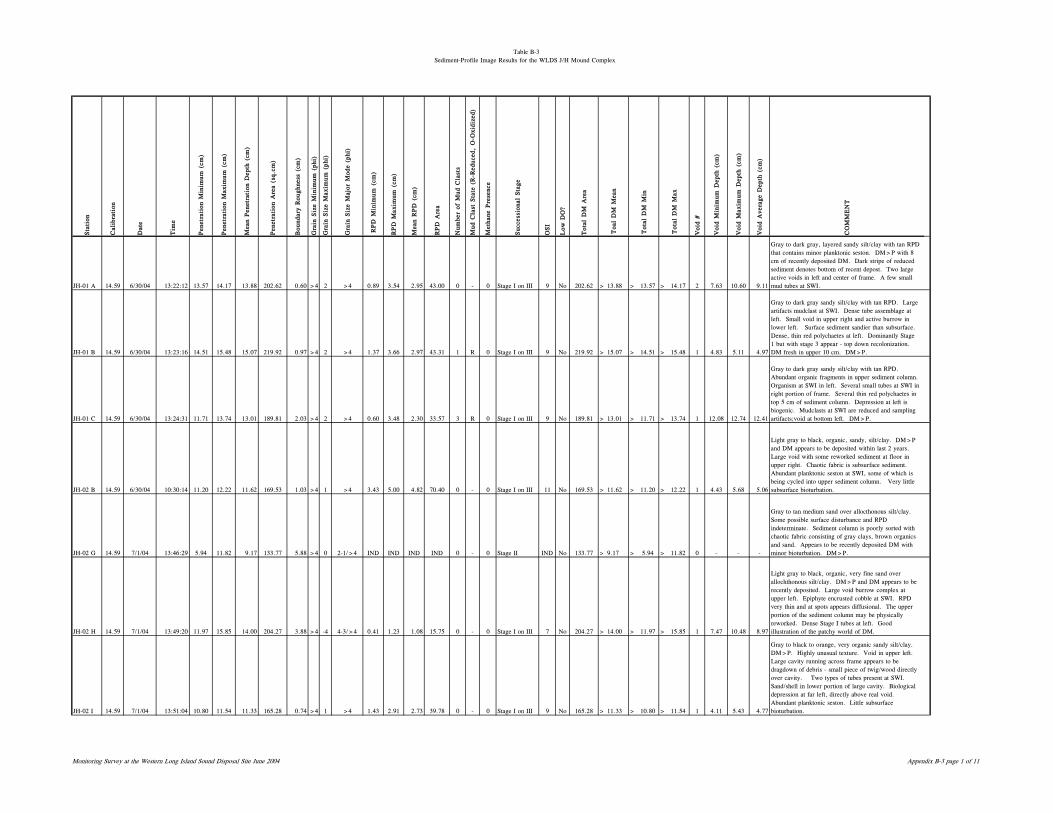
Table B-3Sediment-Profile Image Results for the WLDS J/H Mound Complex
Sta
tion
Cal
ibra
tion
Dat
e
Tim
e
Pen
etra
tion
Min
imum
(cm
)
Pen
etra
tion
Max
imum
(cm
)
Mea
n Pen
etra
tion
Dep
th (
cm)
Pen
etra
tion
Are
a (s
q.cm
)
Bou
ndar
y R
ough
ness
(cm
)
Gra
in S
ize
Min
imum
(ph
i)
Gra
in S
ize
Max
imum
(ph
i)
Gra
in S
ize
Maj
or M
ode
(phi
)
RPD
Min
imum
(cm
)
RPD
Max
imum
(cm
)
Mea
n R
PD
(cm
)
RPD
Are
a
Num
ber
of M
ud C
last
s
Mud
Cla
st S
tate
(R
-Red
uced
, O
-Oxi
dize
d)
Met
hane
Pre
senc
e
Suc
cess
iona
l Sta
ge
OSI
Low
DO
?
Tot
al D
M A
rea
Voi
d #
Voi
d M
inim
um D
epth
(cm
)
Voi
d M
axim
um D
epth
(cm
)
Voi
d A
vera
ge D
epth
(cm
)
CO
MM
EN
T
JH-01 A 14.59 6/30/04 13:22:12 13.57 14.17 13.88 202.62 0.60 >4 2 >4 0.89 3.54 2.95 43.00 0 - 0 Stage I on III 9 No 202.62 > 13.88 > 13.57 > 14.17 2 7.63 10.60 9.11
Gray to dark gray, layered sandy silt/clay with tan RPD that contains minor planktonic seston. DM>P with 8 cm of recently deposited DM. Dark stripe of reduced sediment denotes bottom of recent depost. Two large active voids in left and center of frame. A few small mud tubes at SWI.
JH-01 B 14.59 6/30/04 13:23:16 14.51 15.48 15.07 219.92 0.97 >4 2 >4 1.37 3.66 2.97 43.31 1 R 0 Stage I on III 9 No 219.92 > 15.07 > 14.51 > 15.48 1 4.83 5.11 4.97
Gray to dark gray sandy silt/clay with tan RPD. Large artifacts mudclast at SWI. Dense tube assemblage at left. Small void in upper right and active burrow in lower left. Surface sediment sandier than subsurface. Dense, thin red polychaetes at left. Dominantly Stage 1 but with stage 3 appear - top down recolonization. DM fresh in upper 10 cm. DM>P.
JH-01 C 14.59 6/30/04 13:24:31 11.71 13.74 13.01 189.81 2.03 >4 2 >4 0.60 3.48 2.30 33.57 3 R 0 Stage I on III 9 No 189.81 > 13.01 > 11.71 > 13.74 1 12.08 12.74 12.41
Gray to dark gray sandy silt/clay with tan RPD. Abundant organic fragments in upper sediment column. Organism at SWI in left. Several small tubes at SWI in right portion of frame. Several thin red polychaetes in top 5 cm of sediment column. Depression at left is biogenic. Mudclasts at SWI are reduced and sampling artifacts;void at bottom left. DM>P.
JH-02 B 14.59 6/30/04 10:30:14 11.20 12.22 11.62 169.53 1.03 >4 1 >4 3.43 5.00 4.82 70.40 0 - 0 Stage I on III 11 No 169.53 > 11.62 > 11.20 > 12.22 1 4.43 5.68 5.06
Light gray to black, organic, sandy, silt/clay. DM>P and DM appears to be deposited within last 2 years. Large void with some reworked sediment at floor in upper right. Chaotic fabric is subsurface sediment. Abundant planktonic seston at SWI, some of which is being cycled into upper sediment column. Very little subsurface bioturbation.
JH-02 G 14.59 7/1/04 13:46:29 5.94 11.82 9.17 133.77 5.88 >4 0 2-1/>4 IND IND IND IND 0 - 0 Stage II IND No 133.77 > 9.17 > 5.94 > 11.82 0 - - -
Gray to tan medium sand over allocthonous silt/clay. Some possible surface disturbance and RPD indeterminate. Sediment column is poorly sorted with chaotic fabric consisting of gray clays, brown organics and sand. Appears to be recently deposited DM with minor bioturbation. DM>P.
JH-02 H 14.59 7/1/04 13:49:20 11.97 15.85 14.00 204.27 3.88 >4 -4 4-3/>4 0.41 1.23 1.08 15.75 0 - 0 Stage I on III 7 No 204.27 > 14.00 > 11.97 > 15.85 1 7.47 10.48 8.97
Light gray to black, organic, very fine sand over allochthonous silt/clay. DM>P and DM appears to be recently deposited. Large void burrow complex at upper left. Epiphyte encrusted cobble at SWI. RPD very thin and at spots appears diffusional. The upper portion of the sediment column may be physically reworked. Dense Stage I tubes at left. Good illustration of the patchy world of DM.
JH-02 I 14.59 7/1/04 13:51:04 10.80 11.54 11.33 165.28 0.74 >4 1 >4 1.43 2.91 2.73 39.78 0 - 0 Stage I on III 9 No 165.28 > 11.33 > 10.80 > 11.54 1 4.11 5.43 4.77
Gray to black to orange, very organic sandy silt/clay. DM>P. Highly unusual texture. Void in upper left. Large cavity running across frame appears to be dragdown of debris - small piece of twig/wood directly over cavity. Two types of tubes present at SWI. Sand/shell in lower portion of large cavity. Biological depression at far left, directly above real void. Abundant planktonic seston. Little subsurface bioturbation.
Tot
al D
M M
in
Tot
al D
M M
ax
Toa
l D
M M
ean
Monitoring Survey at the Western Long Island Sound Disposal Site June 2004 Appendix B-3 page 1 of 11
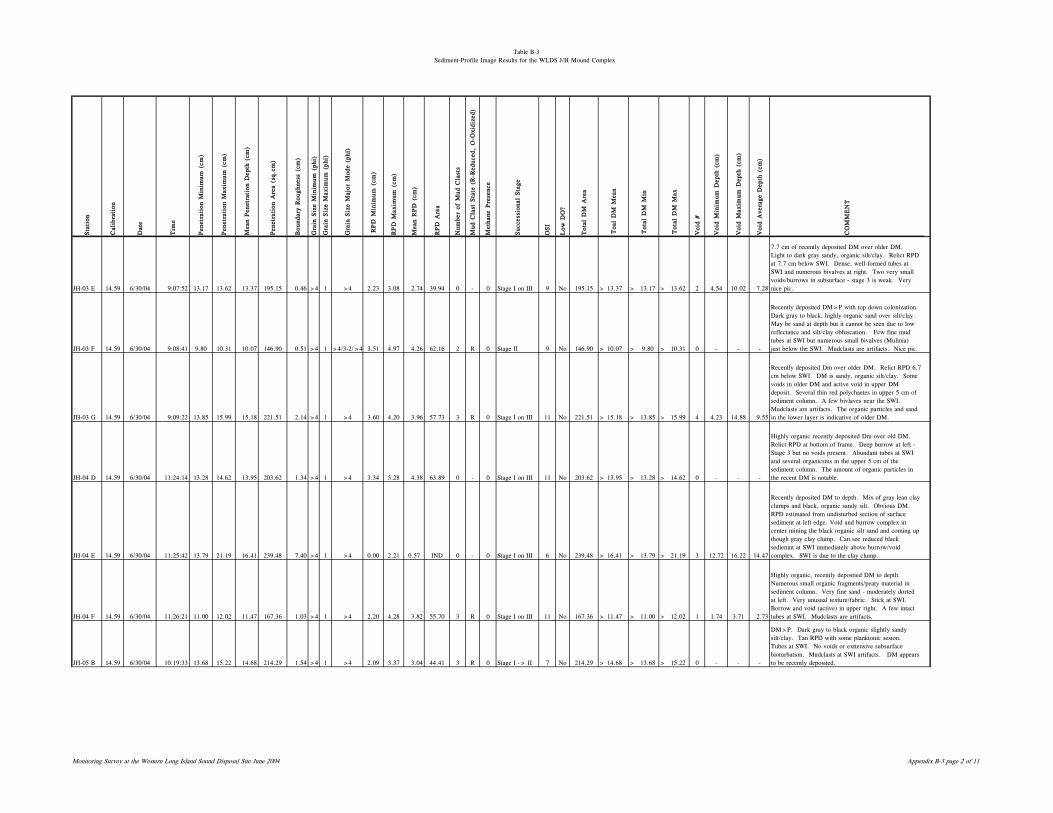
Table B-3Sediment-Profile Image Results for the WLDS J/H Mound Complex
Sta
tion
Cal
ibra
tion
Dat
e
Tim
e
Pen
etra
tion
Min
imum
(cm
)
Pen
etra
tion
Max
imum
(cm
)
Mea
n Pen
etra
tion
Dep
th (
cm)
Pen
etra
tion
Are
a (s
q.cm
)
Bou
ndar
y R
ough
ness
(cm
)
Gra
in S
ize
Min
imum
(ph
i)
Gra
in S
ize
Max
imum
(ph
i)
Gra
in S
ize
Maj
or M
ode
(phi
)
RPD
Min
imum
(cm
)
RPD
Max
imum
(cm
)
Mea
n R
PD
(cm
)
RPD
Are
a
Num
ber
of M
ud C
last
s
Mud
Cla
st S
tate
(R
-Red
uced
, O
-Oxi
dize
d)
Met
hane
Pre
senc
e
Suc
cess
iona
l Sta
ge
OSI
Low
DO
?
Tot
al D
M A
rea
Voi
d #
Voi
d M
inim
um D
epth
(cm
)
Voi
d M
axim
um D
epth
(cm
)
Voi
d A
vera
ge D
epth
(cm
)
CO
MM
EN
T
Tot
al D
M M
in
Tot
al D
M M
ax
Toa
l D
M M
ean
JH-03 E 14.59 6/30/04 9:07:52 13.17 13.62 13.37 195.15 0.46 >4 1 >4 2.23 3.08 2.74 39.94 0 - 0 Stage I on III 9 No 195.15 > 13.37 > 13.17 > 13.62 2 4.54 10.02 7.28
7.7 cm of recently deposited DM over older DM. Light to dark gray sandy, organic silt/clay. Relict RPD at 7.7 cm below SWI. Dense, well-formed tubes at SWI and numerous bivalves at right. Two very small voids/burrows in subsurface - stage 3 is weak. Very nice pic.
JH-03 F 14.59 6/30/04 9:08:41 9.80 10.31 10.07 146.90 0.51 >4 1 >4/3-2/>4 3.51 4.97 4.26 62.16 2 R 0 Stage II 9 No 146.90 > 10.07 > 9.80 > 10.31 0 - - -
Recently deposited DM>P with top down colonization. Dark gray to black, highly organic sand over silt/clay. May be sand at depth but it cannot be seen due to low reflectance and silt/clay obfuscation. Few fine mud tubes at SWI but numerous small bivalves (Mulinia) just below the SWI. Mudclasts are artifacts. Nice pic.
JH-03 G 14.59 6/30/04 9:09:22 13.85 15.99 15.18 221.51 2.14 >4 1 >4 3.60 4.20 3.96 57.73 3 R 0 Stage I on III 11 No 221.51 > 15.18 > 13.85 > 15.99 4 4.23 14.88 9.55
Recently deposited Dm over older DM. Relict RPD 6.7 cm below SWI. DM is sandy, organic silt/clay. Some voids in older DM and active void in upper DM deposit. Several thin red polychaetes in upper 5 cm of sediment column. A few bivlaves near the SWI. Mudclasts are artifacts. The organic particles and sand in the lower layer is indicative of older DM.
JH-04 D 14.59 6/30/04 11:24:14 13.28 14.62 13.95 203.62 1.34 >4 1 >4 3.34 5.28 4.38 63.89 0 - 0 Stage I on III 11 No 203.62 > 13.95 > 13.28 > 14.62 0 - - -
Highly organic recently deposited Dm over old DM. Relict RPD at bottom of frame. Deep burrow at left - Stage 3 but no voids present. Abundant tubes at SWI and several organicsms in the upper 5 cm of the sediment column. The amount of organic particles in the recent DM is notable.
JH-04 E 14.59 6/30/04 11:25:42 13.79 21.19 16.41 239.48 7.40 >4 1 >4 0.00 2.21 0.57 IND 0 - 0 Stage I on III 6 No 239.48 > 16.41 > 13.79 > 21.19 3 12.72 16.22 14.47
Recently deposited DM to depth. Mix of gray lean clay clumps and black, organic sandy silt. Obvious DM. RPD estimated from undisturbed section of surface sediment at left edge. Void and burrow complex in center mining the black organic silt sand and coming up though gray clay clump. Can see reduced black sediemnt at SWI immediately above burrow/void complex. SWI is due to the clay clump.
JH-04 F 14.59 6/30/04 11:26:21 11.00 12.02 11.47 167.36 1.03 >4 1 >4 2.20 4.28 3.82 55.70 3 R 0 Stage I on III 11 No 167.36 > 11.47 > 11.00 > 12.02 1 1.74 3.71 2.73
Highly organic, recently depostied DM to depth. Numerous small organic fragments/peaty material in sediment column. Very fine sand - moderately dorted at left. Very unusual texture/fabric. Stick at SWI. Borrow and void (active) in upper right. A few intact tubes at SWI. Mudclasts are artifacts.
JH-05 B 14.59 6/30/04 10:19:33 13.68 15.22 14.68 214.29 1.54 >4 1 >4 2.09 3.37 3.04 44.41 3 R 0 Stage I -> II 7 No 214.29 > 14.68 > 13.68 > 15.22 0 - - -
DM>P. Dark gray to black organic slightly sandy silt/clay. Tan RPD with some planktonic seston. Tubes at SWI. No voids or exttensive subsurface bioturbation. Mudclasts at SWI artifacts. DM appears to be recently deposited.
Monitoring Survey at the Western Long Island Sound Disposal Site June 2004 Appendix B-3 page 2 of 11
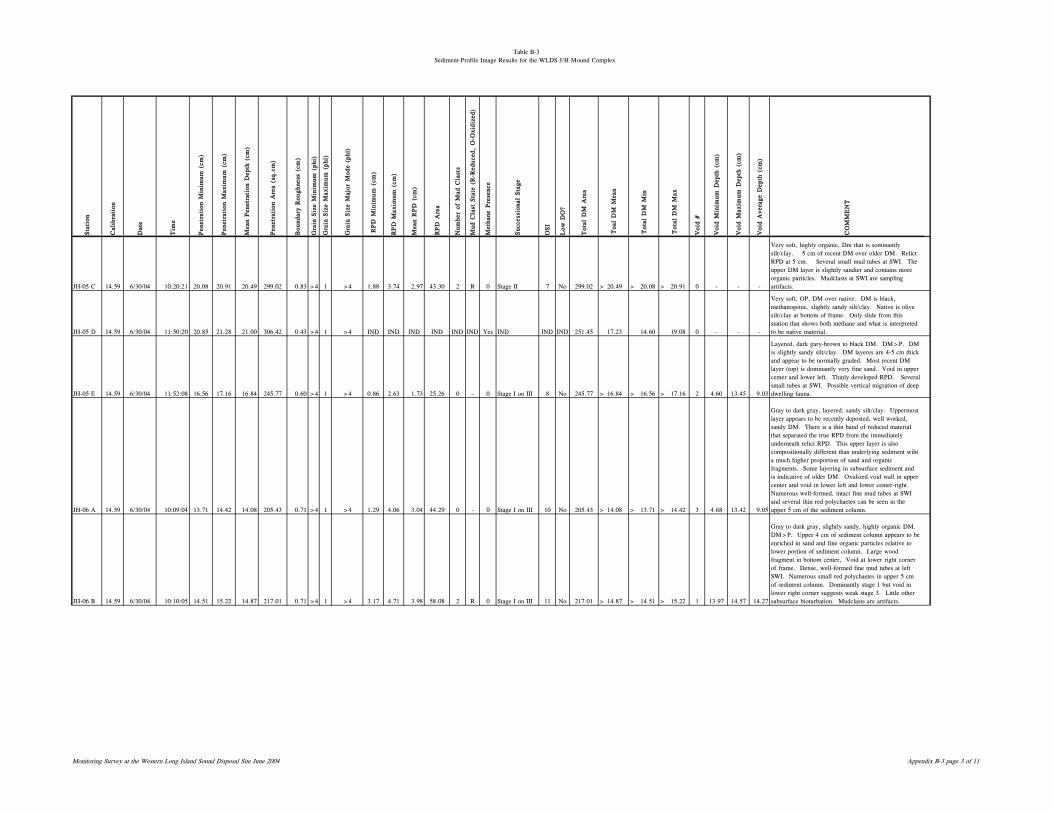
Table B-3Sediment-Profile Image Results for the WLDS J/H Mound Complex
Sta
tion
Cal
ibra
tion
Dat
e
Tim
e
Pen
etra
tion
Min
imum
(cm
)
Pen
etra
tion
Max
imum
(cm
)
Mea
n Pen
etra
tion
Dep
th (
cm)
Pen
etra
tion
Are
a (s
q.cm
)
Bou
ndar
y R
ough
ness
(cm
)
Gra
in S
ize
Min
imum
(ph
i)
Gra
in S
ize
Max
imum
(ph
i)
Gra
in S
ize
Maj
or M
ode
(phi
)
RPD
Min
imum
(cm
)
RPD
Max
imum
(cm
)
Mea
n R
PD
(cm
)
RPD
Are
a
Num
ber
of M
ud C
last
s
Mud
Cla
st S
tate
(R
-Red
uced
, O
-Oxi
dize
d)
Met
hane
Pre
senc
e
Suc
cess
iona
l Sta
ge
OSI
Low
DO
?
Tot
al D
M A
rea
Voi
d #
Voi
d M
inim
um D
epth
(cm
)
Voi
d M
axim
um D
epth
(cm
)
Voi
d A
vera
ge D
epth
(cm
)
CO
MM
EN
T
Tot
al D
M M
in
Tot
al D
M M
ax
Toa
l D
M M
ean
JH-05 C 14.59 6/30/04 10:20:21 20.08 20.91 20.49 299.02 0.83 >4 1 >4 1.88 3.74 2.97 43.30 2 R 0 Stage II 7 No 299.02 > 20.49 > 20.08 > 20.91 0 - - -
Very soft, highly organic, Dm that is sominantly silt/clay. 5 cm of recent DM over older DM. Relict RPD at 5 cm. Several small mud tubes at SWI. The upper DM layer is slightly sandier and contains more organic particles. Mudclasts at SWI are sampling artifacts.
JH-05 D 14.59 6/30/04 11:50:20 20.85 21.28 21.00 306.42 0.43 >4 1 >4 IND IND IND IND IND IND Yes IND IND IND 251.45 17.23 14.60 19.08 0 - - -
Very soft, OP, DM over native. DM is black, methanogenic, slightly sandy silt/clay. Native is olive silt/clay at bottom of frame. Only slide from this station that shows both methane and what is interpreted to be native material.
JH-05 E 14.59 6/30/04 11:52:08 16.56 17.16 16.84 245.77 0.60 >4 1 >4 0.86 2.63 1.73 25.26 0 - 0 Stage I on III 8 No 245.77 > 16.84 > 16.56 > 17.16 2 4.60 13.45 9.03
Layered, dark gary-brown to black DM. DM>P. DM is slightly sandy silt/clay. DM layeres are 4-5 cm thick and appear to be normally graded. Most recent DM layer (top) is dominantly very fine sand. Void in upper center and lower left. Thinly developed RPD. Several small tubes at SWI. Possible vertical migration of deep dwelling fauna.
JH-06 A 14.59 6/30/04 10:09:04 13.71 14.42 14.08 205.43 0.71 >4 1 >4 1.29 4.06 3.04 44.29 0 - 0 Stage I on III 10 No 205.43 > 14.08 > 13.71 > 14.42 3 4.68 13.42 9.05
Gray to dark gray, layered, sandy silt/clay. Uppermost layer appears to be recently deposted, well worked, sandy DM. There is a thin band of reduced material that separated the true RPD from the immediately underneath relict RPD. This upper layer is also compositionally different than underlying sediment wiht a much higher proportion of sand and organic fragments. Some layering in subsurface sediment and is indicative of older DM. Oxidized void wall in upper center and void in lower left and lower center-right. Numerous well-formed, intact fine mud tubes at SWI and several thin red polychaetes can be seen in the upper 5 cm of the sediment column.
JH-06 B 14.59 6/30/04 10:10:05 14.51 15.22 14.87 217.01 0.71 >4 1 >4 3.17 4.71 3.98 58.08 2 R 0 Stage I on III 11 No 217.01 > 14.87 > 14.51 > 15.22 1 13.97 14.57 14.27
Gray to dark gray, slightly sandy, highly organic DM. DM>P. Upper 4 cm of sediment column appears to be enriched in sand and fine organic particles relative to lower portion of sediment column. Large wood fragment in bottom center, Void at lower right corner of frame. Dense, well-formed fine mud tubes at left SWI. Numerous small red polychaetes in upper 5 cm of sediment column. Dominantly stage 1 but void in lower right corner suggests weak stage 3. Little other subsurface bioturbation. Mudclasts are artifacts.
Monitoring Survey at the Western Long Island Sound Disposal Site June 2004 Appendix B-3 page 3 of 11
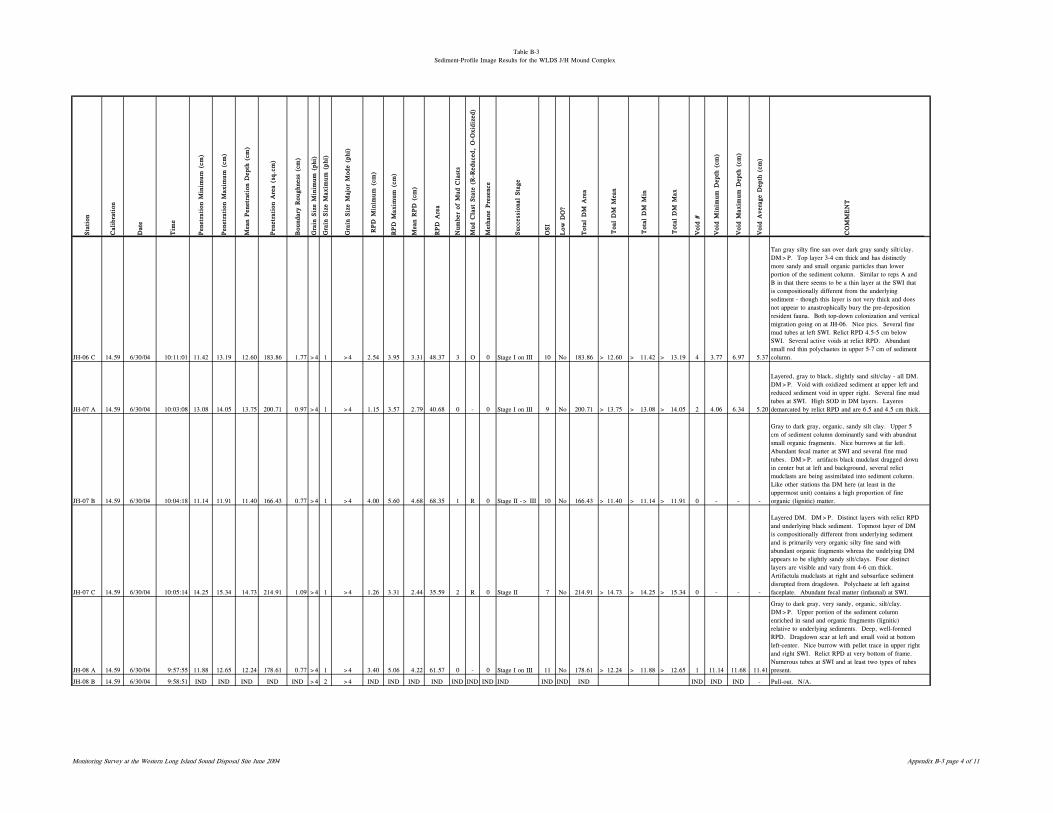
Table B-3Sediment-Profile Image Results for the WLDS J/H Mound Complex
Sta
tion
Cal
ibra
tion
Dat
e
Tim
e
Pen
etra
tion
Min
imum
(cm
)
Pen
etra
tion
Max
imum
(cm
)
Mea
n Pen
etra
tion
Dep
th (
cm)
Pen
etra
tion
Are
a (s
q.cm
)
Bou
ndar
y R
ough
ness
(cm
)
Gra
in S
ize
Min
imum
(ph
i)
Gra
in S
ize
Max
imum
(ph
i)
Gra
in S
ize
Maj
or M
ode
(phi
)
RPD
Min
imum
(cm
)
RPD
Max
imum
(cm
)
Mea
n R
PD
(cm
)
RPD
Are
a
Num
ber
of M
ud C
last
s
Mud
Cla
st S
tate
(R
-Red
uced
, O
-Oxi
dize
d)
Met
hane
Pre
senc
e
Suc
cess
iona
l Sta
ge
OSI
Low
DO
?
Tot
al D
M A
rea
Voi
d #
Voi
d M
inim
um D
epth
(cm
)
Voi
d M
axim
um D
epth
(cm
)
Voi
d A
vera
ge D
epth
(cm
)
CO
MM
EN
T
Tot
al D
M M
in
Tot
al D
M M
ax
Toa
l D
M M
ean
JH-06 C 14.59 6/30/04 10:11:01 11.42 13.19 12.60 183.86 1.77 >4 1 >4 2.54 3.95 3.31 48.37 3 O 0 Stage I on III 10 No 183.86 > 12.60 > 11.42 > 13.19 4 3.77 6.97 5.37
Tan gray silty fine san over dark gray sandy silt/clay. DM>P. Top layer 3-4 cm thick and has distinctly more sandy and small organic particles than lower portion of the sediment column. Similar to reps A and B in that there seems to be a thin layer at the SWI that is compositionally different from the underlying sediment - though this layer is not very thick and does not appear to anastrophically bury the pre-deposition resident fauna. Both top-down colonization and vertical migration going on at JH-06. Nice pics. Several fine mud tubes at left SWI. Relict RPD 4.5-5 cm below SWI. Several active voids at relict RPD. Abundant small red thin polychaetes in upper 5-7 cm of sediment column.
JH-07 A 14.59 6/30/04 10:03:08 13.08 14.05 13.75 200.71 0.97 >4 1 >4 1.15 3.57 2.79 40.68 0 - 0 Stage I on III 9 No 200.71 > 13.75 > 13.08 > 14.05 2 4.06 6.34 5.20
Layered, gray to black, slightly sand silt/clay - all DM. DM>P. Void with oxidized sediment at upper left and reduced sediment void in upper right. Several fine mud tubes at SWI. High SOD in DM layers. Layeres demarcated by relict RPD and are 6.5 and 4.5 cm thick.
JH-07 B 14.59 6/30/04 10:04:18 11.14 11.91 11.40 166.43 0.77 >4 1 >4 4.00 5.60 4.68 68.35 1 R 0 Stage II -> III 10 No 166.43 > 11.40 > 11.14 > 11.91 0 - - -
Gray to dark gray, organic, sandy silt clay. Upper 5 cm of sediment column dominantly sand with abundnat small organic fragments. Nice burrows at far left. Abundant fecal matter at SWI and several fine mud tubes. DM>P. artifacts black mudclast dragged down in center but at left and background, several relict mudclasts are being assimilated into sediment column. Like other stations tha DM here (at least in the uppermost unit) contains a high proportion of fine organic (lignitic) matter.
JH-07 C 14.59 6/30/04 10:05:14 14.25 15.34 14.73 214.91 1.09 >4 1 >4 1.26 3.31 2.44 35.59 2 R 0 Stage II 7 No 214.91 > 14.73 > 14.25 > 15.34 0 - - -
Layered DM. DM>P. Distinct layers with relict RPD and underlying black sediment. Topmost layer of DM is compositionally different from underlying sediment and is primarily very organic silty fine sand with abundant organic fragments whreas the undelying DM appears to be slightly sandy silt/clays. Four distinct layers are visible and vary from 4-6 cm thick. Artifactula mudclasts at right and subsurface sediment disrupted from dragdown. Polychaete at left against faceplate. Abundant fecal matter (infaunal) at SWI.
JH-08 A 14.59 6/30/04 9:57:55 11.88 12.65 12.24 178.61 0.77 >4 1 >4 3.40 5.06 4.22 61.57 0 - 0 Stage I on III 11 No 178.61 > 12.24 > 11.88 > 12.65 1 11.14 11.68 11.41
Gray to dark gray, very sandy, organic, silt/clay. DM>P. Upper portion of the sediment column enriched in sand and organic fragments (lignitic) relative to underlying sediments. Deep, well-formed RPD. Dragdown scar at left and small void at bottom left-center. Nice burrow with pellet trace in upper right and right SWI. Relict RPD at very bottom of frame. Numerous tubes at SWI and at least two types of tubes present.
JH-08 B 14.59 6/30/04 9:58:51 IND IND IND IND IND >4 2 >4 IND IND IND IND IND IND IND IND IND IND IND IND IND IND - Pull-out. N/A.
Monitoring Survey at the Western Long Island Sound Disposal Site June 2004 Appendix B-3 page 4 of 11
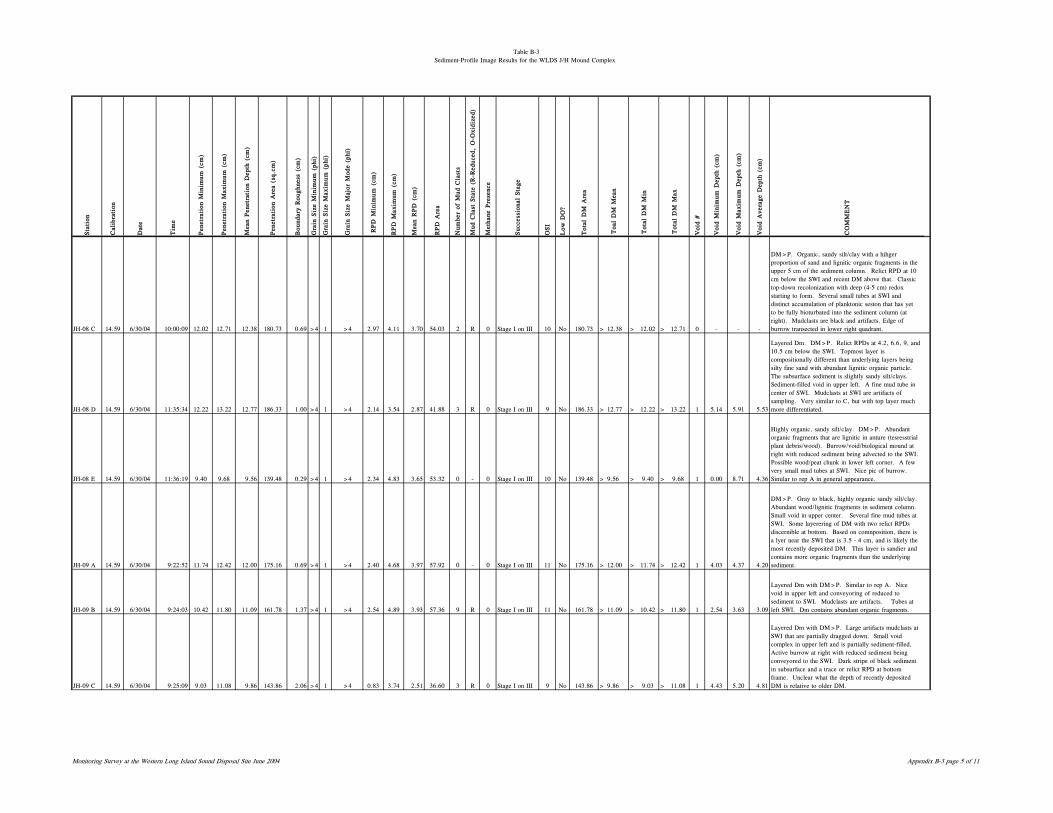
Table B-3Sediment-Profile Image Results for the WLDS J/H Mound Complex
Sta
tion
Cal
ibra
tion
Dat
e
Tim
e
Pen
etra
tion
Min
imum
(cm
)
Pen
etra
tion
Max
imum
(cm
)
Mea
n Pen
etra
tion
Dep
th (
cm)
Pen
etra
tion
Are
a (s
q.cm
)
Bou
ndar
y R
ough
ness
(cm
)
Gra
in S
ize
Min
imum
(ph
i)
Gra
in S
ize
Max
imum
(ph
i)
Gra
in S
ize
Maj
or M
ode
(phi
)
RPD
Min
imum
(cm
)
RPD
Max
imum
(cm
)
Mea
n R
PD
(cm
)
RPD
Are
a
Num
ber
of M
ud C
last
s
Mud
Cla
st S
tate
(R
-Red
uced
, O
-Oxi
dize
d)
Met
hane
Pre
senc
e
Suc
cess
iona
l Sta
ge
OSI
Low
DO
?
Tot
al D
M A
rea
Voi
d #
Voi
d M
inim
um D
epth
(cm
)
Voi
d M
axim
um D
epth
(cm
)
Voi
d A
vera
ge D
epth
(cm
)
CO
MM
EN
T
Tot
al D
M M
in
Tot
al D
M M
ax
Toa
l D
M M
ean
JH-08 C 14.59 6/30/04 10:00:09 12.02 12.71 12.38 180.73 0.69 >4 1 >4 2.97 4.11 3.70 54.03 2 R 0 Stage I on III 10 No 180.73 > 12.38 > 12.02 > 12.71 0 - - -
DM>P. Organic, sandy silt/clay with a hihger proportion of sand and lignitic organic fragments in the upper 5 cm of the sediment column. Relict RPD at 10 cm below the SWI and recent DM above that. Classic top-down recolonization with deep (4-5 cm) redox starting to form. Several small tubes at SWI and distinct accumulation of planktonic seston that has yet to be fully bioturbated into the sediment column (at right). Mudclasts are black and artifacts. Edge of burrow transected in lower right quadrant.
JH-08 D 14.59 6/30/04 11:35:34 12.22 13.22 12.77 186.33 1.00 >4 1 >4 2.14 3.54 2.87 41.88 3 R 0 Stage I on III 9 No 186.33 > 12.77 > 12.22 > 13.22 1 5.14 5.91 5.53
Layered Dm. DM>P. Relict RPDs at 4.2, 6.6, 9, and 10.5 cm below the SWI. Topmost layer is compositionally different than underlying layers being silty fine sand with abundant lignitic organic particle. The subsurface sediment is slightly sandy silt/clays. Sediment-filled void in upper left. A fine mud tube in center of SWI. Mudclasts at SWI are artifacts of sampling. Very similar to C, but with top layer much more differentiated.
JH-08 E 14.59 6/30/04 11:36:19 9.40 9.68 9.56 139.48 0.29 >4 1 >4 2.34 4.83 3.65 53.32 0 - 0 Stage I on III 10 No 139.48 > 9.56 > 9.40 > 9.68 1 0.00 8.71 4.36
Highly organic, sandy silt/clay. DM>P. Abundant organic fragments that are lignitic in anture (tesresstrial plant debris/wood). Burrow/void/biological mound at right with reduced sediment being advected to the SWI. Possible wood/peat chunk in lower left corner. A few very small mud tubes at SWI. Nice pic of burrow. Similar to rep A in general appearance.
JH-09 A 14.59 6/30/04 9:22:52 11.74 12.42 12.00 175.16 0.69 >4 1 >4 2.40 4.68 3.97 57.92 0 - 0 Stage I on III 11 No 175.16 > 12.00 > 11.74 > 12.42 1 4.03 4.37 4.20
DM>P. Gray to black, highly organic sandy silt/clay. Abundant wood/lignitic fragments in sediment column. Small void in upper center. Several fine mud tubes at SWI. Some layerering of DM with two relict RPDs discernible at bottom. Based on comnposition, there is a lyer near the SWI that is 3.5 - 4 cm, and is likely the most recently deposited DM. This layer is sandier and contains more organic fragments than the underlying sediment.
JH-09 B 14.59 6/30/04 9:24:03 10.42 11.80 11.09 161.78 1.37 >4 1 >4 2.54 4.89 3.93 57.36 9 R 0 Stage I on III 11 No 161.78 > 11.09 > 10.42 > 11.80 1 2.54 3.63 3.09
Layered Dm with DM>P. Similar to rep A. Nice void in upper left and conveyoring of reduced to sediment to SWI. Mudclasts are artifacts. Tubes at left SWI. Dm contains abundant organic fragments.
JH-09 C 14.59 6/30/04 9:25:09 9.03 11.08 9.86 143.86 2.06 >4 1 >4 0.83 3.74 2.51 36.60 3 R 0 Stage I on III 9 No 143.86 > 9.86 > 9.03 > 11.08 1 4.43 5.20 4.81
Layered Dm with DM>P. Large artifacts mudclasts at SWI that are partially dragged down. Small void complex in upper left and is partially sediment-filled, Active burrow at right with reduced sediment being conveyored to the SWI. Dark stripe of black sediment in subsurface and a trace or relict RPD at bottom frame. Unclear what the depth of recently deposited DM is relative to older DM.
Monitoring Survey at the Western Long Island Sound Disposal Site June 2004 Appendix B-3 page 5 of 11
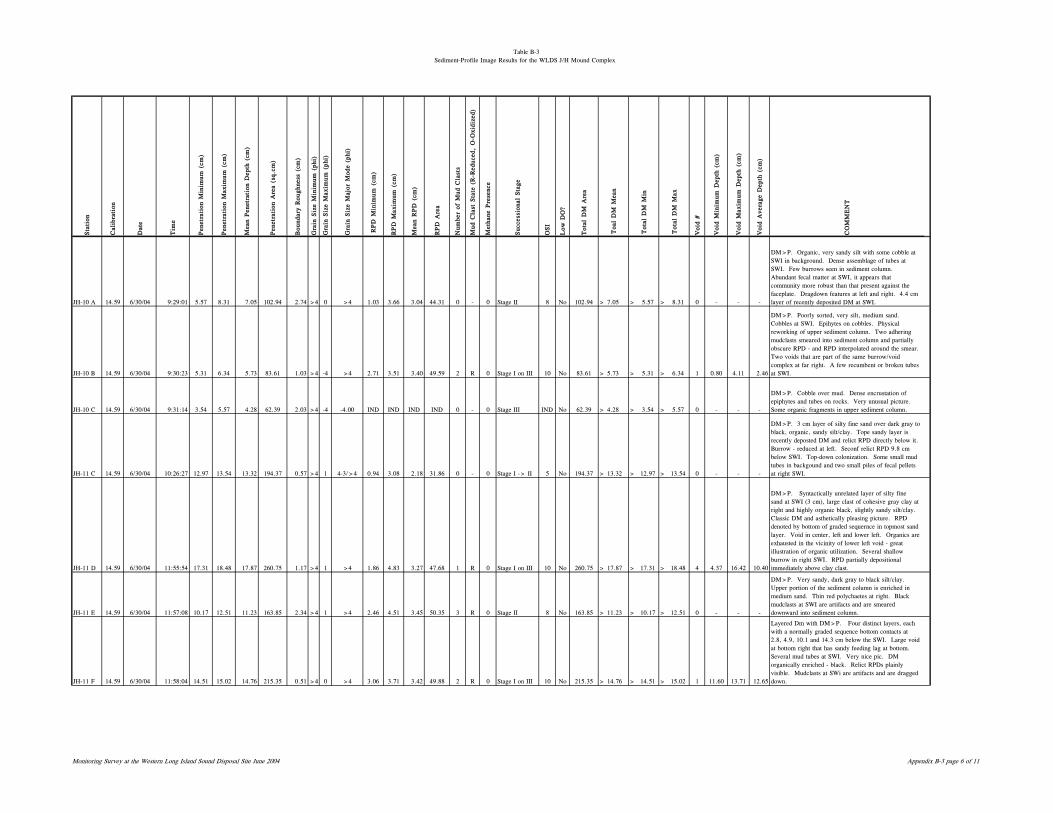
Table B-3Sediment-Profile Image Results for the WLDS J/H Mound Complex
Sta
tion
Cal
ibra
tion
Dat
e
Tim
e
Pen
etra
tion
Min
imum
(cm
)
Pen
etra
tion
Max
imum
(cm
)
Mea
n Pen
etra
tion
Dep
th (
cm)
Pen
etra
tion
Are
a (s
q.cm
)
Bou
ndar
y R
ough
ness
(cm
)
Gra
in S
ize
Min
imum
(ph
i)
Gra
in S
ize
Max
imum
(ph
i)
Gra
in S
ize
Maj
or M
ode
(phi
)
RPD
Min
imum
(cm
)
RPD
Max
imum
(cm
)
Mea
n R
PD
(cm
)
RPD
Are
a
Num
ber
of M
ud C
last
s
Mud
Cla
st S
tate
(R
-Red
uced
, O
-Oxi
dize
d)
Met
hane
Pre
senc
e
Suc
cess
iona
l Sta
ge
OSI
Low
DO
?
Tot
al D
M A
rea
Voi
d #
Voi
d M
inim
um D
epth
(cm
)
Voi
d M
axim
um D
epth
(cm
)
Voi
d A
vera
ge D
epth
(cm
)
CO
MM
EN
T
Tot
al D
M M
in
Tot
al D
M M
ax
Toa
l D
M M
ean
JH-10 A 14.59 6/30/04 9:29:01 5.57 8.31 7.05 102.94 2.74 >4 0 >4 1.03 3.66 3.04 44.31 0 - 0 Stage II 8 No 102.94 > 7.05 > 5.57 > 8.31 0 - - -
DM>P. Organic, very sandy silt with some cobble at SWI in background. Dense assemblage of tubes at SWI. Few burrows seen in sediment column. Abundant fecal matter at SWI, it appears that community more robust than that present against the faceplate. Dragdown features at left and right. 4.4 cm layer of recently deposited DM at SWI.
JH-10 B 14.59 6/30/04 9:30:23 5.31 6.34 5.73 83.61 1.03 >4 -4 >4 2.71 3.51 3.40 49.59 2 R 0 Stage I on III 10 No 83.61 > 5.73 > 5.31 > 6.34 1 0.80 4.11 2.46
DM>P. Poorly sorted, very silt, medium sand. Cobbles at SWI. Epihytes on cobbles. Physical reworking of upper sediment column. Two adhering mudclasts smeared into sediment column and partially obscure RPD - and RPD interpolated around the smear. Two voids that are part of the same burrow/void complex at far right. A few recumbent or broken tubes at SWI.
JH-10 C 14.59 6/30/04 9:31:14 3.54 5.57 4.28 62.39 2.03 >4 -4 -4.00 IND IND IND IND 0 - 0 Stage III IND No 62.39 > 4.28 > 3.54 > 5.57 0 - - -
DM>P. Cobble over mud. Dense encrustation of epiphytes and tubes on rocks. Very unusual picture. Some organic fragments in upper sediment column.
JH-11 C 14.59 6/30/04 10:26:27 12.97 13.54 13.32 194.37 0.57 >4 1 4-3/>4 0.94 3.08 2.18 31.86 0 - 0 Stage I -> II 5 No 194.37 > 13.32 > 12.97 > 13.54 0 - - -
DM>P. 3 cm layer of silty fine sand over dark gray to black, organic, sandy silt/clay. Tope sandy layer is recently deposted DM and relict RPD directly below it. Burrow - reduced at left. Seconf relict RPD 9.8 cm below SWI. Top-down colonization. Some small mud tubes in backgound and two small piles of fecal pellets at right SWI.
JH-11 D 14.59 6/30/04 11:55:54 17.31 18.48 17.87 260.75 1.17 >4 1 >4 1.86 4.83 3.27 47.68 1 R 0 Stage I on III 10 No 260.75 > 17.87 > 17.31 > 18.48 4 4.37 16.42 10.40
DM>P. Syntactically unrelated layer of silty fine sand at SWI (3 cm), large clast of cohesive gray clay at right and highly organic black, slightly sandy silt/clay. Classic DM and asthetically pleasing picture. RPD denoted by bottom of graded sequernce in topmost sand layer. Void in center, left and lower left. Organics are exhausted in the vicinity of lower left void - great illustration of organic utilization. Several shallow burrow in right SWI. RPD partially depositional immediately above clay clast.
JH-11 E 14.59 6/30/04 11:57:08 10.17 12.51 11.23 163.85 2.34 >4 1 >4 2.46 4.51 3.45 50.35 3 R 0 Stage II 8 No 163.85 > 11.23 > 10.17 > 12.51 0 - - -
DM>P. Very sandy, dark gray to black silt/clay. Upper portion of the sediment column is enriched in medium sand. Thin red polychaetes at right. Black mudclasts at SWI are artifacts and are smeared downward into sediment column.
JH-11 F 14.59 6/30/04 11:58:04 14.51 15.02 14.76 215.35 0.51 >4 0 >4 3.06 3.71 3.42 49.88 2 R 0 Stage I on III 10 No 215.35 > 14.76 > 14.51 > 15.02 1 11.60 13.71 12.65
Layered Dm with DM>P. Four distinct layers, each with a normally graded sequence bottom contacts at 2.8, 4.9, 10.1 and 14.3 cm below the SWI. Large void at bottom right that has sandy feeding lag at bottom. Several mud tubes at SWI. Very nice pic. DM organically enriched - black. Relict RPDs plainly visible. Mudclasts at SWi are artifacts and are dragged down.
Monitoring Survey at the Western Long Island Sound Disposal Site June 2004 Appendix B-3 page 6 of 11
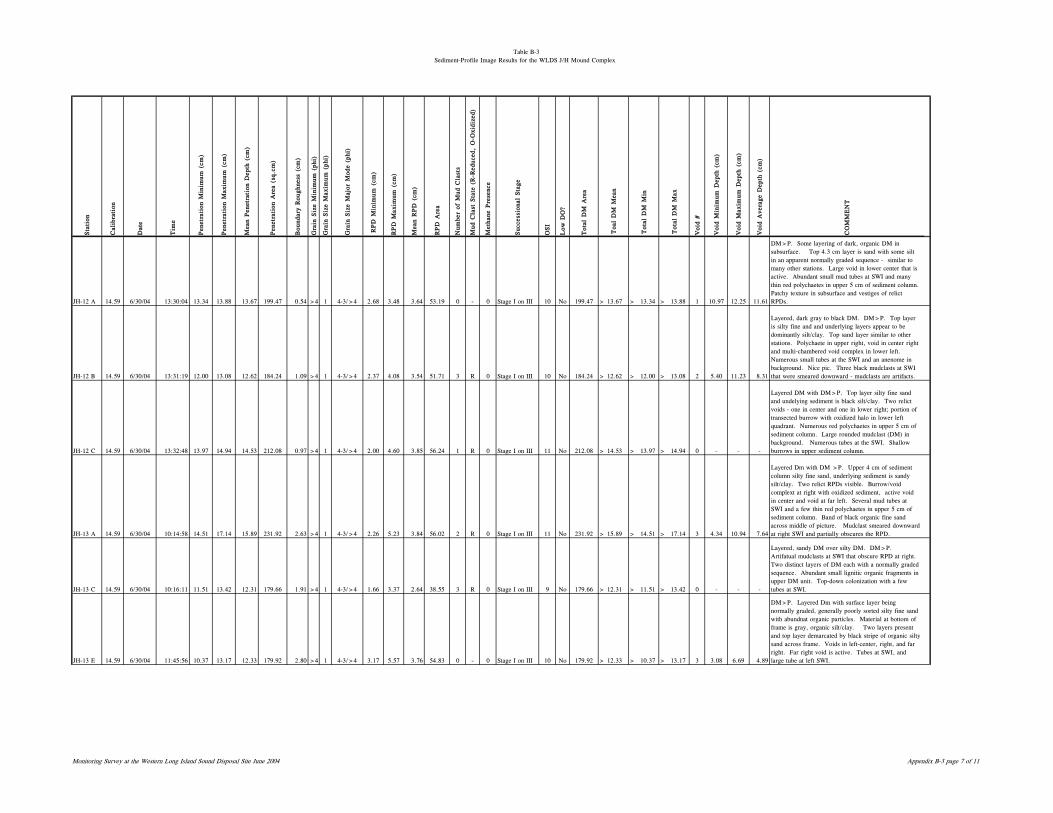
Table B-3Sediment-Profile Image Results for the WLDS J/H Mound Complex
Sta
tion
Cal
ibra
tion
Dat
e
Tim
e
Pen
etra
tion
Min
imum
(cm
)
Pen
etra
tion
Max
imum
(cm
)
Mea
n Pen
etra
tion
Dep
th (
cm)
Pen
etra
tion
Are
a (s
q.cm
)
Bou
ndar
y R
ough
ness
(cm
)
Gra
in S
ize
Min
imum
(ph
i)
Gra
in S
ize
Max
imum
(ph
i)
Gra
in S
ize
Maj
or M
ode
(phi
)
RPD
Min
imum
(cm
)
RPD
Max
imum
(cm
)
Mea
n R
PD
(cm
)
RPD
Are
a
Num
ber
of M
ud C
last
s
Mud
Cla
st S
tate
(R
-Red
uced
, O
-Oxi
dize
d)
Met
hane
Pre
senc
e
Suc
cess
iona
l Sta
ge
OSI
Low
DO
?
Tot
al D
M A
rea
Voi
d #
Voi
d M
inim
um D
epth
(cm
)
Voi
d M
axim
um D
epth
(cm
)
Voi
d A
vera
ge D
epth
(cm
)
CO
MM
EN
T
Tot
al D
M M
in
Tot
al D
M M
ax
Toa
l D
M M
ean
JH-12 A 14.59 6/30/04 13:30:04 13.34 13.88 13.67 199.47 0.54 >4 1 4-3/>4 2.68 3.48 3.64 53.19 0 - 0 Stage I on III 10 No 199.47 > 13.67 > 13.34 > 13.88 1 10.97 12.25 11.61
DM>P. Some layering of dark, organic DM in subsurface. Top 4.3 cm layer is sand with some silt in an apparent normally graded sequence - similar to many other stations. Large void in lower center that is active. Abundant small mud tubes at SWI and many thin red polychaetes in upper 5 cm of sediment column. Patchy texture in subsurface and vestiges of relict RPDs.
JH-12 B 14.59 6/30/04 13:31:19 12.00 13.08 12.62 184.24 1.09 >4 1 4-3/>4 2.37 4.08 3.54 51.71 3 R 0 Stage I on III 10 No 184.24 > 12.62 > 12.00 > 13.08 2 5.40 11.23 8.31
Layered, dark gray to black DM. DM>P. Top layer is silty fine and and underlying layers appear to be dominantly silt/clay. Top sand layer similar to other stations. Polychaete in upper right, void in center right and multi-chambered void complex in lower left. Numerous small tubes at the SWI and an anenome in background. Nice pic. Three black mudclasts at SWI that were smeared downward - mudclasts are artifacts.
JH-12 C 14.59 6/30/04 13:32:48 13.97 14.94 14.53 212.08 0.97 >4 1 4-3/>4 2.00 4.60 3.85 56.24 1 R 0 Stage I on III 11 No 212.08 > 14.53 > 13.97 > 14.94 0 - - -
Layered DM with DM>P. Top layer silty fine sand and undelying sediment is black silt/clay. Two relict voids - one in center and one in lower right; portion of transected burrow with oxidized halo in lower left quadrant. Numerous red polychaetes in upper 5 cm of sediment column. Large rounded mudclast (DM) in background. Numerous tubes at the SWI. Shallow burrows in upper sediment column.
JH-13 A 14.59 6/30/04 10:14:58 14.51 17.14 15.89 231.92 2.63 >4 1 4-3/>4 2.26 5.23 3.84 56.02 2 R 0 Stage I on III 11 No 231.92 > 15.89 > 14.51 > 17.14 3 4.34 10.94 7.64
Layered Dm with DM >P. Upper 4 cm of sediment column silty fine sand, underlying sediment is sandy silt/clay. Two relict RPDs visible. Burrow/void complext at right with oxidized sediment, active void in center and void at far left. Several mud tubes at SWI and a few thin red polychaetes in upper 5 cm of sediment column. Band of black organic fine sand across middle of picture. Mudclast smeared downward at right SWI and partially obscures the RPD.
JH-13 C 14.59 6/30/04 10:16:11 11.51 13.42 12.31 179.66 1.91 >4 1 4-3/>4 1.66 3.37 2.64 38.55 3 R 0 Stage I on III 9 No 179.66 > 12.31 > 11.51 > 13.42 0 - - -
Layered, sandy DM over silty DM. DM>P. Artifatual mudclasts at SWI that obscure RPD at right. Two distinct layers of DM each with a normally graded sequence. Abundant small lignitic organic fragments in upper DM unit. Top-down colonization with a few tubes at SWI.
JH-13 E 14.59 6/30/04 11:45:56 10.37 13.17 12.33 179.92 2.80 >4 1 4-3/>4 3.17 5.57 3.76 54.83 0 - 0 Stage I on III 10 No 179.92 > 12.33 > 10.37 > 13.17 3 3.08 6.69 4.89
DM>P. Layered Dm with surface layer being normally graded, generally poorly sorted silty fine sand with abundnat organic particles. Material at bottom of frame is gray, organic silt/clay. Two layers present and top layer demarcated by black stripe of organic silty sand across frame. Voids in left-center, right, and far right. Far right void is active. Tubes at SWI, and large tube at left SWI.
Monitoring Survey at the Western Long Island Sound Disposal Site June 2004 Appendix B-3 page 7 of 11
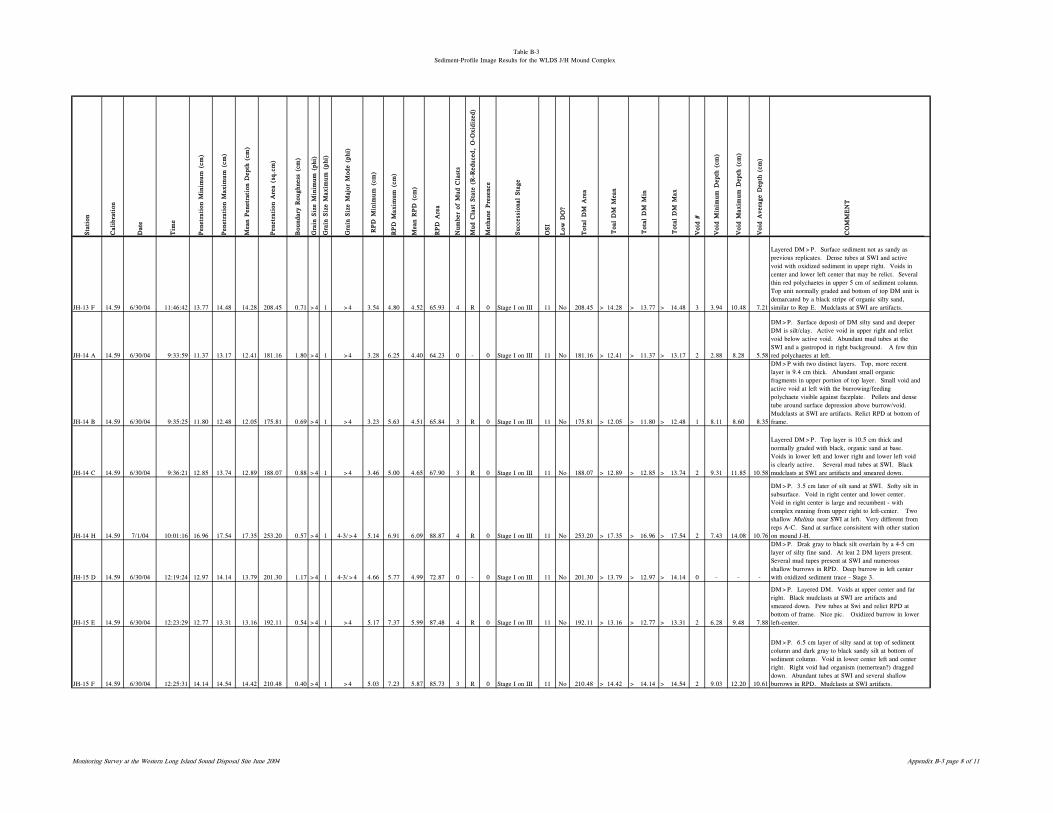
Table B-3Sediment-Profile Image Results for the WLDS J/H Mound Complex
Sta
tion
Cal
ibra
tion
Dat
e
Tim
e
Pen
etra
tion
Min
imum
(cm
)
Pen
etra
tion
Max
imum
(cm
)
Mea
n Pen
etra
tion
Dep
th (
cm)
Pen
etra
tion
Are
a (s
q.cm
)
Bou
ndar
y R
ough
ness
(cm
)
Gra
in S
ize
Min
imum
(ph
i)
Gra
in S
ize
Max
imum
(ph
i)
Gra
in S
ize
Maj
or M
ode
(phi
)
RPD
Min
imum
(cm
)
RPD
Max
imum
(cm
)
Mea
n R
PD
(cm
)
RPD
Are
a
Num
ber
of M
ud C
last
s
Mud
Cla
st S
tate
(R
-Red
uced
, O
-Oxi
dize
d)
Met
hane
Pre
senc
e
Suc
cess
iona
l Sta
ge
OSI
Low
DO
?
Tot
al D
M A
rea
Voi
d #
Voi
d M
inim
um D
epth
(cm
)
Voi
d M
axim
um D
epth
(cm
)
Voi
d A
vera
ge D
epth
(cm
)
CO
MM
EN
T
Tot
al D
M M
in
Tot
al D
M M
ax
Toa
l D
M M
ean
JH-13 F 14.59 6/30/04 11:46:42 13.77 14.48 14.28 208.45 0.71 >4 1 >4 3.54 4.80 4.52 65.93 4 R 0 Stage I on III 11 No 208.45 > 14.28 > 13.77 > 14.48 3 3.94 10.48 7.21
Layered DM>P. Surface sediment not as sandy as previous replicates. Dense tubes at SWI and active void with oxidized sediment in upepr right. Voids in center and lower left center that may be relict. Several thin red polychaetes in upper 5 cm of sediment column. Top unit normally graded and bottom of top DM unit is demarcated by a black stripe of organic silty sand, similar to Rep E. Mudclasts at SWI are artifacts.
JH-14 A 14.59 6/30/04 9:33:59 11.37 13.17 12.41 181.16 1.80 >4 1 >4 3.28 6.25 4.40 64.23 0 - 0 Stage I on III 11 No 181.16 > 12.41 > 11.37 > 13.17 2 2.88 8.28 5.58
DM>P. Surface deposit of DM silty sand and deeper DM is silt/clay. Active void in upper right and relict void below active void. Abundant mud tubes at the SWI and a gastropod in right background. A few thin red polychaetes at left.
JH-14 B 14.59 6/30/04 9:35:25 11.80 12.48 12.05 175.81 0.69 >4 1 >4 3.23 5.63 4.51 65.84 3 R 0 Stage I on III 11 No 175.81 > 12.05 > 11.80 > 12.48 1 8.11 8.60 8.35
DM>P with two distinct layers. Top, more recent layer is 9.4 cm thick. Abundant small organic fragments in upper portion of top layer. Small void and active void at left with the burrowing/feeding polychaete visible against faceplate. Pellets and dense tube around surface depression above burrow/void. Mudclasts at SWI are artifacts. Relict RPD at bottom of frame.
JH-14 C 14.59 6/30/04 9:36:21 12.85 13.74 12.89 188.07 0.88 >4 1 >4 3.46 5.00 4.65 67.90 3 R 0 Stage I on III 11 No 188.07 > 12.89 > 12.85 > 13.74 2 9.31 11.85 10.58
Layered DM>P. Top layer is 10.5 cm thick and normally graded with black, organic sand at base. Voids in lower left and lower right and lower left void is clearly active. Several mud tubes at SWI. Black mudclasts at SWI are artifacts and smeared down.
JH-14 H 14.59 7/1/04 10:01:16 16.96 17.54 17.35 253.20 0.57 >4 1 4-3/>4 5.14 6.91 6.09 88.87 4 R 0 Stage I on III 11 No 253.20 > 17.35 > 16.96 > 17.54 2 7.43 14.08 10.76
DM>P. 3.5 cm later of silt sand at SWI. Softy silt in subsurface. Void in right center and lower center. Void in right center is large and recumbent - with complex running from upper right to left-center. Two shallow Mulinia near SWI at left. Very different from reps A-C. Sand at surface consisitent with other station on mound J-H.
JH-15 D 14.59 6/30/04 12:19:24 12.97 14.14 13.79 201.30 1.17 >4 1 4-3/>4 4.66 5.77 4.99 72.87 0 - 0 Stage I on III 11 No 201.30 > 13.79 > 12.97 > 14.14 0 - - -
DM>P. Drak gray to black silt overlain by a 4-5 cm layer of silty fine sand. At leat 2 DM layers present. Several mud tupes present at SWI and numerous shallow burrows in RPD. Deep burrow in left center with oxidized sediment trace - Stage 3.
JH-15 E 14.59 6/30/04 12:23:29 12.77 13.31 13.16 192.11 0.54 >4 1 >4 5.17 7.37 5.99 87.48 4 R 0 Stage I on III 11 No 192.11 > 13.16 > 12.77 > 13.31 2 6.28 9.48 7.88
DM>P. Layered DM. Voids at upper center and far right. Black mudclasts at SWI are artifacts and smeared down. Few tubes at Swi and relict RPD at bottom of frame. Nice pic. Oxidized burrow in lower left-center.
JH-15 F 14.59 6/30/04 12:25:31 14.14 14.54 14.42 210.48 0.40 >4 1 >4 5.03 7.23 5.87 85.73 3 R 0 Stage I on III 11 No 210.48 > 14.42 > 14.14 > 14.54 2 9.03 12.20 10.61
DM>P. 6.5 cm layer of silty sand at top of sediment column and dark gray to black sandy silt at bottom of sediment column. Void in lower center left and center right. Right void had organism (nemertean?) dragged down. Abundant tubes at SWI and several shallow burrows in RPD. Mudclasts at SWI artifacts.
Monitoring Survey at the Western Long Island Sound Disposal Site June 2004 Appendix B-3 page 8 of 11

Table B-3Sediment-Profile Image Results for the WLDS J/H Mound Complex
Sta
tion
Cal
ibra
tion
Dat
e
Tim
e
Pen
etra
tion
Min
imum
(cm
)
Pen
etra
tion
Max
imum
(cm
)
Mea
n Pen
etra
tion
Dep
th (
cm)
Pen
etra
tion
Are
a (s
q.cm
)
Bou
ndar
y R
ough
ness
(cm
)
Gra
in S
ize
Min
imum
(ph
i)
Gra
in S
ize
Max
imum
(ph
i)
Gra
in S
ize
Maj
or M
ode
(phi
)
RPD
Min
imum
(cm
)
RPD
Max
imum
(cm
)
Mea
n R
PD
(cm
)
RPD
Are
a
Num
ber
of M
ud C
last
s
Mud
Cla
st S
tate
(R
-Red
uced
, O
-Oxi
dize
d)
Met
hane
Pre
senc
e
Suc
cess
iona
l Sta
ge
OSI
Low
DO
?
Tot
al D
M A
rea
Voi
d #
Voi
d M
inim
um D
epth
(cm
)
Voi
d M
axim
um D
epth
(cm
)
Voi
d A
vera
ge D
epth
(cm
)
CO
MM
EN
T
Tot
al D
M M
in
Tot
al D
M M
ax
Toa
l D
M M
ean
JH-15 G 14.59 7/1/04 10:00:26 16.37 16.76 16.42 239.57 0.40 >4 1 >4 5.65 7.60 6.14 89.64 0 - 0 Stage I on III 11 No 239.57 > 16.42 > 16.37 > 16.76 3 5.77 11.40 8.58
DM>P. 4 cm layer of silty fine sand -poorly sorted at SWI. Chaotic fabic in subsurface gray to black organic silt/clays. Three void in center of sediment column - top two appear active the lower appears relict. Numerous fine mud tubes at SWI and anenome in background at left. Two bivlaves near SWI at left and two types of polychaetes against faceplate in center and left. Nice pic.
JH-16 A 14.59 6/30/04 9:16:59 7.65 8.97 8.46 123.49 1.31 >4 0 2-1/>4 3.23 4.89 4.32 63.09 0 - 0 Stage I on III 11 No 123.49 > 8.46 > 7.65 > 8.97 0 - - -
DM>P. Coarse sand (poorly sorted) over gray silt/clay. Shells and epiphytes at SWI. Several tubes at SWI and tube dragged down. Surface disturbance from dragdown.
JH-16 B 14.59 6/30/04 9:17:41 9.22 9.94 9.60 140.13 0.71 >4 0 4-3/>4 3.26 5.20 4.10 59.78 2 R 0 Stage I on III 11 No 140.13 > 9.60 > 9.22 > 9.94 2 6.60 9.08 7.84
DM>P. Medium to coarse sand over gray silt. Two large artifacts mudclasts smeared downward, the one at right obscuring the RPD and RPD interporlated. Two void at right, both active. Relict RPD at bottom of frame. Numerous tubes at the SWI.
JH-16 C 14.59 6/30/04 9:18:26 9.05 10.40 9.86 143.92 1.34 >4 0 >4 3.26 4.14 3.68 53.73 2 R 0 Stage I on III 10 No 143.92 > 9.86 > 9.05 > 10.40 1 9.05 9.31 9.18
DM>P with a 5.5 cm layer of more recently deposited DM. Top DM is sandy and bottom contact is a stripe of black, organic reduced sediment. Relict RPD 5.5 cm below SWI. Small void in lower center immediately under pellet-filled biological depression at SWI. Numerosu tubes at the SWI. Mudclats smeared downward at left and right SWI. Thin red worm at right.
JH-16 D 14.59 7/1/04 13:37:47 9.48 10.34 9.99 145.84 0.86 >4 -3 -2/2-1/>4 0.62 3.71 1.17 IND 0 - 0 Stage I on III 7 No 145.84 > 9.99 > 9.48 > 10.34 1 7.51 8.54 8.03
DM>P. Cobble over sand over gray clay. Void in lower left corner. Epithytes on cobbles at SWI and some tubes at SWI. Surface disturbed from sampling and RPD determined by linear measurement in undisturbed portions. Generally similar to other reps but cobbles at SWI are new.
JH-17 A 14.59 6/30/04 8:08:13 18.16 18.85 18.65 272.16 0.69 >4 1 >4 4.00 5.40 5.19 75.80 0 - 0 Stage I on III 11 No 272.16 > 18.65 > 18.16 > 18.85 2 10 15 12.41
DM>P. 5 cm layer of poorly sorted medium sand over silt. Stacked RPDs. Lower sediment is highly organic silty/clay DM. Voids mid right and lower mid-left. Numerous tubes at SWI. Gastropod at left. Nice pic.
JH-17 B 14.59 6/30/04 8:08:56 18.39 18.99 18.73 273.36 0.60 >4 1 >4 3.83 5.03 4.68 68.30 3 R 0 Stage I on III 11 No 273.36 > 18.73 > 18.39 > 18.99 1 10.31 15.71 13.01
DM>P. 5 cm layer of poorly sorted silty medium sand over organic, soft, dark gray to black silt/clay. Void in left center and lower center of frame. Large polychaete smeared out below lower void. Numerous tunes at left at the SWI and a few bivalves in the RPD. Large mudclasts in the background are artifacts. Very similar to Rep A.
JH-17 C 14.59 6/30/04 8:09:41 17.39 18.05 17.71 258.43 0.66 >4 1 >4 4.23 6.17 5.81 84.77 4 R 0 Stage I on III 11 No 258.43 > 17.71 > 17.39 > 18.05 2 5.91 14.23 10.07
Layered DM. DM>P. 5 cm layer of medium sand over gray to balck silt/clays. Sand layers at SWI ubiquitous. Layereing is well preserved. Large void at right and void complex in lower right. Numerous tubes at SWI and substantial number of Mulinia below the SWI. Mudclasts at SWI are artifacts. DM intervals are 5 cm, 14.5 cm and >P.
Monitoring Survey at the Western Long Island Sound Disposal Site June 2004 Appendix B-3 page 9 of 11
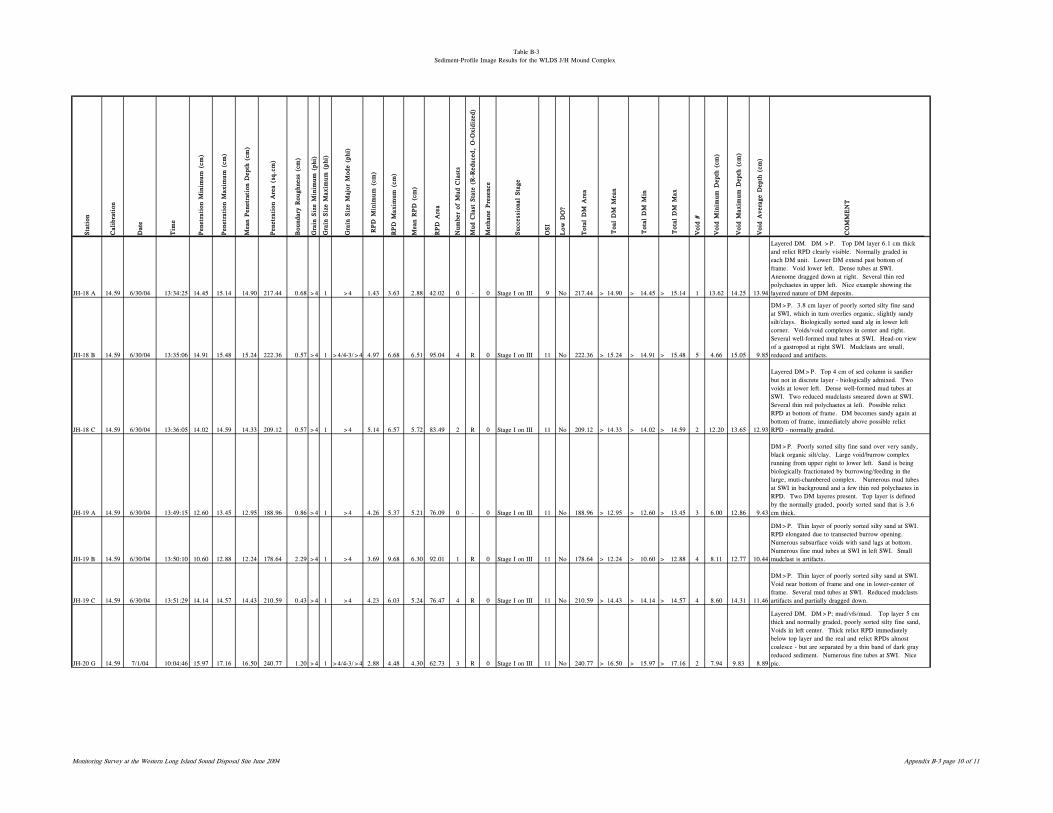
Table B-3Sediment-Profile Image Results for the WLDS J/H Mound Complex
Sta
tion
Cal
ibra
tion
Dat
e
Tim
e
Pen
etra
tion
Min
imum
(cm
)
Pen
etra
tion
Max
imum
(cm
)
Mea
n Pen
etra
tion
Dep
th (
cm)
Pen
etra
tion
Are
a (s
q.cm
)
Bou
ndar
y R
ough
ness
(cm
)
Gra
in S
ize
Min
imum
(ph
i)
Gra
in S
ize
Max
imum
(ph
i)
Gra
in S
ize
Maj
or M
ode
(phi
)
RPD
Min
imum
(cm
)
RPD
Max
imum
(cm
)
Mea
n R
PD
(cm
)
RPD
Are
a
Num
ber
of M
ud C
last
s
Mud
Cla
st S
tate
(R
-Red
uced
, O
-Oxi
dize
d)
Met
hane
Pre
senc
e
Suc
cess
iona
l Sta
ge
OSI
Low
DO
?
Tot
al D
M A
rea
Voi
d #
Voi
d M
inim
um D
epth
(cm
)
Voi
d M
axim
um D
epth
(cm
)
Voi
d A
vera
ge D
epth
(cm
)
CO
MM
EN
T
Tot
al D
M M
in
Tot
al D
M M
ax
Toa
l D
M M
ean
JH-18 A 14.59 6/30/04 13:34:25 14.45 15.14 14.90 217.44 0.68 >4 1 >4 1.43 3.63 2.88 42.02 0 - 0 Stage I on III 9 No 217.44 > 14.90 > 14.45 > 15.14 1 13.62 14.25 13.94
Layered DM. DM >P. Top DM layer 6.1 cm thick and relict RPD clearly visible. Normally graded in each DM unit. Lower DM extend past bottom of frame. Void lower left. Dense tubes at SWI. Anenome dragged down at right. Several thin red polychaetes in upper left. Nice example showing the layered nature of DM deposits.
JH-18 B 14.59 6/30/04 13:35:06 14.91 15.48 15.24 222.36 0.57 >4 1 >4/4-3/>4 4.97 6.68 6.51 95.04 4 R 0 Stage I on III 11 No 222.36 > 15.24 > 14.91 > 15.48 5 4.66 15.05 9.85
DM>P. 3.8 cm layer of poorly sorted silty fine sand at SWI, which in turn overlies organic, slightly sandy silt/clays. Biologically sorted sand alg in lower left corner. Voids/void complexes in center and right. Several well-formed mud tubes at SWI. Head-on view of a gastropod at right SWI. Mudclasts are small, reduced and artifacts.
JH-18 C 14.59 6/30/04 13:36:05 14.02 14.59 14.33 209.12 0.57 >4 1 >4 5.14 6.57 5.72 83.49 2 R 0 Stage I on III 11 No 209.12 > 14.33 > 14.02 > 14.59 2 12.20 13.65 12.93
Layered DM>P. Top 4 cm of sed column is sandier but not in discrete layer - biologically admixed. Two voids at lower left. Dense well-formed mud tubes at SWI. Two reduced mudclasts smeared down at SWI. Several thin red polychaetes at left. Possible relict RPD at bottom of frame. DM becomes sandy again at bottom of frame, immediately above possible relict RPD - normally graded.
JH-19 A 14.59 6/30/04 13:49:15 12.60 13.45 12.95 188.96 0.86 >4 1 >4 4.26 5.37 5.21 76.09 0 - 0 Stage I on III 11 No 188.96 > 12.95 > 12.60 > 13.45 3 6.00 12.86 9.43
DM>P. Poorly sorted silty fine sand over very sandy, black organic silt/clay. Large void/burrow complex running from upper right to lower left. Sand is being biologically fractionated by burrowing/feeding in the large, muti-chambered complex. Numerous mud tubes at SWI in background and a few thin red polychaetes in RPD. Two DM layeres present. Top layer is defined by the normally graded, poorly sorted sand that is 3.6 cm thick.
JH-19 B 14.59 6/30/04 13:50:10 10.60 12.88 12.24 178.64 2.29 >4 1 >4 3.69 9.68 6.30 92.01 1 R 0 Stage I on III 11 No 178.64 > 12.24 > 10.60 > 12.88 4 8.11 12.77 10.44
DM>P. Thin layer of poorly sorted silty sand at SWI. RPD elongated due to transected burrow opening. Numerous subsurface voids with sand lags at bottom. Numerous fine mud tubes at SWI in left SWI. Small mudclast is artifacts.
JH-19 C 14.59 6/30/04 13:51:29 14.14 14.57 14.43 210.59 0.43 >4 1 >4 4.23 6.03 5.24 76.47 4 R 0 Stage I on III 11 No 210.59 > 14.43 > 14.14 > 14.57 4 8.60 14.31 11.46
DM>P. Thin layer of poorly sorted silty sand at SWI. Void near bottom of frame and one in lower-center of frame. Several mud tubes at SWI. Reduced mudclasts artifacts and partially dragged down.
JH-20 G 14.59 7/1/04 10:04:46 15.97 17.16 16.50 240.77 1.20 >4 1 >4/4-3/>4 2.88 4.48 4.30 62.73 3 R 0 Stage I on III 11 No 240.77 > 16.50 > 15.97 > 17.16 2 7.94 9.83 8.89
Layered DM. DM>P; mud/vfs/mud. Top layer 5 cm thick and normally graded, poorly sorted silty fine sand, Voids in left center. Thick relict RPD immediately below top layer and the real and relict RPDs almost coalesce - but are separated by a thin band of dark gray reduced sediment. Numerous fine tubes at SWI. Nice pic.
Monitoring Survey at the Western Long Island Sound Disposal Site June 2004 Appendix B-3 page 10 of 11
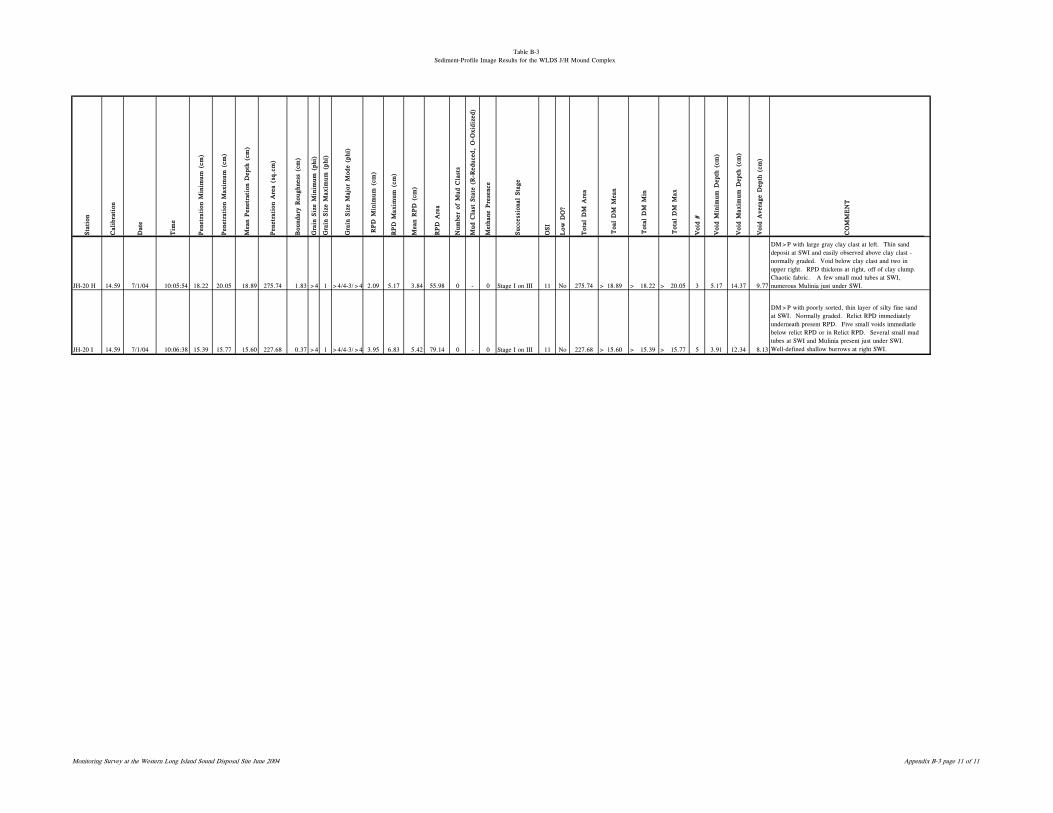
Table B-3Sediment-Profile Image Results for the WLDS J/H Mound Complex
Sta
tion
Cal
ibra
tion
Dat
e
Tim
e
Pen
etra
tion
Min
imum
(cm
)
Pen
etra
tion
Max
imum
(cm
)
Mea
n Pen
etra
tion
Dep
th (
cm)
Pen
etra
tion
Are
a (s
q.cm
)
Bou
ndar
y R
ough
ness
(cm
)
Gra
in S
ize
Min
imum
(ph
i)
Gra
in S
ize
Max
imum
(ph
i)
Gra
in S
ize
Maj
or M
ode
(phi
)
RPD
Min
imum
(cm
)
RPD
Max
imum
(cm
)
Mea
n R
PD
(cm
)
RPD
Are
a
Num
ber
of M
ud C
last
s
Mud
Cla
st S
tate
(R
-Red
uced
, O
-Oxi
dize
d)
Met
hane
Pre
senc
e
Suc
cess
iona
l Sta
ge
OSI
Low
DO
?
Tot
al D
M A
rea
Voi
d #
Voi
d M
inim
um D
epth
(cm
)
Voi
d M
axim
um D
epth
(cm
)
Voi
d A
vera
ge D
epth
(cm
)
CO
MM
EN
T
Tot
al D
M M
in
Tot
al D
M M
ax
Toa
l D
M M
ean
JH-20 H 14.59 7/1/04 10:05:54 18.22 20.05 18.89 275.74 1.83 >4 1 >4/4-3/>4 2.09 5.17 3.84 55.98 0 - 0 Stage I on III 11 No 275.74 > 18.89 > 18.22 > 20.05 3 5.17 14.37 9.77
DM>P with large gray clay clast at left. Thin sand deposit at SWI and easily observed above clay clast - normally graded. Void below clay clast and two in upper right. RPD thickens at right, off of clay clump. Chaotic fabric. A few small mud tubes at SWI, numerous Mulinia just under SWI.
JH-20 I 14.59 7/1/04 10:06:38 15.39 15.77 15.60 227.68 0.37 >4 1 >4/4-3/>4 3.95 6.83 5.42 79.14 0 - 0 Stage I on III 11 No 227.68 > 15.60 > 15.39 > 15.77 5 3.91 12.34 8.13
DM>P with poorly sorted, thin layer of silty fine sand at SWI. Normally graded. Relict RPD immediately underneath present RPD. Five small voids immediatle below relict RPD or in Relict RPD. Several small mud tubes at SWI and Mulinia present just under SWI. Well-defined shallow burrows at right SWI.
Monitoring Survey at the Western Long Island Sound Disposal Site June 2004 Appendix B-3 page 11 of 11

Table B-4Sediment-Profile Image Results for Mound K at WLDS
Sta
tion
Cal
ibra
tion
Dat
e
Tim
e
Pen
etra
tion
Min
imum
(cm
)
Pen
etra
tion
Max
imum
(cm
)
Mea
n Pen
etra
tion
Dep
th (
cm)
Pen
etra
tion
Are
a (s
q.cm
)
Bou
ndar
y R
ough
ness
(cm
)
Gra
in S
ize
Min
imum
(ph
i)
Gra
in S
ize
Max
imum
(ph
i)
Gra
in S
ize
Maj
or M
ode
(phi
)
RPD
Min
imum
(cm
)
RPD
Max
imum
(cm
)
Mea
n R
PD
(cm
)
RPD
Are
a
Num
ber
of M
ud C
last
s
Mud
Cla
st S
tate
(R
-Red
uced
, O
-Oxi
dize
d)
Met
hane
Pre
senc
e
Suc
cess
iona
l Sta
ge
OSI
Low
DO
?
Tot
al D
M A
rea
Voi
d #
Voi
d M
inim
um D
epth
(cm
)
Voi
d M
axim
um D
epth
(cm
)
Voi
d A
vera
ge D
epth
(cm
)
Com
men
t
K-01 A 14.59 06/30/04 14:41:20 13.82 14.74 14.26 208.05 0.91 >4 1 >4 1.49 4.55 3.26 47.53 0 - 0 Stage I on III 10 No 208.05 > 14.26 > 13.82 > 14.74 3 11.40 13.28 12.34
DM>P. Dark gray organic sandy silt/clay with tan RPD. Voids at bottom of frame. Numerous tubes at SWI. Sediment at SWI slightly sandier than subsurface sediment. A few thin red polychaetes in RPD. Patch of oxidized sediment in lower left. Sand lag in voids at left corner. Appears to be older DM.
K-01 B 14.59 06/30/04 14:42:16 14.79 15.37 15.14 221.00 0.57 >4 1 >4 3.54 5.60 4.17 60.81 3 R 0 Stage I on III 11 No 221.00 > 15.14 > 14.79 > 15.37 1 10.45 12.94 11.70
DM>P. Surface sediment is slightly sandier and sediment at bottom of frame is black and highly reduced. Dense tubes at SWI and oxidized void at lower right. Anenome in background. A few blackish worms at left. Appear to be older DM.
K-01 C 14.59 06/30/04 14:43:04 14.45 15.62 15.24 222.46 1.17 >4 1 >4 3.80 6.40 5.00 72.92 3 R 0 Stage I on III 11 No 222.46 > 15.24 > 14.45 > 15.62 3 11.17 12.54 11.85
DM>P. Dark gray to black very sandy silt/clay with tan RPD. Voids with sand lag in lower left and lower center. Some oxidized sediment around void. A few small organisms and a few shallow burrows in RPD.
K-02 A 14.59 06/30/04 13:57:52 16.08 16.39 16.31 238.04 0.31 >4 1 >4 3.43 4.43 4.19 61.12 2 R 0 Stage I on III 11 No 238.04 > 16.31 > 16.08 > 16.39 3 7.28 10.14 8.71
DM>P. Dark gray to black slightly sandy silt/clay with tan RPD. Upper 3 cm enriched in sand relative to bulk of subsurface sediment. Large void complex running across middle of frame. Several fine mud tubes at the SWI and a few thin red polychaetes in the RPD. Two reduced mudclasts dragged down into RPD at center and right.
K-02 B 14.59 06/30/04 14:00:03 15.48 15.62 15.62 228.01 0.14 >4 1 4-3/>4 3.54 4.54 4.09 59.71 1 R 0 Stage I on III 11 No 228.01 > 15.62 > 15.48 > 15.62 1 14.57 15.28 14.92
Layered DM>P. Three distict layers visible. Top layer poorly sored silt fine sand and 3.cm thick, second layer normally graded very sandy silt and 7.5 cm thick with relict RPD immediately underneath present RPD, and bottom layer extends beyond bottom of frame. Exceptional pic. Small void, possibly relict, in bottom left corner. Dense tube and a few bivalves at SWI.
K-02 C 14.59 06/30/04 14:01:06 15.11 16.02 15.56 227.13 0.91 >4 1 >4 3.88 5.68 4.63 67.54 5 R 0 Stage I on III 11 No 227.13 > 15.56 > 15.11 > 16.02 1 6.80 7.14 6.97
DM>P. Large strings of mud/mudclasts at SWI and are dragged down. RPD interpolated around/through smears. Distinct layer of black reduced sediment across middle of frame. Layered DM. Oxidized void at very far right. SWI disturbed from mudclasts. Several fine mud tubes at SWI background.
K-03 A 14.59 06/30/04 14:48:03 13.85 14.25 14.14 206.37 0.40 >4 1 >4 5.40 6.68 5.71 83.29 0 - 0 Stage I on III 11 No 191.10 13.09 10.62 14.11 1 5.11 5.66 5.38
Gray to tan slightly sandy silt/clay. Appears to be old DM to depth at left and relict RPD at bottom right. Subsurface texture is relatively homogeneous as if deposited at once. Void at far left. Deep RPD and slightly sandier at SWI. Dense tubes at SWI and anenome in background. Top-down colonization in progress to 3.
K-03 B 14.59 06/30/04 14:48:45 13.77 14.42 14.19 207.12 0.66 >4 1 >4 5.00 6.77 6.03 88.04 4 R 0 Stage I on III 11 No 207.12 > 14.19 > 13.77 > 14.42 2 3.20 10.54 6.87
Medium gray slightly sandy silt/clay. Old DM. Homogenous texture in subsurface. Very faint layer 9.9 cm below the SWI. Void in upper center and lower right. Numerous tubes at the SWI. Long string of reduced mudclasts that are artifacts from sampling. Subsurface texture suggests old DM.
K-03 C 14.59 06/30/04 14:49:58 13.65 15.77 14.97 218.50 2.11 >4 1 >4 1.66 5.06 3.24 47.23 1 R 0 Stage I on III 10 No 218.50 > 14.97 > 13.65 > 15.77 5 3.03 14.20 8.61
Old, reworked DM. Light to medium gray slightly sandy silt. Biogenic depression at left with void/burrow complex to depth. Void in upper right and lower right. Mudclast artifact smeared at right SWI. Dense tubes at SWI.
K-04 A 14.59 06/30/04 14:05:41 12.71 13.22 13.08 190.84 0.51 >4 1 >4 4.66 6.08 5.02 73.23 1 R 0 Stage I on III 11 No 190.84 > 13.08 > 12.71 > 13.22 1 3.71 4.74 4.23
Layered DM >P. 7.5. Cm of new DM which had dark brown to black organic silt at the bottom. Relict RPD below. Void upper left. Numerous tubes at the SWI. Two poluychaetes at upper left and a sand-filled relict void at far left. Nice DM layer.
Tot
al D
M M
in
Tot
al D
M M
ax
Toa
l D
M M
ean
Monitoring Survey at the Western Long Island Sound Disposal Site June 2004 Appendix B-4 page 1 of 4
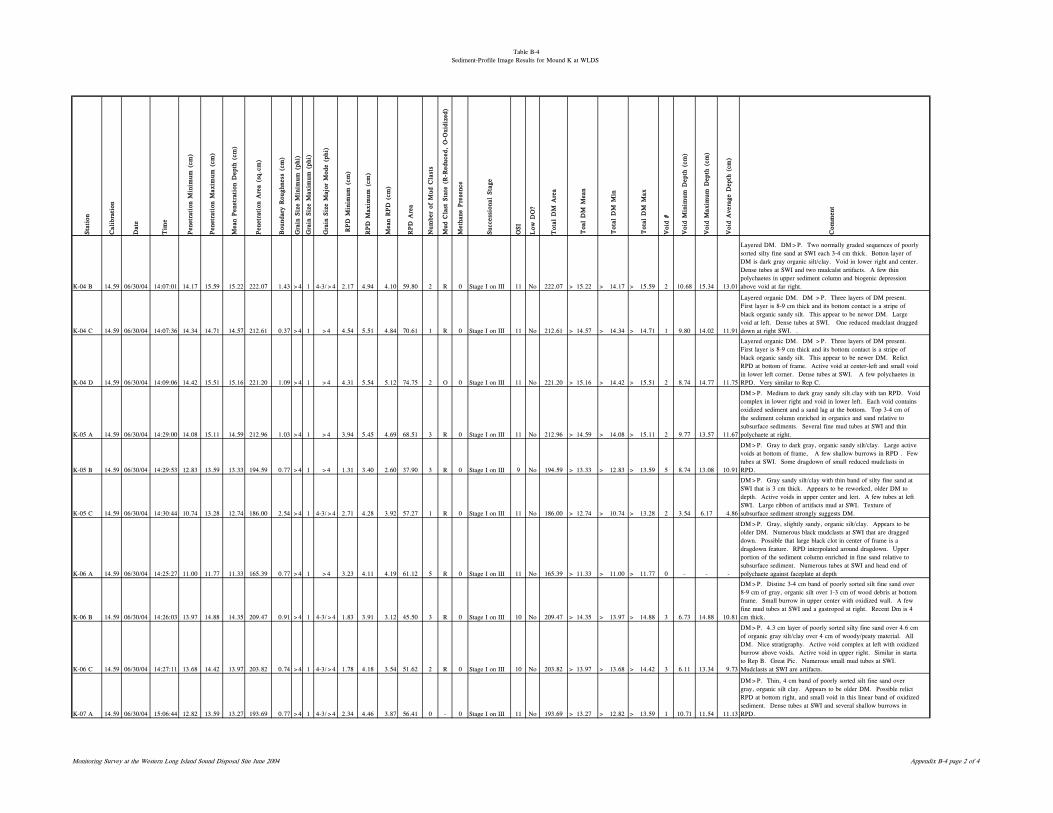
Table B-4Sediment-Profile Image Results for Mound K at WLDS
Sta
tion
Cal
ibra
tion
Dat
e
Tim
e
Pen
etra
tion
Min
imum
(cm
)
Pen
etra
tion
Max
imum
(cm
)
Mea
n Pen
etra
tion
Dep
th (
cm)
Pen
etra
tion
Are
a (s
q.cm
)
Bou
ndar
y R
ough
ness
(cm
)
Gra
in S
ize
Min
imum
(ph
i)
Gra
in S
ize
Max
imum
(ph
i)
Gra
in S
ize
Maj
or M
ode
(phi
)
RPD
Min
imum
(cm
)
RPD
Max
imum
(cm
)
Mea
n R
PD
(cm
)
RPD
Are
a
Num
ber
of M
ud C
last
s
Mud
Cla
st S
tate
(R
-Red
uced
, O
-Oxi
dize
d)
Met
hane
Pre
senc
e
Suc
cess
iona
l Sta
ge
OSI
Low
DO
?
Tot
al D
M A
rea
Voi
d #
Voi
d M
inim
um D
epth
(cm
)
Voi
d M
axim
um D
epth
(cm
)
Voi
d A
vera
ge D
epth
(cm
)
Com
men
t
Tot
al D
M M
in
Tot
al D
M M
ax
Toa
l D
M M
ean
K-04 B 14.59 06/30/04 14:07:01 14.17 15.59 15.22 222.07 1.43 >4 1 4-3/>4 2.17 4.94 4.10 59.80 2 R 0 Stage I on III 11 No 222.07 > 15.22 > 14.17 > 15.59 2 10.68 15.34 13.01
Layered DM. DM>P. Two normally graded sequences of poorly sorted silty fine sand at SWI each 3-4 cm thick. Botton layer of DM is dark gray organic silt/clay. Void in lower right and center. Dense tubes at SWI and two mudcalst artifacts. A few thin polychaetes in upper sediment column and biogenic depression above void at far right.
K-04 C 14.59 06/30/04 14:07:36 14.34 14.71 14.57 212.61 0.37 >4 1 >4 4.54 5.51 4.84 70.61 1 R 0 Stage I on III 11 No 212.61 > 14.57 > 14.34 > 14.71 1 9.80 14.02 11.91
Layered organic DM. DM >P. Three layers of DM present. First layer is 8-9 cm thick and its bottom contact is a stripe of black organic sandy silt. This appear to be newer DM. Large void at left. Dense tubes at SWI. One reduced mudclast dragged down at right SWI. .
K-04 D 14.59 06/30/04 14:09:06 14.42 15.51 15.16 221.20 1.09 >4 1 >4 4.31 5.54 5.12 74.75 2 O 0 Stage I on III 11 No 221.20 > 15.16 > 14.42 > 15.51 2 8.74 14.77 11.75
Layered organic DM. DM >P. Three layers of DM present. First layer is 8-9 cm thick and its bottom contact is a stripe of black organic sandy silt. This appear to be newer DM. Relict RPD at bottom of frame. Active void at center-left and small void in lower left corner. Dense tubes at SWI. A few polychaetes in RPD. Very similar to Rep C.
K-05 A 14.59 06/30/04 14:29:00 14.08 15.11 14.59 212.96 1.03 >4 1 >4 3.94 5.45 4.69 68.51 3 R 0 Stage I on III 11 No 212.96 > 14.59 > 14.08 > 15.11 2 9.77 13.57 11.67
DM>P. Medium to dark gray sandy silt.clay with tan RPD. Void complex in lower right and void in lower left. Each void contains oxidized sediment and a sand lag at the bottom. Top 3-4 cm of the sediment column enriched in organics and sand relative to subsurface sediments. Several fine mud tubes at SWI and thin polychaete at right.
K-05 B 14.59 06/30/04 14:29:53 12.83 13.59 13.33 194.59 0.77 >4 1 >4 1.31 3.40 2.60 37.90 3 R 0 Stage I on III 9 No 194.59 > 13.33 > 12.83 > 13.59 5 8.74 13.08 10.91
DM>P. Gray to dark gray, organic sandy silt/clay. Large active voids at bottom of frame, A few shallow burrows in RPD . Few tubes at SWI. Some dragdown of small reduced mudclasts in RPD.
K-05 C 14.59 06/30/04 14:30:44 10.74 13.28 12.74 186.00 2.54 >4 1 4-3/>4 2.71 4.28 3.92 57.27 1 R 0 Stage I on III 11 No 186.00 > 12.74 > 10.74 > 13.28 2 3.54 6.17 4.86
DM>P. Gray sandy silt/clay with thin band of silty fine sand at SWI that is 3 cm thick. Appears to be reworked, older DM to depth. Active voids in upper center and lert. A few tubes at left SWI. Large ribbon of artifacts mud at SWI. Texture of subsurface sediment strongly suggests DM.
K-06 A 14.59 06/30/04 14:25:27 11.00 11.77 11.33 165.39 0.77 >4 1 >4 3.23 4.11 4.19 61.12 5 R 0 Stage I on III 11 No 165.39 > 11.33 > 11.00 > 11.77 0 - - -
DM>P. Gray, slightly sandy, organic silt/clay. Appears to be older DM. Numerous black mudclasts at SWI that are dragged down. Possible that large black clot in center of frame is a dragdown feature. RPD interpolated around dragdown. Upper portion of the sediment column enriched in fine sand relative to subsurface sediment. Numerous tubes at SWI and head end of polychaete against faceplate at depth
K-06 B 14.59 06/30/04 14:26:03 13.97 14.88 14.35 209.47 0.91 >4 1 4-3/>4 1.83 3.91 3.12 45.50 3 R 0 Stage I on III 10 No 209.47 > 14.35 > 13.97 > 14.88 3 6.73 14.88 10.81
DM>P. Distinc 3-4 cm band of poorly sorted silt fine sand over 8-9 cm of gray, organic silt over 1-3 cm of wood debris at bottom frame. Small burrow in upper center with oxidized wall. A few fine mud tubes at SWI and a gastropod at right. Recent Dm is 4 cm thick.
K-06 C 14.59 06/30/04 14:27:11 13.68 14.42 13.97 203.82 0.74 >4 1 4-3/>4 1.78 4.18 3.54 51.62 2 R 0 Stage I on III 10 No 203.82 > 13.97 > 13.68 > 14.42 3 6.11 13.34 9.73
DM>P. 4.3 cm layer of poorly sorted silty fine sand over 4.6 cm of organic gray silt/clay over 4 cm of woody/peaty material. All DM. Nice stratigraphy. Active void complex at left with oxidized burrow above voids. Active void in upper right. Similar in starta to Rep B. Great Pic. Numerous small mud tubes at SWI. Mudclasts at SWI are artifacts.
K-07 A 14.59 06/30/04 15:06:44 12.82 13.59 13.27 193.69 0.77 >4 1 4-3/>4 2.34 4.46 3.87 56.41 0 - 0 Stage I on III 11 No 193.69 > 13.27 > 12.82 > 13.59 1 10.71 11.54 11.13
DM>P. Thin, 4 cm band of poorly sorted silt fine sand over gray, organic silt clay. Appears to be older DM. Possible relict RPD at bottom right, and small void in this linear band of oxidized sediment. Dense tubes at SWI and several shallow burrows in RPD.
Monitoring Survey at the Western Long Island Sound Disposal Site June 2004 Appendix B-4 page 2 of 4
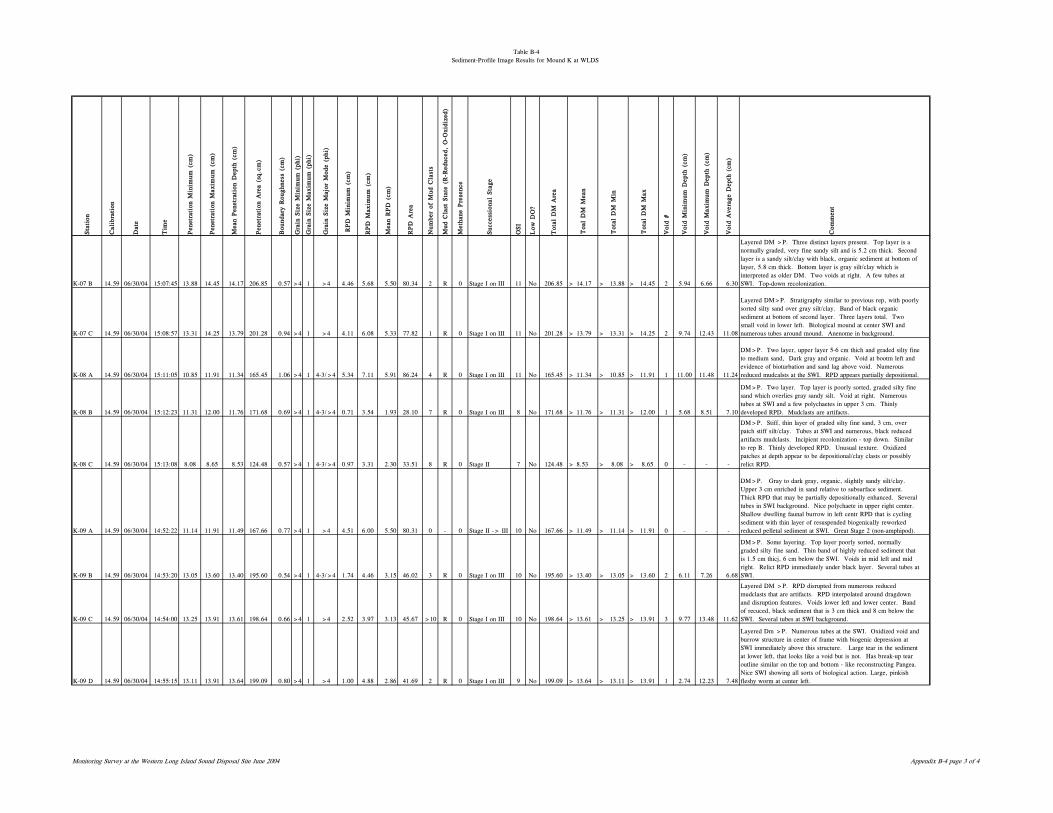
Table B-4Sediment-Profile Image Results for Mound K at WLDS
Sta
tion
Cal
ibra
tion
Dat
e
Tim
e
Pen
etra
tion
Min
imum
(cm
)
Pen
etra
tion
Max
imum
(cm
)
Mea
n Pen
etra
tion
Dep
th (
cm)
Pen
etra
tion
Are
a (s
q.cm
)
Bou
ndar
y R
ough
ness
(cm
)
Gra
in S
ize
Min
imum
(ph
i)
Gra
in S
ize
Max
imum
(ph
i)
Gra
in S
ize
Maj
or M
ode
(phi
)
RPD
Min
imum
(cm
)
RPD
Max
imum
(cm
)
Mea
n R
PD
(cm
)
RPD
Are
a
Num
ber
of M
ud C
last
s
Mud
Cla
st S
tate
(R
-Red
uced
, O
-Oxi
dize
d)
Met
hane
Pre
senc
e
Suc
cess
iona
l Sta
ge
OSI
Low
DO
?
Tot
al D
M A
rea
Voi
d #
Voi
d M
inim
um D
epth
(cm
)
Voi
d M
axim
um D
epth
(cm
)
Voi
d A
vera
ge D
epth
(cm
)
Com
men
t
Tot
al D
M M
in
Tot
al D
M M
ax
Toa
l D
M M
ean
K-07 B 14.59 06/30/04 15:07:45 13.88 14.45 14.17 206.85 0.57 >4 1 >4 4.46 5.68 5.50 80.34 2 R 0 Stage I on III 11 No 206.85 > 14.17 > 13.88 > 14.45 2 5.94 6.66 6.30
Layered DM >P. Three distinct layers present. Top layer is a normally graded, very fine sandy silt and is 5.2 cm thick. Second layer is a sandy silt/clay with black, organic sediment at bottom of layer, 5.8 cm thick. Bottom layer is gray silt/clay which is interpreted as older DM. Two voids at right. A few tubes at SWI. Top-down recolonization.
K-07 C 14.59 06/30/04 15:08:57 13.31 14.25 13.79 201.28 0.94 >4 1 >4 4.11 6.08 5.33 77.82 1 R 0 Stage I on III 11 No 201.28 > 13.79 > 13.31 > 14.25 2 9.74 12.43 11.08
Layered DM>P. Stratigraphy similar to previous rep, with poorly sorted silty sand over gray silt/clay. Band of black organic sediment at bottom of second layer. Three layers total. Two small void in lower left. Biological mound at center SWI and numerous tubes around mound. Anenome in background.
K-08 A 14.59 06/30/04 15:11:05 10.85 11.91 11.34 165.45 1.06 >4 1 4-3/>4 5.34 7.11 5.91 86.24 4 R 0 Stage I on III 11 No 165.45 > 11.34 > 10.85 > 11.91 1 11.00 11.48 11.24
DM>P. Two layer, upper layer 5-6 cm thich and graded silty fine to medium sand, Dark gray and organic. Void at bootm left and evidence of bioturbation and sand lag above void. Numerous reduced mudcalsts at the SWI. RPD appears partially depositional.
K-08 B 14.59 06/30/04 15:12:23 11.31 12.00 11.76 171.68 0.69 >4 1 4-3/>4 0.71 3.54 1.93 28.10 7 R 0 Stage I on III 8 No 171.68 > 11.76 > 11.31 > 12.00 1 5.68 8.51 7.10
DM>P. Two layer. Top layer is poorly sorted, graded silty fine sand which overlies gray sandy silt. Void at right. Numerous tubes at SWI and a few polychaetes in upper 3 cm. Thinly developed RPD. Mudclasts are artifacts.
K-08 C 14.59 06/30/04 15:13:08 8.08 8.65 8.53 124.48 0.57 >4 1 4-3/>4 0.97 3.31 2.30 33.51 8 R 0 Stage II 7 No 124.48 > 8.53 > 8.08 > 8.65 0 - - -
DM>P. Stiff, thin layer of graded silty fine sand, 3 cm, over patch stiff silt/clay. Tubes at SWI and numerous, black reduced artifacts mudclasts. Incipient recolonization - top down. Similar to rep B. Thinly developed RPD. Unusual texture. Oxidized patches at depth appear to be depositional/clay clasts or possibly relict RPD.
K-09 A 14.59 06/30/04 14:52:22 11.14 11.91 11.49 167.66 0.77 >4 1 >4 4.51 6.00 5.50 80.31 0 - 0 Stage II -> III 10 No 167.66 > 11.49 > 11.14 > 11.91 0 - - -
DM>P. Gray to dark gray, organic, slightly sandy silt/clay. Upper 3 cm enriched in sand relative to subsurface sediment. Thick RPD that may be partially depositionally enhanced. Several tubes in SWI background. Nice polychaete in upper right center. Shallow dwelling faunal burrow in left centr RPD that is cycling sediment with thin layer of resuspended biogenically reworked reduced pelletal sediment at SWI. Great Stage 2 (non-amphipod).
K-09 B 14.59 06/30/04 14:53:20 13.05 13.60 13.40 195.60 0.54 >4 1 4-3/>4 1.74 4.46 3.15 46.02 3 R 0 Stage I on III 10 No 195.60 > 13.40 > 13.05 > 13.60 2 6.11 7.26 6.68
DM>P. Some layering. Top layer poorly sorted, normally graded silty fine sand. Thin band of highly reduced sediment that is 1.5 cm thicj, 6 cm below the SWI. Voids in mid left and mid right. Relict RPD immediately under black layer. Several tubes at SWI.
K-09 C 14.59 06/30/04 14:54:00 13.25 13.91 13.61 198.64 0.66 >4 1 >4 2.52 3.97 3.13 45.67 >10 R 0 Stage I on III 10 No 198.64 > 13.61 > 13.25 > 13.91 3 9.77 13.48 11.62
Layered DM >P. RPD disrupted from numerous reduced mudclasts that are artifacts. RPD interpolated around dragdown and disruption features. Voids lower left and lower center. Band of recuced, black sediment that is 3 cm thick and 8 cm below the SWI. Several tubes at SWI background.
K-09 D 14.59 06/30/04 14:55:15 13.11 13.91 13.64 199.09 0.80 >4 1 >4 1.00 4.88 2.86 41.69 2 R 0 Stage I on III 9 No 199.09 > 13.64 > 13.11 > 13.91 1 2.74 12.23 7.48
Layered Dm >P. Numerous tubes at the SWI. Oxidized void and burrow structure in center of frame with biogenic depression at SWI immediately above this structure. Large tear in the sediment at lower left, that looks like a void but is not. Has break-up tear outline similar on the top and bottom - like reconstructing Pangea. Nice SWI showing all sorts of biological action. Large, pinkish fleshy worm at center left.
Monitoring Survey at the Western Long Island Sound Disposal Site June 2004 Appendix B-4 page 3 of 4
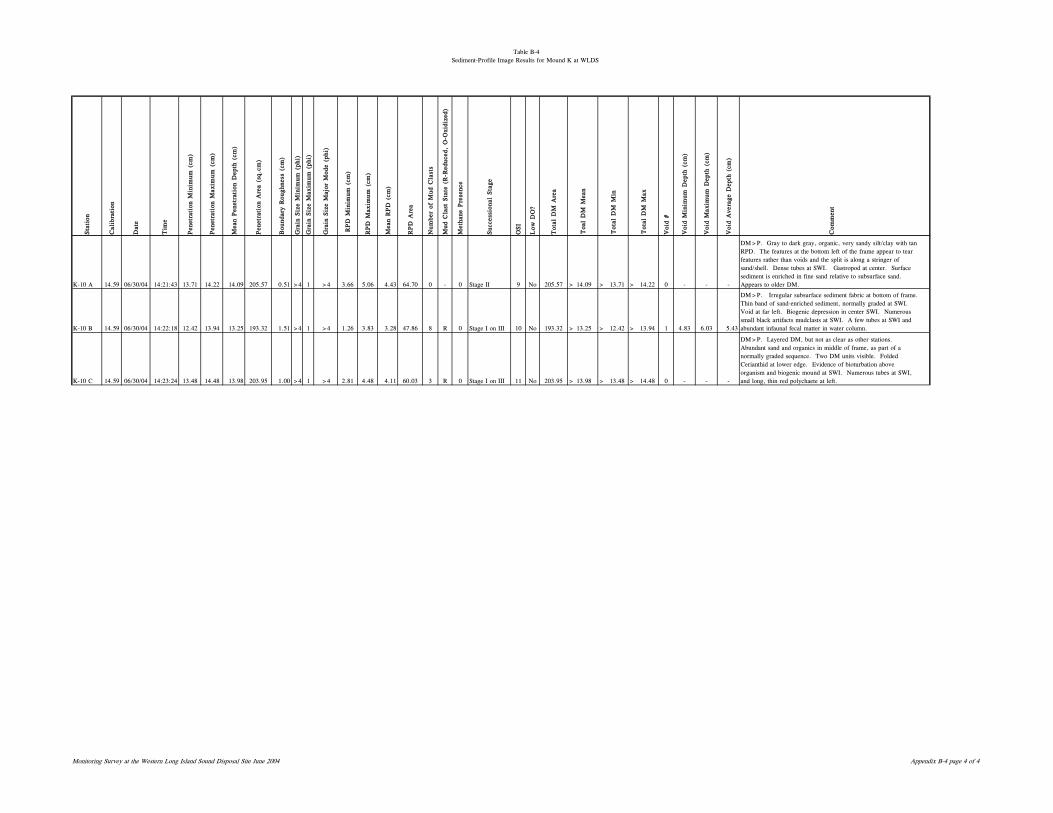
Table B-4Sediment-Profile Image Results for Mound K at WLDS
Sta
tion
Cal
ibra
tion
Dat
e
Tim
e
Pen
etra
tion
Min
imum
(cm
)
Pen
etra
tion
Max
imum
(cm
)
Mea
n Pen
etra
tion
Dep
th (
cm)
Pen
etra
tion
Are
a (s
q.cm
)
Bou
ndar
y R
ough
ness
(cm
)
Gra
in S
ize
Min
imum
(ph
i)
Gra
in S
ize
Max
imum
(ph
i)
Gra
in S
ize
Maj
or M
ode
(phi
)
RPD
Min
imum
(cm
)
RPD
Max
imum
(cm
)
Mea
n R
PD
(cm
)
RPD
Are
a
Num
ber
of M
ud C
last
s
Mud
Cla
st S
tate
(R
-Red
uced
, O
-Oxi
dize
d)
Met
hane
Pre
senc
e
Suc
cess
iona
l Sta
ge
OSI
Low
DO
?
Tot
al D
M A
rea
Voi
d #
Voi
d M
inim
um D
epth
(cm
)
Voi
d M
axim
um D
epth
(cm
)
Voi
d A
vera
ge D
epth
(cm
)
Com
men
t
Tot
al D
M M
in
Tot
al D
M M
ax
Toa
l D
M M
ean
K-10 A 14.59 06/30/04 14:21:43 13.71 14.22 14.09 205.57 0.51 >4 1 >4 3.66 5.06 4.43 64.70 0 - 0 Stage II 9 No 205.57 > 14.09 > 13.71 > 14.22 0 - - -
DM>P. Gray to dark gray, organic, very sandy silt/clay with tan RPD. The features at the bottom left of the frame appear to tear features rather than voids and the split is along a stringer of sand/shell. Dense tubes at SWI. Gastropod at center. Surface sediment is enriched in fine sand relative to subsurface sand. Appears to older DM.
K-10 B 14.59 06/30/04 14:22:18 12.42 13.94 13.25 193.32 1.51 >4 1 >4 1.26 3.83 3.28 47.86 8 R 0 Stage I on III 10 No 193.32 > 13.25 > 12.42 > 13.94 1 4.83 6.03 5.43
DM>P. Irregular subsurface sediment fabric at bottom of frame. Thin band of sand-enriched sediment, normally graded at SWI. Void at far left. Biogenic depression in center SWI. Numerous small black artifacts mudclasts at SWI. A few tubes at SWI and abundant infaunal fecal matter in water column.
K-10 C 14.59 06/30/04 14:23:24 13.48 14.48 13.98 203.95 1.00 >4 1 >4 2.81 4.48 4.11 60.03 3 R 0 Stage I on III 11 No 203.95 > 13.98 > 13.48 > 14.48 0 - - -
DM>P. Layered DM, but not as clear as other stations. Abundant sand and organics in middle of frame, as part of a normally graded sequence. Two DM units visible. Folded Cerianthid at lower edge. Evidence of bioturbation above organism and biogenic mound at SWI. Numerous tubes at SWI, and long, thin red polychaete at left.
Monitoring Survey at the Western Long Island Sound Disposal Site June 2004 Appendix B-4 page 4 of 4
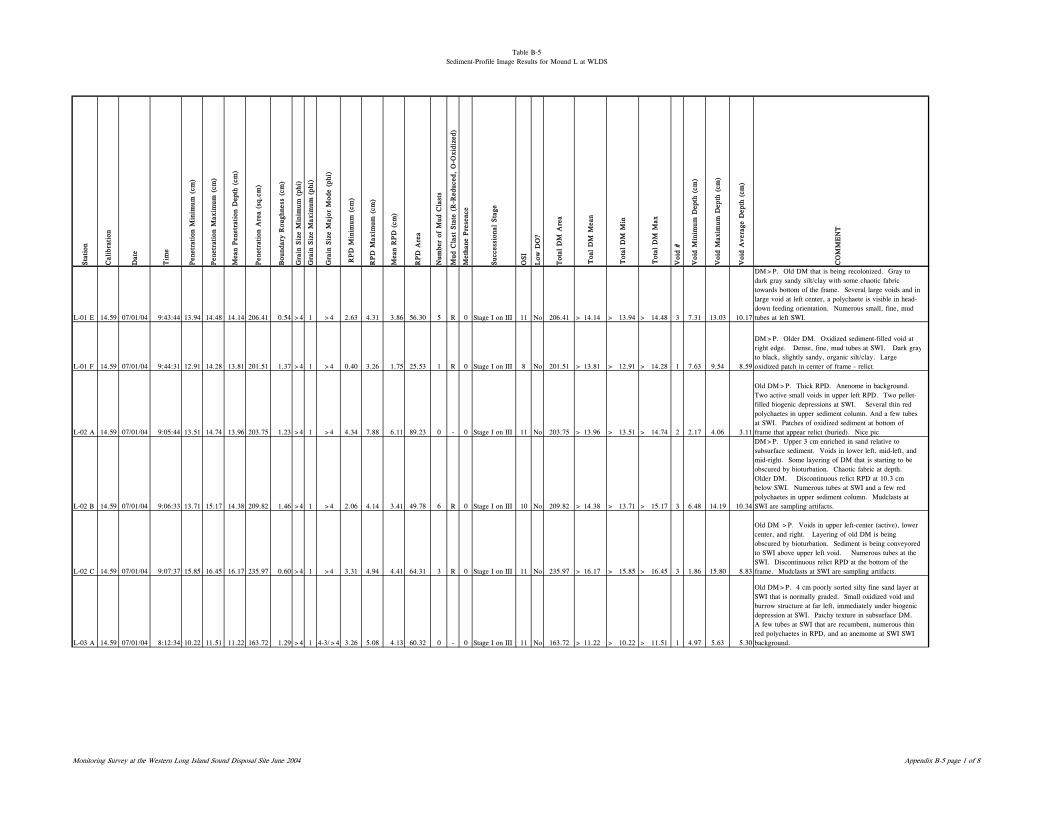
Table B-5Sediment-Profile Image Results for Mound L at WLDS
Sta
tion
Cal
ibra
tion
Dat
e
Tim
e
Pen
etra
tion
Min
imum
(cm
)
Pen
etra
tion
Max
imum
(cm
)
Mea
n Pen
etra
tion
Dep
th (
cm)
Pen
etra
tion
Are
a (s
q.cm
)
Bou
ndar
y R
ough
ness
(cm
)
Gra
in S
ize
Min
imum
(ph
i)
Gra
in S
ize
Max
imum
(ph
i)
Gra
in S
ize
Maj
or M
ode
(phi
)
RPD
Min
imum
(cm
)
RPD
Max
imum
(cm
)
Mea
n R
PD
(cm
)
RPD
Are
a
Num
ber
of M
ud C
last
s
Mud
Cla
st S
tate
(R
-Red
uced
, O
-Oxi
dize
d)
Met
hane
Pre
senc
e
Suc
cess
iona
l Sta
ge
OSI
Low
DO
?
Tot
al D
M A
rea
Voi
d #
Voi
d M
inim
um D
epth
(cm
)
Voi
d M
axim
um D
epth
(cm
)
Voi
d A
vera
ge D
epth
(cm
)
CO
MM
EN
T
L-01 E 14.59 07/01/04 9:43:44 13.94 14.48 14.14 206.41 0.54 >4 1 >4 2.63 4.31 3.86 56.30 5 R 0 Stage I on III 11 No 206.41 > 14.14 > 13.94 > 14.48 3 7.31 13.03 10.17
DM>P. Old DM that is being recolonized. Gray to dark gray sandy silt/clay with some chaotic fabric towards bottom of the frame. Several large voids and in large void at left center, a polychaete is visible in head-down feeding orientation. Numerous small, fine, mud tubes at left SWI.
L-01 F 14.59 07/01/04 9:44:31 12.91 14.28 13.81 201.51 1.37 >4 1 >4 0.40 3.26 1.75 25.53 1 R 0 Stage I on III 8 No 201.51 > 13.81 > 12.91 > 14.28 1 7.63 9.54 8.59
DM>P. Older DM. Oxidized sediment-filled void at right edge. Dense, fine, mud tubes at SWI. Dark grayto black, slightly sandy, organic silt/clay. Large oxidized patch in center of frame - relict.
L-02 A 14.59 07/01/04 9:05:44 13.51 14.74 13.96 203.75 1.23 >4 1 >4 4.34 7.88 6.11 89.23 0 - 0 Stage I on III 11 No 203.75 > 13.96 > 13.51 > 14.74 2 2.17 4.06 3.11
Old DM>P. Thick RPD. Anenome in background. Two active small voids in upper left RPD. Two pellet-filled biogenic depressions at SWI. Several thin red polychaetes in upper sediment column. And a few tubes at SWI. Patches of oxidized sediment at bottom of frame that appear relict (buried). Nice pic.
L-02 B 14.59 07/01/04 9:06:33 13.71 15.17 14.38 209.82 1.46 >4 1 >4 2.06 4.14 3.41 49.78 6 R 0 Stage I on III 10 No 209.82 > 14.38 > 13.71 > 15.17 3 6.48 14.19 10.34
DM>P. Upper 3 cm enriched in sand relative to subsurface sediment. Voids in lower left, mid-left, and mid-right. Some layering of DM that is starting to be obscured by bioturbation. Chaotic fabric at depth. Older DM. Discontinuous relict RPD at 10.3 cm below SWI. Numerous tubes at SWI and a few red polychaetes in upper sediment column. Mudclasts at SWI are sampling artifacts.
L-02 C 14.59 07/01/04 9:07:37 15.85 16.45 16.17 235.97 0.60 >4 1 >4 3.31 4.94 4.41 64.31 3 R 0 Stage I on III 11 No 235.97 > 16.17 > 15.85 > 16.45 3 1.86 15.80 8.83
Old DM >P. Voids in upper left-center (active), lower center, and right. Layering of old DM is being obscured by bioturbation. Sediment is being conveyored to SWI above upper left void. Numerous tubes at the SWI. Discontinuous relict RPD at the bottom of the frame. Mudclasts at SWI are sampling artifacts.
L-03 A 14.59 07/01/04 8:12:34 10.22 11.51 11.22 163.72 1.29 >4 1 4-3/>4 3.26 5.08 4.13 60.32 0 - 0 Stage I on III 11 No 163.72 > 11.22 > 10.22 > 11.51 1 4.97 5.63 5.30
Old DM>P. 4 cm poorly sorted silty fine sand layer at SWI that is normally graded. Small oxidized void and burrow structure at far left, immediately under biogenic depression at SWI. Patchy texture in subsurface DM. A few tubes at SWI that are recumbent, numerous thin red polychaetes in RPD, and an anemome at SWI SWI background.
Tot
al D
M M
in
Tot
al D
M M
ax
Toa
l D
M M
ean
Monitoring Survey at the Western Long Island Sound Disposal Site June 2004 Appendix B-5 page 1 of 8
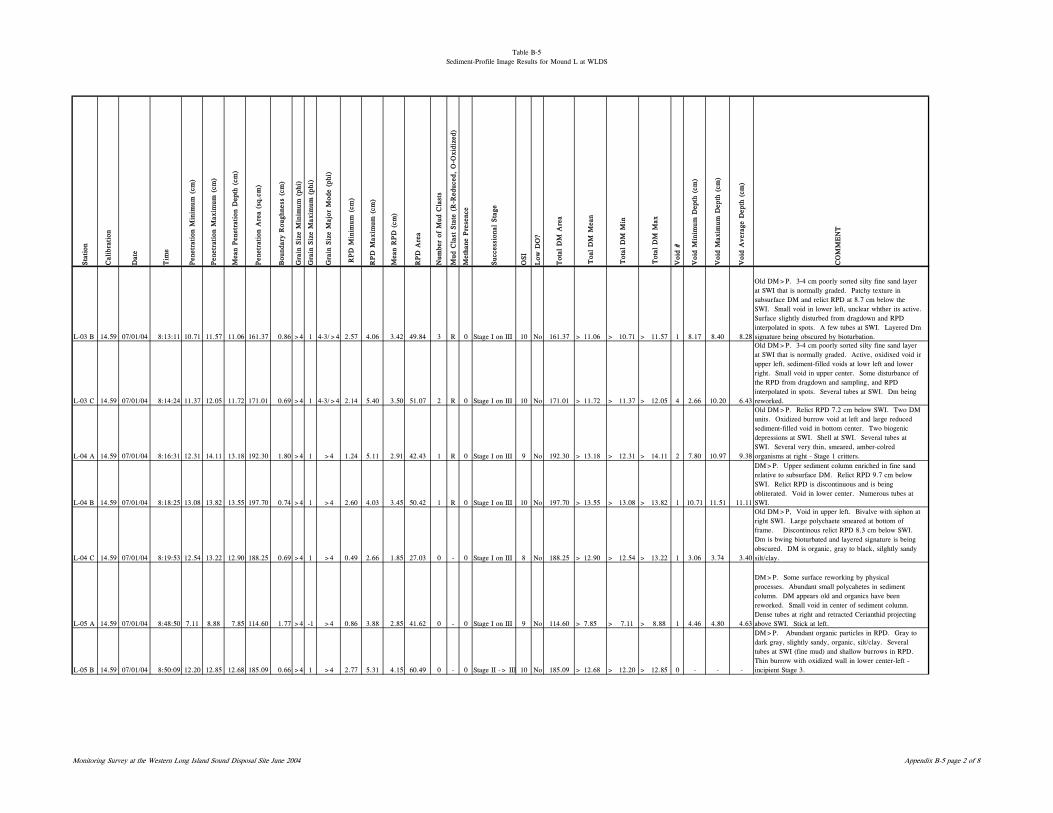
Table B-5Sediment-Profile Image Results for Mound L at WLDS
Sta
tion
Cal
ibra
tion
Dat
e
Tim
e
Pen
etra
tion
Min
imum
(cm
)
Pen
etra
tion
Max
imum
(cm
)
Mea
n Pen
etra
tion
Dep
th (
cm)
Pen
etra
tion
Are
a (s
q.cm
)
Bou
ndar
y R
ough
ness
(cm
)
Gra
in S
ize
Min
imum
(ph
i)
Gra
in S
ize
Max
imum
(ph
i)
Gra
in S
ize
Maj
or M
ode
(phi
)
RPD
Min
imum
(cm
)
RPD
Max
imum
(cm
)
Mea
n R
PD
(cm
)
RPD
Are
a
Num
ber
of M
ud C
last
s
Mud
Cla
st S
tate
(R
-Red
uced
, O
-Oxi
dize
d)
Met
hane
Pre
senc
e
Suc
cess
iona
l Sta
ge
OSI
Low
DO
?
Tot
al D
M A
rea
Voi
d #
Voi
d M
inim
um D
epth
(cm
)
Voi
d M
axim
um D
epth
(cm
)
Voi
d A
vera
ge D
epth
(cm
)
CO
MM
EN
T
Tot
al D
M M
in
Tot
al D
M M
ax
Toa
l D
M M
ean
L-03 B 14.59 07/01/04 8:13:11 10.71 11.57 11.06 161.37 0.86 >4 1 4-3/>4 2.57 4.06 3.42 49.84 3 R 0 Stage I on III 10 No 161.37 > 11.06 > 10.71 > 11.57 1 8.17 8.40 8.28
Old DM>P. 3-4 cm poorly sorted silty fine sand layer at SWI that is normally graded. Patchy texture in subsurface DM and relict RPD at 8.7 cm below the SWI. Small void in lower left, unclear whther its active.Surface slightly disturbed from dragdown and RPD interpolated in spots. A few tubes at SWI. Layered Dm signature being obscured by bioturbation.
L-03 C 14.59 07/01/04 8:14:24 11.37 12.05 11.72 171.01 0.69 >4 1 4-3/>4 2.14 5.40 3.50 51.07 2 R 0 Stage I on III 10 No 171.01 > 11.72 > 11.37 > 12.05 4 2.66 10.20 6.43
Old DM>P. 3-4 cm poorly sorted silty fine sand layer at SWI that is normally graded. Active, oxidixed void inupper left, sediment-filled voids at lowr left and lower right. Small void in upper center. Some disturbance of the RPD from dragdown and sampling, and RPD interpolated in spots. Several tubes at SWI. Dm being reworked.
L-04 A 14.59 07/01/04 8:16:31 12.31 14.11 13.18 192.30 1.80 >4 1 >4 1.24 5.11 2.91 42.43 1 R 0 Stage I on III 9 No 192.30 > 13.18 > 12.31 > 14.11 2 7.80 10.97 9.38
Old DM>P. Relict RPD 7.2 cm below SWI. Two DM units. Oxidized burrow void at left and large reduced sediment-filled void in bottom center. Two biogenic depressions at SWI. Shell at SWI. Several tubes at SWI. Several very thin, smeared, amber-colred organisms at right - Stage 1 critters.
L-04 B 14.59 07/01/04 8:18:25 13.08 13.82 13.55 197.70 0.74 >4 1 >4 2.60 4.03 3.45 50.42 1 R 0 Stage I on III 10 No 197.70 > 13.55 > 13.08 > 13.82 1 10.71 11.51 11.11
DM>P. Upper sediment column enriched in fine sand relative to subsurface DM. Relict RPD 9.7 cm below SWI. Relict RPD is discontinuous and is being obliterated. Void in lower center. Numerous tubes at SWI.
L-04 C 14.59 07/01/04 8:19:53 12.54 13.22 12.90 188.25 0.69 >4 1 >4 0.49 2.66 1.85 27.03 0 - 0 Stage I on III 8 No 188.25 > 12.90 > 12.54 > 13.22 1 3.06 3.74 3.40
Old DM>P, Void in upper left. Bivalve with siphon at right SWI. Large polychaete smeared at bottom of frame. Discontinous relict RPD 8.3 cm below SWI. Dm is bwing bioturbated and layered signature is being obscured. DM is organic, gray to black, silghtly sandy silt/clay.
L-05 A 14.59 07/01/04 8:48:50 7.11 8.88 7.85 114.60 1.77 >4 -1 >4 0.86 3.88 2.85 41.62 0 - 0 Stage I on III 9 No 114.60 > 7.85 > 7.11 > 8.88 1 4.46 4.80 4.63
DM>P. Some surface reworking by physical processes. Abundant small polycahetes in sediment column. DM appears old and organics have been reworked. Small void in center of sediment column. Dense tubes at right and retracted Cerianthid projecting above SWI. Stick at left.
L-05 B 14.59 07/01/04 8:50:09 12.20 12.85 12.68 185.09 0.66 >4 1 >4 2.77 5.31 4.15 60.49 0 - 0 Stage II -> III 10 No 185.09 > 12.68 > 12.20 > 12.85 0 - - -
DM>P. Abundant organic particles in RPD. Gray to dark gray, slightly sandy, organic, silt/clay. Several tubes at SWI (fine mud) and shallow burrows in RPD. Thin burrow with oxidized wall in lower center-left - incipient Stage 3.
Monitoring Survey at the Western Long Island Sound Disposal Site June 2004 Appendix B-5 page 2 of 8
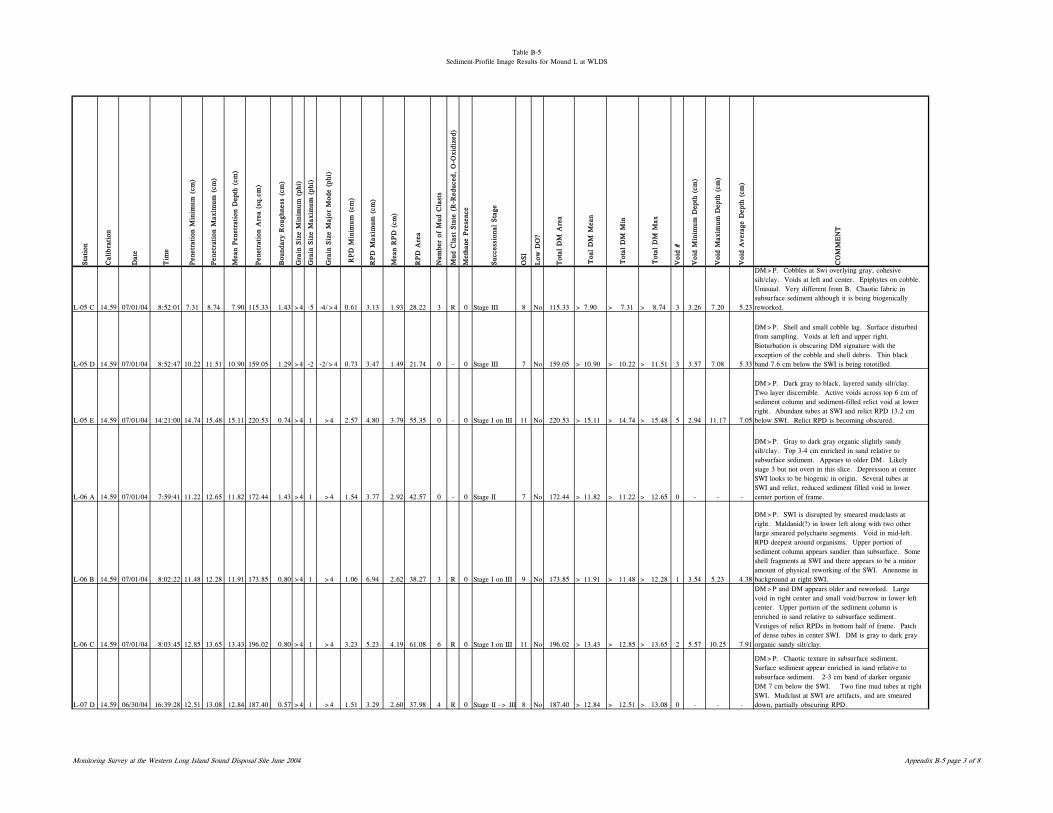
Table B-5Sediment-Profile Image Results for Mound L at WLDS
Sta
tion
Cal
ibra
tion
Dat
e
Tim
e
Pen
etra
tion
Min
imum
(cm
)
Pen
etra
tion
Max
imum
(cm
)
Mea
n Pen
etra
tion
Dep
th (
cm)
Pen
etra
tion
Are
a (s
q.cm
)
Bou
ndar
y R
ough
ness
(cm
)
Gra
in S
ize
Min
imum
(ph
i)
Gra
in S
ize
Max
imum
(ph
i)
Gra
in S
ize
Maj
or M
ode
(phi
)
RPD
Min
imum
(cm
)
RPD
Max
imum
(cm
)
Mea
n R
PD
(cm
)
RPD
Are
a
Num
ber
of M
ud C
last
s
Mud
Cla
st S
tate
(R
-Red
uced
, O
-Oxi
dize
d)
Met
hane
Pre
senc
e
Suc
cess
iona
l Sta
ge
OSI
Low
DO
?
Tot
al D
M A
rea
Voi
d #
Voi
d M
inim
um D
epth
(cm
)
Voi
d M
axim
um D
epth
(cm
)
Voi
d A
vera
ge D
epth
(cm
)
CO
MM
EN
T
Tot
al D
M M
in
Tot
al D
M M
ax
Toa
l D
M M
ean
L-05 C 14.59 07/01/04 8:52:01 7.31 8.74 7.90 115.33 1.43 >4 -5 -4/>4 0.61 3.13 1.93 28.22 3 R 0 Stage III 8 No 115.33 > 7.90 > 7.31 > 8.74 3 3.26 7.20 5.23
DM>P. Cobbles at Swi overlying gray, cohesive silt/clay. Voids at left and center. Epiphytes on cobble. Unusual. Very different from B. Chaotic fabric in subsurface sediment although it is being biogenically reworked.
L-05 D 14.59 07/01/04 8:52:47 10.22 11.51 10.90 159.05 1.29 >4 -2 -2/>4 0.73 3.47 1.49 21.74 0 - 0 Stage III 7 No 159.05 > 10.90 > 10.22 > 11.51 3 3.57 7.08 5.33
DM>P. Shell and small cobble lag. Surface disturbed from sampling. Voids at left and upper right. Bioturbation is obscuring DM signature with the exception of the cobble and shell debris. Thin black band 7.6 cm below the SWI is being rototilled.
L-05 E 14.59 07/01/04 14:21:00 14.74 15.48 15.11 220.53 0.74 >4 1 >4 2.57 4.80 3.79 55.35 0 - 0 Stage I on III 11 No 220.53 > 15.11 > 14.74 > 15.48 5 2.94 11.17 7.05
DM>P. Dark gray to black, layered sandy silt/clay. Two layer discernible. Active voids across top 6 cm of sediment column and sediment-filled relict void at lower right. Abundant tubes at SWI and relict RPD 13.2 cm below SWI. Relict RPD is becoming obscured.
L-06 A 14.59 07/01/04 7:59:41 11.22 12.65 11.82 172.44 1.43 >4 1 >4 1.54 3.77 2.92 42.57 0 - 0 Stage II 7 No 172.44 > 11.82 > 11.22 > 12.65 0 - - -
DM>P. Gray to dark gray organic slightly sandy silt/clay. Top 3-4 cm enriched in sand relative to subsurface sediment. Appears to older DM. Likely stage 3 but not overt in this slice. Depression at center SWI looks to be biogenic in origin. Several tubes at SWI and relict, reduced sediment filled void in lower center portion of frame.
L-06 B 14.59 07/01/04 8:02:22 11.48 12.28 11.91 173.85 0.80 >4 1 >4 1.06 6.94 2.62 38.27 3 R 0 Stage I on III 9 No 173.85 > 11.91 > 11.48 > 12.28 1 3.54 5.23 4.38
DM>P. SWI is disrupted by smeared mudclasts at right. Maldanid(?) in lower left along with two other large smeared polychaete segments. Void in mid-left. RPD deepest around organisms. Upper portion of sediment column appears sandier than subsurface. Some shell fragments at SWI and there appears to be a minor amount of physical reworking of the SWI. Anenome in background at right SWI.
L-06 C 14.59 07/01/04 8:03:45 12.85 13.65 13.43 196.02 0.80 >4 1 >4 3.23 5.23 4.19 61.08 6 R 0 Stage I on III 11 No 196.02 > 13.43 > 12.85 > 13.65 2 5.57 10.25 7.91
DM>P and DM appears older and reworked. Large void in right center and small void/burrow in lower left center. Upper portion of the sediment column is enriched in sand relative to subsurface sediment. Vestiges of relict RPDs in bottom half of frame. Patch of dense tubes in center SWI. DM is gray to dark gray organic sandy silt/clay.
L-07 D 14.59 06/30/04 16:39:28 12.51 13.08 12.84 187.40 0.57 >4 1 >4 1.51 3.29 2.60 37.98 4 R 0 Stage II -> III 8 No 187.40 > 12.84 > 12.51 > 13.08 0 - - -
DM>P. Chaotic texture in subsurface sediment. Surface sediment appear enriched in sand relative to subsurface sediment. 2-3 cm band of darker organic DM 7 cm below the SWI. Two fine mud tubes at rightSWI. Mudclast at SWI are artifacts, and are smeared down, partially obscuring RPD.
Monitoring Survey at the Western Long Island Sound Disposal Site June 2004 Appendix B-5 page 3 of 8
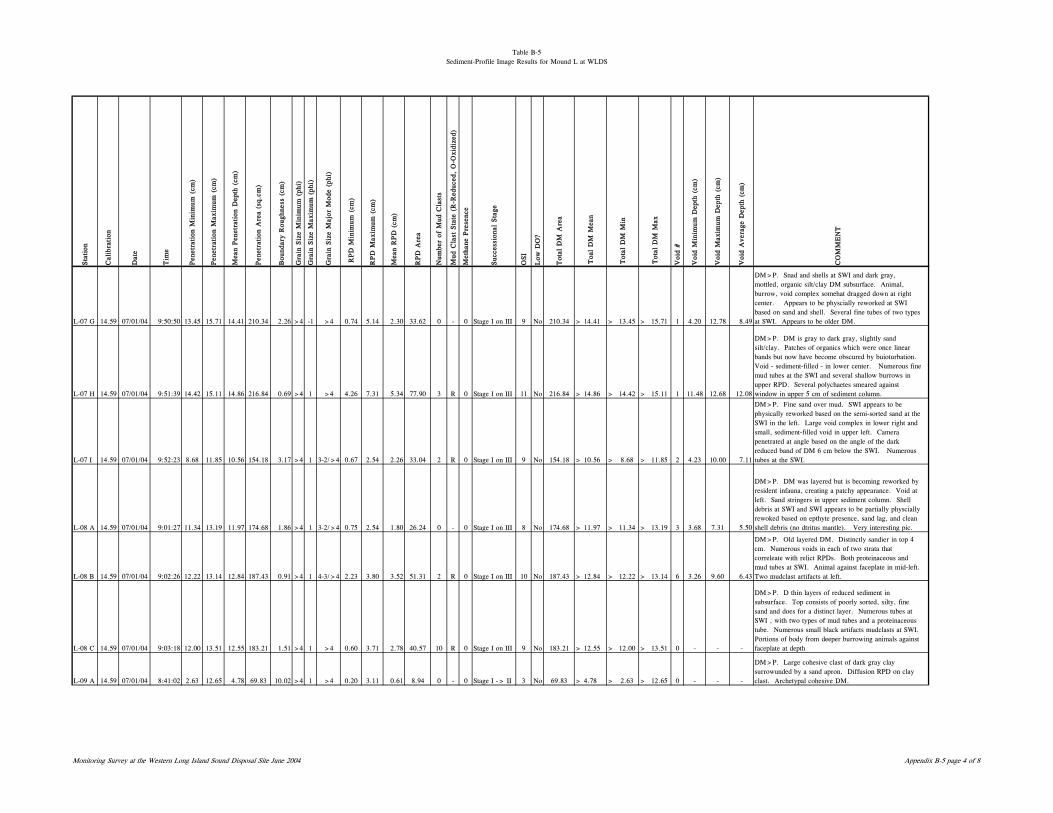
Table B-5Sediment-Profile Image Results for Mound L at WLDS
Sta
tion
Cal
ibra
tion
Dat
e
Tim
e
Pen
etra
tion
Min
imum
(cm
)
Pen
etra
tion
Max
imum
(cm
)
Mea
n Pen
etra
tion
Dep
th (
cm)
Pen
etra
tion
Are
a (s
q.cm
)
Bou
ndar
y R
ough
ness
(cm
)
Gra
in S
ize
Min
imum
(ph
i)
Gra
in S
ize
Max
imum
(ph
i)
Gra
in S
ize
Maj
or M
ode
(phi
)
RPD
Min
imum
(cm
)
RPD
Max
imum
(cm
)
Mea
n R
PD
(cm
)
RPD
Are
a
Num
ber
of M
ud C
last
s
Mud
Cla
st S
tate
(R
-Red
uced
, O
-Oxi
dize
d)
Met
hane
Pre
senc
e
Suc
cess
iona
l Sta
ge
OSI
Low
DO
?
Tot
al D
M A
rea
Voi
d #
Voi
d M
inim
um D
epth
(cm
)
Voi
d M
axim
um D
epth
(cm
)
Voi
d A
vera
ge D
epth
(cm
)
CO
MM
EN
T
Tot
al D
M M
in
Tot
al D
M M
ax
Toa
l D
M M
ean
L-07 G 14.59 07/01/04 9:50:50 13.45 15.71 14.41 210.34 2.26 >4 -1 >4 0.74 5.14 2.30 33.62 0 - 0 Stage I on III 9 No 210.34 > 14.41 > 13.45 > 15.71 1 4.20 12.78 8.49
DM>P. Snad and shells at SWI and dark gray, mottled, organic silt/clay DM subsurface. Animal, burrow, void complex somehat dragged down at right center. Appears to be physcially reworked at SWI based on sand and shell. Several fine tubes of two types at SWI. Appears to be older DM.
L-07 H 14.59 07/01/04 9:51:39 14.42 15.11 14.86 216.84 0.69 >4 1 >4 4.26 7.31 5.34 77.90 3 R 0 Stage I on III 11 No 216.84 > 14.86 > 14.42 > 15.11 1 11.48 12.68 12.08
DM>P. DM is gray to dark gray, slightly sand silt/clay. Patches of organics which were once linear bands but now have become obscured by buioturbation. Void - sediment-filled - in lower center. Numerous fine mud tubes at the SWI and several shallow burrows in upper RPD. Several polychaetes smeared against window in upper 5 cm of sediment column.
L-07 I 14.59 07/01/04 9:52:23 8.68 11.85 10.56 154.18 3.17 >4 1 3-2/>4 0.67 2.54 2.26 33.04 2 R 0 Stage I on III 9 No 154.18 > 10.56 > 8.68 > 11.85 2 4.23 10.00 7.11
DM>P. Fine sand over mud. SWI appears to be physically reworked based on the semi-sorted sand at the SWI in the left. Large void complex in lower right and small, sediment-filled void in upper left. Camera penetrated at angle based on the angle of the dark reduced band of DM 6 cm below the SWI. Numerous tubes at the SWI.
L-08 A 14.59 07/01/04 9:01:27 11.34 13.19 11.97 174.68 1.86 >4 1 3-2/>4 0.75 2.54 1.80 26.24 0 - 0 Stage I on III 8 No 174.68 > 11.97 > 11.34 > 13.19 3 3.68 7.31 5.50
DM>P. DM was layered but is becoming reworked by resident infauna, creating a patchy appearance. Void at left. Sand stringers in upper sediment column. Shell debris at SWI and SWI appears to be partially physcially rewoked based on epthyte presence, sand lag, and clean shell debris (no dtritus mantle). Very interesting pic.
L-08 B 14.59 07/01/04 9:02:26 12.22 13.14 12.84 187.43 0.91 >4 1 4-3/>4 2.23 3.80 3.52 51.31 2 R 0 Stage I on III 10 No 187.43 > 12.84 > 12.22 > 13.14 6 3.26 9.60 6.43
DM>P. Old layered DM. Distinctly sandier in top 4 cm. Numerous voids in each of two strata that correleate with relict RPDs. Both proteinaceous and mud tubes at SWI. Animal against faceplate in mid-left. Two mudclast artifacts at left.
L-08 C 14.59 07/01/04 9:03:18 12.00 13.51 12.55 183.21 1.51 >4 1 >4 0.60 3.71 2.78 40.57 10 R 0 Stage I on III 9 No 183.21 > 12.55 > 12.00 > 13.51 0 - - -
DM>P. D thin layers of reduced sediment in subsurface. Top consists of poorly sorted, silty, fine sand and does for a distinct layer. Numerous tubes at SWI , with two types of mud tubes and a proteinaceous tube. Numerous small black artifacts mudclasts at SWI. Portions of body from deeper burrowing animals against faceplate at depth
L-09 A 14.59 07/01/04 8:41:02 2.63 12.65 4.78 69.83 10.02 >4 1 >4 0.20 3.11 0.61 8.94 0 - 0 Stage I -> II 3 No 69.83 > 4.78 > 2.63 > 12.65 0 - - -
DM>P. Large cohesive clast of dark gray clay surrowunded by a sand apron. Diffusion RPD on clay clast. Archetypal cohesive DM.
Monitoring Survey at the Western Long Island Sound Disposal Site June 2004 Appendix B-5 page 4 of 8
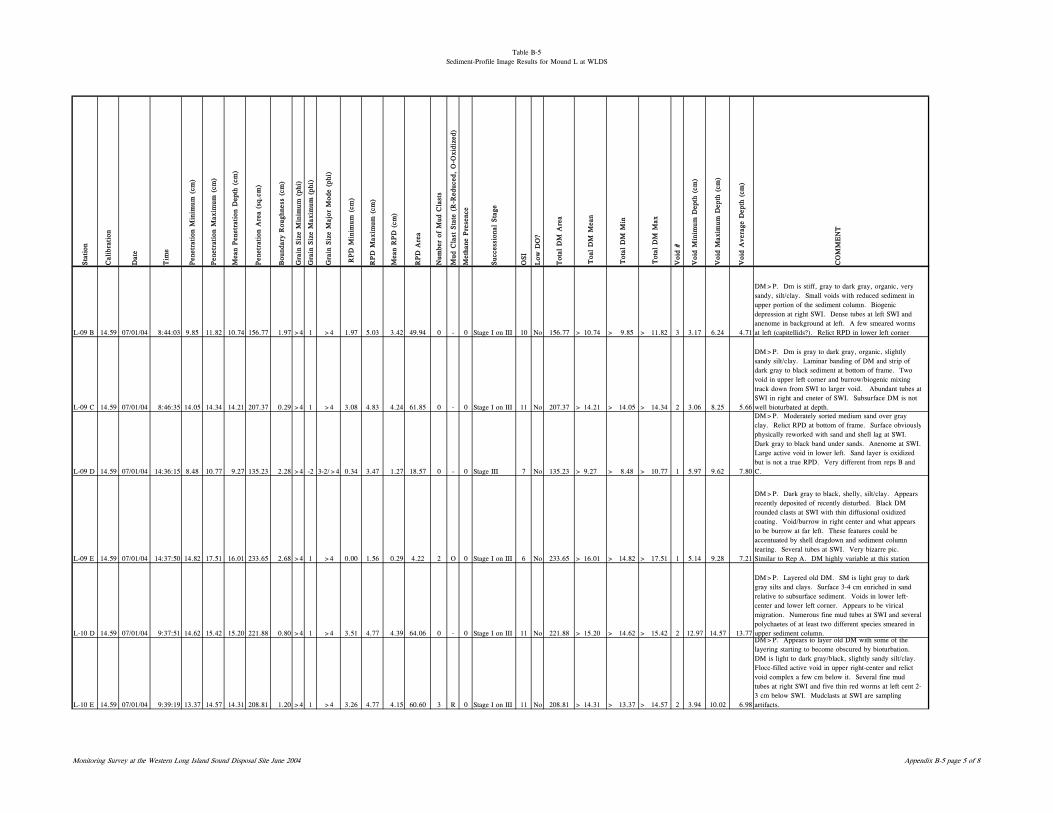
Table B-5Sediment-Profile Image Results for Mound L at WLDS
Sta
tion
Cal
ibra
tion
Dat
e
Tim
e
Pen
etra
tion
Min
imum
(cm
)
Pen
etra
tion
Max
imum
(cm
)
Mea
n Pen
etra
tion
Dep
th (
cm)
Pen
etra
tion
Are
a (s
q.cm
)
Bou
ndar
y R
ough
ness
(cm
)
Gra
in S
ize
Min
imum
(ph
i)
Gra
in S
ize
Max
imum
(ph
i)
Gra
in S
ize
Maj
or M
ode
(phi
)
RPD
Min
imum
(cm
)
RPD
Max
imum
(cm
)
Mea
n R
PD
(cm
)
RPD
Are
a
Num
ber
of M
ud C
last
s
Mud
Cla
st S
tate
(R
-Red
uced
, O
-Oxi
dize
d)
Met
hane
Pre
senc
e
Suc
cess
iona
l Sta
ge
OSI
Low
DO
?
Tot
al D
M A
rea
Voi
d #
Voi
d M
inim
um D
epth
(cm
)
Voi
d M
axim
um D
epth
(cm
)
Voi
d A
vera
ge D
epth
(cm
)
CO
MM
EN
T
Tot
al D
M M
in
Tot
al D
M M
ax
Toa
l D
M M
ean
L-09 B 14.59 07/01/04 8:44:03 9.85 11.82 10.74 156.77 1.97 >4 1 >4 1.97 5.03 3.42 49.94 0 - 0 Stage I on III 10 No 156.77 > 10.74 > 9.85 > 11.82 3 3.17 6.24 4.71
DM>P. Dm is stiff, gray to dark gray, organic, very sandy, silt/clay. Small voids with reduced sediment in upper portion of the sediment column. Biogenic depression at right SWI. Dense tubes at left SWI and anenome in background at left. A few smeared worms at left (capitellids?). Relict RPD in lower left corner.
L-09 C 14.59 07/01/04 8:46:35 14.05 14.34 14.21 207.37 0.29 >4 1 >4 3.08 4.83 4.24 61.85 0 - 0 Stage I on III 11 No 207.37 > 14.21 > 14.05 > 14.34 2 3.06 8.25 5.66
DM>P. Dm is gray to dark gray, organic, slightly sandy silt/clay. Laminar banding of DM and strip of dark gray to black sediment at bottom of frame. Two void in upper left corner and burrow/biogenic mixing track down from SWI to larger void. Abundant tubes atSWI in right and cneter of SWI. Subsurface DM is not well bioturbated at depth.
L-09 D 14.59 07/01/04 14:36:15 8.48 10.77 9.27 135.23 2.28 >4 -2 3-2/>4 0.34 3.47 1.27 18.57 0 - 0 Stage III 7 No 135.23 > 9.27 > 8.48 > 10.77 1 5.97 9.62 7.80
DM>P. Moderately sorted medium sand over gray clay. Relict RPD at bottom of frame. Surface obviouslyphysically reworked with sand and shell lag at SWI. Dark gray to black band under sands. Anenome at SWI. Large active void in lower left. Sand layer is oxidized but is not a true RPD. Very different from reps B and C.
L-09 E 14.59 07/01/04 14:37:50 14.82 17.51 16.01 233.65 2.68 >4 1 >4 0.00 1.56 0.29 4.22 2 O 0 Stage I on III 6 No 233.65 > 16.01 > 14.82 > 17.51 1 5.14 9.28 7.21
DM>P. Dark gray to black, shelly, silt/clay. Appears recently deposited of recently disturbed. Black DM rounded clasts at SWI with thin diffusional oxidized coating. Void/burrow in right center and what appears to be burrow at far left. These features could be accentuated by shell dragdown and sediment column tearing. Several tubes at SWI. Very bizarre pic. Similar to Rep A. DM highly variable at this station.
L-10 D 14.59 07/01/04 9:37:51 14.62 15.42 15.20 221.88 0.80 >4 1 >4 3.51 4.77 4.39 64.06 0 - 0 Stage I on III 11 No 221.88 > 15.20 > 14.62 > 15.42 2 12.97 14.57 13.77
DM>P. Layered old DM. SM is light gray to dark gray silts and clays. Surface 3-4 cm enriched in sand relative to subsurface sediment. Voids in lower left-center and lower left corner. Appears to be virical migration. Numerous fine mud tubes at SWI and several polychaetes of at least two different species smeared in upper sediment column.
L-10 E 14.59 07/01/04 9:39:19 13.37 14.57 14.31 208.81 1.20 >4 1 >4 3.26 4.77 4.15 60.60 3 R 0 Stage I on III 11 No 208.81 > 14.31 > 13.37 > 14.57 2 3.94 10.02 6.98
DM>P. Appears to layer old DM with some of the layering starting to become obscured by bioturbation. DM is light to dark gray/black, slightly sandy silt/clay. Flocc-filled active void in upper right-center and relict void complex a few cm below it. Several fine mud tubes at right SWI and five thin red worms at left cent 2-3 cm below SWI. Mudclasts at SWI are sampling artifacts.
Monitoring Survey at the Western Long Island Sound Disposal Site June 2004 Appendix B-5 page 5 of 8
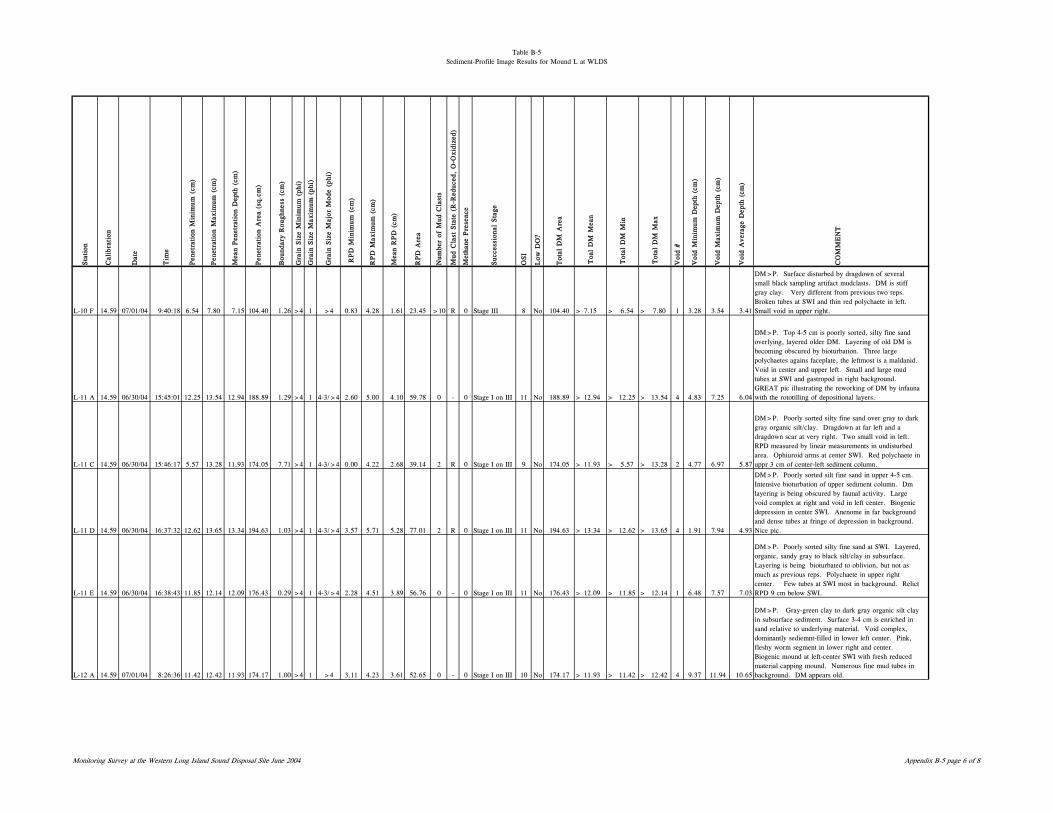
Table B-5Sediment-Profile Image Results for Mound L at WLDS
Sta
tion
Cal
ibra
tion
Dat
e
Tim
e
Pen
etra
tion
Min
imum
(cm
)
Pen
etra
tion
Max
imum
(cm
)
Mea
n Pen
etra
tion
Dep
th (
cm)
Pen
etra
tion
Are
a (s
q.cm
)
Bou
ndar
y R
ough
ness
(cm
)
Gra
in S
ize
Min
imum
(ph
i)
Gra
in S
ize
Max
imum
(ph
i)
Gra
in S
ize
Maj
or M
ode
(phi
)
RPD
Min
imum
(cm
)
RPD
Max
imum
(cm
)
Mea
n R
PD
(cm
)
RPD
Are
a
Num
ber
of M
ud C
last
s
Mud
Cla
st S
tate
(R
-Red
uced
, O
-Oxi
dize
d)
Met
hane
Pre
senc
e
Suc
cess
iona
l Sta
ge
OSI
Low
DO
?
Tot
al D
M A
rea
Voi
d #
Voi
d M
inim
um D
epth
(cm
)
Voi
d M
axim
um D
epth
(cm
)
Voi
d A
vera
ge D
epth
(cm
)
CO
MM
EN
T
Tot
al D
M M
in
Tot
al D
M M
ax
Toa
l D
M M
ean
L-10 F 14.59 07/01/04 9:40:18 6.54 7.80 7.15 104.40 1.26 >4 1 >4 0.83 4.28 1.61 23.45 >10 R 0 Stage III 8 No 104.40 > 7.15 > 6.54 > 7.80 1 3.28 3.54 3.41
DM>P. Surface disturbed by dragdown of several small black sampling artifact mudclasts. DM is stiff gray clay. Very different from previous two reps. Broken tubes at SWI and thin red polychaete in left. Small void in upper right.
L-11 A 14.59 06/30/04 15:45:01 12.25 13.54 12.94 188.89 1.29 >4 1 4-3/>4 2.60 5.00 4.10 59.78 0 - 0 Stage I on III 11 No 188.89 > 12.94 > 12.25 > 13.54 4 4.83 7.25 6.04
DM>P. Top 4-5 cm is poorly sorted, silty fine sand overlying, layered older DM. Layering of old DM is becoming obscured by bioturbation. Three large polychaetes agains faceplate, the leftmost is a maldanid. Void in center and upper left. Small and large mud tubes at SWI and gastropod in right background. GREAT pic illustrating the reworking of DM by infauna with the rototilling of depositional layers.
L-11 C 14.59 06/30/04 15:46:17 5.57 13.28 11.93 174.05 7.71 >4 1 4-3/>4 0.00 4.22 2.68 39.14 2 R 0 Stage I on III 9 No 174.05 > 11.93 > 5.57 > 13.28 2 4.77 6.97 5.87
DM>P. Poorly sorted silty fine sand over gray to dark gray organic silt/clay. Dragdown at far left and a dragdown scar at very right. Two small void in left. RPD measured by linear measurements in undisturbed area. Ophiuroid arms at center SWI. Red polychaete in uppr 3 cm of center-left sediment column.
L-11 D 14.59 06/30/04 16:37:32 12.62 13.65 13.34 194.63 1.03 >4 1 4-3/>4 3.57 5.71 5.28 77.01 2 R 0 Stage I on III 11 No 194.63 > 13.34 > 12.62 > 13.65 4 1.91 7.94 4.93
DM>P. Poorly sorted silt fine sand in upper 4-5 cm. Intensive bioturbation of upper sediment column. Dm layering is being obscured by faunal activity. Large void complex at right and void in left center. Biogenic depression in center SWI. Anenome in far background and dense tubes at fringe of depression in background. Nice pic.
L-11 E 14.59 06/30/04 16:38:43 11.85 12.14 12.09 176.43 0.29 >4 1 4-3/>4 2.28 4.51 3.89 56.76 0 - 0 Stage I on III 11 No 176.43 > 12.09 > 11.85 > 12.14 1 6.48 7.57 7.03
DM>P. Poorly sorted silty fine sand at SWI. Layered, organic, sandy gray to black silt/clay in subsurface. Layering is being bioturbated to oblivion, but not as much as previous reps. Polychaete in upper right center. Few tubes at SWI most in background. Relict RPD 9 cm below SWI.
L-12 A 14.59 07/01/04 8:26:36 11.42 12.42 11.93 174.17 1.00 >4 1 >4 3.11 4.23 3.61 52.65 0 - 0 Stage I on III 10 No 174.17 > 11.93 > 11.42 > 12.42 4 9.37 11.94 10.65
DM>P. Gray-green clay to dark gray organic silt clay in subsurface sediment. Surface 3-4 cm is enriched in sand relative to underlying material. Void complex, dominantly sediemnt-filled in lower left center. Pink, fleshy worm segment in lower right and center. Biogenic mound at left-center SWI with fresh reduced material capping mound. Numerous fine mud tubes in background. DM appears old.
Monitoring Survey at the Western Long Island Sound Disposal Site June 2004 Appendix B-5 page 6 of 8
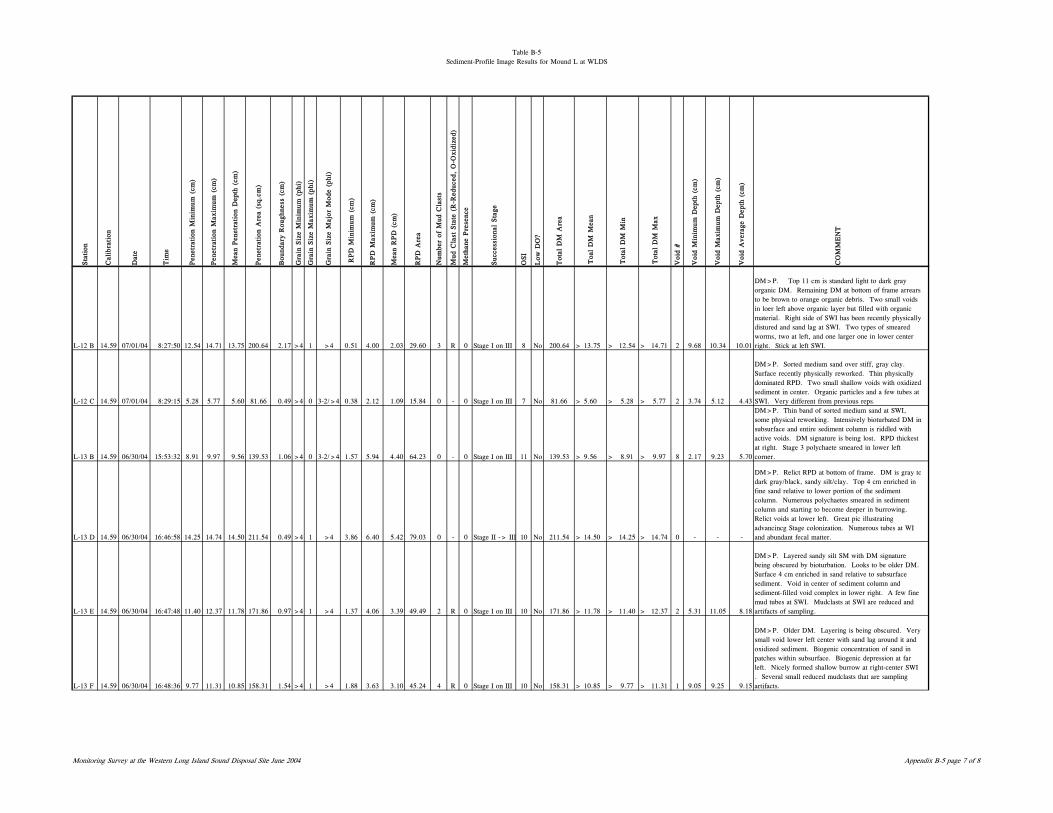
Table B-5Sediment-Profile Image Results for Mound L at WLDS
Sta
tion
Cal
ibra
tion
Dat
e
Tim
e
Pen
etra
tion
Min
imum
(cm
)
Pen
etra
tion
Max
imum
(cm
)
Mea
n Pen
etra
tion
Dep
th (
cm)
Pen
etra
tion
Are
a (s
q.cm
)
Bou
ndar
y R
ough
ness
(cm
)
Gra
in S
ize
Min
imum
(ph
i)
Gra
in S
ize
Max
imum
(ph
i)
Gra
in S
ize
Maj
or M
ode
(phi
)
RPD
Min
imum
(cm
)
RPD
Max
imum
(cm
)
Mea
n R
PD
(cm
)
RPD
Are
a
Num
ber
of M
ud C
last
s
Mud
Cla
st S
tate
(R
-Red
uced
, O
-Oxi
dize
d)
Met
hane
Pre
senc
e
Suc
cess
iona
l Sta
ge
OSI
Low
DO
?
Tot
al D
M A
rea
Voi
d #
Voi
d M
inim
um D
epth
(cm
)
Voi
d M
axim
um D
epth
(cm
)
Voi
d A
vera
ge D
epth
(cm
)
CO
MM
EN
T
Tot
al D
M M
in
Tot
al D
M M
ax
Toa
l D
M M
ean
L-12 B 14.59 07/01/04 8:27:50 12.54 14.71 13.75 200.64 2.17 >4 1 >4 0.51 4.00 2.03 29.60 3 R 0 Stage I on III 8 No 200.64 > 13.75 > 12.54 > 14.71 2 9.68 10.34 10.01
DM>P. Top 11 cm is standard light to dark gray organic DM. Remaining DM at bottom of frame arrears to be brown to orange organic debris. Two small voids in loer left above organic layer but filled with organic material. Right side of SWI has been recently physically distured and sand lag at SWI. Two types of smeared worms, two at left, and one larger one in lower center right. Stick at left SWI.
L-12 C 14.59 07/01/04 8:29:15 5.28 5.77 5.60 81.66 0.49 >4 0 3-2/>4 0.38 2.12 1.09 15.84 0 - 0 Stage I on III 7 No 81.66 > 5.60 > 5.28 > 5.77 2 3.74 5.12 4.43
DM>P. Sorted medium sand over stiff, gray clay. Surface recently physically reworked. Thin physically dominated RPD. Two small shallow voids with oxidized sediment in center. Organic particles and a few tubes at SWI. Very different from previous reps.
L-13 B 14.59 06/30/04 15:53:32 8.91 9.97 9.56 139.53 1.06 >4 0 3-2/>4 1.57 5.94 4.40 64.23 0 - 0 Stage I on III 11 No 139.53 > 9.56 > 8.91 > 9.97 8 2.17 9.23 5.70
DM>P. Thin band of sorted medium sand at SWI, some physical reworking. Intensively bioturbated DM in subsurface and entire sediment column is riddled with active voids. DM signature is being lost. RPD thickest at right. Stage 3 polychaete smeared in lower left corner.
L-13 D 14.59 06/30/04 16:46:58 14.25 14.74 14.50 211.54 0.49 >4 1 >4 3.86 6.40 5.42 79.03 0 - 0 Stage II -> III 10 No 211.54 > 14.50 > 14.25 > 14.74 0 - - -
DM>P. Relict RPD at bottom of frame. DM is gray todark gray/black, sandy silt/clay. Top 4 cm enriched in fine sand relative to lower portion of the sediment column. Numerous polychaetes smeared in sediment column and starting to become deeper in burrowing. Relict voids at lower left. Great pic illustrating advancincg Stage colonization. Numerous tubes at WI and abundant fecal matter.
L-13 E 14.59 06/30/04 16:47:48 11.40 12.37 11.78 171.86 0.97 >4 1 >4 1.37 4.06 3.39 49.49 2 R 0 Stage I on III 10 No 171.86 > 11.78 > 11.40 > 12.37 2 5.31 11.05 8.18
DM>P. Layered sandy silt SM with DM signature being obscured by bioturbation. Looks to be older DM. Surface 4 cm enriched in sand relative to subsurface sediment. Void in center of sediment column and sediment-filled void complex in lower right. A few fine mud tubes at SWI. Mudclasts at SWI are reduced and artifacts of sampling.
L-13 F 14.59 06/30/04 16:48:36 9.77 11.31 10.85 158.31 1.54 >4 1 >4 1.88 3.63 3.10 45.24 4 R 0 Stage I on III 10 No 158.31 > 10.85 > 9.77 > 11.31 1 9.05 9.25 9.15
DM>P. Older DM. Layering is being obscured. Very small void lower left center with sand lag around it and oxidized sediment. Biogenic concentration of sand in patches within subsurface. Biogenic depression at far left. Nicely formed shallow burrow at right-center SWI . Several small reduced mudclasts that are sampling artifacts.
Monitoring Survey at the Western Long Island Sound Disposal Site June 2004 Appendix B-5 page 7 of 8
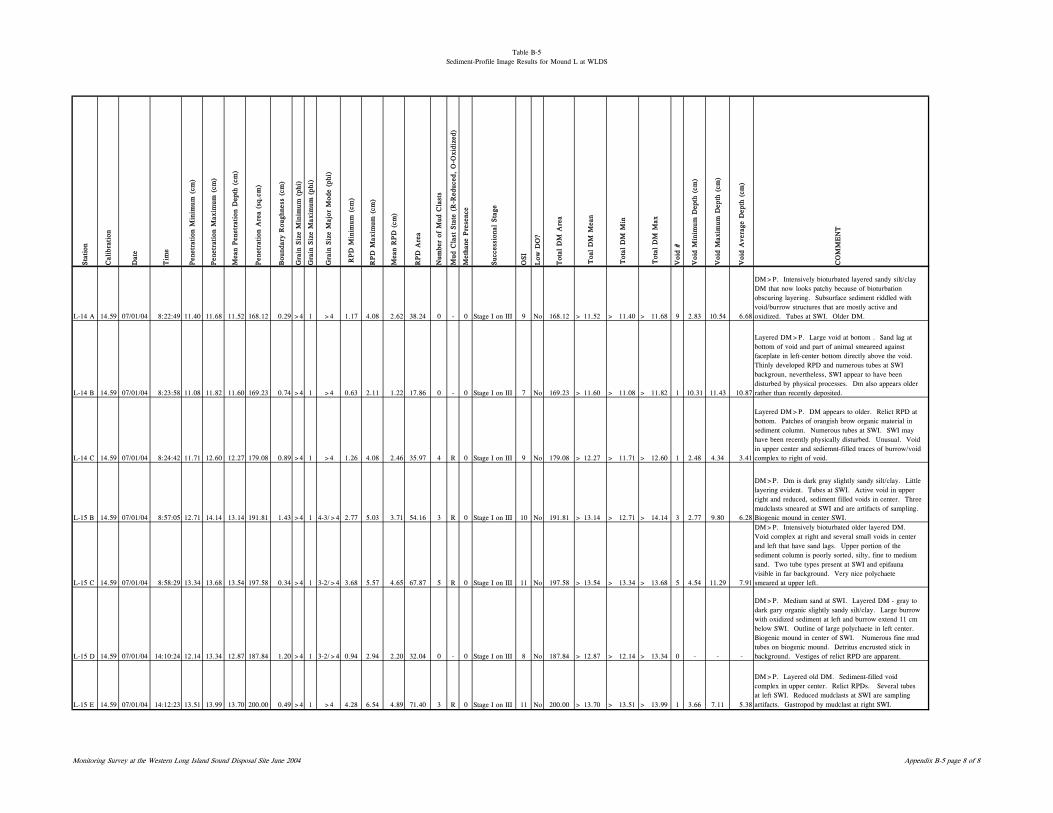
Table B-5Sediment-Profile Image Results for Mound L at WLDS
Sta
tion
Cal
ibra
tion
Dat
e
Tim
e
Pen
etra
tion
Min
imum
(cm
)
Pen
etra
tion
Max
imum
(cm
)
Mea
n Pen
etra
tion
Dep
th (
cm)
Pen
etra
tion
Are
a (s
q.cm
)
Bou
ndar
y R
ough
ness
(cm
)
Gra
in S
ize
Min
imum
(ph
i)
Gra
in S
ize
Max
imum
(ph
i)
Gra
in S
ize
Maj
or M
ode
(phi
)
RPD
Min
imum
(cm
)
RPD
Max
imum
(cm
)
Mea
n R
PD
(cm
)
RPD
Are
a
Num
ber
of M
ud C
last
s
Mud
Cla
st S
tate
(R
-Red
uced
, O
-Oxi
dize
d)
Met
hane
Pre
senc
e
Suc
cess
iona
l Sta
ge
OSI
Low
DO
?
Tot
al D
M A
rea
Voi
d #
Voi
d M
inim
um D
epth
(cm
)
Voi
d M
axim
um D
epth
(cm
)
Voi
d A
vera
ge D
epth
(cm
)
CO
MM
EN
T
Tot
al D
M M
in
Tot
al D
M M
ax
Toa
l D
M M
ean
L-14 A 14.59 07/01/04 8:22:49 11.40 11.68 11.52 168.12 0.29 >4 1 >4 1.17 4.08 2.62 38.24 0 - 0 Stage I on III 9 No 168.12 > 11.52 > 11.40 > 11.68 9 2.83 10.54 6.68
DM>P. Intensively bioturbated layered sandy silt/clay DM that now looks patchy because of bioturbation obscuring layering. Subsurface sediment riddled with void/burrow structures that are mostly active and oxidized. Tubes at SWI. Older DM.
L-14 B 14.59 07/01/04 8:23:58 11.08 11.82 11.60 169.23 0.74 >4 1 >4 0.63 2.11 1.22 17.86 0 - 0 Stage I on III 7 No 169.23 > 11.60 > 11.08 > 11.82 1 10.31 11.43 10.87
Layered DM>P. Large void at bottom . Sand lag at bottom of void and part of animal smeareed against faceplate in left-center bottom directly above the void. Thinly developed RPD and numerous tubes at SWI backgroun, nevertheless, SWI appear to have been disturbed by physical processes. Dm also appears older rather than recently deposited.
L-14 C 14.59 07/01/04 8:24:42 11.71 12.60 12.27 179.08 0.89 >4 1 >4 1.26 4.08 2.46 35.97 4 R 0 Stage I on III 9 No 179.08 > 12.27 > 11.71 > 12.60 1 2.48 4.34 3.41
Layered DM>P. DM appears to older. Relict RPD at bottom. Patches of orangish brow organic material in sediment column. Numerous tubes at SWI. SWI may have been recently physically disturbed. Unusual. Void in upper center and sediemnt-filled traces of burrow/void complex to right of void.
L-15 B 14.59 07/01/04 8:57:05 12.71 14.14 13.14 191.81 1.43 >4 1 4-3/>4 2.77 5.03 3.71 54.16 3 R 0 Stage I on III 10 No 191.81 > 13.14 > 12.71 > 14.14 3 2.77 9.80 6.28
DM>P. Dm is dark gray slightly sandy silt/clay. Little layering evident. Tubes at SWI. Active void in upper right and reduced, sediment filled voids in center. Three mudclasts smeared at SWI and are artifacts of sampling. Biogenic mound in center SWI.
L-15 C 14.59 07/01/04 8:58:29 13.34 13.68 13.54 197.58 0.34 >4 1 3-2/>4 3.68 5.57 4.65 67.87 5 R 0 Stage I on III 11 No 197.58 > 13.54 > 13.34 > 13.68 5 4.54 11.29 7.91
DM>P. Intensively bioturbated older layered DM. Void complex at right and several small voids in center and left that have sand lags. Upper portion of the sediment column is poorly sorted, silty, fine to medium sand. Two tube types present at SWI and epifauna visible in far background. Very nice polychaete smeared at upper left.
L-15 D 14.59 07/01/04 14:10:24 12.14 13.34 12.87 187.84 1.20 >4 1 3-2/>4 0.94 2.94 2.20 32.04 0 - 0 Stage I on III 8 No 187.84 > 12.87 > 12.14 > 13.34 0 - - -
DM>P. Medium sand at SWI. Layered DM - gray to dark gary organic slightly sandy silt/clay. Large burrow with oxidized sediment at left and burrow extend 11 cm below SWI. Outline of large polychaete in left center. Biogenic mound in center of SWI. Numerous fine mud tubes on biogenic mound. Detritus encrusted stick in background. Vestiges of relict RPD are apparent.
L-15 E 14.59 07/01/04 14:12:23 13.51 13.99 13.70 200.00 0.49 >4 1 >4 4.28 6.54 4.89 71.40 3 R 0 Stage I on III 11 No 200.00 > 13.70 > 13.51 > 13.99 1 3.66 7.11 5.38
DM>P. Layered old DM. Sediment-filled void complex in upper center. Relict RPDs. Several tubes at left SWI. Reduced mudclasts at SWI are sampling artifacts. Gastropod by mudclast at right SWI.
Monitoring Survey at the Western Long Island Sound Disposal Site June 2004 Appendix B-5 page 8 of 8