Embed Size (px)
Citation preview

PAVLOS VASILEIADIS
“EXPLORING THE IMPACT OF PROJECT MANAGEMENT IN THE
DEVELOPMENT OF NEW SERVICES IN HOSPITALITY INDUSTRY IN THE
UNITED KINGDOM”
MSc PROJECT MANAGEMENT
DISSERTATION
MANCHESTER METROPOLITAN UNIVERSITY BUSINESS SCHOOL


DISSERTATION
Academic Year 2013-2014
By
Pavlos Vasileiadis
MMU ID:13153959
Exploring the Impact of Project Management in the Development of New Services in
Hospitality Industry in the United Kingdom
Supervisor: Angel Salazar
28 August 2014
This dissertation is submitted in partial fulfilment of the requirements for the award of MSc
Project Management by Manchester Metropolitan University


Declaration
The author has not, whilst being registered for the Masters award, been a registered candidate
for another award of a university.
No material in this dissertation has been used in any other submission for an academic award.


Acknowledgements
First of all, I would like to acknowledge my parents Leonidas and Eleni Vasileiadou who
supported me financially and mentally throughout this intensive year of studying. Also, I
want to express my gratitude to my cousin Angeliki Kotsidou and her family. She is a unique
personality who provide me guidance and inspiration and I feel really lucky having this kind
of people to learn from.
This work was also supported by my friends in Manchester. Inna Karipidou, Guilherme
Parentoni, Camille Dillon, Anastasia Piatnicka, Syeed Rahman, Vardaan Sharma and Mohit
Salhotra, thank you all for helping me to adapt in a totally new environment here in
Manchester.
Special thanks to my course leader Lewis Endlar, a rare combination of a colorful personality
and great project management skills. He is undoubtedly an exceptional tutor with a unique
ways of teaching.
Finally, I would like to express my gratitude to my supervisor Dr. Angel Salazar. His
guidance and support was essential parts of this dissertation. His supervision and feedback
combined with his experience gave me the opportunity to create a unique piece of academic
work.
Pavlos Vasileiadis
28 August 2014
i | P a g e

ii | P a g e

Abstract
The purpose of this study is to examine the role of project management in the development of
new services in hospitality industry in United Kingdom and to propose a managerial
approach which will assist hospitality managers in the introduction of new services. The
research is concentrated around the theory of New Service Development (NSD) and its
correlation with Project Management. The methodology of the study is based on a three layer
analysis: exploring the impact of Project Management on new services, investigating the
areas of NSD with the Maturity Model and finally examining the service allocation in the
firm with the Balance Scorecard. The study is limited in one country, United Kingdom and
one industry, hospitality. The study adopts an open type questionnaire approach allowing the
participants, low and middle class managers to express freely their views. After testing the
hypothesis the study concludes that there is a link with project management and the
successful introduction of new services. Interpreting the above mentioned results with the
literature and the findings from the analysis part, the study develops a framework for the
development and introduction of new services in hospitality. The limitations of this
dissertation can provide ideas for future studies expanding the research of NSD and the
positive impact of project management in order to reduce the low success rates in the
development of new services.
Key Words: New Service Development (NSD), Project Management (PM), Maturity Model
(MM)
iii | P a g e
iv | P a g e
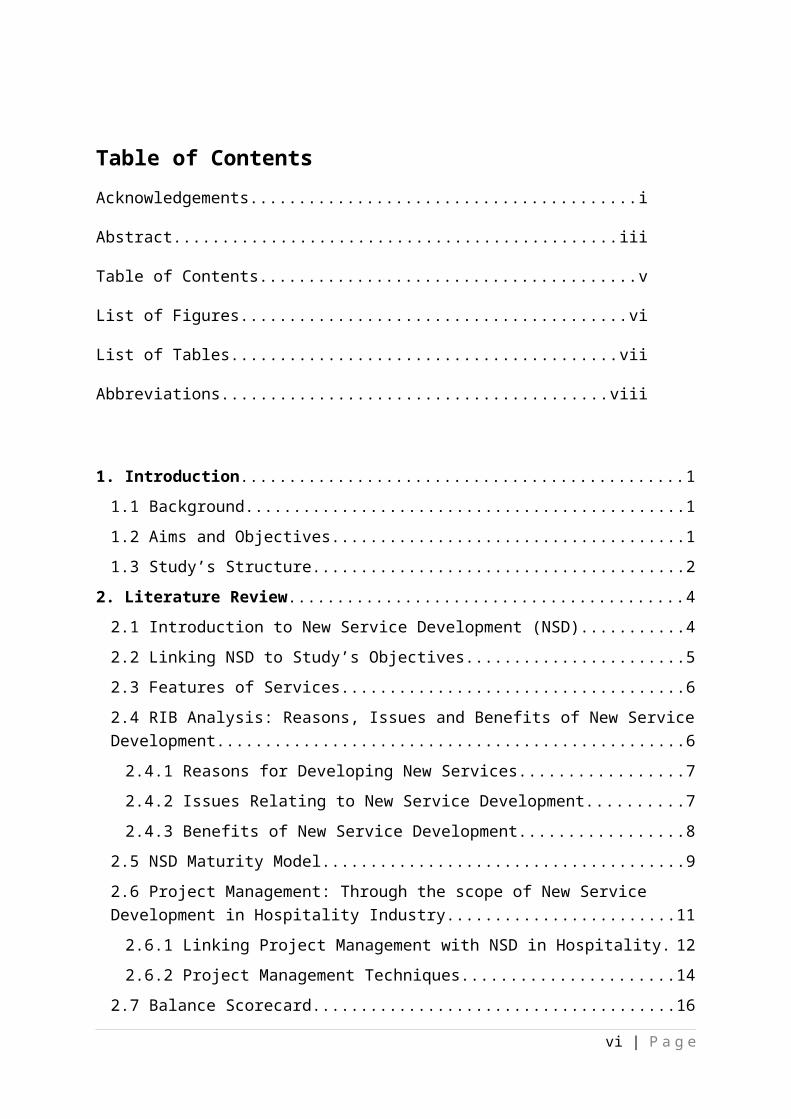
Table of Contents
Acknowledgements.........................................................................................................i
Abstract.........................................................................................................................iii
Table of Contents...........................................................................................................v
List of Figures...............................................................................................................vi
List of Tables...............................................................................................................vii
Abbreviations..............................................................................................................viii
1. Introduction..........................................................................................................................1
1.1 Background.......................................................................................................................1
1.2 Aims and Objectives.........................................................................................................1
1.3 Study’s Structure..............................................................................................................2
2. Literature Review.................................................................................................................4
2.1 Introduction to New Service Development (NSD)..........................................................4
2.2 Linking NSD to Study’s Objectives.................................................................................5
2.3 Features of Services..........................................................................................................6
2.4 RIB Analysis: Reasons, Issues and Benefits of New Service Development....................6
2.4.1 Reasons for Developing New Services......................................................................7
2.4.2 Issues Relating to New Service Development...........................................................7
2.4.3 Benefits of New Service Development......................................................................8
2.5 NSD Maturity Model........................................................................................................9
2.6 Project Management: Through the scope of New Service Development in Hospitality Industry.................................................................................................................................11
2.6.1 Linking Project Management with NSD in Hospitality...........................................12
2.6.2 Project Management Techniques.............................................................................14
2.7 Balance Scorecard..........................................................................................................16
3. Methodology.......................................................................................................................19
3.1 Chapter’s Structure.........................................................................................................19
3.2 Research Objectives.......................................................................................................20
v | P a g e

3.2.1 Interrelation between Objectives.............................................................................21
3.3Research Philosophy.......................................................................................................21
3.4Research Methodology....................................................................................................23
3.4.1 Options Rejected......................................................................................................23
3.5Research Design..............................................................................................................24
3.5.1 Questionnaire’s Structure........................................................................................24
3.5.2 Questionnaire Selection Criteria..............................................................................25
3.5.3 Mapping Methodological Approaches of other Authors.........................................26
3.6 Sampling Techniques.....................................................................................................27
3.6.1 Sampling Techniques Rejected................................................................................28
3.7 Data Collection...............................................................................................................28
3.7.1 Exploring Population Profile...................................................................................28
3.8 Data Analysis..................................................................................................................29
3.8.1The 5 Steps of Analysis Framework.........................................................................30
3.9 Ethical Considerations....................................................................................................31
3.10 Issues............................................................................................................................32
4. Analysis...............................................................................................................................34
4.1 Data Collection and Analysis Table...............................................................................34
4.2 Survey Results................................................................................................................35
4.3 Separating S/F Services..................................................................................................35
4.4 Project Management Techniques Analysis....................................................................36
4.4.1 Analysing PTCC......................................................................................................37
4.4.2 PTCC Best Practices................................................................................................38
4.4.3 Analysing PPMT......................................................................................................39
4.4.4 PPMT Best Practices...............................................................................................40
4.5 Confirming Hypothesis-Meeting 1st Objective...............................................................41
4.6 Maturity Model Analysis................................................................................................42
4.6.1 Analysing MM Variations.......................................................................................44
4.7 Balance Scorecard Analysis...........................................................................................45
4.7.1 Priority Formula.......................................................................................................45
4.8 NSD Managerial Approach – Meeting 2nd Objective.....................................................47
5. Discussion............................................................................................................................50
5.1 Discussion.......................................................................................................................50
5.2 Implications....................................................................................................................51
6. Conclusions.........................................................................................................................52
vi | P a g e
6.1 Conclusions....................................................................................................................52
6.2 Limitations......................................................................................................................52
6.3 Future Research..............................................................................................................53
References...............................................................................................................................55
Appendices..............................................................................................................................57
Appendix 1 -Timetable.........................................................................................................57
Appendix 2 - New Service Development Questionnaire.....................................................59
Appendix 3 – Cover Letter...................................................................................................63
List of Figures
(Figure 1) NSD Maturity Model, (Jin, et al., 2014)................................................................11
(Figure 2) Balance Scorecard (Nigel, 2005)...........................................................................18
(Figure 3) Interrelation between Objectives............................................................................21
(Figure 4) The Research Onion, (Saunders, et al., 2007)........................................................22
(Figure 5) Population choice..................................................................................................29
(Figure 6) Analysis Framework..............................................................................................30
(Figure 7) PTCC Chart Instructions........................................................................................37
(Figure 8) PTCC Chart............................................................................................................37
(Figure 9) PPMT Steps Definition..........................................................................................39
(Figure 10) PPMT Chart.........................................................................................................40
(Figure 11) NSD Maturity Model...........................................................................................43
(Figure 12) NSD Managerial Framework...............................................................................47
List of Tables
Table 1: Rationale of Topic Choice..........................................................................................5
Table 2: NSD Benefits..............................................................................................................9
Table 3: NSD Maturity Model (Based on Jin, et al., 2014)....................................................10
vii | P a g e
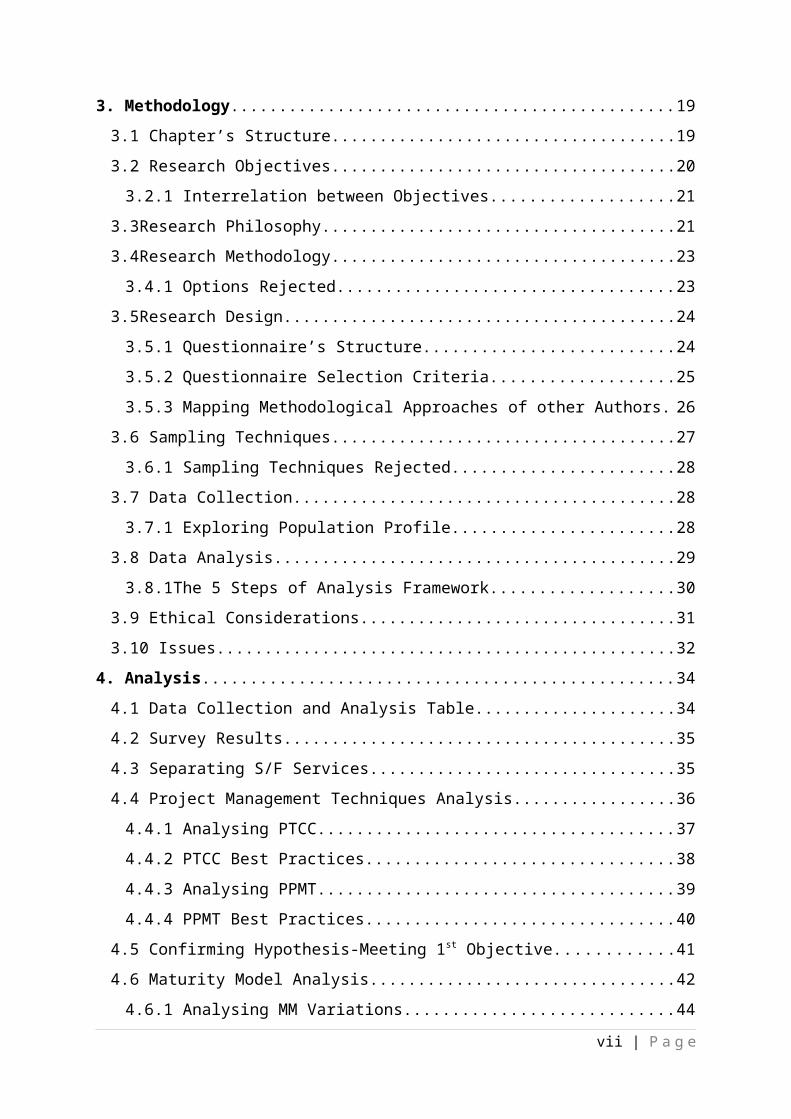
Table 4: BSC Benefits.............................................................................................................17
Table 5: Chapter’s Structure Table.........................................................................................19
Table 6: Questionnaire Structure.............................................................................................25
Table 7: Methodology Approach............................................................................................26
Table 8: Analysis Table...........................................................................................................34
Table 9: Results Table.............................................................................................................35
Table 10: S/F Table.................................................................................................................36
Table 10: Maturity Model Average Table...............................................................................44
Table 11: BSC Priority Table..................................................................................................46
Abbreviations
BSC: Balance Scorecard
HM: Hospitality Managers
HS: Hospitality Staff
MM: Maturity Model
NS: New Services
NPD: New Product Development
NSD: New Service Development
PL: Priority Level
PM: Project Management
S/F: Successful / Failed
viii | P a g e
1. Introduction
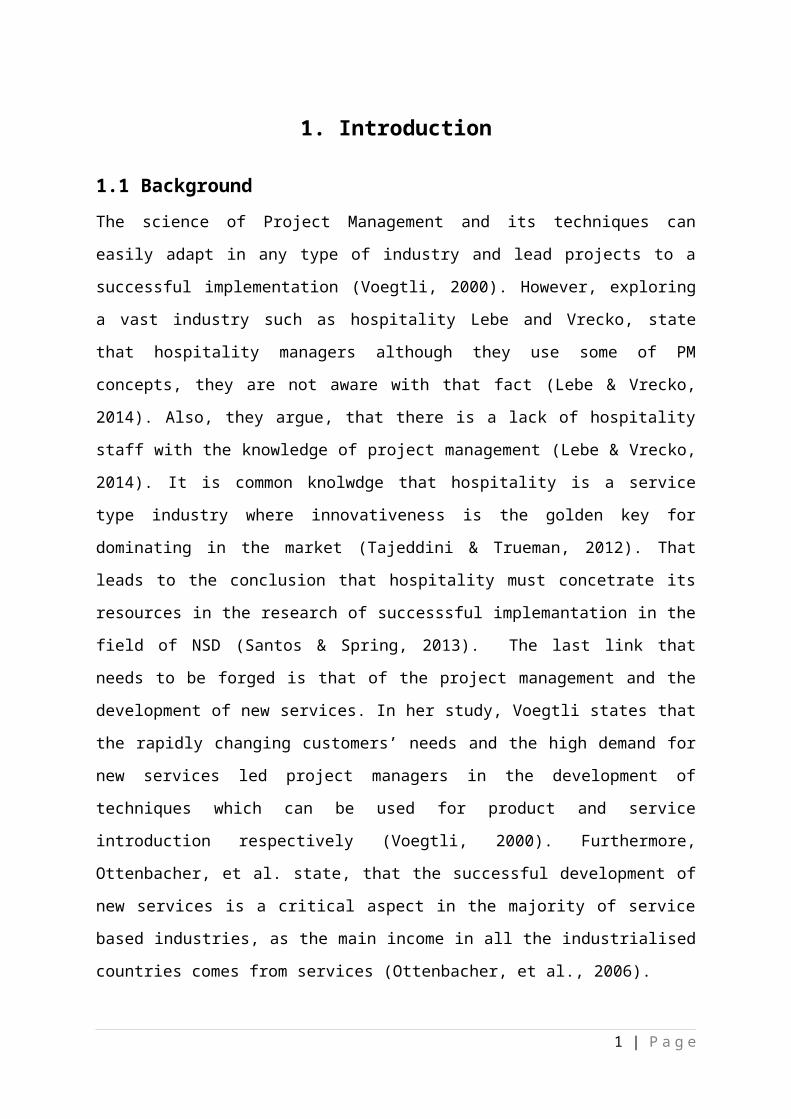
1.1 Background
The science of Project Management and its techniques can easily adapt in any type of
industry and lead projects to a successful implementation (Voegtli, 2000). However,
exploring a vast industry such as hospitality Lebe and Vrecko, state that hospitality managers
although they use some of PM concepts, they are not aware with that fact (Lebe & Vrecko,
2014). Also, they argue, that there is a lack of hospitality staff with the knowledge of project
management (Lebe & Vrecko, 2014). It is common knolwdge that hospitality is a service type
industry where innovativeness is the golden key for dominating in the market (Tajeddini &
Trueman, 2012). That leads to the conclusion that hospitality must concetrate its resources in
the research of successsful implemantation in the field of NSD (Santos & Spring, 2013). The
last link that needs to be forged is that of the project management and the development of
new services. In her study, Voegtli states that the rapidly changing customers’ needs and the
high demand for new services led project managers in the development of techniques which
can be used for product and service introduction respectively (Voegtli, 2000). Furthermore,
Ottenbacher, et al. state, that the successful development of new services is a critical aspect in
the majority of service based industries, as the main income in all the industrialised countries
comes from services (Ottenbacher, et al., 2006).
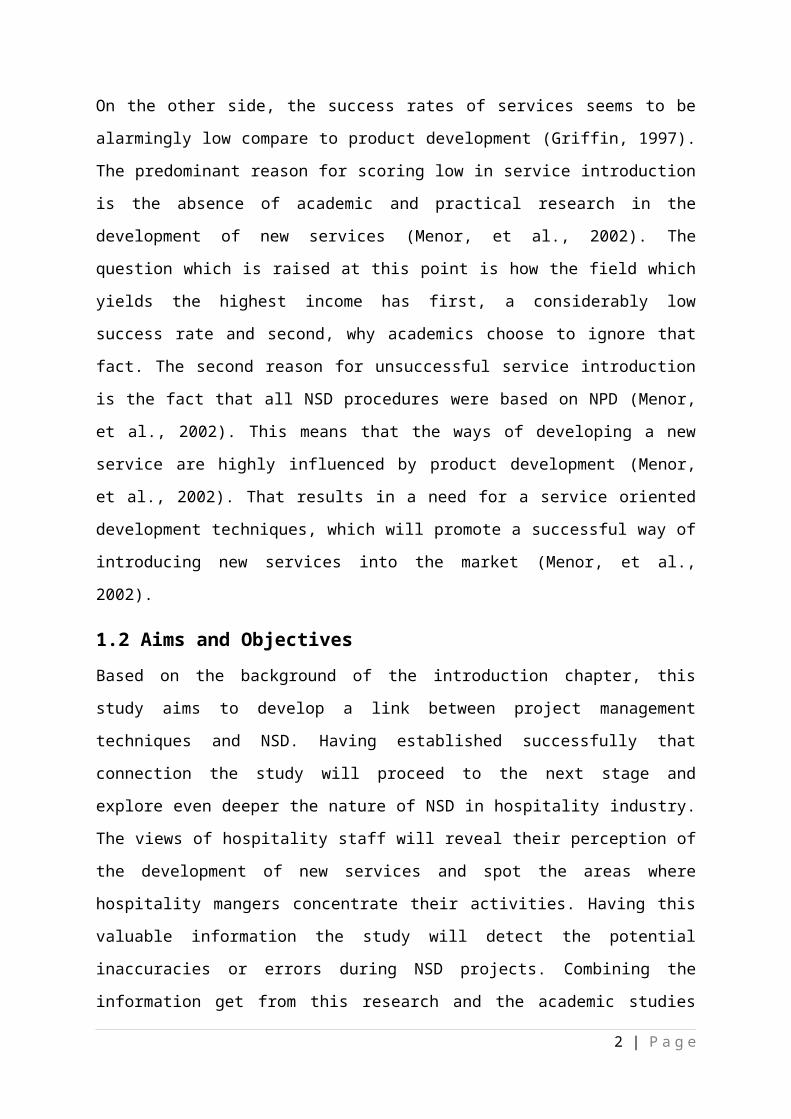
On the other side, the success rates of services seems to be alarmingly low compare to
product development (Griffin, 1997). The predominant reason for scoring low in service
introduction is the absence of academic and practical research in the development of new
services (Menor, et al., 2002). The question which is raised at this point is how the field
which yields the highest income has first, a considerably low success rate and second, why
academics choose to ignore that fact. The second reason for unsuccessful service introduction
is the fact that all NSD procedures were based on NPD (Menor, et al., 2002). This means that
the ways of developing a new service are highly influenced by product development (Menor,
et al., 2002). That results in a need for a service oriented development techniques, which will
promote a successful way of introducing new services into the market (Menor, et al., 2002).
1.2 Aims and Objectives
Based on the background of the introduction chapter, this study aims to develop a link
between project management techniques and NSD. Having established successfully that
1 | P a g e
connection the study will proceed to the next stage and explore even deeper the nature of
NSD in hospitality industry. The views of hospitality staff will reveal their perception of the
development of new services and spot the areas where hospitality mangers concentrate their
activities. Having this valuable information the study will detect the potential inaccuracies or
errors during NSD projects. Combining the information get from this research and the
academic studies the second aim of this dissertation would be to recommend a managerial
approach for successful service development. Highlighting the findings and revealing the best
practices the study will be able to back up the recommendation part as necessary. The
following list presents the objectives of the study and the under examination hypothesis:
Hypothesis: Project management techniques have a possitive impact on NSD in hospitality.
Objective 1: Investigate the impact of project management in the introduction of new
services in hospitality.
Objective 2: Recommend a managerial approach to hospitality managers for a successful
introduction of new services.
1.3 Study’s Structure
Introduction: This part introduces the main topic of the dissertation, the academic areas,
which will be research and the reason why, is it important to investigate those areas.
Literature Review: This chapter will assist the reader to familiarize with the concept of
NSD, PM and will present theories, which will be used later on the analysis part. This part of
the dissertation is critical as it is the column of the whole research and all the findings and the
recommendations are based on literature.
Methodology: The methodology explaining the research approach of the study and presents
the tools, which will be used later in the analysis part. The attention to the detail in this
chapter is essential since methodology is the plan on how to proceed in the analysis.
Analysis: In that, part the study proceeds to the actual interpretation of the data gathered
from the questionnaires. In order to be precise, analysis must be strictly referred to the
methodology part, which is based on literature. This way the study creates a chain, which
gives more gravity to the findings and recommendation.
2 | P a g e

Discussion: This chapter discuss the findings and links them to their predominant source
literature. Doing so, the study proves that everything went according to the original plan and
that the results of the analysis part are well established on facts and can be implemented in
real world environment.
Conclusion: The final chapter concludes all the findings and how the research came to an
end. In addition, that chapter present the limitations of the study and raise awareness by
proposing ideas for future research in the fields of NSD and PM.
References: The references list is based on the Harvard style of referencing.
Appendices: This part presents the questionnaire used for the survey, the cover letter, which
accompanied every email, sent to hospitality staff and the timetable of the dissertation.
3 | P a g e
2. Literature Review
2.1 Introduction to New Service Development (NSD)
“Any changes to the service concept that requires different competencies from the existing
operation can be considered a new service.”
(Menor, et al., 2002)
The fact that the service sector yields the highest income in all the industrialised countries is
not haphazard (Ottenbacher, et al., 2006), (Menor, et al., 2002) (Boukis, 2013). According to
Menor, et al. services firms report that 24.1% of total revenue was due to the introduction of
new services in the last 5 years (Griffin, 1997), (Menor, et al., 2002). Umashankar, et al.,
also add that economy has moved to a service driven approach as the impact of service
innovation in current market can become a competitive advantage (Umashankar, et al., 2011)
(Fitzsimmons & Fitzsimmons, 2000).
However, there was serious debate in terms of how hard is for other companies to immitate
new services introdused by competitors. In their study Ottenbacher, et al. state that NSD
generates value for the customers following the creation of competitive advantage for the
firm as it is harder to imitate new services (Ottenbacher, et al., 2006). In contrast, Jin, et al.
disagree with that opinion stating the exact opposite, that NSD projects require less
investment in any type of raw materials and that make them easier to be copied by
competitors (Jin, et al., 2014) (Fitzsimmons & Fitzsimmons, 2000).
Nevertheless, according to Griffin four out of 10 service projects fail to contribute to the
company having a success rate of only 58% (Griffin, 1997) (Kitsios, et al., 2009). There is
also lack in the literature to identify the right assessment techniques to evaluate and measure
the NSD processes (Jin, et al., 2014). In addition, Menor, et al. state that NSD is less
researched sector compared to new product development (NPD) and until recently managers
believed that new services “just happen” and not developing through the right processes in
order to fulfil customers’ needs (Menor, et al., 2002) (Kitsios, et al., 2009). Fitzsimmons and
Fitzsimmons expressed the same opinion in their book where the arthors state that there is a
limited empirical research in terms of how a new service is developed (Fitzsimmons &
Fitzsimmons, 2000). Furthermore, in their book Fitzsimmons and Fitzsimmons argue that in
majority companies just improve exested services and there is lack in knowledge of how to
create them from the ground (Fitzsimmons & Fitzsimmons, 2000).
4 | P a g e
In order to fully understand the concept of NSD and reach the objectives of this study,first
will be presented a link of every section of the NSD theory with the aims of the study. The
following part will present the features of services. After that will follow a RIB analysis
(Reasons, Issues and Benefits) concerning NSD. Following that, the literature review will
present the NSD Maturity Model which will also be used in the analysis of the data section.
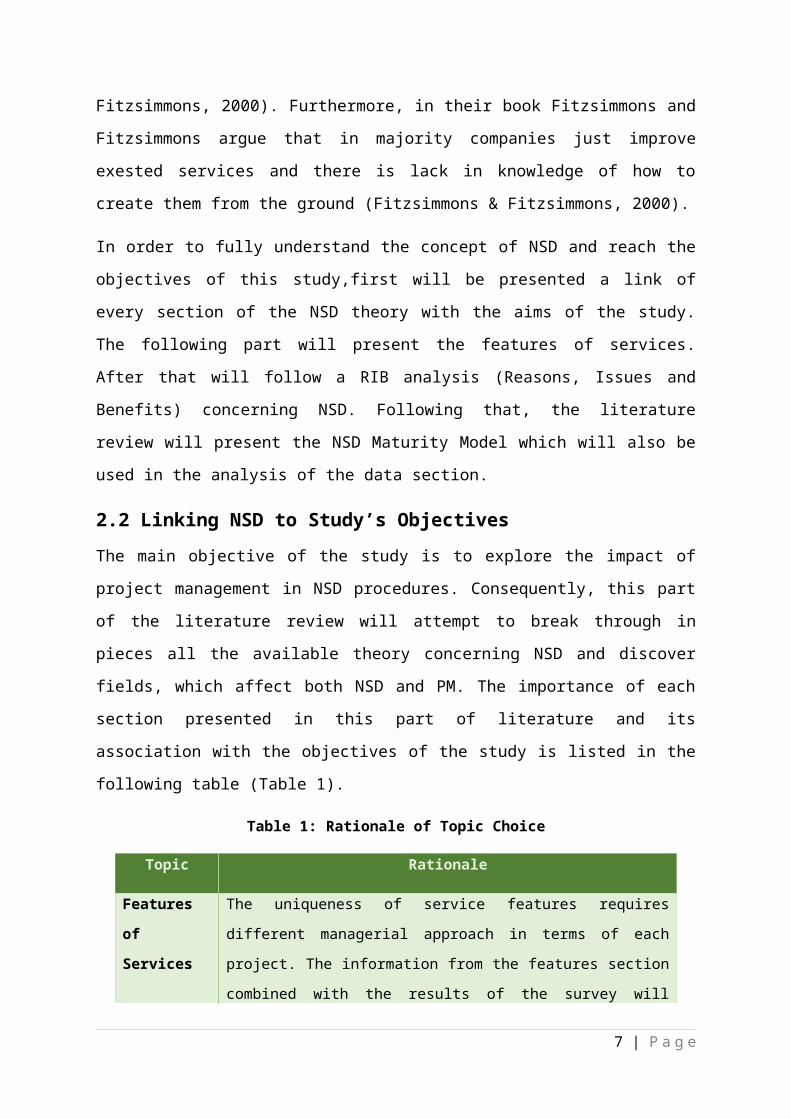
2.2 Linking NSD to Study’s Objectives
The main objective of the study is to explore the impact of project management in NSD
procedures. Consequently, this part of the literature review will attempt to break through in
pieces all the available theory concerning NSD and discover fields, which affect both NSD
and PM. The importance of each section presented in this part of literature and its association
with the objectives of the study is listed in the following table (Table 1).
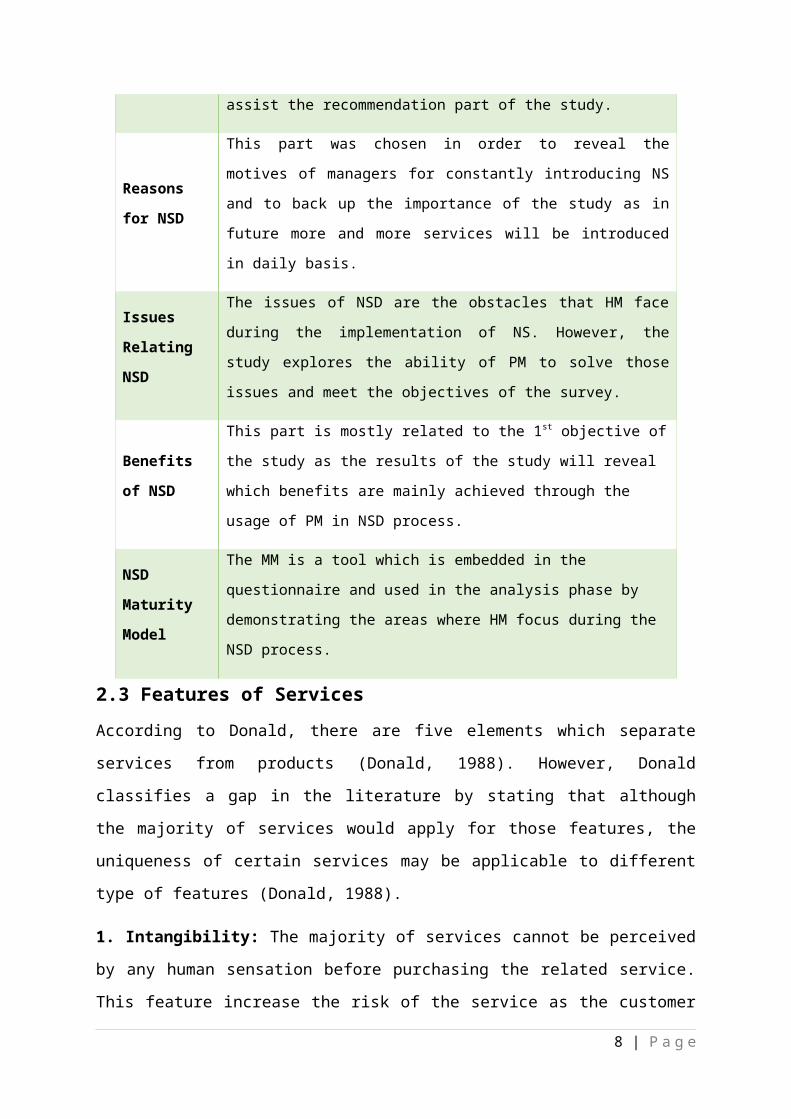
Table 1: Rationale of Topic Choice
Topic Rationale
Features of
Services
The uniqueness of service features requires different managerial approach
in terms of each project. The information from the features section
combined with the results of the survey will assist the recommendation part
of the study.
Reasons for
NSD
This part was chosen in order to reveal the motives of managers for
constantly introducing NS and to back up the importance of the study as in
future more and more services will be introduced in daily basis.
Issues
Relating NSD
The issues of NSD are the obstacles that HM face during the
implementation of NS. However, the study explores the ability of PM to
solve those issues and meet the objectives of the survey.
Benefits of
NSD
This part is mostly related to the 1st objective of the study as the results of
the study will reveal which benefits are mainly achieved through the usage
of PM in NSD process.
NSD
Maturity
Model
The MM is a tool which is embedded in the questionnaire and used in the
analysis phase by demonstrating the areas where HM focus during the NSD
process.
5 | P a g e
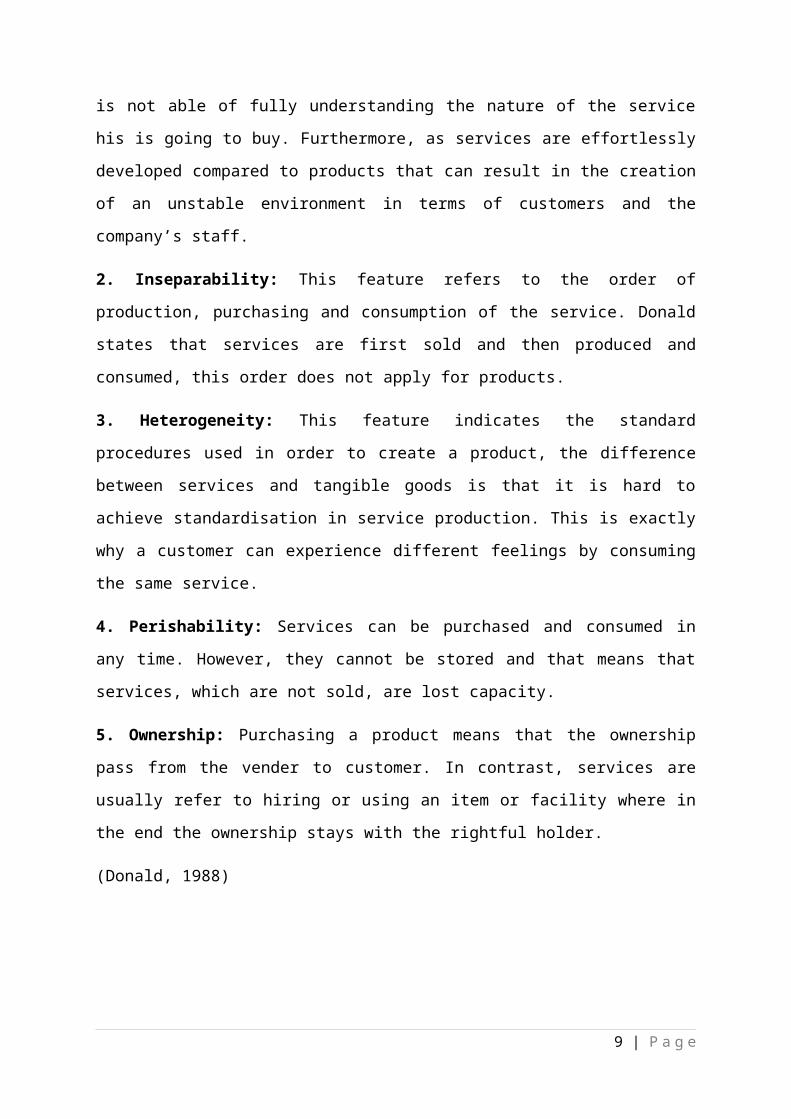
2.3 Features of Services
According to Donald, there are five elements which separate services from products (Donald,
1988). However, Donald classifies a gap in the literature by stating that although the majority
of services would apply for those features, the uniqueness of certain services may be
applicable to different type of features (Donald, 1988).
1. Intangibility: The majority of services cannot be perceived by any human sensation before
purchasing the related service. This feature increase the risk of the service as the customer is
not able of fully understanding the nature of the service his is going to buy. Furthermore, as
services are effortlessly developed compared to products that can result in the creation of an
unstable environment in terms of customers and the company’s staff.
2. Inseparability: This feature refers to the order of production, purchasing and consumption
of the service. Donald states that services are first sold and then produced and consumed, this
order does not apply for products.
3. Heterogeneity: This feature indicates the standard procedures used in order to create a
product, the difference between services and tangible goods is that it is hard to achieve
standardisation in service production. This is exactly why a customer can experience different
feelings by consuming the same service.
4. Perishability: Services can be purchased and consumed in any time. However, they cannot
be stored and that means that services, which are not sold, are lost capacity.
5. Ownership: Purchasing a product means that the ownership pass from the vender to
customer. In contrast, services are usually refer to hiring or using an item or facility where in
the end the ownership stays with the rightful holder.
(Donald, 1988)
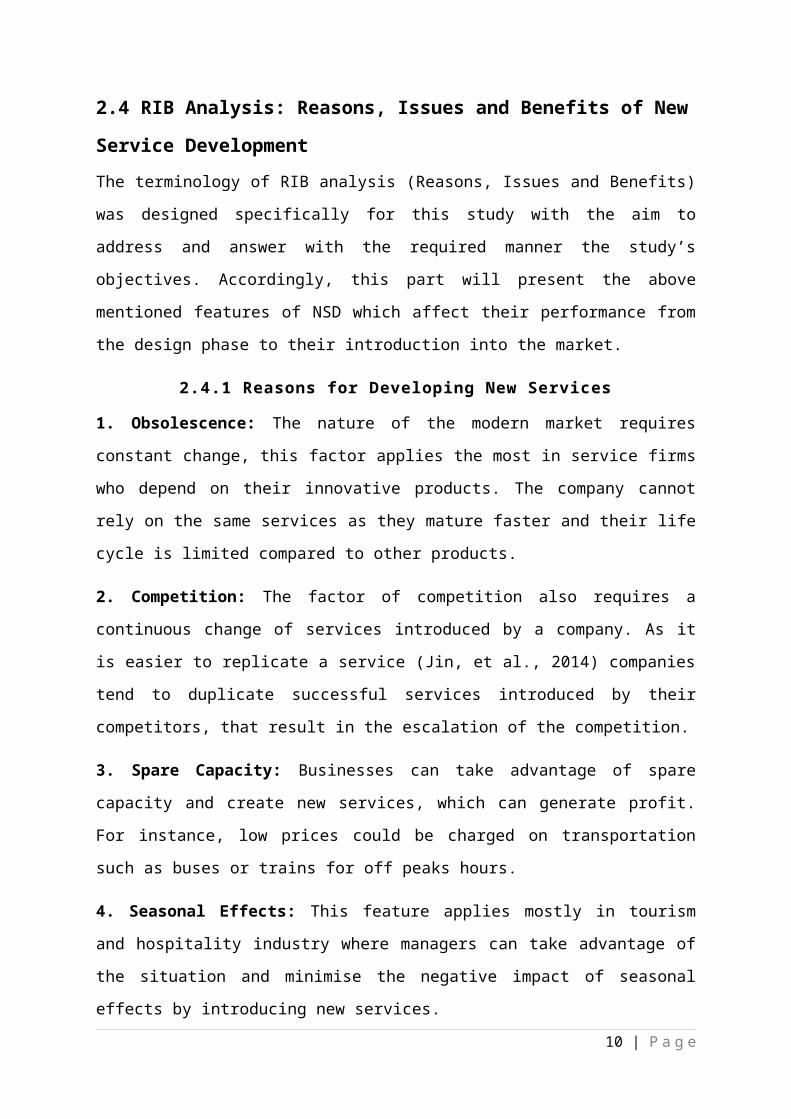
2.4 RIB Analysis: Reasons, Issues and Benefits of New Service
Development
The terminology of RIB analysis (Reasons, Issues and Benefits) was designed specifically for
this study with the aim to address and answer with the required manner the study’s
objectives. Accordingly, this part will present the above mentioned features of NSD which
affect their performance from the design phase to their introduction into the market.
6 | P a g e
2.4.1 Reasons for Developing New Services
1. Obsolescence: The nature of the modern market requires constant change, this factor
applies the most in service firms who depend on their innovative products. The company
cannot rely on the same services as they mature faster and their life cycle is limited compared
to other products.
2. Competition: The factor of competition also requires a continuous change of services
introduced by a company. As it is easier to replicate a service (Jin, et al., 2014) companies
tend to duplicate successful services introduced by their competitors, that result in the
escalation of the competition.
3. Spare Capacity: Businesses can take advantage of spare capacity and create new services,
which can generate profit. For instance, low prices could be charged on transportation such as
buses or trains for off peaks hours.
4. Seasonal Effects: This feature applies mostly in tourism and hospitality industry where
managers can take advantage of the situation and minimise the negative impact of seasonal
effects by introducing new services.
5. Risk Reduction: Introducing new services can decrease the burden of generating profit
from the main services of the company. The main services of the firm are usually responsible
for the majority of sales however, that can be a dangerous strategy and for that reason the
introduction of new services can promote risk reduction policies.
6. Opportunities: The constant change of customers’ needs can lead companies in new
markets and create new opportunities for profit. However, that requires market research and
understanding to exploit those opportunities before the competitors.
(Donald, 1988)
2.4.2 Issues Relating to New Service Development
Introducing a service is a challenging procedure from the moment of research and design to
the final moment of launching the service. In his study, Donald argues that service features
require “soft” qualitative data to be researched in order to create the right service offer
(Donald, 1988). Despite the fact that services are easier to replicate (Jin, et al., 2014) issues
may appear in any stage of NSD process cycle (Menor, et al., 2002). By purchasing a
product, Donald states that customers acquire service features as well, given that service
7 | P a g e
features are affecting consumers’ decisions and can leverage some related to them issues
(Donald, 1988).
1. Service Branding: Standardising the development procedure of new services can affect
the quality perception of the product. Consequently, the procedure of service branding would
become an issue, especially in the field of marketing.
2. Service Patents: In this part Donald argues that in terms of service development there are
no patents bound to the intangible nature of services and the only thing that protect a service
from being copied is trade names (Donald, 1988) (Jin, et al., 2014). As a result a life cycle of
a service even if its innovative is really short.
3. Service Warranty: The term of warranty refers to issues related to inseparability and
intangibility of a service. Although, it can be consider a cost and issue, warranty can be used
as a marketing tool in order to mitigate the impact of uncertainty and hesitation from the
customers.
4. Service After-Sales: Although the concept of after-sales service is more common in
tangible products, it can also be applicable to services. Issues may appear as customer’s
feedback will include the whole service delivered by the company and in the worce case
scenario a side-service can negatively affect the quality of the main service.
5. Service Functionality: Customer’s perception of a service quality is strongly associated to
the functionality of the related service since functionality affects customer’s satisfaction. The
second dimension of that issue concerns researchers and managers as they are the ones
responsible of addressing the problem of how to achieve effectiveness and productiveness in
NSD.
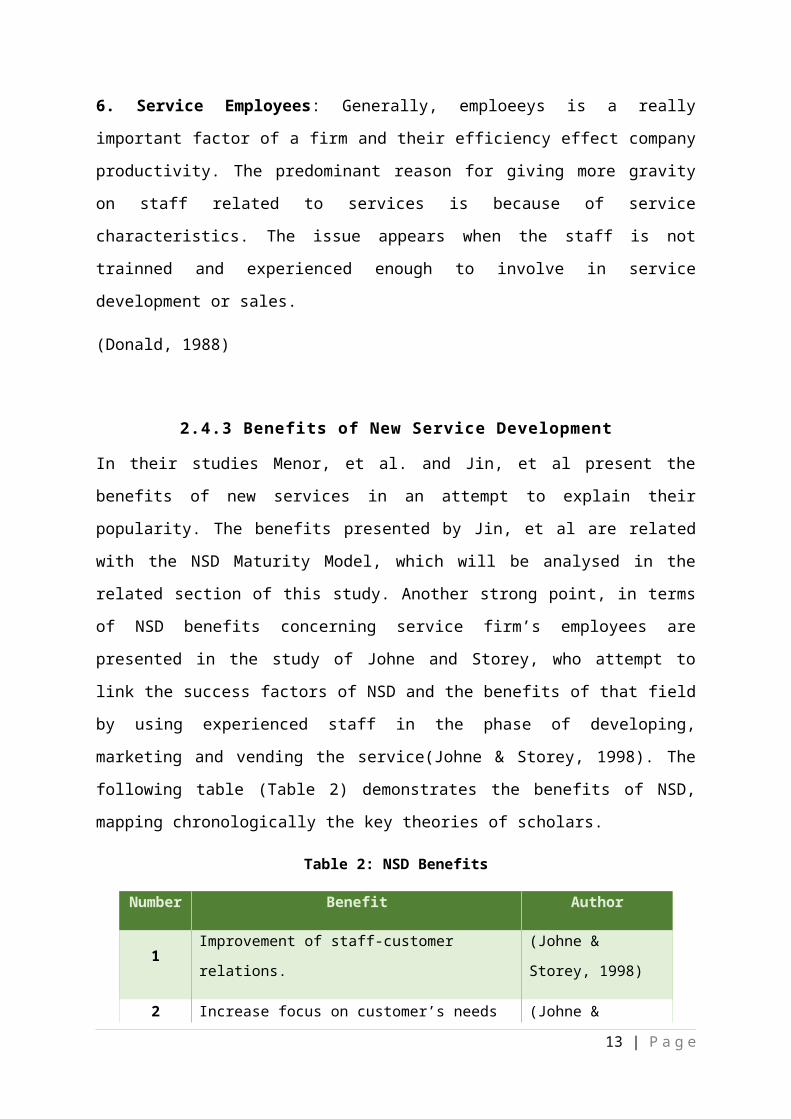
6. Service Employees: Generally, emploeeys is a really important factor of a firm and their
efficiency effect company productivity. The predominant reason for giving more gravity on
staff related to services is because of service characteristics. The issue appears when the staff
is not trainned and experienced enough to involve in service development or sales.
(Donald, 1988)
2.4.3 Benefits of New Service Development
8 | P a g e
In their studies Menor, et al. and Jin, et al present the benefits of new services in an attempt to
explain their popularity. The benefits presented by Jin, et al are related with the NSD
Maturity Model, which will be analysed in the related section of this study. Another strong
point, in terms of NSD benefits concerning service firm’s employees are presented in the
study of Johne and Storey, who attempt to link the success factors of NSD and the benefits of
that field by using experienced staff in the phase of developing, marketing and vending the
service(Johne & Storey, 1998). The following table (Table 2) demonstrates the benefits of
NSD, mapping chronologically the key theories of scholars.
Table 2: NSD Benefits
Number Benefit Author
1 Improvement of staff-customer relations.(Johne & Storey,
1998)
2Increase focus on customer’s needs and efficiency of
the service.
(Johne & Storey,
1998)
3Staff involvement increase probability of
implementation.
(Johne & Storey,
1998)
4 Identifying customer requirements. (Johne & Storey,
1998)
5 The attraction of new customers to the company. (Menor, et al., 2002)
6 Increasing the devotion of already existed customers. (Menor, et al., 2002)
7 Introducing new market opportunities. (Menor, et al., 2002)
8Increasing the effectiveness and profitability of
existing services. (Menor, et al., 2002)
9 Project flow improvement. (Jin, et al., 2014)
10 Every non-value added activity will be eliminated. (Jin, et al., 2014)
11 Miscommunication reduction. (Jin, et al., 2014)
9 | P a g e
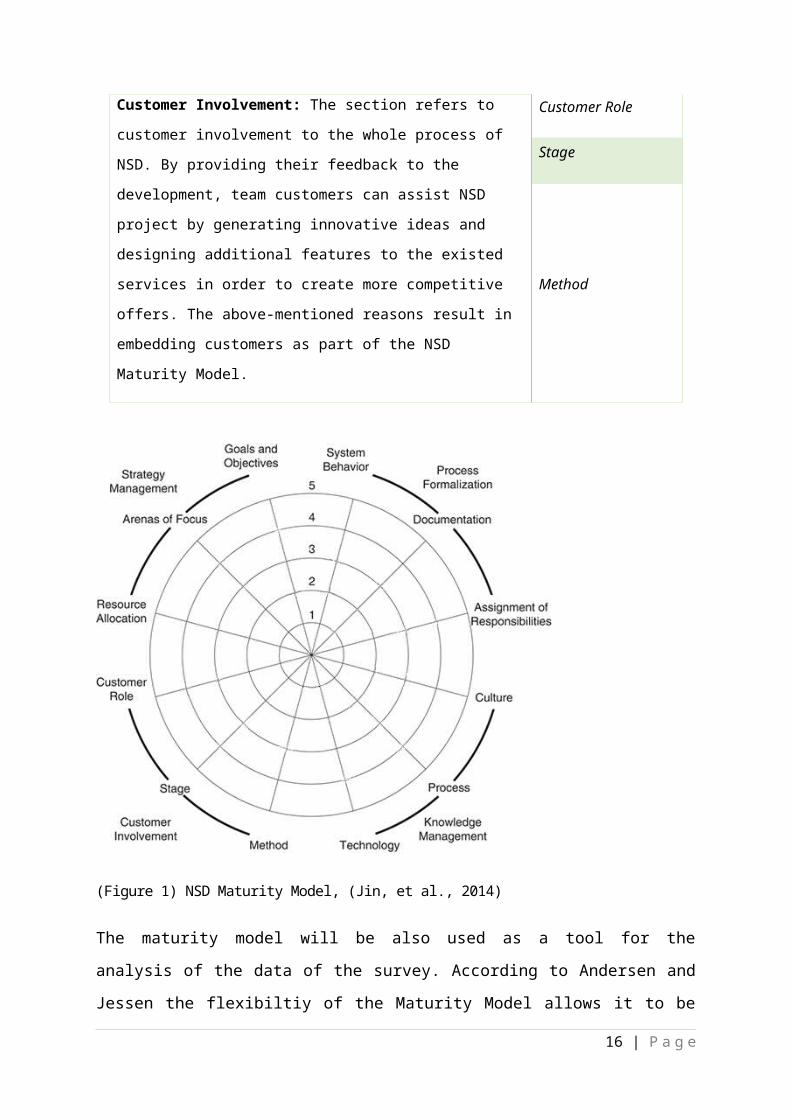
2.5 NSD Maturity Model
In order to demonstrate the way a development of a new service is distributed in the firm as
well as a conceptual framework to simplify service development the study will use the NSD
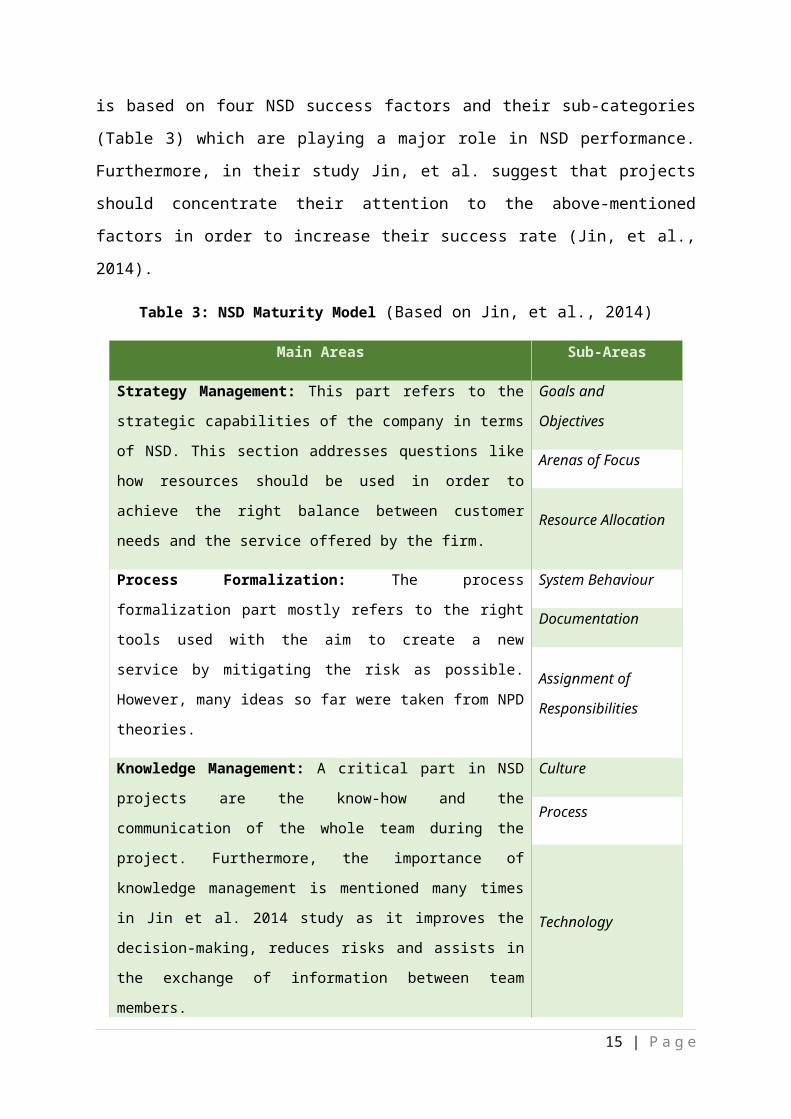
Maturity Model of Jin, et al. (Figure 1). The maturity model is based on four NSD success
factors and their sub-categories (Table 3) which are playing a major role in NSD
performance. Furthermore, in their study Jin, et al. suggest that projects should concentrate
their attention to the above-mentioned factors in order to increase their success rate (Jin, et
al., 2014).
Table 3: NSD Maturity Model (Based on Jin, et al., 2014)
Main Areas Sub-Areas
Strategy Management: This part refers to the strategic capabilities
of the company in terms of NSD. This section addresses questions
like how resources should be used in order to achieve the right
balance between customer needs and the service offered by the firm.
Goals and Objectives
Arenas of Focus
Resource Allocation
Process Formalization: The process formalization part mostly refers
to the right tools used with the aim to create a new service by
mitigating the risk as possible. However, many ideas so far were
taken from NPD theories.
System Behaviour
Documentation
Assignment of
Responsibilities
Knowledge Management: A critical part in NSD projects are the
know-how and the communication of the whole team during the
project. Furthermore, the importance of knowledge management is
mentioned many times in Jin et al. 2014 study as it improves the
decision-making, reduces risks and assists in the exchange of
information between team members.
Culture
Process
Technology
Customer Involvement: The section refers to customer involvement
to the whole process of NSD. By providing their feedback to the
development, team customers can assist NSD project by generating
innovative ideas and designing additional features to the existed
services in order to create more competitive offers. The above-
mentioned reasons result in embedding customers as part of the NSD
Maturity Model.
Customer Role
Stage
Method
10 | P a g e
(Figure 1) NSD Maturity Model, (Jin, et al., 2014)
The maturity model will be also used as a tool for the analysis of the data of the survey.
According to Andersen and Jessen the flexibiltiy of the Maturity Model allows it to be used
as ameasurement tool which can be applied in any kind of project (Andersen & Jessen, 2003).
Another strong point of that model is that it can easily display the areas where managers
focus their attention during the development of the new service. Combining that, with the
data available from the survey the study will try to prove that there is certain areas that need
more attention and they are critical for the successful implementation of new services in
hospitality industry.
2.6 Project Management: Through the scope of New Service Development
in Hospitality Industry
This part of the literature review links the concept of project management with New Service
Development (NSD) and hospitality industry. Although, it is hard to pair project and
hospitality management, according to Lebe and Vrecko many tasks of the tourism employees
require a (PM) approach (Lebe & Vrecko, 2014). Moreover, studies have shown that
11 | P a g e
although hospitality industry employees use PM techniques they are not aware of that fact
(Lebe & Vrecko, 2014). In view of these findings, the study explores the impact of a project
management approach in the field of NSD in hospitality industry. Additionally, there is a
limited amount of literature trying to link project and hospitality management. Given that,
pairing hospitality with project management will potentially become ground for future
research (Lebe & Vrecko, 2014). As already been mentioned before, according to Griffin
only 4 out of 10 service projects manage to succeed until the implementation stage (Griffin,
1997) (Kitsios, et al., 2009). The low success rate as well as the limited empirical research on
the junction of project management and NSD in hospitality is the driving force of that study.
The following section of literature review is divided into two main areas. The first part will
focus on the literature links of Project Management (PM) with the rest two main literature
areas of the study: New Service Development (NSD) and Hospitality Management (HM).
This part will present areas, which are considered common as well as key for the successful
implementation of PM, HM, and NSD. The second part will strictly concentrate on theory
based on the Project Management techniques, which would be embedded in the questionnaire
(Appendix 2) specially, designed for the purposes of the study.
2.6.1 Linking Project Management with NSD in Hospitality
“Project is a temporary endeavour undertaken to create a unique product or service.
Temporary means that every project has a definite end. Unique means that the product or
service is different in some distinguishing way from all similar products or services.”
“Project Management is the application of processes, methods, tools, knowledge, skills and
experience to achieve project objectives.”
(Burke, 2013)
In his book, Burke mentions eight types of projects: Constructing and Engineering, Military
and Aerospace, Offshore and Petrochemical, IT and Computer, Product Development,
Advertising and Marketing, Bank and Event projects (Burke, 2013). However, he doesn’t
mention anything about Service Development Projects which according to Griffin and
Menor, et al are responsible for the highest income in the majority of industrial countries
(Ottenbacher, et al., 2006), (Menor, et al., 2002) (Boukis, 2013). On that condition, there is
limited empirical research on the impact of project management on service development
12 | P a g e
projects especially in an industry as hospitality, which is based exclusively on services (Lebe
& Vrecko, 2014) (Hassanien, et al., 2010).
In terms of hospitality industry Ottenbacher, et al. state that specific services are highly
depended on customers than financial or legal sectors as these services directly influence a
customer’s existence (Ottenbacher, et al., 2006). Furthermore, in their study Ottenbacher, et
al. name features which are critical particularly in hospitality industry and managers should
consider them seriously before developing a new service.
Hospitality industry provide mainly people-focused services
The majority of the services are provided by the staff
Customer is the one who visits the service developer and provider
Employees are the most important factor of a service success
(Ottenbacher, et al., 2006)
In order to spot the common ground of project management and the development of new
services in hospitality industry first mutual areas of importance between those two fields
must be revealed. Given that the following four paragraphs refer to areas of great importance
for both PM and NSD.
Innovation and Quality: In his article Bryde supports that project management facilitate
innovation and that quality has an important role throughout the project, the same opinion
about innovation in terms of NSD were also expressed by Umashankar, et al., and
Fitzsimmons (Bryde, 2003) (Umashankar, et al., 2011) (Fitzsimmons & Fitzsimmons, 2000).
However, Edvardsson and Olsson argue that our knowledge of quality in terms of services is
still limited compared to products and that further academic research and action learning is
essential (Edvardsson & Olsson, 1996). Moreover, quality is a certain factor of the project
which needs to be instaled from the start in order to flurish along the way (Edvardsson &
Olsson, 1996).
Power of Employees: Regardless the project, people who are involved in it are responsible
for the success of the project. That means that staff is the key resource a firm possesses
(Edvardsson & Olsson, 1996) (Boukis, 2013) (Umashankar, et al., 2011) (Ottenbacher, et al.,
2006). However, Boukis states that there is limited knowledge of resource allocation in NSD
projects (Boukis, 2013). Referring exclusively to hospitality industry customers’ perception
13 | P a g e
in terms of quality is greatly influenced by their interaction with employees of the company,
additionally the intangible nature of the service turns to tangible due to staff and customer
interface (Boukis, 2013) (Edvardsson & Olsson, 1996) (Umashankar, et al., 2011). Another
strong point in Ottenbacher, et al study is their perception on the “power of employees” as a
success factor of NSD. Undoubtedly, hospitality employees affect directly on customers
satisfaction with a positive word-of-mouth and that customer-oriented staff produce high
quality service which are hard to be imitated by competitors (Ottenbacher, et al., 2006).
Organisation and Control: Another considerable area that project management and new
service development have in common is organisation and control. In order to be considered
successful a project or a service must be emanated from a define structure environment which
will promote responsibility and authority (Edvardsson & Olsson, 1996).
Resource Allocation: The terminology of resource allocation is more often related with
project management. Nevertheless, resource allocation is also a critical part of NSD projects
as it directly affects their efficiency and effectiveness (Boukis, 2013). Moreover, in his study
Boukis expands further on the areas of NSD affected by resource allocation saying that
innovation of NSD projects, higher cross-functional integration, conflict resolution and
team’s trust are all critically depended on right allocation of resources throughout the project
(Boukis, 2013) (Santos & Spring, 2013). However, Boukis also spots a gap in literature
stating that there are limited studies indicating the way of resource allocation and its
interrelation with the efficiency in projects (Boukis, 2013).
2.6.2 Project Management Techniques
It would be impossible to mention all project management techniques in this section, however
this study is going to present two core techniques of project management which would assist
later the research of the new service development. The first technique is related to Product
performance (P), Time-to market (T), Product cost © and Project Cost ©, (PTCC). The
reason for choosing this particular technique is that it is focused on the product and its
relation to the market and the customers (Voegtli, 2000).
Product Performance: This section is related to the functionality and the quality of the
service.
Time-to Market: How much time is needed to deliver the service to the costumers and in
how long will the company get benefits from that investment.
14 | P a g e
Product Cost: This type of cost involve the production and the installation cost as well as the
life cycle and the maintenance cost of the service.
Project Cost: This is the cost of the employees’ salaries as well any kind of equipment and
investments until the project reach the market.
(Voegtli, 2000)
That technique will be presented in steps with the aim to be easier for someone to read and
track the whole idea of the research.
Step 1: In the first part, the manager needs to spot the benefits to the costumer and the
company and create a plan to ensure the return of the original investment. That can be
achieved by understanding the four pillars of this technique PTCC.
Step 2: In that step, the team create a cost-benefits examination balancing the costumers with
the company’s needs.
Step 3: The manager should have a clear view of the costumers’ desires in order to create the
right service. This can be possible by conducting a survey or using any kind of tool, which
can give him the idea of what the costumers are willing to pay for.
Step 4: Involving the whole team with the project and trying to stick with the original plan.
This step ends only after the delivering of the project and it is really important since a slightly
change can bring unexpected results to the project.
(Voegtli, 2000)
The second tool is the Project Planning and Management Technique (PPMT), the
predominant argument for choosing this tool is because PPMT is directly related with project
control. As the study tries to prove the importance of project management in the development
of new services in hospitality industry, PPMT is a general tool, which is applicable in many
situations and suitable for this study’s research. Another strong point for using PPMT in this
study is the flexible structure of this tool, meaning that PPMT can be easily adjust and
become a part of the questionnaire in order to find how much of that technique hospitality
managers use.
According to Cortus the early involvement with that technique will allow managers and their
team to form complex questions which will eventually lead covering all the risk areas of the
project (Cortus, 1983). Although, Cortus also mentioning a drawback in this technique saying
that unrealistic goals and not following the right steps can lead the whole project to failure
15 | P a g e
(Cortus , 1983). Despite the fact that Cortus present twelve steps for that technique, he
mentioning that the diversity of a project could require different approach and as this study
focuses on service development not all of the steps would be presented. The following steps
of PPMT would be transformed into questions in the survey in order to measure the
percentage of managers who use this project management tool.
Step 1: Describing project objective in a detailed way in order to reduce the uncertainty and
define measurable goals.
Step 2: Writing all the tasks with all the appropriate information related to each task and
finding the links between them if possible.
Step 3: Separate all the tasks into two main categories, the ones which is depended with
others and the ones which cannot impact directly the outcome of the project.
Step 4: Defining the links between the task and estimating cost and time for each task
individually. By doing that a manager can estimate the total time and the labour cost for the
project.
Step 5: Numbering the event and putting all the independent events in a chart.
Step 6: The last step involves the documentation of the project such as presenting schedules
and plan diagrams as well as the formal document of the project.
(Cortus, 1983)
The same rationale is applied for both techniques meaning that the study will input the core
concepts of these tools inside the questionnaire in order to investigate in depth if hospitality
managers use PM techniques for introducing new services in their field.
2.7 Balance Scorecard
According to Sainaghi, et al. it is not an easy task to maintain a competitive advantage in this
market environment and there is a need for a tool, which can link the measurement of
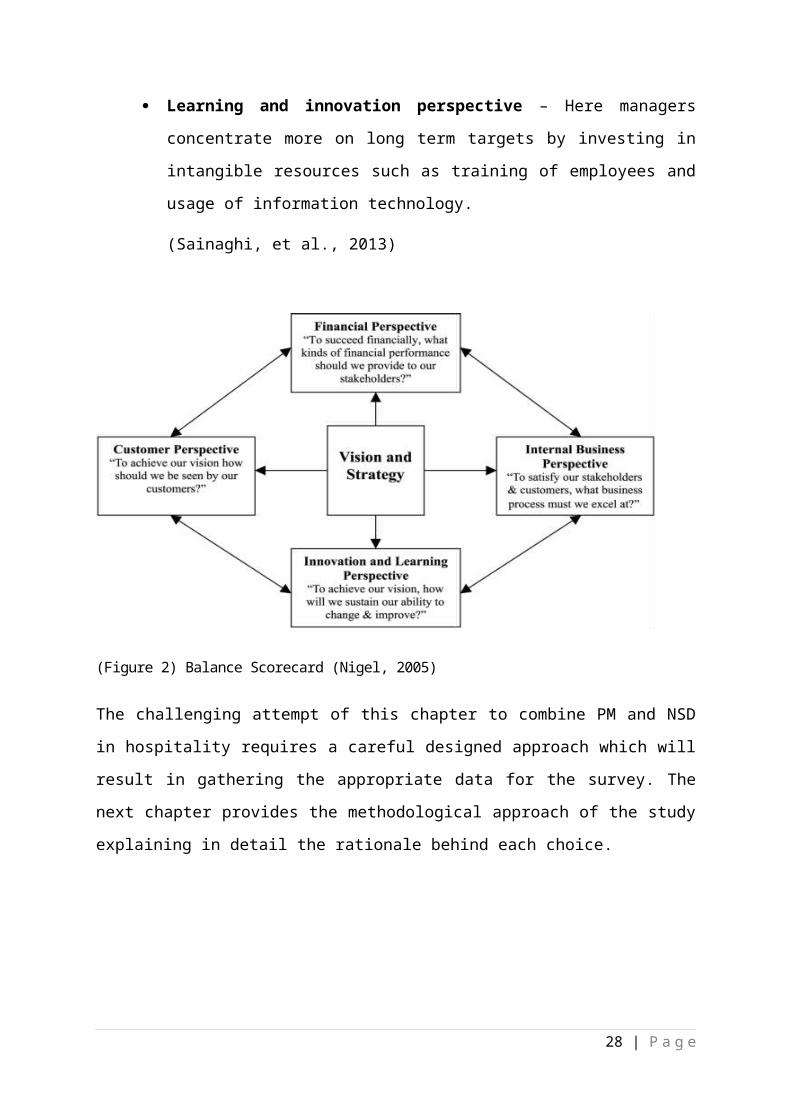
performance with firm’s strategy (Sainaghi, et al., 2013). Additionally, Nigel adds to that
statement that managers need a tool to measure organisation’s tangible goals and actions
(Figure 2) (Nigel, 2005). Both authors suggest that the right tool for that is the Balance
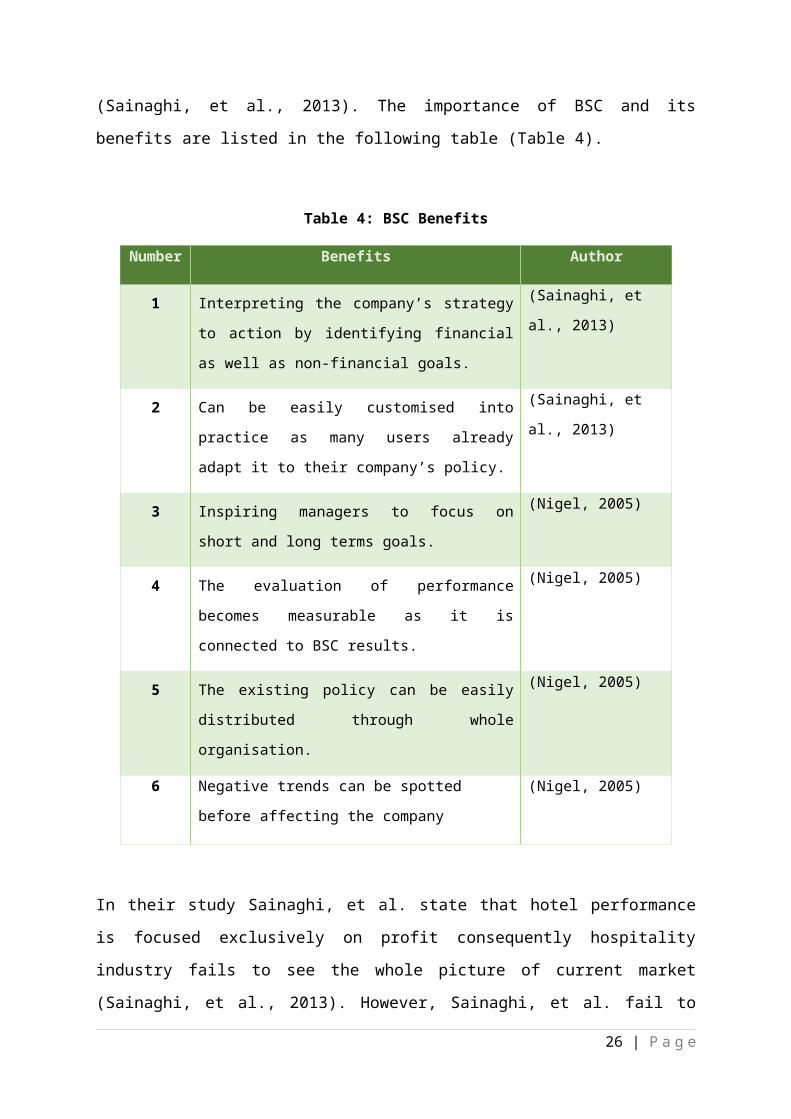
Scorecard (BSC) (Nigel, 2005), (Sainaghi, et al., 2013). The importance of BSC and its
benefits are listed in the following table (Table 4).
16 | P a g e
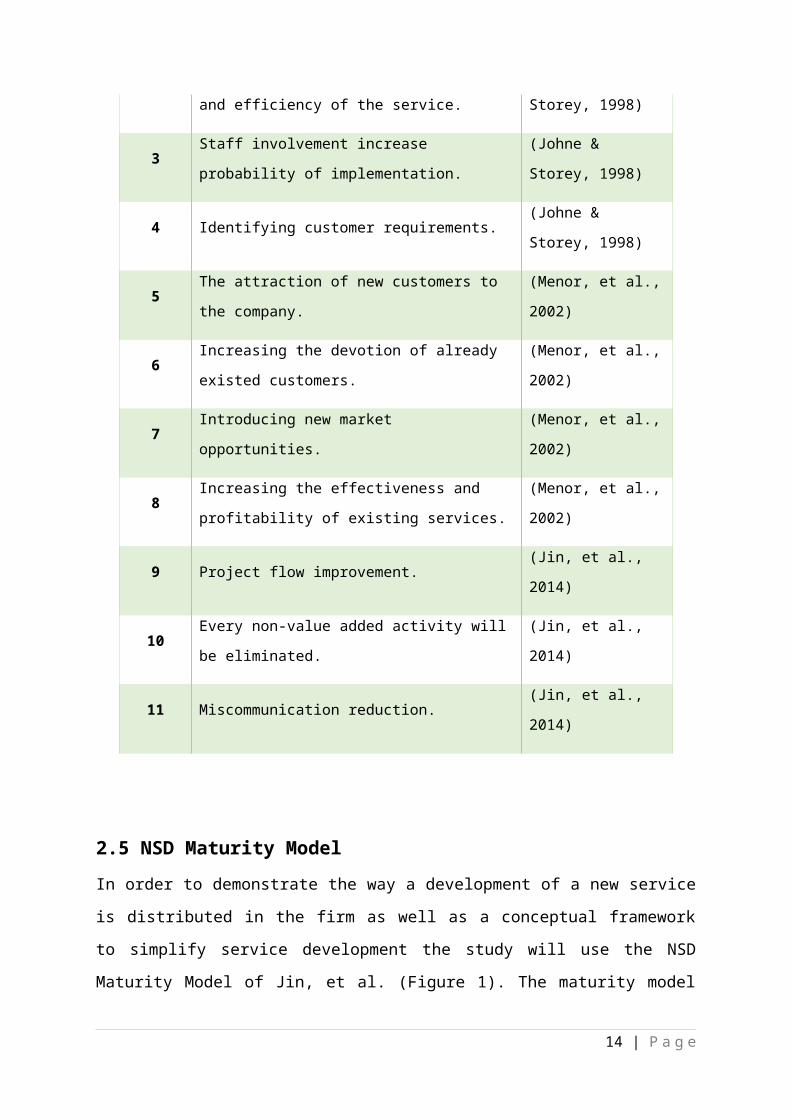
Table 4: BSC Benefits
Number Benefits Author
1 Interpreting the company’s strategy to action by
identifying financial as well as non-financial goals.
(Sainaghi, et al., 2013)
2 Can be easily customised into practice as many users
already adapt it to their company’s policy.
(Sainaghi, et al., 2013)
3 Inspiring managers to focus on short and long terms
goals.
(Nigel, 2005)
4 The evaluation of performance becomes measurable
as it is connected to BSC results.
(Nigel, 2005)
5 The existing policy can be easily distributed through
whole organisation.
(Nigel, 2005)
6 Negative trends can be spotted before affecting the
company
(Nigel, 2005)
In their study Sainaghi, et al. state that hotel performance is focused exclusively on profit
consequently hospitality industry fails to see the whole picture of current market (Sainaghi, et
al., 2013). However, Sainaghi, et al. fail to explain the reason of that phenomenon and how
that affect hotel performance. On the other hand Nigel tries to fill that literature gap by
adding that hotel managers not only focus on profit goals but also on short term goals and the
reason is the demanding targets by the hotel stakeholders and that senior managers tend to
ignore future oriented targets (Nigel , 2005). Furthermore, Nigel states that there is
inadequate literature focusing on hospitality industry (Nigel, 2005).
The study uses BSC as a final stage of the framework in order to demonstrate the allocation
of the new services in the hotels. The four pillars of BSC (Figure 3) are:
Financial perspective – The financial targets are commonly related to profit,
however, from the financial viewpoint a manager can indicate if there is any
improvement in the company from the implementation of the strategy.
17 | P a g e
Customer perspective – A manager gets a better understanding of market and
customer needs. The result will contribute to more loyal and more satisfied
customers, consequently to profitability of the company and positive word-of-
mouth.
Internal business perspective – Staff can identify the existing internal processes
and adapt them to organisation strategies. That will result in innovative
approaches to organisation, satisfied shareholders and financial returns.
Learning and innovation perspective – Here managers concentrate more on long
term targets by investing in intangible resources such as training of employees and
usage of information technology.
(Sainaghi, et al., 2013)
(Figure 2) Balance Scorecard (Nigel, 2005)
The challenging attempt of this chapter to combine PM and NSD in hospitality requires a
careful designed approach which will result in gathering the appropriate data for the survey.
The next chapter provides the methodological approach of the study explaining in detail the
rationale behind each choice.
18 | P a g e
3. Methodology
The previous part of the study presented the academic point of view of NSD and its
relationship with PM, in contrast this section refers on the methodological approach chosen
for data interpretation. Throughout the years, many different approaches have been preferred
in order to investigate the introduction of new services (Table 7). Nonetheless, the influence
of PM on this study requires a unique approach by constructing an open type questionnaire,
which concentrates its attention on the impact of knowledge and views of hospitality stuff.
3.1 Chapter’s Structure
There are nine main parts in the methodology excluding introduction and conclusion. Each
segment refers to a deferent field concerning the methodology. The following table (Table 5)
presents the main parts of methodology by order of appearance.
Table 5: Chapter’s Structure Table
Topic Description
Research objectives
This part introduces the hypothesis, which is tested in order to meet the
first objective. Furthermore, this part presents a diagram demonstrating
the interrelation between study’s objectives.
Research philosophy
This part analyses the 1st and the 2nd layers of the research onion making
clear to the reader which philosophical approach was chosen for this
research.
Research
methodology
The methodology part argues about the choice of quantitative over
qualitative approach, presents the options which were rejected and ends
with the analysis of the 3rd, 4th and 5th layer of the research onion.
Research design
This part reveals the disadvantages of an open-type questionnaire. In
addition, the design part presents in a table the structure of the
questionnaire and ends by mapping the methodological approaches of
other authors listing in chronological order.
Sampling techniques
This part explains the unique sampling technique, which was chosen for
the survey, as well as justifying the related option, which were rejected by
the researcher.
Data collection This part refers to the population of the study and explains the reason they
19 | P a g e
were chosen for the survey.
Data analysis
This is the most important part of the methodology as it presents the
analysis framework and clarifies systematically how the dissertation is
going to meet the objectives and recommend a new managerial approach.
Ethical
considerations
In this part, the ethical considerations of the study are analysed according
to the five main areas of Saunders, et al. which are highly possible to
affect the ethicality of the study (Saunders, et al., 2007).
Issues
This part presents some of the issues, which appeared during the study and
slightly, delayed the dissertation and the way those issues were addressed
by the researcher.
3.2 Research Objectives
As mentioned previously in the introduction part, this study has the following two objectives,
which adopt a combination of the deductive and inductive approach of research. The rationale
behind the merge of those two approaches is discussed in the next section “Research
Philosophy”.
Objective 1: Investigate the impact of project management in the introduction of new
services in hospitality.
Objective 2: Recommend a managerial approach to hospitality managers for a successful
introduction of new services.
According to the first step of Saunders, et al., deductive approach, the study forms a
hypothesis which is tested with the data gathered from hospitality managers through
questionnaires (Saunders, et al., 2007). In their research, Lebe and Vrecko argue that
hospitality industry tends to use PM techniques in NSD without being aware of that fact
(Lebe & Vrecko, 2014). As a result the following hypothesis was based on that part of
literature review.
Hypothesis: Project management techniques have a possitive impact on NSD in hospitality.
This hypothesis is based on the study of Lebe and Vrecko, were the aurtors state that
hospitality adopts PM techniques without being aware of that fact (Lebe & Vrecko, 2014).
However, the above mentioned researchers do not attempt to explore the impact of that
20 | P a g e
situation. Consequently, this study has the opportunity to research deeper a unique field by
testing the hypothesis.
3.2.1 Interrelation between Objectives
Consequently, testing this hypothesis leads the study to the 1 st objective. Owing to the fact
that PM has an effect on hospitality and following further the steps of Saunders, et al.,(2007)
deductive approach, the dissertation concludes with a reccomended framework for successful
service introduction which is the 2nd objective of the study. As a result the two objectives of
the study are linked together and the following figure (Figure 3) represends their interrelation.
(Figure 3) Interrelation between Objectives
3.3Research Philosophy
According to the research ‘onion’ (Figure 4) of Saunders, et al. the research philosophy
which is in the first layer of the picture is not something that a researcher can pick
conscienceless (Saunders, et al., 2007). In contrast, the study’s topic defines which
philosophical approach is more suitable for the purposes of the study (Blumberg, et al., 2011)
(Saunders, et al., 2007).
21 | P a g e
Step 5: Recommend Managerial approach
Step 4: Critical Interpretation with
Literature
Step 3: Rejecting/Confirming
Hypothesis
Step 2: Analyzing Data and Testing
Hypothesis
Step 1: Forming Hypothesis based
on Literature
(Figure 4) The Research Onion, (Saunders, et al., 2007)
1st Layer-Philosophies: The current study adopts the ‘Positivism’ approach for the following
reasons:
Data gathering will be based only on the phenomena, which is possible to be detected.
A hypothesis is formed and tested in the analysis part.
The collection of the data must not be affected by any mean by the researcher, who
has an external position in the data collection process.
(Saunders, et al., 2007)
2nd Layer-Approaches: As can be seen from the Interrelation between objectives (Figure 3)
the first objective meets the criteria of a deductive approach. However, the second objective
uses the outcome of the previous objective as an input in order to develop a theory. On that
condition, the second objective adopts the criteria of an inductive approach. According to
Saunders, et al. the combination of two approaches is possible and beneficial for the outcome
of the research (Saunders, et al., 2007).
22 | P a g e
3.4Research Methodology
The study adopts a mono-method quantitative approach, which in this occasion is open type
questionnaires. However, in order to clearly understand the rationale behind that choice first
the 3rd and the 4th layer of the research onion must be further analysed.
Quantitative over Qualitative: The study aims to explore the impact of project management
in a huge industry such as hospitality, given that the data, which will be used as an input in
order to meet the study’s objectives, must be reflected from the core of this industry.
Consequently, a qualitative approach would not be able to represent in a coherent manner the
general trend from a large sample. Additionally, due to the dead line of this dissertation a
qualitative approach as it requires more time would add unnecessary risk to the study.
3rd Layer-Strategies: Survey with an open type questionnaire.
3.4.1 Options Rejected
Case Studies: Case studies were rejected because they are considered to be isolated
incidents. Although those incidents occurred in hospitality industry, they cannot be counted
as valid information, which will represent the whole industry. Another fact for rejecting case
studies is simply because of the uniqueness of the topic and there were not sufficient
academic material to support the study.
Interviews: The predominant argument for not choosing interviews was the fact that this
action would minimize the sample in terms of data collection. Furthermore, interviews are an
approach, which could add more time to the survey. Another strong point is that the
researcher opinions could affect hospitality stuff in certain type of questions that would
introduce bias in the data gathering procedure.
Experiment: This option would reduce the variety of options and ultimately gather
information from a particular type of situation. On that condition, it would be impossible to
make recommendations for the purposes of the study solely based on one experiment.
4th Layer-Choices: As previously mentioned the study follows the mono-method, the
primary reason for rejecting the other options (mixed-methods and multi-methods) is the
structure of the methodology as a whole and the interrelation between the objectives (Figure
3). By choosing a mixed or multi-method would require additional time and would affect the
23 | P a g e
correlation between the study’s objectives. As a result, in order to avoid unnecessary risk
those two alternatives were rejected.
5th Layer-Time Horizons: In terms of time horizons the study is in the category of Cross-
sectional studies. The topic of this dissertation requires the investigation of the impact of
project management in hospitality as it is these days meaning that the conclusions will allow
managers to improve their decisions in the field of NSD. On the other hand, longitudinal
studies require more time and their focus is primarily on events occurring in that time
(Saunders, et al., 2007). The second reason for rejecting that choice is that this study is a
dissertation project with a deadline.
3.5Research Design
The structure of the questionnaire is based as well on the Interrelation between Objectives
(Figure 3) as the order of the questions and their logic covers the link of study’s objectives.
Furthermore, the questionnaire is an open-type meaning that the majority of the questions are
essay type and allows the participant to express freely their opinions (Fisher, et al., 2007).
Disadvantages of open-type questionnaires:
The first drawback of that type is that hospitality stuff requires spending more time to
answer the survey.
The second issue is that the response rate of open-type are lower than other types of
questionnaires.
(Fisher, et al., 2007)
An alternative was a pre-coded type of questionnaire where the majority of questions are the
tick-box questions. Usually, the response rate is higher than the open-type, however one
major drawback is that pre-coded questionnaires introduce higher rates of bias than the
previous type (Saunders, et al., 2007).
3.5.1 Questionnaire’s Structure
The questionnaire has 6 blocks, each part reflects on previous discussions of literature review
and the total number of questions displayed in the survey is 26 (Appendix 2).
24 | P a g e
Table 6: Questionnaire Structure
Block Question Elucidation
Block 1 (Q1 – Q4)These are general questions, which query the participants about their role
in the company and few details about the firm itself.
Block 2 (Q5 – Q10)These questions aim to explore the relationship of the participants with
NSD and the allocation of those services in the company.
Block 3 (Q11 – Q15)This part is solely focused on the participants’ opinion on the fields of the
Maturity Model (Figure 1).
Block 4 (Q16 – Q19)This section refers to the first PM technique: Product performance (P),
Time-to market (T), Product cost © and Project Cost ©, (PTCC).
Block 5 (Q20 – Q25)Following that is the questions related to the second PM technique:
Project Planning and Management Technique (PPMT).
Block 6 (Q26)This is the last question, which asks the participants to provide further
comments concerning hospitality industry and feedback for the survey.
3.5.2 Questionnaire Selection Criteria
The questionnaire was sent to 242 hotel throughout United Kingdom, however no response
was recorded as primary data unless it met all four of the following selection criteria.
Furthermore, the study has a second category of responses, which is recorded as secondary
data, and it refers to participants who met two or three selection criteria. The responses,
which met one or no selection criteria, were disqualified from the analysis phase. The
predominant argument for establishing criteria is to gather data, which would allow the
dissertation to test the hypothesis according to the methodological path. In order a
questionnaire to be selected, a participant must answer:
1. The last question of Block 1
2. The first three questions of Block 2
3. All Block 3
4. At least one or two questions from Block 4 and Block 5
For further information on the questionnaire, refer to Table 6 or Appendix 2
25 | P a g e
3.5.3 Mapping Methodological Approaches of other Authors
Presenting merely this study’s approach in terms of data collection is not sufficient to form a
grounded opinion on how NSD was researched throughout the years. In order to fill that gap,
the following table presents in chronological order the methodological approach of relevant
studies concerning hospitality industry and NSD. As can be seen from the table the majority
of studies are based on interviews followed by questionnaires. However, worth mentioning is
that recently there is a switch to case studies as researchers tend to explore specific aspects of
NSD.
Table 7: Methodology Approach
Author Title Approach
(Kay & Russette,
2000)Hospitality-management competencies Interviews
(Ottenbacher, et
al., 2006)
Identifying determinants of success in
development of new high-contact services
Insights from the hospitality industry
Questionnaires targeting
hospitality managers
concerning NSD
(Kitsios, et al.,
2009)
Evaluation of NSD strategies using multi-
criteria analysis: predicting the success of
innovative hospitality services
Depth structure
interviews accompanied
by questionnaires
(Konu, et al.,
2010)
Lake Wellness: a practical example of a NSD
concept in tourism industries
Interviews from local
businesses
(Umashankar,
et al., 2011)
Developing Customer Service Innovations for
Service Employees: The Effects of NSD
Characteristics on Internal Innovation
Magnitude
Hypothesis tested by
individual interviews
(Tajeddini &
Trueman, 2012)
Managing Swiss Hospitality: How cultural
antecedents of innovation and customer-
oriented value systems can influence
performance in the hotel industry
Hypothesis tested by
questionnaires
(Boukis, 2013)Identifying some internal S/F factors of NSD
project performance
Developing proposition
backed up by literature
review
(Santos & New service development: managing the Analysis of case studies
26 | P a g e

dynamic between services and operations
resources
(Jin, et al., 2014) New service development maturity model
Testing hypothesis by
analysing successful
case studies
3.6 Sampling Techniques
Owing to the fact that reliable results can be achieved through the right selection of sampling
techniques the study adopts a fusion of cluster and stratified technique (Blumberg, et al.,
2011). The predominant reason for rejecting census was the large population and as the
elements of that population are fixed, there was no need for choosing census for data
collection. The following three steps demonstrate the framework of the chosen technique.
1. The population will be divided into many sub-groups in order to ease data
collection (Cluster Sampling)
The population, which in this study is within hospitality industry, were
divided by cities as sub-groups.
2. Secure homogeneity within sub-groups and heterogeneity between sub-groups.
( Stratified Sampling)
Homogeneity within groups indicates the common identity of all elements and
heterogeneity indicates each city.
3. Randomly choice of sub-groups and elements within each sub-groups.
( Combination between Cluster & Stratified Sampling)
The last step clarifies that each city and the hotels-elements were randomly
chosen from the following web sites: (ACCORHOTELS.COM, 2012) and
(HFind.com, 2014).
(Blumberg, et al., 2011)
3.6.1 Sampling Techniques Rejected
27 | P a g e
Random: That option was rejected because the sample of the survey needs to be specific
restricted to hospitality stuff.
Double: This technique is time consuming and does not guarantee to present the right
information in order to indicate the sample. Furthermore, the structure of study’s objectives
will not facilitate data collection with this technique.
Convenience: This option was rejected because of the restricted nature of the sample, as it
has to be hospitality stuff.
Purposive: This sampling technique was estimated to be the more preferable however, the
chamber of commerce did not provide the information needed for the research. (See
Limitations paragraph).
Snowball: This technique requires the cooperation of HM consequently that will increase
risk and time conducting the study as they may chose not to participate.
(Blumberg, et al., 2011)
3.7 Data Collection
The distribution and the collection of the questionnaires was conducted by Qualtrics Online
Survey Software (Qualtrics.com, 2014). The distribution was conducted via email
accompanied by a cover letter (Appendix 3). The predominant argument for choosing this
software was the analysis tools that Qualtrics possess. Furthermore, the before mentioned
software had no restriction for the number of questions and replies as it was free for
Manchester Metropolitan Students. This aspect reduced the general expenses of the survey.
3.7.1 Exploring Population Profile
One of the most important factors for the success of this survey is the population profile in
terms of data collection. The questionnaire targets HM and in general hospitality stuff who
contribute and participate in any type of service development in the company. The
department where the hospitality stuff is occupied does not affect the outcome of the survey
as long the population meets the first criteria of involving themselves with the introduction of
new services. The population is geographically dispersed throughout the United Kingdom
and the questionnaire was distributed to 242 hotels. The following figure (Figure 5)
demonstrate the rationale behind population choice.
28 | P a g e
(Figure 5) Population choice
3.8 Data Analysis
The analysis of the data becomes a complicate procedure, as the interrelation between
objectives requires a certain breakdown approach. Owing to that fact, the following analysis
framework (Figure 6) demonstrates in a coherent manner the analysis process starting from
data collection till the forge of recommendation. Furthermore, the below framework indicates
in which step the study meets the 1st and the 2nd objective.
29 | P a g e
This target group is more likely to
participate in NSD as HM introduce new
services to meet targets and HS improve them
through feedback processing
Purchase the available services, provide feedback according their satisfaction
The driving force of managers, following the lead and execute
their tasks
Accept the responsibility of meeting firm’s targets,
transform ideas into action
Set firm’s targets & goals represent the philosophy of
the company
Costumers
Hospitality Managers
Hospitality Staff
Higher Management
Step 1: Data Collection and Analysis
(Figure 6) Analysis Framework
3.8.1The 5 Steps of Analysis Framework
Step 1: The data is collected and categorised based on the selection criteria. The categorised
data provide additional information and conclude in more specific recommendation.
Step 2: This particular step divides the services into two groups. The first list includes
services, which were successfully introduced in the market and generated profit to the
company. In contrast, the second list contains the less successful services developed by
managers. This part is extremely important as it links with the PM techniques part, doing so,
the study has a clear picture of the impact of project management in the introduction of new
services.
30 | P a g e
Step 3: This part is solely focused on the PM techniques used by HM and HS. At this point
the data will be analysed with the information collected in Step 2 allowing the research to
confirm or reject the hypothesis and meet the first objective.
Step 4.1: The MM apart from measuring tool can also compare different managerial
approaches. In this part, MM is used for comparing S/F service introductions based on Step
2. Knowing which strategy was the most successful allows MM to reveal areas where
managers focus their actions. That also gives more gravity in the recommendation part of the
dissertation.
Step 4.2: The four areas of balance scorecard are: financial, customer, internal business and
innovation and learning. This step goes deeper in the research from its predecessor step 2 by
calculating the percentages of service allocation based on S/F projects. In this way, the study
exposes favourable target areas. Questions like why managers allocate their new services in a
specific area and how that affect the success of the company can be raised. This information
can provide ground for future research.
Step 5: The outcome of Step 4.1 and Step 4.2 allows the study to proceed into the
recommendation part by proposing a managerial approach.
3.9 Ethical Considerations
The participants of the study were informed in detail about the purposes of this research by
the cover letter (Appendix 3) which also contained the link to the questionnaire as well as the
contact details of the researcher. The cover letter was designed according to Business
Research Methods (Blumberg, et al., 2011).
According to Saunders, et al. there are five areas which can possibly affect the ethicality of
the study: 1) research topic, 2) research design, 3) data collection, 4) data analysis and 5) data
presentation (Saunders, et al., 2007).
Research Topic: The topic and the purposes of the study were clearly stated to the
participants and by no mean people who voluntary participate in the data collection process
have been deceived.
Research Design: The design of the questionnaire promotes confidentiality and participants
were informed that their views would be used only for academic purposes of this dissertation
project.
31 | P a g e
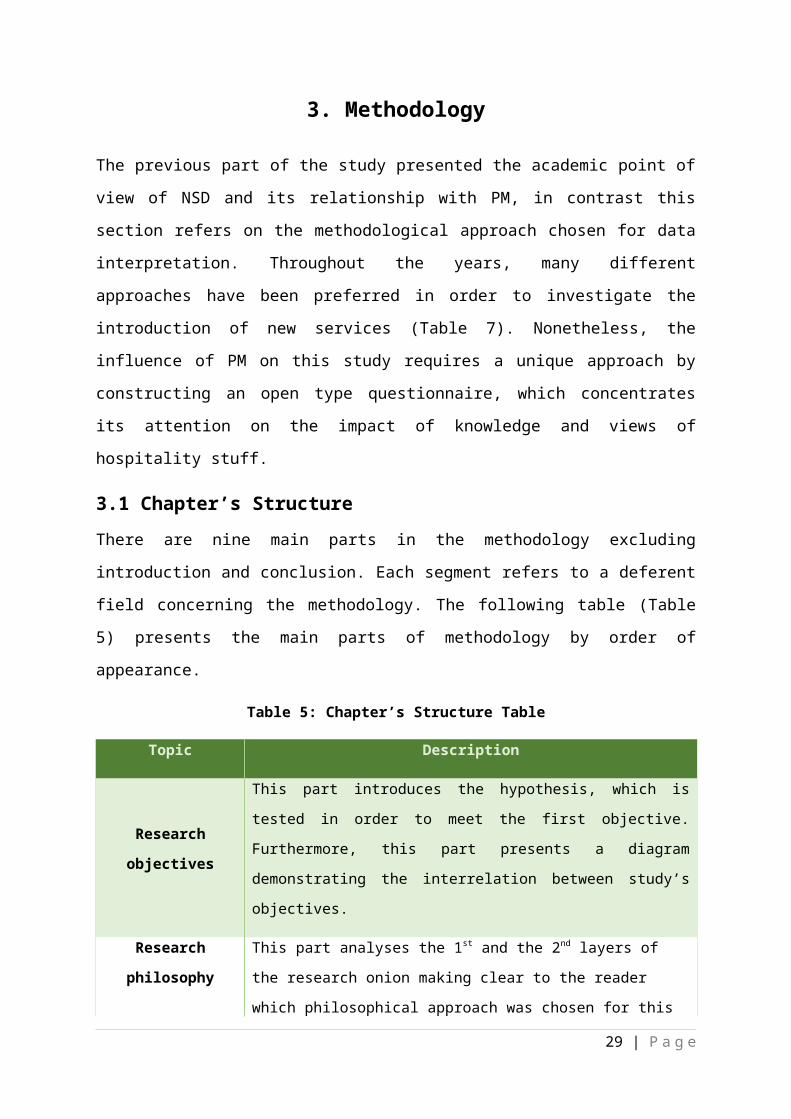
Data Collection: Data were collected and stored anonymously ensuring that the identity and
the views of the people who were involved in the study will remain confidential.
Data Analysis: The title of the project as well as the structure of the questionnaire reveals the
way of data analysis. Furthermore, participants were informed in the cover letter that the
study explores the impact of PM based on their knowledge.
Presentation: All the recommendations are based on the findings and are presented after the
analysis part. At that point, in order to proof that the study meets all the ethical criteria the
participants were given the contact details of the researcher giving them the choice to contact
the source of the dissertation for further details. Furthermore, the participants were informed
that valuable insights would be shared with them after the completion of the project.
(Saunders, et al., 2007)
3.10 Issues
This part of methodology presents the issues the study faced as well as the way they have
been addressed. The limitations concerning the research are presented in the general
conclusion section of the dissertation
1. Some individuals ignored the email
This issue have been addressed by sending many questionnaires in many hotels across
the country. Furthermore, Qualtrics allows the researcher to spot individuals who did
not complete the survey, in that occasion a reminder was sent asking politely the
participants to complete their surveys.
2. Chamber of Commerce refused to provide database of hotels
This issue was addressed by searching lists of hotels from websites:
ACCORHOTELS.COM and Hfind.com. Emails were sent to each hotel and manager
individually.
3. Obtaining wrong contact details
A small percentage of email failed to reach their destination. However, that fact did
not affect negatively the outcome of the study as the questionnaire was sent to 242
participants.
4. Participants decide to withdraw their answers
32 | P a g e
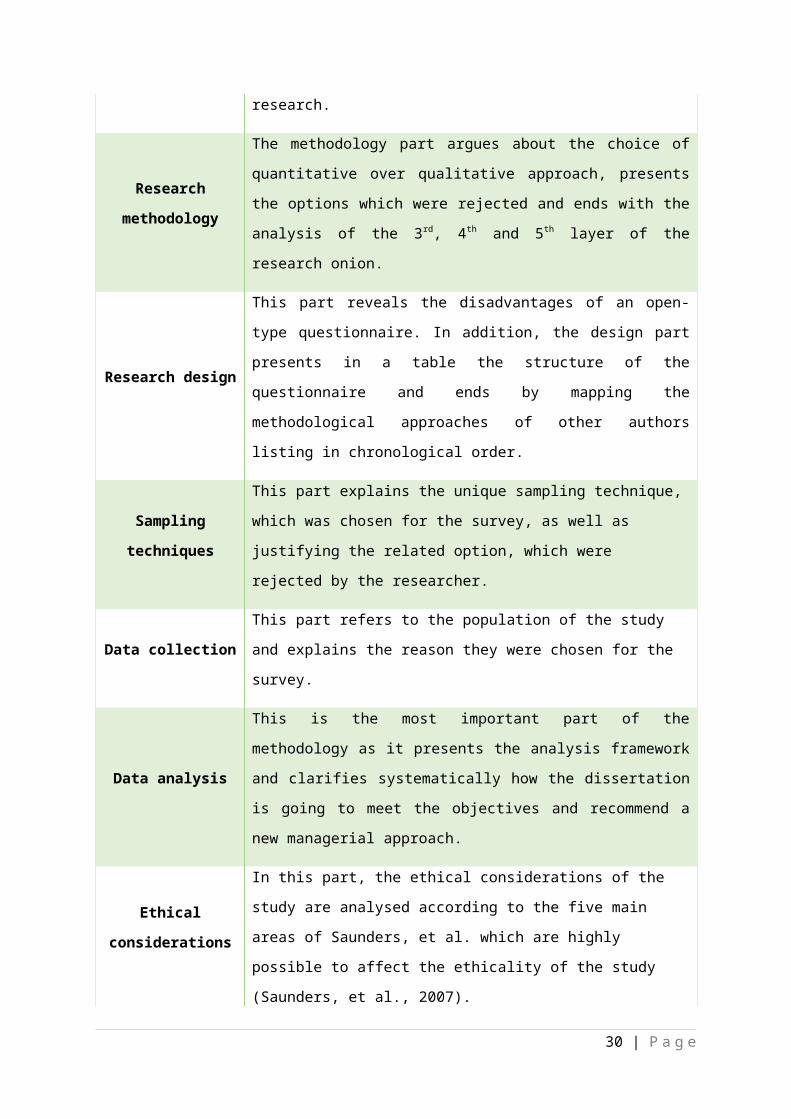
All the answers were kept separately in case someone wanted to withdraw his
statement. Nonetheless, no participants withdraw from the survey.
5. Late Replies
The closing date was the 14th of August and no replies were accepted after that date,
as there was a slight delay on the project.
The whole part of the methodology is structured in a way to make it easy understandable,
from the philosophy which was chosen to the analysis of the data. Although, the importance
of methodology is unquestionable and it refers to the core idea behind data interpretation, the
next part is the one, which moves from theory to action. Consequently, the following part of
the dissertation, the analysis of the data, is responsible for the solidification of the findings
and the presentation of a well-grounded recommendation.
4. Analysis
The previous chapter explained the research approach of this dissertation. However, the
analysis chapter is responsible for moving from theory to action by proceeding to the data
interpretation phase. It is a sensitive part of the dissertation and in order to confirm the
accuracy of the findings, the collected data must be analysed according to the methodology.
The table presented below (Table 8) is the structure of the Analysis part of the dissertation
and the study proceeds strictly based on the order of that table.
33 | P a g e
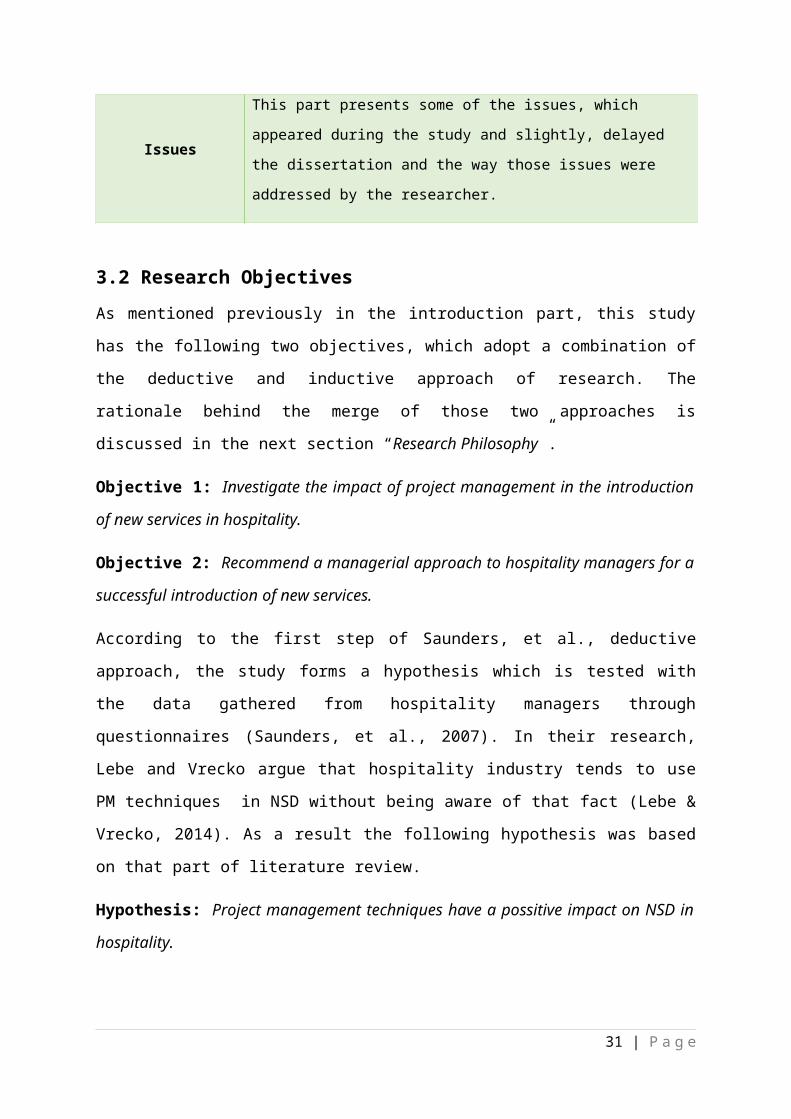
4.1 Data Collection and Analysis Table
In this section a table of data collection and analysis (Table 8) based on the Analysis
Framework (Figure 6) defines an analysis mechanism for each step. Each step has a
predecessor and an analysis tool, the table assists the research to be on track as well as
reaching its milestones. Furthermore, this table allows the reader to get a clear view of the
whole idea behind the analysis process. For the dates related to each step, refer to the
timetable (Appendix 1). The below table can be also used as a structure guide for the analysis
chapter.
Table 8: Analysis Table
Steps Predecessor Analysis
Step 1 -Collecting the questionnaires after closing the survey
(14/08/2014) / Presenting survey results.
Step 2 Step 1
The questionnaires are separated in terms of S/F service
introductions by the participants. All the following steps analyse
the data based on that segregation.
Step 3 Step 2
This part is based on PM techniques of literature. The point of that
step is to compare the PM techniques used for S/F service
introductions respectively. Testing the hypothesis as well as
meeting the 1st objective by revealing the impact of PM in NSD.
Step 4.1 Step 3
This step reveals two different approaches of S/F services by
constructing two MMs one for each occasion. This way study
presents the areas, which were ignored by the participants and
lead them to an unsuccessful service introduction.
Step 4.2 Step 3
This part uses the priority formula developed solely for the
survey to calculate the service allocation within the company.
The four areas of BSC which were displayed in the questionnaire
reveal hospitality’s stuff intention in terms of meeting targets and
how that affects the outcome of the projects.
Step 5Step 4.1 &
4.2
This final step is analysed and presented in the recommendation
part, which is displayed after the analysis of the data. This part
utilizes the data from step 4.1 and 4.2 and suggests a managerial
approach based on successful service integrations.
34 | P a g e
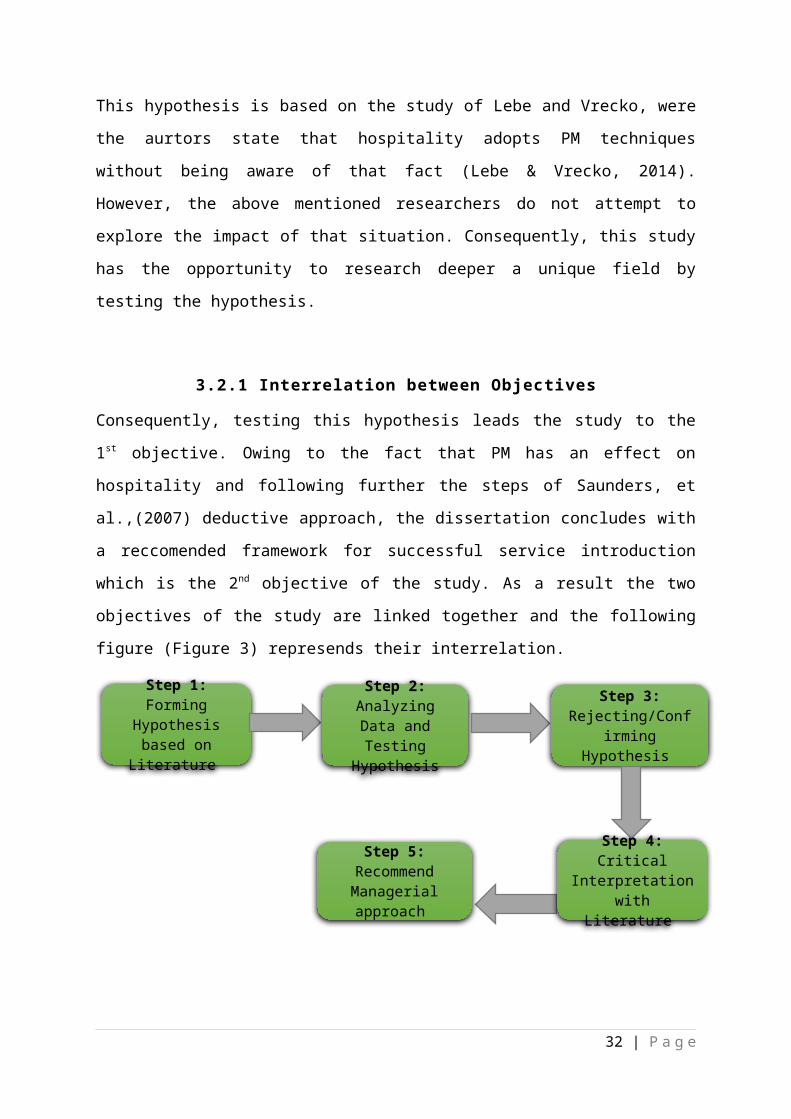
4.2 Survey Results
In total 242 hotels were selected through the sampling technique to participate in the study.
The number of the responses on the final day of the survey was 42, out of which 25 responses
were recorded as high-importance and 17 as medium-importance data. High-importance or
primary data are the responses which met all 4 selection criteria, in contrast replies which met
2 or 3 of the selection criteria were recorded as medium-importance or secondary data. Also,
as secondary data are the participants who have not led a project team in NSD but participate
in the team as a member regardless of the project outcome. The following table presents the
survey results and the according percentages.
Table 9: Results Table
Type of Data RepliesCompare to Total
Responses (42)
Compare to Total
Questionnaires (242)
Primary 25 59.5% 10.3%
Secondary 17 40.5% 7%
Total responses 42 - 17.3%
4.3 Separating S/F Services
The second step is considered to be of high-importance as all the following steps are based on
the separation of successful and non-successful service introduction. That allows the
dissertation to explore the mistakes made during the development phase of the new services
and identify best practices in hospitality industry by examining those participants who
introduce successfully a new service in their firm. The following table presents the primary
and secondary data separated based on the S/F criteria.
Table 10: S/F Table
Type of Data S/F Number of Responses Total Number
PrimarySuccessful 12
25Failed 13
Secondary Successful 9 17
35 | P a g e
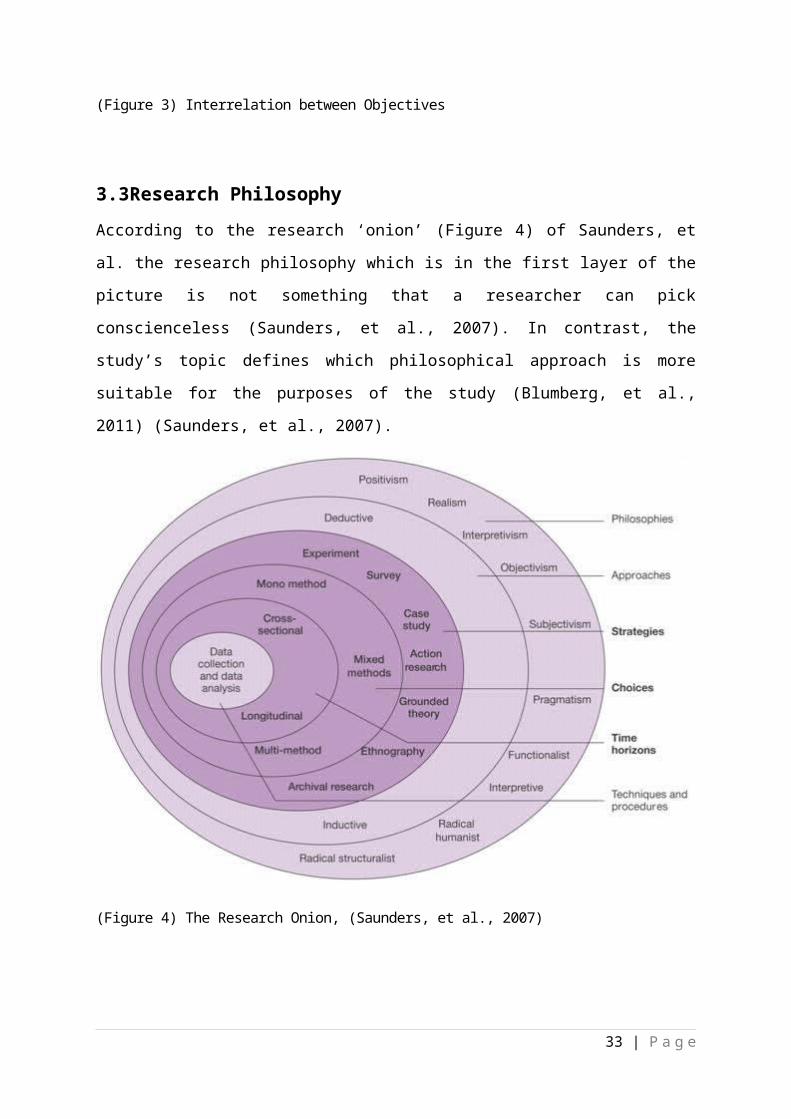
Failed 16
S/F Table Comments: As can be seen from the table 12 out of 25 participants introduced
successfully a new service. On the other hand, in the same category of data, 13 participants
admitted that the new service failed to incorporate within the firm. Furthermore, as secondary
data, 9 out of 17 participants stated that they were involved in a project, which successfully
introduced a new service in their hotel. However, the majority of the secondary type replies
acknowledged that the projects they were involved failed to introduce a new service.
4.4 Project Management Techniques Analysis
This part of analysis is solely concentrated to PM techniques used by the participants. In the
literature, two core techniques were presented: 1) Product performance (P), Time-to market
(T), Product cost (C) and Project Cost (C), (PTCC) and 2) Project Planning and Management
Technique (PPMT). Blocks 4 and 5 of the questionnaire are related to the above mentioned
techniques respectively. The open type questionnaire, which was used for the survey, allowed
participants to provide qualitative data and express without restrictions their views on each
step of PTCC and PPMT.
4.4.1 Analysing PTCC
The PTCC technique is a 4-step approach (Figure 7) which is focused on the service and its
relationship with the customer. This section presents the line followed by the successful and
non-successful participants based on their answers. The following figure (Figure…) provides
the instructions to read the chart.
36 | P a g e
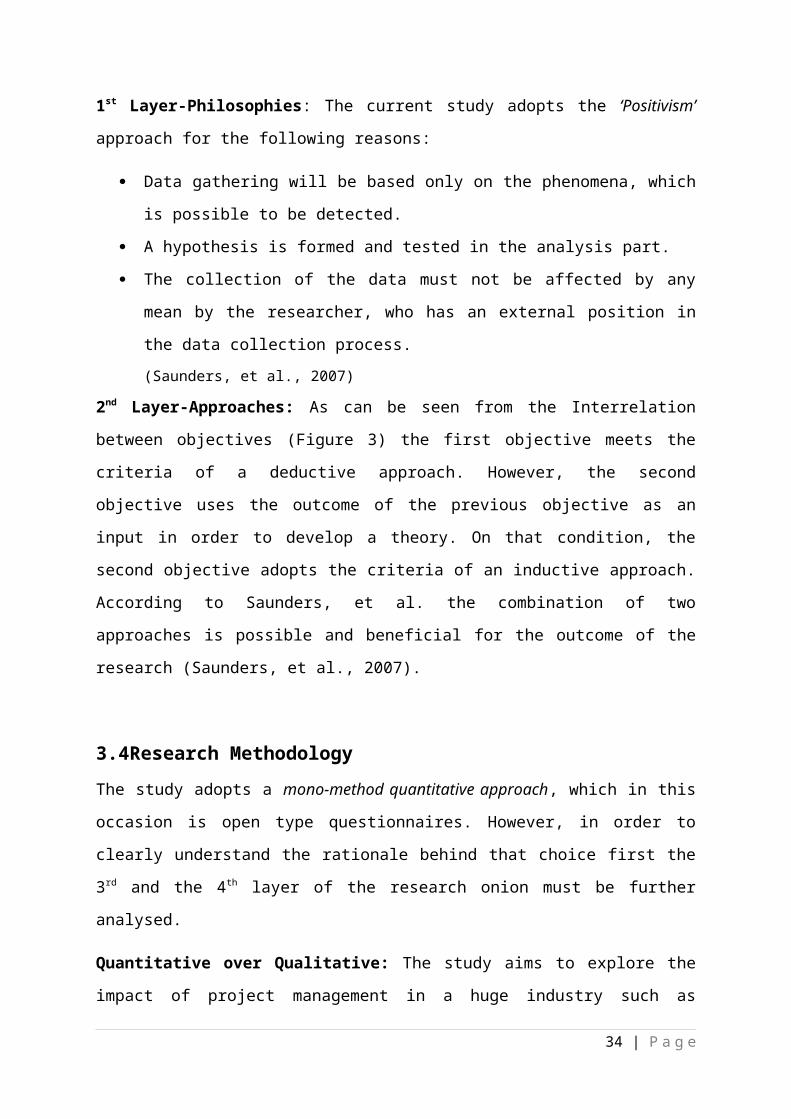
(Figure 7) PTCC Chart Instructions
Step 1 Step 2 Step 3 Step 4
30%
20%
40% 40%
10% 10%
20% 20%
PTCC CHART
Successful Failed
(Figure 8) PTCC Chart
The percentages in the chart are related to number of total responses (42)
Chart Comments: It can be seen from the chart that the biggest gap in that technique is in
steps 1, 3 and 4. That shows that managers who tend to invest more time on exploring
customer behaviour and customer needs have a high possibility to succeed in their projects.
37 | P a g e
Instructions to read the chart: The numbers in the line refers to the participants who actually invest time
and effort for that step.
Blue Line (Successful): Shows the percentages of successful
participants who apply the certain step of PTCC technique in NSD.
Step 1: Manager spot benefits to the
customer and company and create a plan to return the
investment.
Step 2: The firm conducts a cost
benefit analysis.
Orange Line (Failed): Shows the percentages of participants who
apply the certain step in the occasion of a non-successful NSD.
Step 3: The managers conducts a survey or uses a
tool to identify customers’ desires.
Step 4: Involve team members with the project and stick to the original plan.
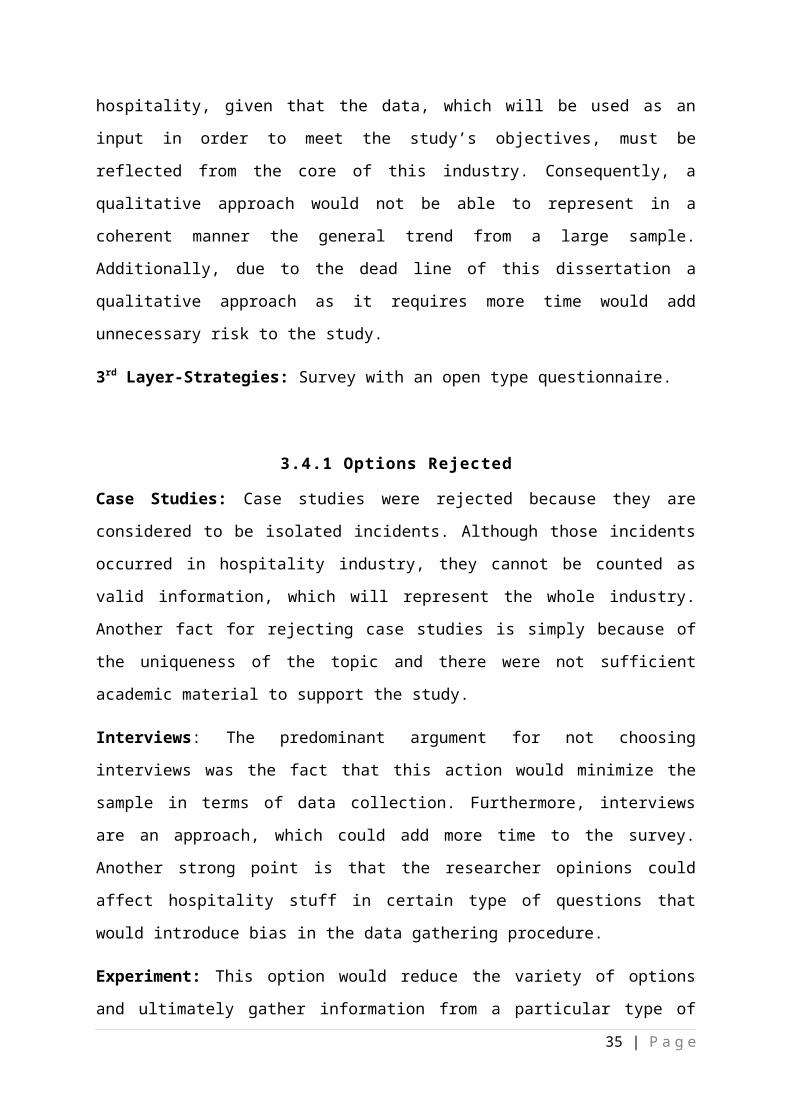
Furthermore, successful managers choose to use more surveys and other tools, which allow
them to have a clear view of customers’ opinions on their services and involve the right team
members in the project in early stages. Analysing the last step, it can be seen that hospitality
managers who tend to stick with the original plans have a twice-higher success rate.
4.4.2 PTCC Best Practices
In terms of the PTCC technique, some participants showed a better understanding of
customer benefits and how the company can return its investment through the project. In
addition, the participants who successfully have introduced new services showed
thoroughness in tasks completion and benefit realization. Below is a worth presenting answer
by a participant who explained in details how his company realize the benefit and how his
team carefully approach the project.
Model Answers:
Please describe how your customers and your company benefited by the services
you introduced.
I used the service satisfaction-tracing tool to record customers' feedback after leaving
the hotel. In this way, our hotel can know customers' preference and improve
according to their experience feedback.
Please describe any cost-benefit analysis you had to run before developing a new
service.
The new tool, as I mentioned the voice mailbox service has to be set up in the original
phone system. We have to apply for a new budget and approval from Owner by
presenting the benefits it can bring to our hotel. After the trial in some floors for 3
months, it has received many feedbacks from our customers, which proves feasible in
the end.
After comparing those who had successfully introduced a new service with those who failed,
the research revealed that there are many similarities, which could characterized as Best
Practices for the 12 participants who were successful in NSD in terms of the PTCC
technique.
The below 4 similarities were spotted among the 12 successful responses:
38 | P a g e
1. The participants had a clear view of their project and a good understanding of
customer benefits.
2. All tasks were classified by categories and rated according to emergency.
3. The participants usually stuck with the original plan however, they were ready to
adapt to any changes if necessary.
4. In all occasions, right software tools were selected to assist internal business
procedures.
4.4.3 Analysing PPMT
The PPMT technique is a 6-step procedure (Figure 9) which is principally focused on project
control. Hospitality managers were asked if they apply any of those steps in NSD. The
following chart demonstrates the difference between successful and failed managers in the
arena of PPMT method. In addition, the reading instructions are the same with the previous
chart (Figure 7) the only difference is the definition of the PPMT steps, which is provided
below.
(Figure 9) PPMT Steps Definition
39 | P a g e
Step 1: Manager sets objectives and
goals.
Step 2: Listing tasks and
identifying links between them.
Step 3: Grouping tasks and spotting the critical path.
Step 4: Allocate and estimate time and resources for
each task.
Step 5: Using visual tools for
tasks and events.
Step 6: keeping formal
documentation.
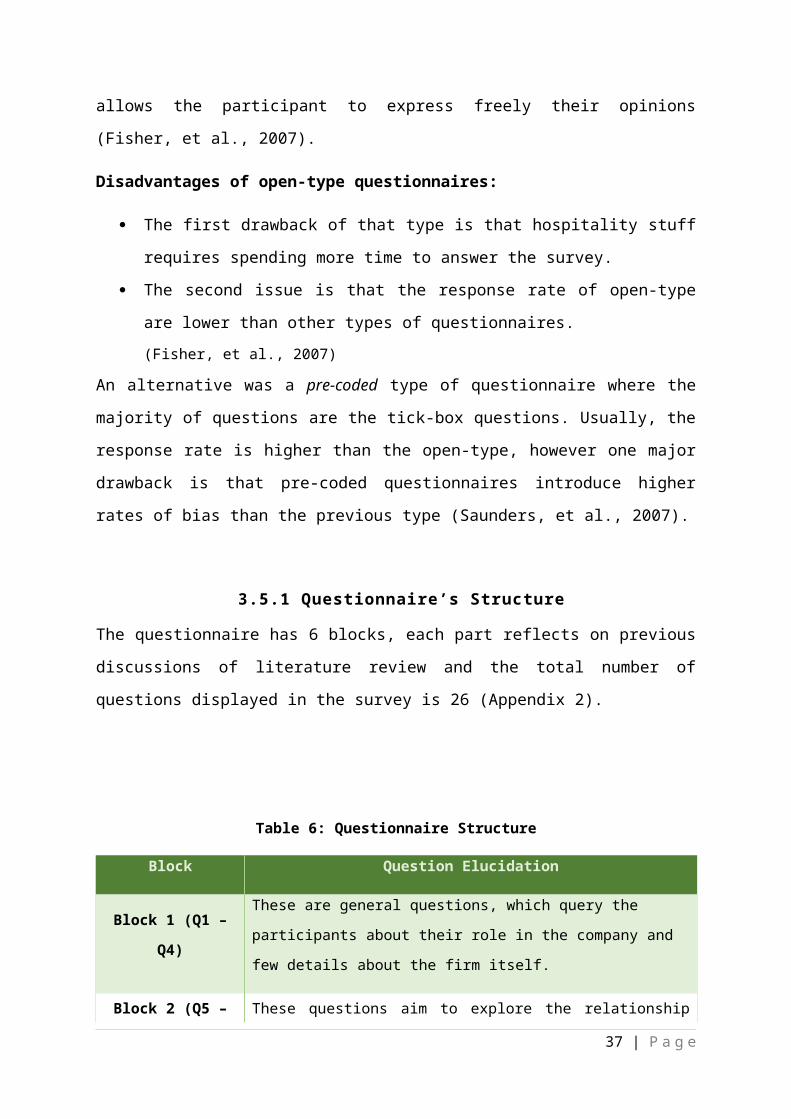
Step 1 Step 2 Step 3 Step 4 Step 5 Step 6
20%
30% 30% 30%
20% 20%20% 20%
10%
30%
10%
20%
PPMT CHART
Successful Failed
(Figure 10) PPMT Chart
The percentages in the chart are related to number of total responses (42)
Chart Comments: As can be seen from the above figure (Figure 10) the chart could be
analysed into 3 parts. The first part is the 3 points were both lines meet each other in steps 1,
4 and 6. That reveals that both categories of successful and failed participants give the same
amount of attention on these 3 steps. Both groups realize the importance of understanding
clearly the objective of the project. Furthermore, in step 4 both parties score 30% meaning
that they understand that in order to complete a task HM must know exactly the time and cost
before acting. However, there is a sharp drop in step 3 were the difference reaches its peak of
20%. This step is responsible for separating tasks according to links and defying the critical
path of the project.
4.4.4 PPMT Best Practices
The analysis of PPMT technique brought light to many important facts, which determine the
outcome of a NSD project. The participants who admitted that their services failed to
incorporate in the hotel showed that they did not pay much attention on the task and their
dependencies with milestones and events in the project.
40 | P a g e
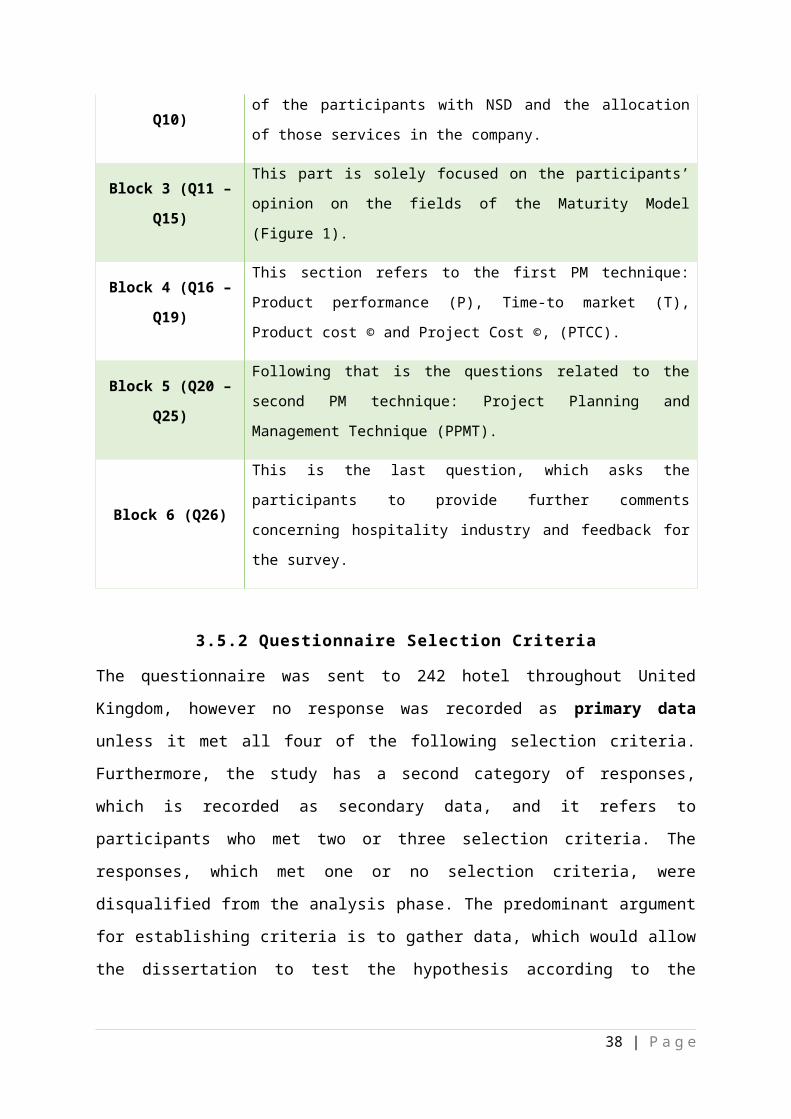
Model Answers:
How do you set objectives and goals when introducing a new service?
Based on the customer needs, I need to set the goal to improve or create a new
service. Where the needs lie, where the service should be sent. Also, I can learn from
my colleagues or the industry's best practices.
How do you allocate/estimate the time and resources required for each task?
There are factors that do not allow you to estimate the time but in order to continue
you always have a timetable by consulting the experts or people that already
completed a similar task before.
After the analysis of the responses concerning PPMT technique, the results indicate that
there are parallels between the respondents in terms of certain steps.
1. The objectives were based on customers’ needs and allocated to the appropriate
team members who had the experience to contribute to that task.
2. Tasks were registered and grouped according to the business plan, necessity
and the tools and methods, which will be used to complete them.
3. All managers tended to keep formal documentation, where they separated the
project in stages and other details concerning their customers and markets.
4. Visual tools were also used in many cases mostly for knowledge sharing
purposes.
4.5 Confirming Hypothesis-Meeting 1st Objective
“Hypothesis: Project management techniques have a possitive impact on NSD in
hospitality.”
Analysing the data presented by the two groups of participants lead the study to the
confirmation of the hypothesis. During the PTCC and PPMT analysis both groups revealed
that the implementation of core procedures of PM increase the chances of a successful
outcome. In addition, it can be seen by reading the charts that HM of the ‘successful’ group
tend to framework their activities in terms of NSD, that means that they follow the same
successful pattern during each service introduction. The views of the ‘successful’ managers
shown a high awareness in the field of PM and how it affects NSD in hospitality.
41 | P a g e
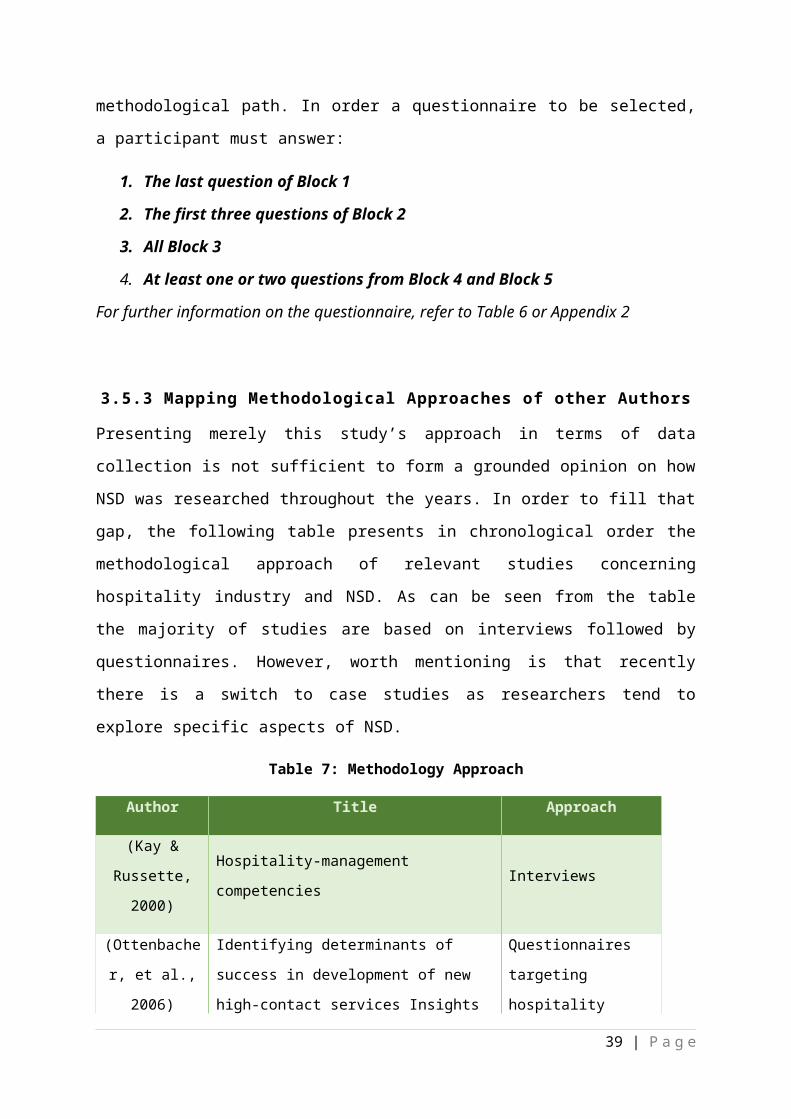
On the other hand, the participants who failed in their new service development seem to
ignore the positive effect of PM in their businesses. Although, they consecrate on each step,
they fail to spot the dependencies between the steps, the priorities and the importance of each
action separately. This fact can be clearly seen from the PPMT chart where the ‘failed’
participants totally overlook step 3, which is responsible for the creation of a critical path one
of the most important activities in PM. Furthermore, the same group seems not to exploit the
advantages of software tools in order to facilitate NSD projects. The fact that, there is a lack
of appropriate software tools discourages the HM to invest time and effort in project planning
and control.
In the view of these findings, it can be confidently stated that PM has indeed a positive
impact on NSD and the implementation of PM techniques in hospitality provides the
competitive advantage in the introduction of new services in this highly antagonistic market.
4.6 Maturity Model Analysis
The NSD Maturity Model (Jin, et al., 2014) is a measuring tool, which allows the study to
compare different approaches of successful and non-successful service introduction. This tool
was previously presented in literature, in the Introduction to NSD chapter. The analysis of
MM is referred to Block 3 of the questionnaire and the views on MM were one of the four
criteria for questionnaire selection. The following figure (Figure 11) presents the views of the
two groups of participants by calculating the average based on their opinions on the
importance of MM. Calculating the average reveals the general trend of these two groups
based on their daily activities in NSD. The instructions on the colours of the lines are shown
on the bottom right corner of the figure.
42 | P a g e
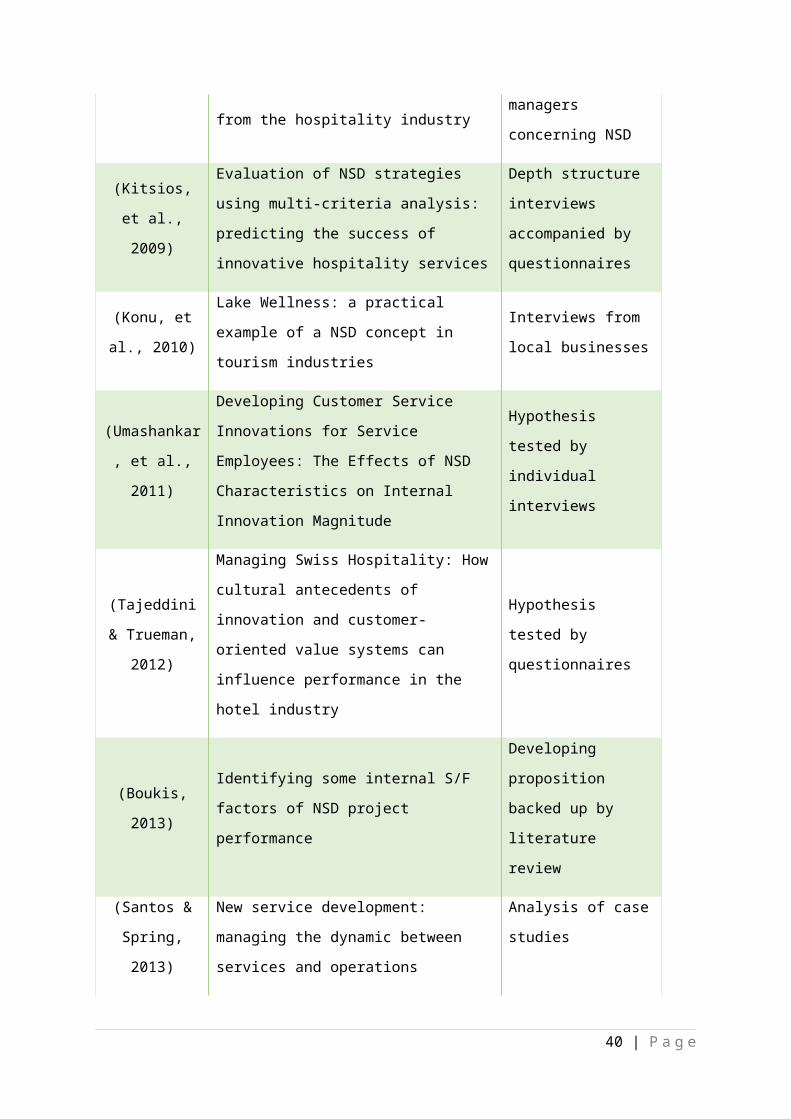
(Figure 11) NSD Maturity Model
Based on (Jin, et al., 2014)
MM Comments: As can be seen from the figure the sub-area where the gap between the two
groups reaches its peak of 2 points is Process in the field of Knowledge Management.
However, the whole area of Customer Involvement seems to lack in terms of performance
compared to the ‘successful’ group. Furthermore, worth mentioning is that the two groups
perfume almost the same in the areas of Process Formalization and the two first sub-areas of
Strategy Management. Nonetheless, there appears to be a sudden drop in the last area of
strategy Management, the Resource Allocation that is a high-importance field in every aspect
of project management. The results of MM allow the study to spot the areas where
successful hospitality managers outperform the second group. This information contributes to
the forge of a managerial approach, which is presented in the next chapter.
43 | P a g e
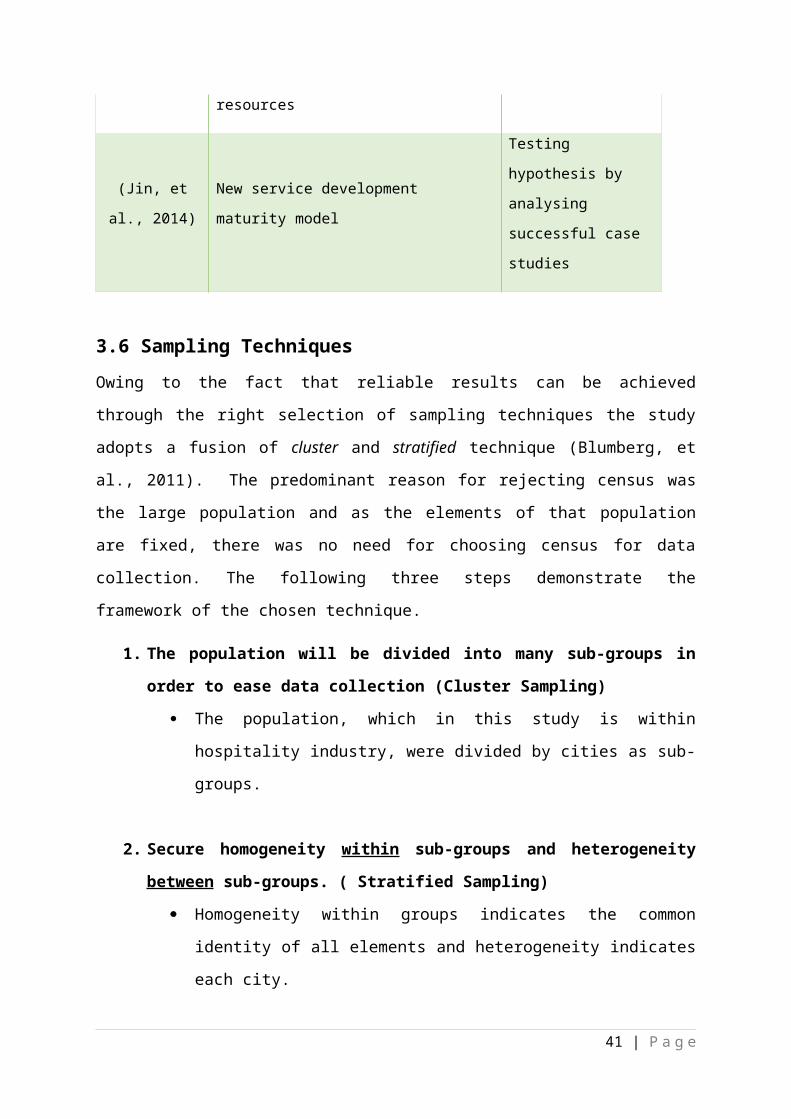
4.6.1 Analysing MM Variations
The following table (Table 10) lists the results of the MM and calculates the variation
between the two groups of participants.
Table 10: Maturity Model Average Table
Green Group: This group spot the areas which variation ranges from 0 until 0.8.
Yellow Group: This group indicates the medium-importance variations, which starts from
0.9 until 1.5.
Red Group: The last group, which refers to the high-importance variations starting from
differences 1.6 and higher.
44 | P a g e
Main Areas Sub-Areas Successful
Participants
Failed
ParticipantsVariation
Strategy
Management
Goals and
Objectives 4 3.6
0.4
Arenas of Focus 3.5 3.3 0.2
Resource
Allocation4 2.6
1.4
Process
Formalization
System Behaviour 4 4 0
Documentation 4 3.6 0.4
Assignment of
Responsibilities3.8 3
0.8
Knowledge
Management
Culture 4.1 4.3 0.2
Process 4.6 2.6 2
Technology 3.8 3 0.8
Customer
Involvement
Customer Role 4.5 2.6 1.9
Stage 4 2.6 1.4
Method 4.3 3 1.3
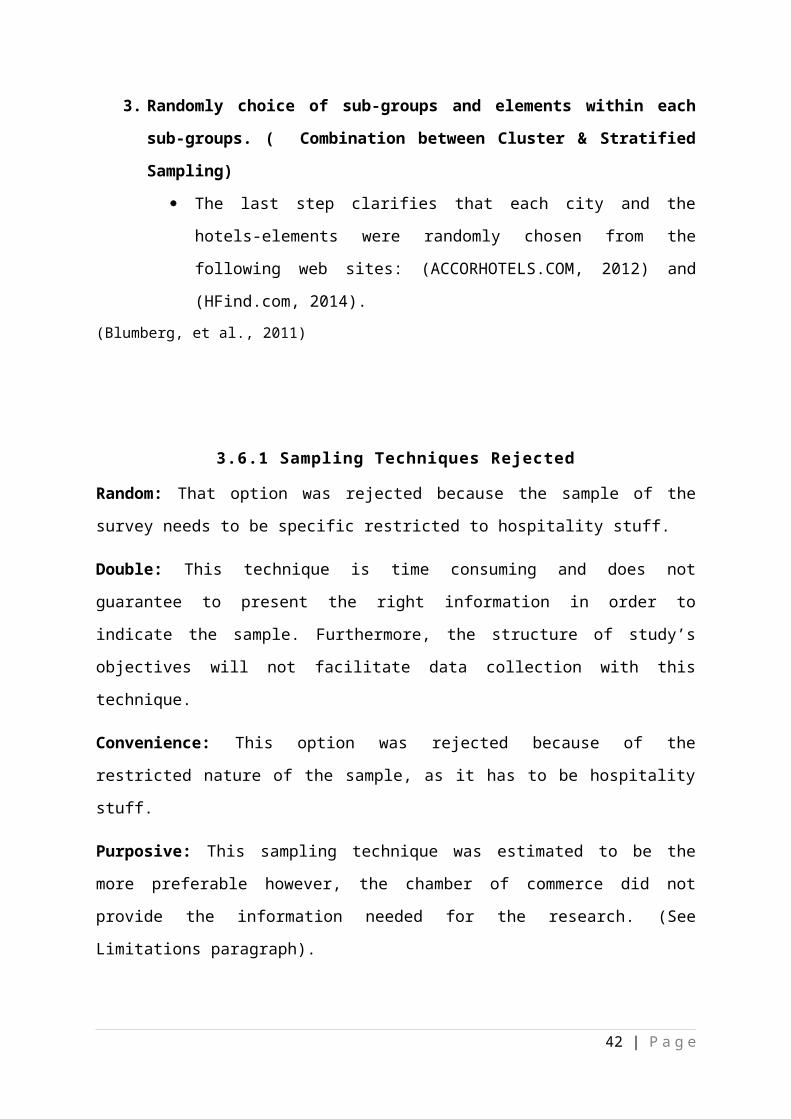
Table Comments: The variations of the average numbers are separated into 3 groups. It can
be seen from the table above that in the variation row the colour of numbers differs based on
the differences of the participants’ views. The predominant reason for breaking the variations
into three groups is because, that will be used as support evidence in the recommendation
part. Besides that, the three above mentioned variation groups reveal the areas in MM where
the ‘failed’ participants did not pay much attention and led their projects to undesirable
results.
4.7 Balance Scorecard Analysis
Balance scorecard is a tool, which generates a link between firm’s strategies with the
measurement of tangible goals. Before recommending a managerial approach, the study
needs to spot the areas where the two groups of participants tend to allocate their new
services. That information reveals that there is a link between the service and the area where
this service is allocated. The following table (Table 11) ranks in terms of priority the four
areas of balance scorecard based on the views of the two groups of participants.
4.7.1 Priority Formula
For the purposes of the study, a priority formula was developed in order to demonstrate in a
coherent manner the precedence levels for each area of Balance Scorecard. The formula was
developed solely for the analysis of the survey results and cannot be applied in any other
occasion. The instructions, abbreviations and further information concerning the formula are
listed below. The figures of the table (Table…) represent the general trend of each group by
calculating the areas chosen the most by hospitality managers.
Formula: BSCA= (PLi + PLi +…. + PLi) / i
BSCA: Refers to the four related areas of the balance scorecard.
Areas: 1) Financial perspective, 2) Customer perspective, 3) Internal business perspective
and 4) Learning and innovation perspective
PL: This element is the priority level chosen by the participant. There are 4 levels in total in
the survey, max, high, medium and low. Each priority level corresponds to a number.
Max= 4, High=3, Medium=2 and Low=1 (The increase of priority entails the increase of the
coefficient related to that level)
45 | P a g e
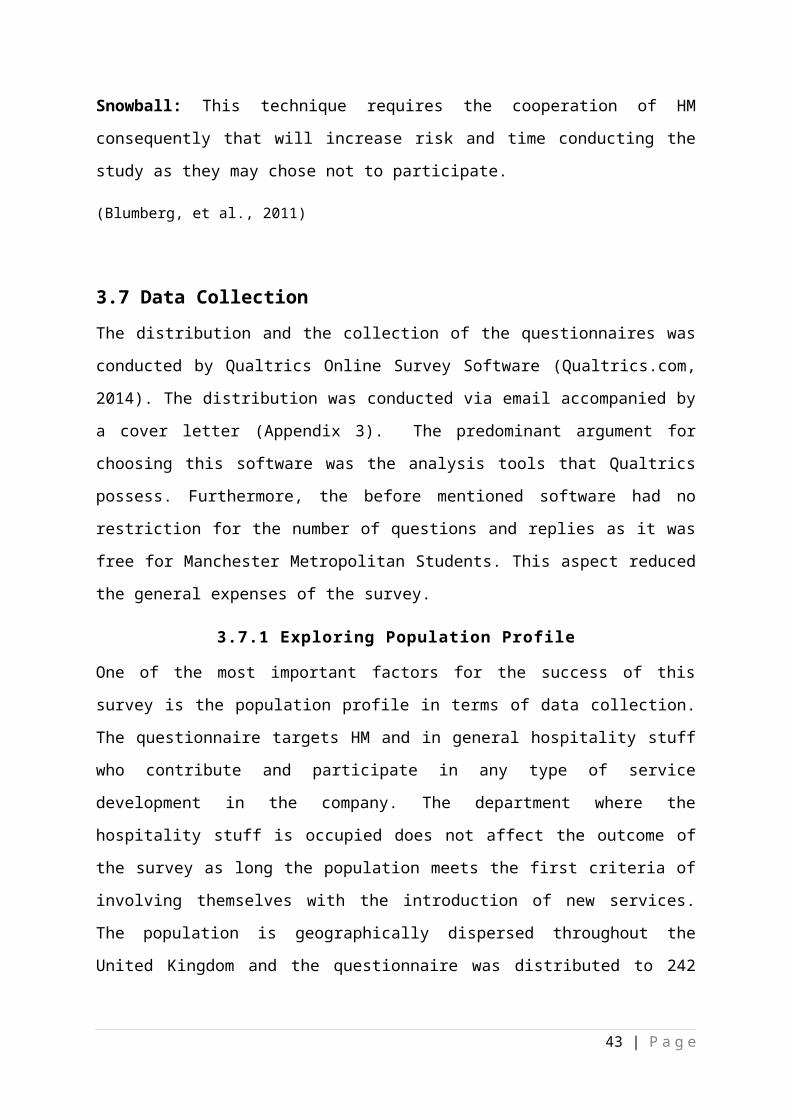
i: This figure indicates the number of participants.
Formula Notes: The difference of the number of participants in each group can affect the
result of the formula. In order to eradicate that fact the total aggregation of the priority level
coefficients will be divided by the number of participants. That will result in an average
number based on the priority levels for each area of the balance scorecard.
Table 11: BSC Priority Table
The figures of the table were calculated based on the priority formula.
Table Comments: It can be seen from the table that there is only one area where participants
with a ‘successful’ service introduction score less than the other group. This area is related to
financial goals and that makes clear that the majority of the hospitality managers are profit
orientated. However, analysing further the table it can be easily seen that the ‘successful’
group preserves a balance in the service allocation throughout the hotel departments. In
contrast, the second group with the ‘failed’ participants concentrate their allocated services in
financial goals and customer involvement areas. That action result in ignoring the other two
areas, a fact which eventually may impact the result of the new service. Furthermore,
analysing the interest per area can be seen that customer satisfaction gets the first place
followed by financial goals scoring 6.7 and 6.3 respectively in the priority formula. Another
strong point, which needs to be mentioned, is that the internal business area scores the less in
both groups getting only 4 points in terms of priority level.
46 | P a g e
Main AreasSuccessful
Participants
Failed
Participants
Interest per
Area
Success in achieving financial goals 3 3.3 6.3
Increase in customer satisfaction 3.4 3.3 6.7
Improvements in internal business
activities2.2 1.8 4
Investment into innovation and staff
development/training2.5 2 4.5
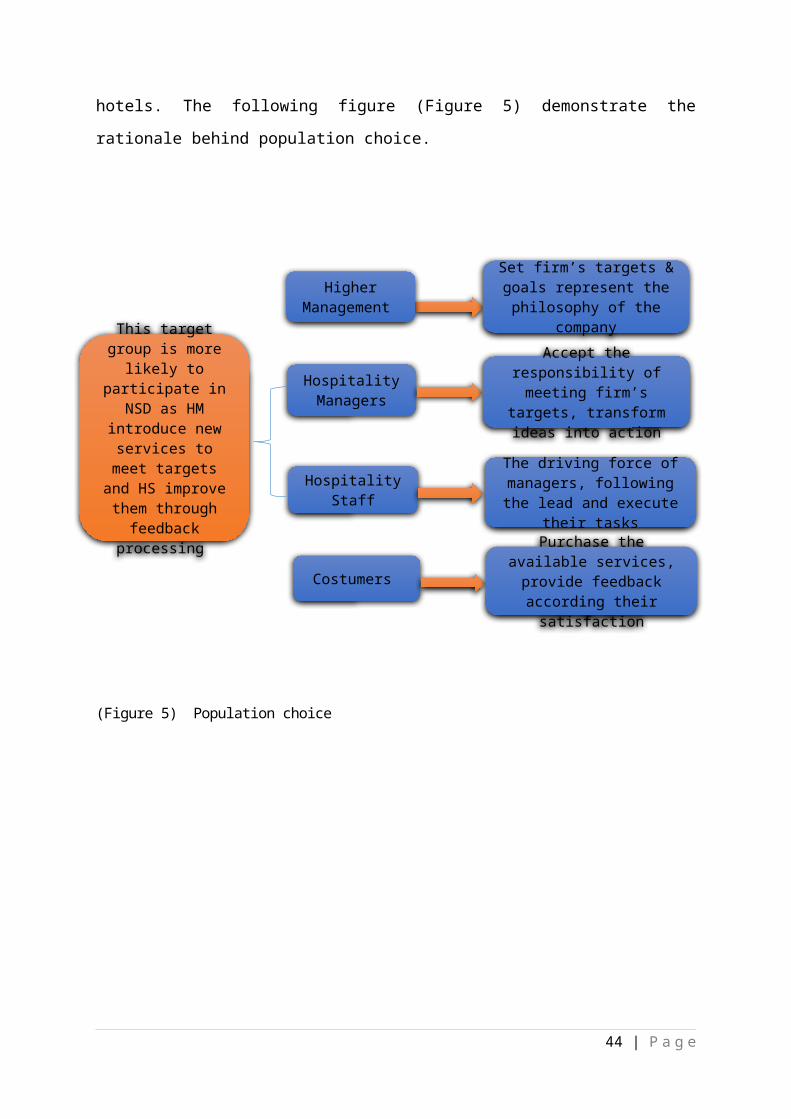
4.8 NSD Managerial Approach – Meeting 2nd Objective
The second objective of this study is to propose a managerial approach for successful service
development and introduction in hospitality. The following framework provide guidance for
HM based on real life findings of this chapter and the theory of literature. Further details and
explanations concerning the NSD Managerial Framework (Figure 12) are listed below the
following figure.
(Figure 12) NSD Managerial Framework
A. Planning Phase
47 | P a g e
8. Performance Measurement
9. Databases for Future NSD
6. Launch
7. Customer Feedback
C. Launching Phase
5. Service Allocation
B. Project Approval Phase
3. Measurement Stage
A. Planning Phase
4. Feedback
2. Development Stage
1. Preparation Stage
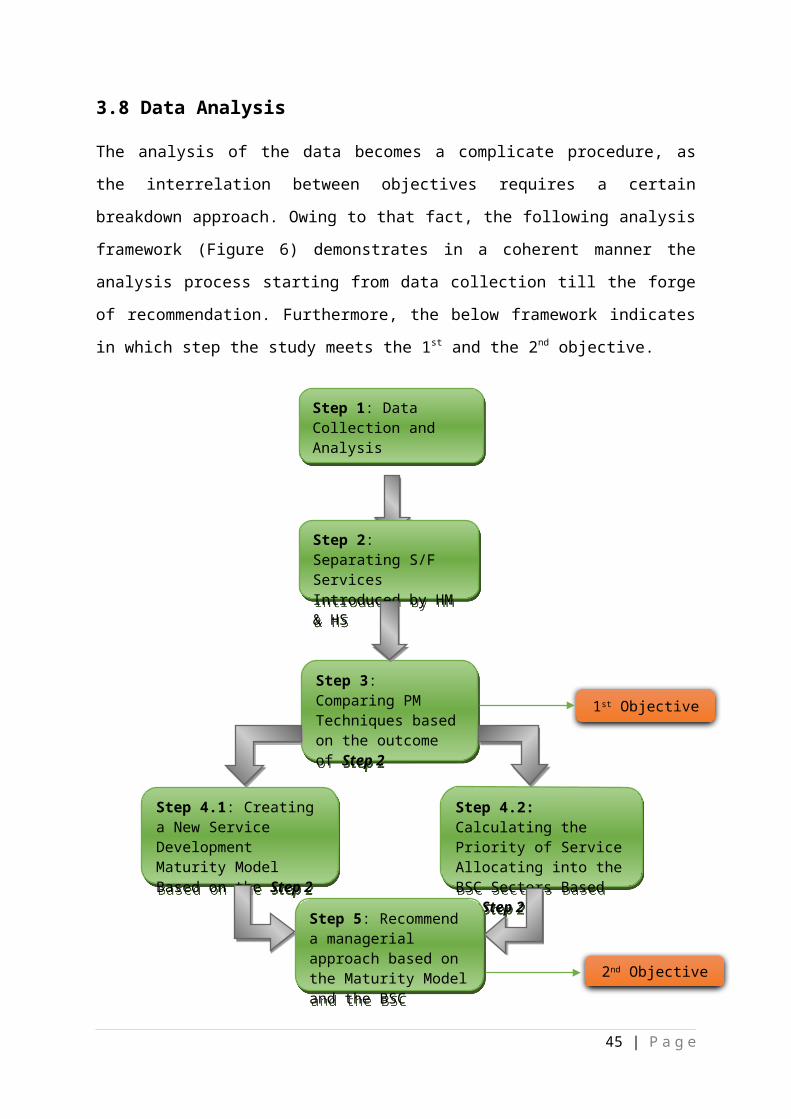
The first phase of the framework has a pre-project role and involves all activities before
launching the service. This phase has a circle mode an action that assist the HM team to
correct mistakes in the service. Step 1: The preparation stage aims to familiarise the team
with the purposes of the project, the features of the service, the reason why should the
company proceed to that project and the issues involving the service development. Referring
to the RIB analysis (see Literature Chapter) a manager can have a clear view of what to
expect during the project.
Step 2: in the development stage, a HM can use the PM techniques provided in this
dissertation (PPMT and PTCC). Starting with PPMT a manager can have a guideline of how
to control the project internally in terms of his team. Following that, PTCC allows the
manager to link the service with the market and have a clear view on how to advance based
on customers’ needs. Based on the findings of the MM a manager should invest time in
knowledge sharing as the results showed that teams who ignore that field tend to fail in NSD.
Step 3: In the measurement stage, HM can use the NSD benefits table (Table 2) and spot
the service performance in that stage. Even if a service does not generate income that does
not mean that a service is a failure, there is a high possibility that the related service provide
many benefits in other business dimensions like customer relationship or internal business
activities.
Step 4: During the planning phase, a service can be introduced in a department or even in
some floors of the hotel. That will greatly assist the HM team to realize the issues of the
service using the staff and customer feedback. The feedback report should be provided
weekly to the whole team where all the members can contribute with their ideas to improve
the service. The results from the MM showed that project teams who tend to ignore customer
feedback have lower success rate from teams who imbedded customer needs in the service
development phase. A manager can run a MM analysis and spot the areas where his project
does not perform well.
B. Approval Phase: This is not exactly a phase but a point from where the service will go
live. The results of the planning phase can be presented in that stage to the higher
management.
C. Launching Phase
48 | P a g e
Step 5: The service allocation is an important part of any project. Usually, the HM team
knows exactly where the service must be allocated in the hotel. However, during the planning
phase the team may decide to reallocate the service in other department. Customer feedback
is a good source of information, which will assist HM to decide the right place for the service
allocation. HM can also advice the BSC, a tool that was used in this chapter. The analysis
revealed that the majority of the services were allocated for financial and customer
perspective ignoring the rest two groups. Furthermore, a manager can use the priority formula
introduced in this chapter to calculate how the services are distributed in the firm. That will
reveal departments, which were previously ignored.
Steps 6.7.8.9: The project does not end after the launch of the service. The team should
create two databases recording the service performance and the general feedback from
customers and staff. These databases should be used in any future NSD projects.
The analysis of the data revealed many hidden aspects in the relationship of PM and the
successful service introduction in hospitality. The chapter followed strictly the analysis
framework (Figure 6) and concluded with the NSD Managerial Approach. The following
chapter provides a general discussion on the findings and tools used in this dissertation as
well as literature, which undoubtedly assist the whole research.
49 | P a g e
5. Discussion
This chapter is devoted to the discussion of the findings of the previous chapter and their link
to study’s objectives. Based on the analysis framework (Figure 6) the testing of the
hypothesis was conducted in the previous chapter concluding with the confirmation of the
hypothesis. Proving that PM has positive impact on NSD in hospitality the dissertation met
the 1st objective. Following that, the study met the 2nd objective by introducing a unique
managerial approach allowing HM to mitigate the risks of NSD.
5.1 Discussion
Conducting the RIB (Reasons, Issues and Benefits) analysis in literature chapter provided a
guidance for the rest of the dissertation. Knowing the reasons for introducing a new service
and most important the issues concerning the introduction assisted greatly to the development
of the questionnaire by editing the questions in a way which allows the study to drain the
right information from the participants (Donald, 1988). The contribution of the MM in this
dissertation was crucial in many parts of the study. First in the literature by making easier to
understand of how the data are going to be analysed and as a measurement tool providing
insight in NSD projects. The argument of Lebe and Vrecko that hospitality staff is not aware
with the fact that PM has a positive impact in their industry proved precise after the analysis
of the data. Furthermore, the statement of Griffin and Kitsios, et al., was also correct saying
that the majority of the services tend to fail in the launching phase (Griffin, 1997) (Kitsios, et
al., 2009). Another strong point was the use of the BSC, a measurement tool that enabled a
deeper research in terms of service allocation (Nigel, 2005), (Sainaghi, et al., 2013).
Although, there was a gap in the literature in terms of PM and BSC (Nigel, 2005), that wasn’t
an obstacle in this study as BSC was used only as a measurement tool which provided the
evidence needed to support the recommended managerial approach.
Apart from the views of the academics around the world, the study needed to adapt an
attentive methodological approach. The research onion of Saunders, et al., aided to a
methodological expand of thoughts which eventually allowed the research to procede easily
to the analysis phase (Saunders, et al., 2007). Moreover, be reading the methodological
approach table (Table 7) it can be seen that hypothesis tested by interviews research was also
50 | P a g e
conducted by Tajeddini and Trueman in 2012 about Swiss-Hospitality (Tajeddini &
Trueman, 2012). The above mentioned table revealed that researchers tend to change their
methodological approaches from time to time in terms of NSD in hospitality. On the other
hand, the uniqunes of the topic, combining the core concepts of PM in the development of
services in hospitality required a unique method of gathering and analysing the data. Finally,
the participants who volunteered share their views helped this dissertation to answer the
questions enquired from the gaps of literature and objectives of the study.
5.2 Implications
The findings of this study provide insight not only to HM but to academics as well. Exploring
the impact of PM in a vast industry such as hospitality shows that PM can be applied in many
fields providing support and guidance for every manager. The recommended managerial
approach contributes to the creation of a bond between PM and hospitality giving ground for
many other researches to be conducted in that field. Filling the gap stated by Jin, et al., that
there is a lack of measurement techniques in terms of NSD, the study shown that the
combination of certain techniques such as MM with the BSC accompanied with customers’
feedback can provide the right measurement of NSD implications in hospitality. In addition
the statement of Menor, et al. that NSD is a field which is been ignored compared to NPD has
also been addressed by this dissertation by concentrating all attention to the services
developed by HM (Menor, et al., 2002). Finally, the argument of Kitsios, et al. about the
absence of awareness in terms of NSD in hospitality was also a question which has been
addressed by the proposed NSD managerial approach, highlighting this way the importance
of a field where still much reserch could be done.
51 | P a g e
6. Conclusions
The final chapter of this study summarises and concludes all the findings with the original
aim of the research under the scope of project management in hospitality industry in the
United Kingdom.
6.1 Conclusions
The research explored the impact of PM in the development of new services in hospitality
coming to the conclusion that there is a link between these fields. In total 42 questionnaire
were selected for analysis out of 242, which were distributed across UK. The participants
were separated into two groups, one of those who successfully introduced a new service in
their hotel and the other with those who failed to apply their new services. This separation
was a core concept of the study as all the following actions concerning analysis were based
on that. The investigation of PM techniques on those two groups confirm the original
hypothesis and a highly important information was acquired in the first part of the analysis.
Other measurement tools such as NSD Maturity Model and Balance Scorecard revealed the
areas where managers were concentrating their services. That information also revealed
strengths and weaknesses of a service introduction. The contribution especially of the
Maturity Model to that dissertation was great as the outcome of the analysis backed up the
recommendation part. The NSD managerial approach, which was introduced in the last part
of the analysis, combined the data gathered from the analysis chapter and the academic
knowledge until this time. Finally, the study discussed the link of the literature with the
objectives and demonstrated that the related questions and literature gaps were filled through
this work.
6.2 Limitations
This study was limited in certain fields something which allowed this dissertation to target
specifically on the needed areas to meet the stated objectives. The following list represents
the limitations of the study.
1. The study is focused only in one country (UK).
52 | P a g e
In order to answer the question concerning the low success rates of NSD the study
concentrated in hotel operating only in the UK. That gave more gravity to the whole analysis
part as well as the recommendation part by introducing a managerial approach, which will be
applicable to one country.
2. The study researched only Hospitality Industry.
The same logic applies on that limitation, as it would be impossible to investigate the whole
concept of NSD and PM in every industry.
3. The study refers only in new service development and not product development.
There is a strong reason to apply this limitation to the study. The field of NPD is already
ahead in terms of research compare to NSD and in order to fill that gap, NSD was chosen
over NPD.
4. The participants of the study are low and middle class managers.
These two classes of managers were only used in the data collection process that means that
higher management or other stakeholders were excluded from the analysis.
5. Only the views of the participants were used as data for analysis.
This dissertation is not a company based research so only the views of the participants were
used for the analysis. However, that limitation provide ideas for future studies.
6. The study is based only on primary data.
For the purposes of the dissertation, only primary data were used in the analysis part. The
uniqueness of the topic did not allow the use of secondary data.
7. This study is part of a dissertation and had a deadline.
The deadline for this academic piece of work was a barrier in every part of the dissertation.
There was not enough time to explore areas deeper or test the recommendation in real world
examples.
6.3 Future Research
The limitations of this research can generate ideas for future studies, which may expand other
areas of NSD and test the applications of PM in that field. NSD is a vast field that yields the
primary part of a country’s income, however the success rates are really low. It needs to be
53 | P a g e
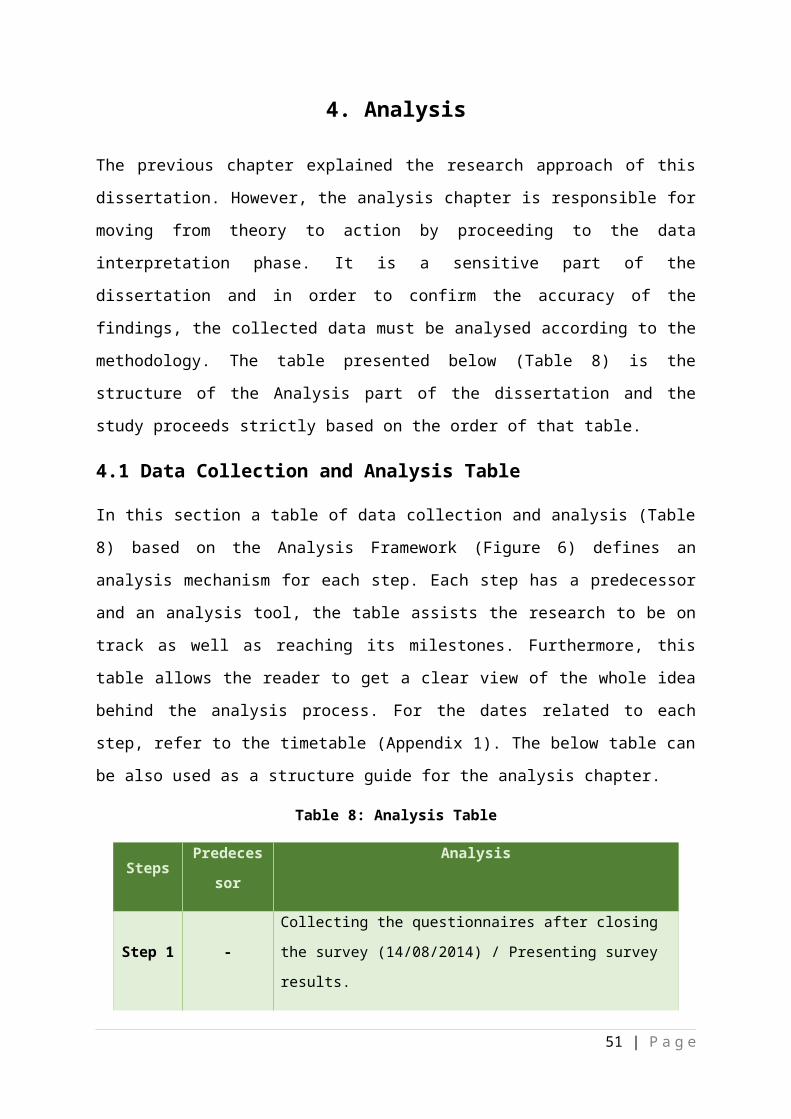
tested further the impact of PM in that arena and more important to research measurement
tools which will reveal the extent of PM usage. Furthermore, research also needed in the
internal areas of PM exploring different techniques which may be more applicable to NSD
than those used in this study. That study revealed that there is a need not only in academic but
also a practical perspective in NSD and it is undisputable that future studies will be based on
that area.
54 | P a g e
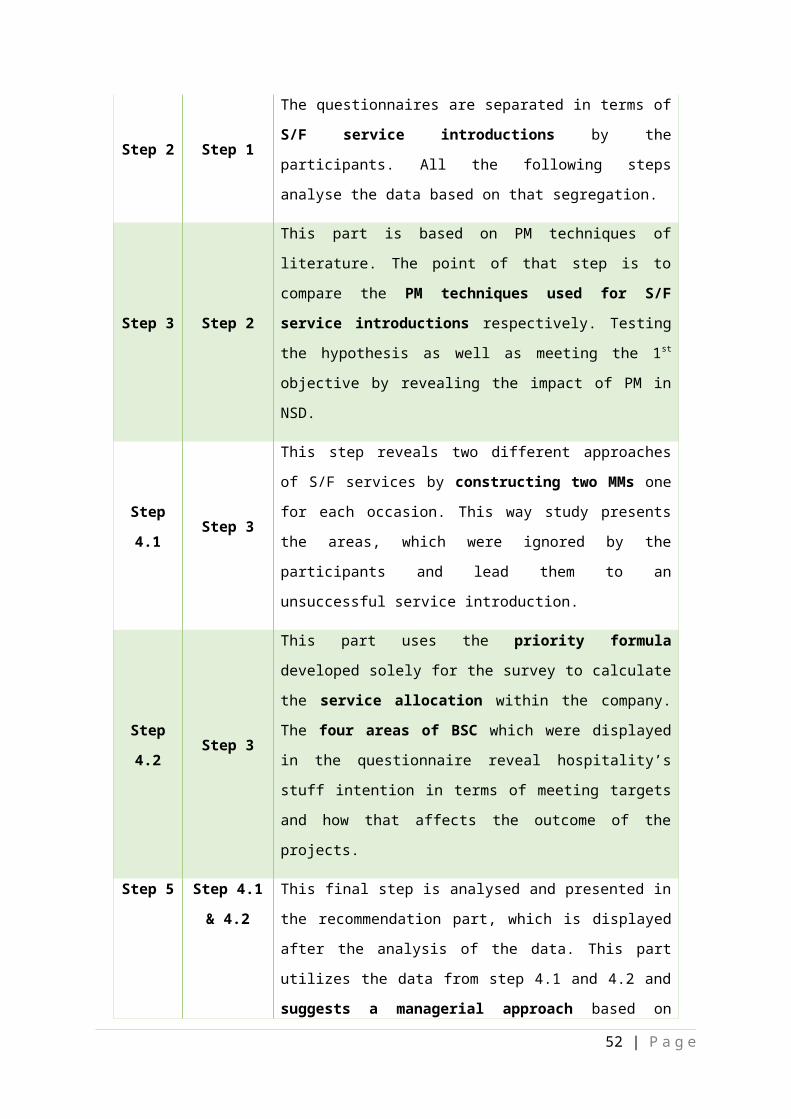
References
ACCORHOTELS.COM, 2012. ACCORHOTELS.COM. [Online] Available at: http://www.accorhotels.com/hotel-directory/gb/europe/united-kingdom/united-kingdom-hotel.htm[Accessed 27 July 2014].
Andersen, E. S. & Jessen, S. A., 2003. Project Maturity in Organisations. International Journal of project Management, 21(6), pp. 457-461.
Blumberg, B., Cooper, D. R. & Schindler , P. S., 2011. Business Research Methods. Third European Edition ed. Berkshire: Mc Graw-Hill Education UK Limited.
Boukis, A., 2013. Identifying some internal S/Ffactors of NSD projectperformance. International Journal of Retail& Distribution Management, 41(7), pp. 531-544.
Bryde, D. J., 2003. Project management concepts, methods and application. International Journal of Operations & Production Management , 23(7), pp. 775-793.
Burke, R., 2013. Project Management: Planning and Control Techniques. 5 ed. The Atrium, Outhern Gate, Chichester, West Essex, PO19 8SQ, United Kingdom: John Wiley & Sons Ltd.
Cortus , K. T., 1983. Project Planning and Management Technique. Public Administration Review, 43(5), pp. 459-466.
Donald, C. W., 1988. New Service Development. Journal of Marketing Management, 3(3), pp. 298-312.
Edvardsson, B. & Olsson, J., 1996. Key Concepts for New Service Development. The Service Industries Journal, 16(2), pp. 140-164.
Fisher, C. et al., 2007. Researching and Writing a Dissertation A Guidebook for Business Students. 2nd ed. Harlow, England: Pearson Education Limited.
Fitzsimmons, J. A. & Fitzsimmons, M. J., 2000. New Service Development: Creating Memorable Experiences. Thousand Oaks,: Sage Publications, Inc..
Griffin, A., 1997. PDMA research on new product development practices: updating trends and benchmarking best practices. Journal of Product Innovation Management, 14(6), pp. 429-458.
HFind.com, 2014. HFind.com GLOBAL HOTEL DATABASE. [Online] Available at: http://www.hfind.com/countries/united-kingdom.htm[Accessed 2 August 2014].
Jin, D., Chai, K.-H. & Tan, K.-C., 2014. New service development maturity model. Managing Service Quality, 14(1), pp. 86-116.
Johne, A. & Storey, C., 1998. New service development:a review of the literature andannotated bibliography. European Journal of Marketing, 32(3/4), pp. 184-251.
55 | P a g e
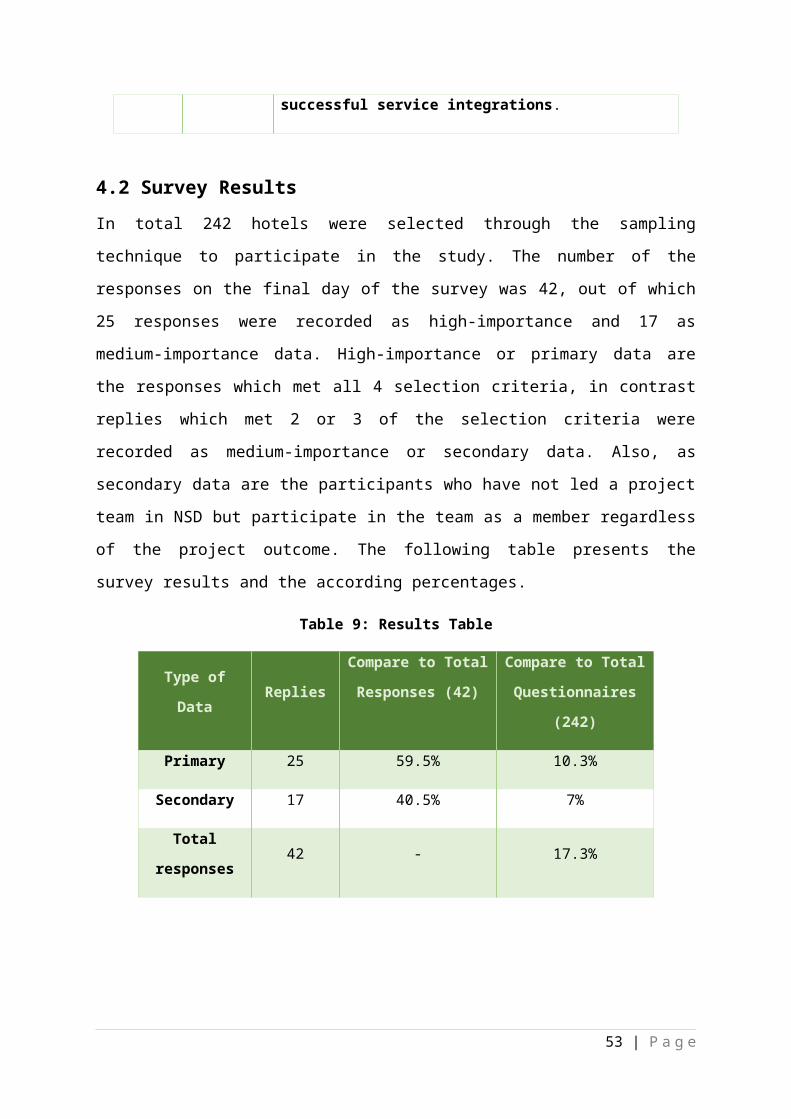
Kay, C. & Russette, J., 2000. Hospitality-management competencies. Cornell Hotel and Restaurant Administration Quarterly, 41(2), pp. 52-63.
Kitsios, F., Doumpos, M., Grigoroudis, E. & Zopounidis, C., 2009. Evaluation of new service development strategiesusing multicriteria analysis: predicting the successof innovative hospitality services. Department of Production Engineering and Management, Technical University of Crete, Volume 9, pp. 17-33.
Konu, H., Tuohino, A. & Komppula, R., 2010. Lake Wellness -- a practical example of a new service development (NSD) concept in tourism industries. Journal of Vacation Marketing, 16(2), p. 125–139.
Lebe, S. & Vrecko, I., 2014. Systemic integration of holistic project- and hospitality management. Kybernetes, 43(3/4), pp. 63-376.
Menor, L. J., Tatikonda, M. V. & Sampson, S. E., 2002. New service development: areas for exploitation and exploration. Journal of Operations Management, 20(1), pp. 135-157.
Nigel , E., 2005. Assessing the balanced scorecard as a management tool for hotels. International Journal of Contemporary Hospitality Management, 17(5), pp. 376-390.
Ottenbacher, M., Gnoth, J. & Jones, P., 2006. Identifying determinants of success in development of new high-contact services Insights from the hospitality industry. International Journal of Service Industry Management, 17(4), pp. 344-363.
Qualtrics.com, 2014. Qualtrics Online Survey Software. [Online] Available at: http://www.qualtrics.com/[Accessed 21 July 2014].
Sainaghi, R., Phillips, P. & Cortia, V., 2013. Measuring hotel performance: Using a balanced scorecard perspectives’ approach. International Journal of Hospitality Management, 34(1), pp. 150-159.
Santos, J. B. & Spring, M., 2013. New service development:managing the dynamic betweenservices and operations resources. International Journal of Operations &Production Management, 33(7), pp. 800-827.
Saunders, M., Lewis, P. & Thornhill, A., 2007. Research Methods for Business Students. 4th ed. Essex: Pearson Education Limited.
Tajeddini, K. & Trueman, M., 2012. Managing Swiss Hospitality: How cultural antecedents of innovation and customer-oriented value systems can influence performance in the hotel industry. International Journal of Hospitality Management, 31(1), pp. 1119-1129.
Umashankar, N., Srinivasan, R. & Hindman, D., 2011. Developing Customer Service Innovationsfor Service Employees: The Effects ofNSD Characteristics on InternalInnovation Magnitude. Journal of Service Research, 14(2), pp. 164-179.
Voegtli, C., 2000. High impact management techniques for any project. IEEE Antennas and Propagation Magazine, 42(5), pp. 122-124.
56 | P a g e
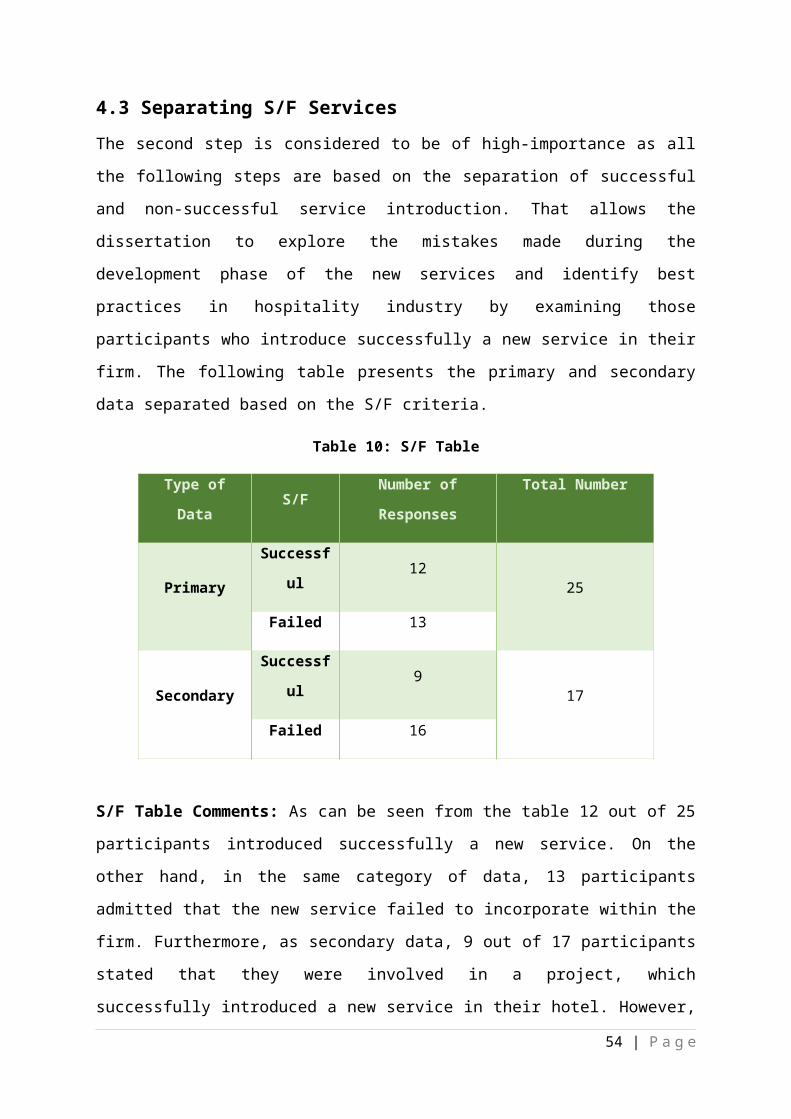
Appendices
Appendix 1 -Timetable
In this section is the timetable of the dissertation (Picture 6) commencing on 12th May 2014 until 4th September 2014. In the timetable are 16 tasks which are the milestones in order to complete successfully the dissertation. Although there would be more meeting with the supervisor of this study only the two more important were listed in the task list.
1. Reading Literature
3. Organising Literature
4. Research on Methodology
5. Design Methodology
6. Design Questionnaire
7. Create Target Group List
8. Supervisor Meeting
9. Distribute Questionnaire
10. Analyse Data
11. Present Research Outcome
12. Supervisor Meeting
13. Formalising Dissertation
14. Submission to Supervisor
15. Corrections
16. Final Submission
57 | P a g e
Reading Literature
Mapping Key Theories
Organising Literature
Research On Methedology
Design Methedology
Design Questionnaire
Create Target Group List
Supervisor Meeting
Distribute Questionnaire
Analyse Data
Present Research Outcome
Supervisor Meeting
Formalising Dissertation
Submission To Supervisor
Corrections
Final Submission
0 2 4 6 8 10 12
Timetable of Dissertation
58 | P a g e
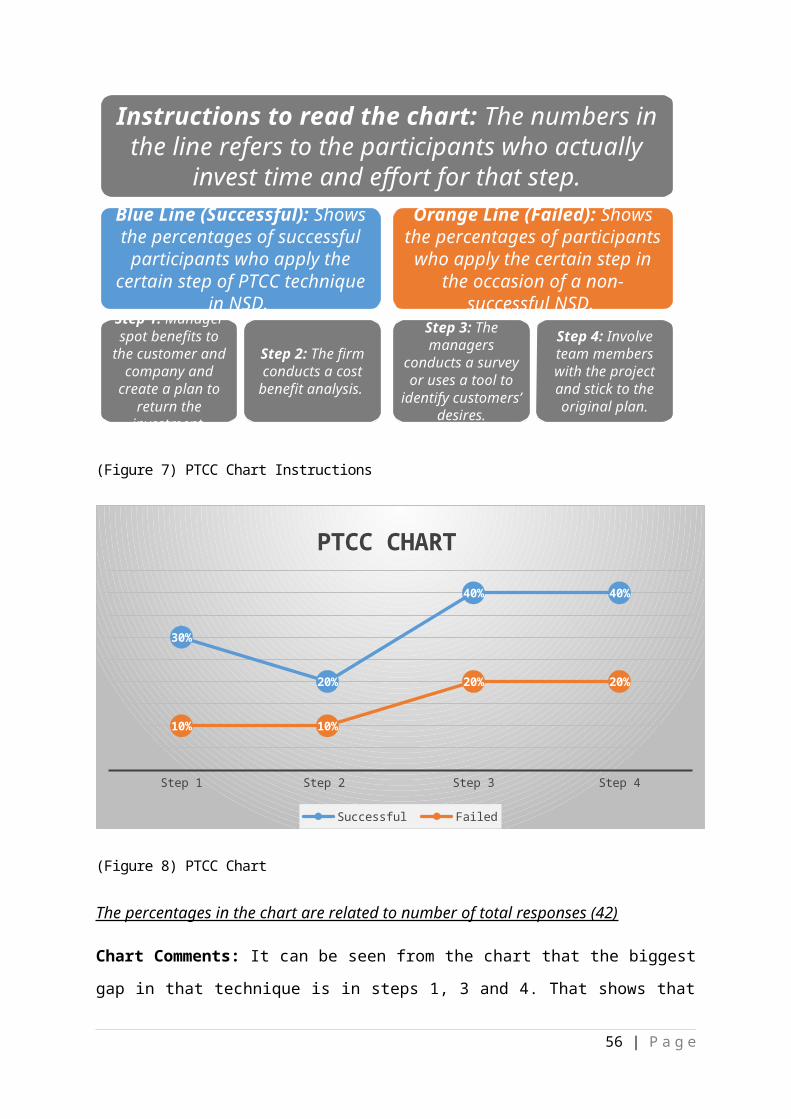
Appendix 2 - New Service Development Questionnaire
Block 1Q1: Thank you for taking part in this survey.
Q2: Please indicate the star rating of your hotel.______ Stars
Q3: Approximately how many years ago was your hotel established? >2 2-5 5-10 10<
Q4: Which department do you work for?Department............Role..........
Block 2Q5: Have you ever introduced any new services? Yes No
Q6: Please list any new services you have introduced.Service 1Service 2Service 3
Q7: Which of the above services have been introduced successfully?Service 1Service 2Service 3
Q8: What makes the introduction of a service successful?
59 | P a g e
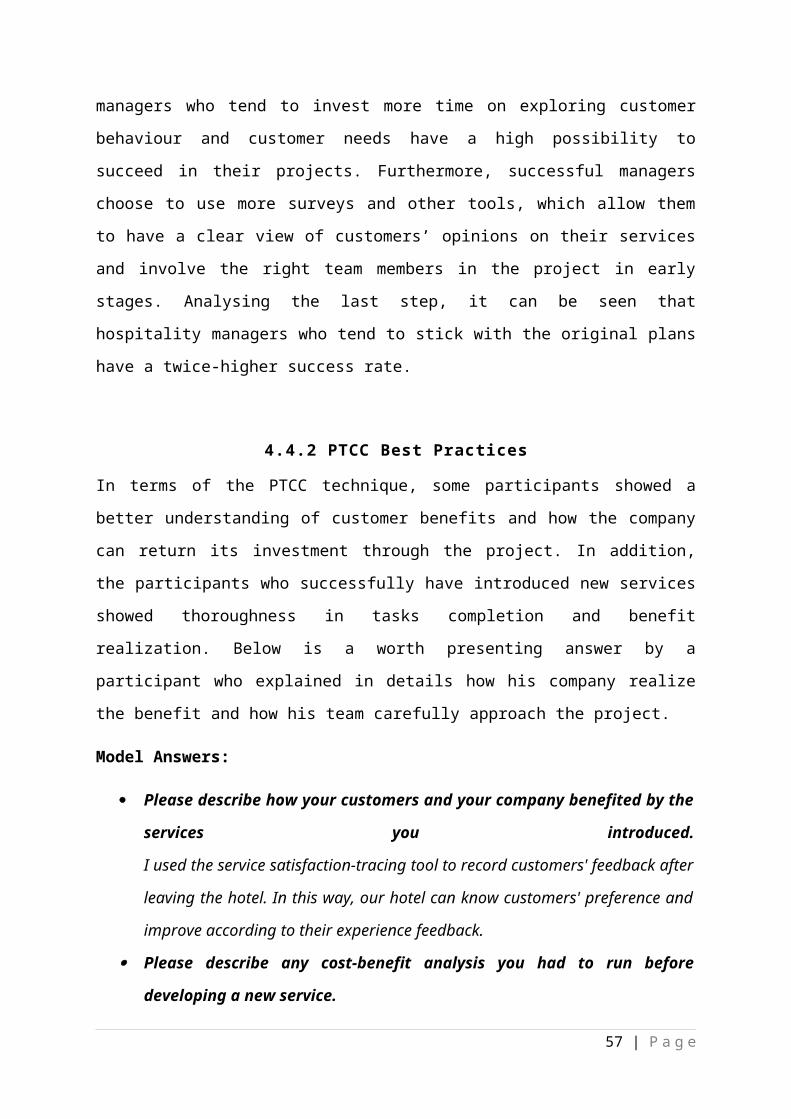
Q9: What are the main reasons for introducing new services within the hospitality sector?
Q10: Please rank the following areas in order of priority as seen by your company. (1-4, with 1 being the most important and 4 the least) ______ Success in achieving financial goals______ Increase in customer satisfaction______ Improvement in internal business activities______ Investment into innovation and staff development/training
Block 3Q11: How important are the following areas in developing new services? From 1 for unimportant to 5 for very important
Q12: Strategy Management: The allocation of resources in order to achieve the right balance between customer needs and services offered by the firm.
1 2 3 4 5
Goals and Objectives set
by higher management
Areas targeted by the managers
Allocation of resources within
the company
Q13: Process Standardisation: Use of appropriate tools for the development of new services.
1 2 3 4 5
Functionality of internal systems
Formal record keeping
Responsibilities/ roles allocation
60 | P a g e
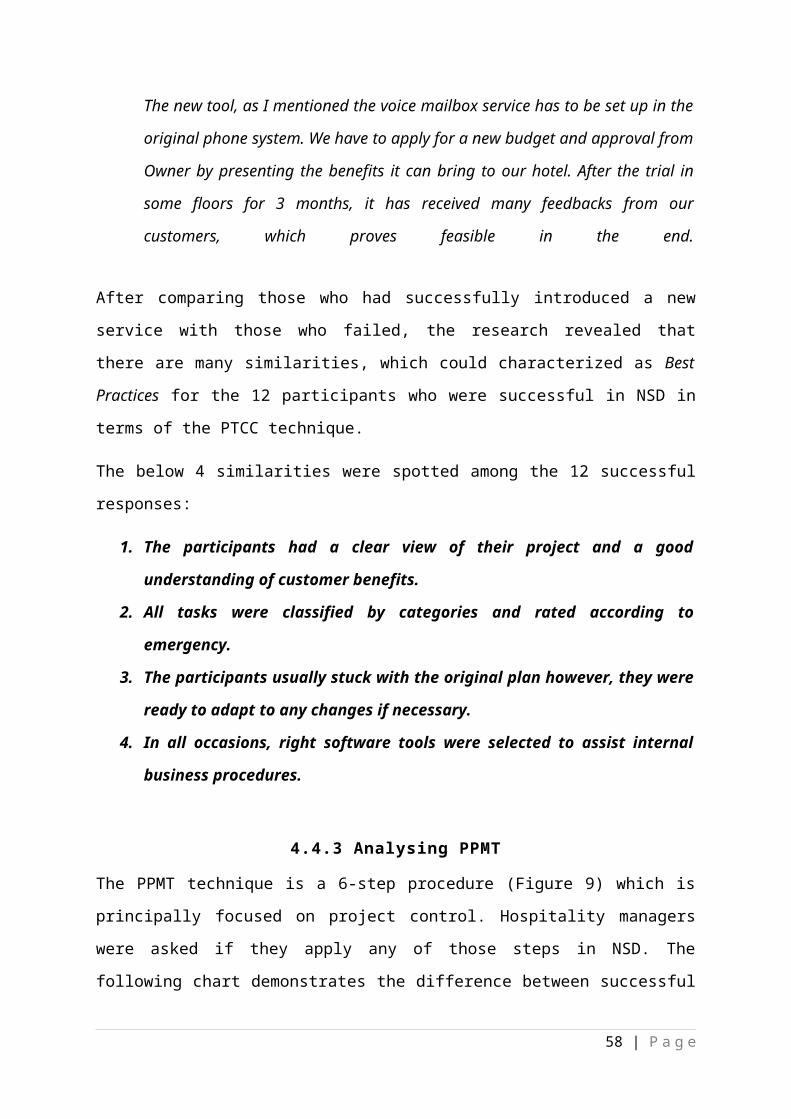
Q14: Knowledge Management: Communication and sharing of knowledge amongst team members.
1 2 3 4 5
Organizational Culture
Distribution of Information
throughout the company
Company IT tools
Q15: Customer Involvement: Degree of customer’s involvement.
1 2 3 4 5
The importance of customer’s
role for the firm
Degree of customer’s
involvement with the company
Means by which customers can
interact with the business
Block 4Q16: Please describe how your customers and your company benefited by the services you introduced.
Q17: Please describe any cost-benefit analysis you had to run before developing a new service.
Q18: How do you assess customers’ needs? (By conducting a survey online/phone etc.)
Q19: Please describe any changes you had to make to the original plan, whilst developing a new service.
61 | P a g e
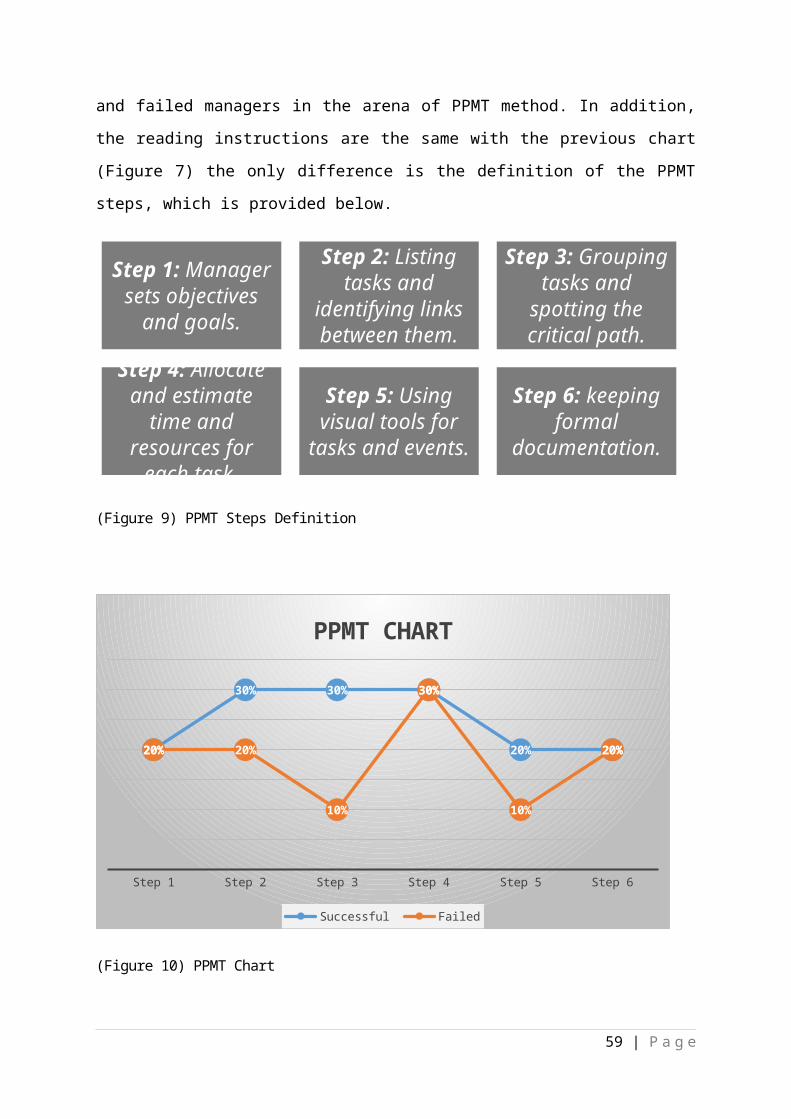
Block 5Q20: How do you set objectives and goals when introducing a new service?
Q21: How / where do you list all the relevant tasks required for the service to be completed?
Q22: How do you group tasks when planning the introduction of a new service?
Q23: How do you allocate/estimate the time and resources required for each task?
Q24: What kind of visual tools (e.g. charts, pies etc) do you use in order to have a clear view of your project?
Q25: What kind of record keeping methods do you apply when it comes to formal documentation related to a project?
Block 6Q26: We would appreciate if you provided us with any further comments concerning the new service development in hospitality industry or the survey in general.
62 | P a g e
Appendix 3 – Cover Letter
New Service Development in Hospitality Industry Questionnaire
MMU Business School
All Saints Campus,
Oxford Rd, Manchester
M15 6BH
http://www.business.mmu.ac.uk/
Dear Sir/Madam,
This questionnaire is part of a research project in order to explore the role of project management in the development of new services in hospitality industry in UK. Your responses will allow me to understand as possible the issues of that field.
The questionnaire should take approximately five to seven minutes to be completed. There would be spaces provided in order to answer each question. The questionnaire will be administered in the strictest confidence. Your identity and your responses will remain anonymous.
The results of the questionnaire will be used as part of the dissertation for my master degree in Project Management of Manchester Metropolitan University. Furthermore, valuable insights will be shared to participants.
The following link will lead you to the questionnaire: https://mmubusiness.az1.qualtrics.com/SE/?SID=SV_0SpbmSGwTaPNB65
Thank you for your time.
Kind regards,
Pavlos Vasileiadis
Email: [email protected]
Mobile: +44(0)7871660593
LinkedIn: uk.linkedin.com/pub/pavlos-vasileiadis/60/aa4/973/
63 | P a g e
64 | P a g e
1 | P a g e