Embed Size (px)
Citation preview
Institute of Plant Production and Agroecology in the Tropics and Subtropics
University of Hohenheim
Crop Waterstress Management
Prof. Dr. Folkard Asch
Genotypic responses of Rainfed Sorghum to a Latitude Gradient
Dissertation
Submitted in fulfilment of the requirements for the degree
“Doktor der Agrarwissenschaften”
(Dr. sc.agr. / Ph.D. in Agricultural Sciences)
to the
Faculty of Agricultural Sciences
presented by
ALHASSAN LANSAH ABDULAI
Tamale, Ghana
2016

This thesis titled "Genotypic responses of Rainfed Sorghum to a Latitude Gradient" was
accepted as a doctoral dissertation in fulfilment of the requirement for the degree "Doktor der
Agrarwissenschaften" by the Faculty of Agricultural Sciences at the University of Hohenheim on
May 30, 2016.
Date of oral examination: 30 May 2016, Hohenheim.
Examination Committee
Supervisor and Reviewer Prof. Dr. Folkard Asch
Co-Reviewer Apl. Prof. Dr. Bettina I. G. Haussmann
Additional examiner Prof. Dr. Jens Norbert Wünsche
Head of the committee Prof. Dr. Jörn Bennewitz

I
Acknowledgements
This study is part of the project "Developing Rice and Sorghum Crop Adaptation Strategies for
Climate Change in Vulnerable Environments in Africa" (RISOCAS) which addressed adaptation
of African agriculture to climate change. It was financially supported by the German Federal
Ministry for Economic Collaboration and Development through GIZ/BMZ (Project No.:
07.7860.5-001.00) is gratefully acknowledged. The leading institution in the implementation of
the project, Crop Water Stress Management in the Tropics and Subtropics of the University of
Hohenheim, Germany, the collaborating institutions including Africa Rice Center (AfricaRice),
Benin, Agricultural Research for Developing Countries (CIRAD), France and The Institute of
Rural Economy [Institut d’Economie Rurale (IER)], Mali are highly acknowledged. Savanna
Agricultural Research Institute, an autonomous institute under the Council for Scientific and
Industrial Research (CSIR-SARI) in Ghana did not only granted me study leave but also
accommodated my family during the course of the study and this is acknowledged and
appreciated.
II
Preface
This thesis is based on field trials conducted at multi-locations in Mali and is submitted together
with three manuscripts enclosed in partial fulfillment of the requirements for Ph.D. degree at the
Faculty of Agricultural Sciences. I am very grateful to the Federal Ministry of Cooperation and
Development, Germany for financially supporting the RISOCAS project which afforded me the
opportunity to accomplish this work. My sincere gratitude goes to the main supervisor, Prof. Dr.
Folkard Asch, for his invaluable assistance and for his readily available support during the
course of this work. I wish to express my appreciation for the commitment and dedication shown
by Apl. Prof. Dr. Bettina Haussmann, as co-reviewer, and Prof. Dr. Jens Wünsche, as examiner
for this work in the wake of the tightness of their schedules. The priceless contributions of PD.
Dr. Holger Brueck and Dr. Marcus Giese throughout the period of the work are acknowledged.
Dr Mamoutou Kouressy and Dr Michel Vaksmann were a wonderful pair who made both the
field work and social life in Bamako very enjoyable for me. Death denied me the benefits of the
wealth of experience possessed by the late PD Dr Heiko Parzies who was very passionate about
the work and my wellbeing (Heiko Rest in PERFECT Peace). Colleagues Drs Suchit P. Shrestha,
Sabine Stuerz, and Linda Gorim were always available for both the exchange of valuable
research ideas and socialization. Staff members of the Department of Plant Production and
Agroecology in the Tropics and Subtropics, especially Gabriele Kircher and Gabriele Schmidt,
will be remembered at all times for their readiness to help. Mention need be made of the
invaluable contributions made by the research assistants of the Soil, Plant and Water unit of the
Institute d'Economie Rurale (IER) at Sotuba in Bamako, Mali. Special mention need be made of
Madame Saphiatu Sangare Sall, Messrs Mohammed Lamine Tekete, Kane Mahamade and
Amadou Diarra (Driver). I am most grateful for the study leave granted me by the Director
General of CSIR and the Director and management of CSIR-SARI. The physical and moral
support from Messrs Philip Okyere and Nana Kwame Bridges Arhin need to be mentioned.
Finally, I wish to express my greatest thanks to my lovely wife (Philomina Kutame Abdulai) and
wonderful children (Hilda, Sarah, Grace, Walter, Blessed and Prosper) for enduring my long
absence from home by saying God Bless You All.

III
Table of Contents
Acknowledgements .......................................................................................................................... I
Preface............................................................................................................................................. II
Table of Contents .......................................................................................................................... III
List of Figures ................................................................................................................................ V
Summary ....................................................................................................................................... VI
Zussammenfassung .................................................................................................................... VIII
1 General introduction ................................................................................................................ 1
1.1 Sorghum (Sorghum bicolor L. Moench) .......................................................................... 1
1.2 Climate change, abiotic stresses, and sorghum ................................................................ 3
1.3 Climate variability and sorghum production .................................................................... 4
1.4 Genotypic Adaptability and Stability ............................................................................... 5
1.5 Adaptability Traits of Sorghum........................................................................................ 7
1.6 Research hypothesis ......................................................................................................... 9
1.7 Research objectives .......................................................................................................... 9
1.8 References ............................................................................................................................. 10
2 Yield Stability of Photoperiod Sensitive Sorghum [Sorghum bicolor L. (Moench)]
Accessions under Diverse Climatic Environments. ...................................................................... 16
3 Latitude and Date of Sowing Influences Phenology of Photoperiod-Sensitive Sorghums ... 33
4 Grain yield and its relations with some characters of grain sorghum under diverse
environments ................................................................................................................................. 43
5. Discussion .............................................................................................................................. 66
5.1 Environments and performance of the genotypes .......................................................... 66
5.2 Grain yield, yield stability, and trait relations ................................................................ 67

IV
5.3 Photo-thermal and latitudinal effects on phenology ...................................................... 69
6. Conclusion and outlook ......................................................................................................... 72
7 References ............................................................................................................................. 73
V
List of Figures
Figure 1.1: Global sorghum production. MT = Metric tons ........................................................... 3
Figure 5.5: Map of Mali depicting the trial sites and isohyets...................................................... 66
Figure 5.6: 10-day averages for rainfall and temperature for the growing seasons of 2008 and
2009 at Farako, Sotuba, and Cinzana in Mali. Arrows indicate decads when sowing was done.
First = first sowing; second = second sowing; third = third sowing. Figures after first, second,
and third indicate the total amount of rainfall received for the sowing dates. .............................. 67
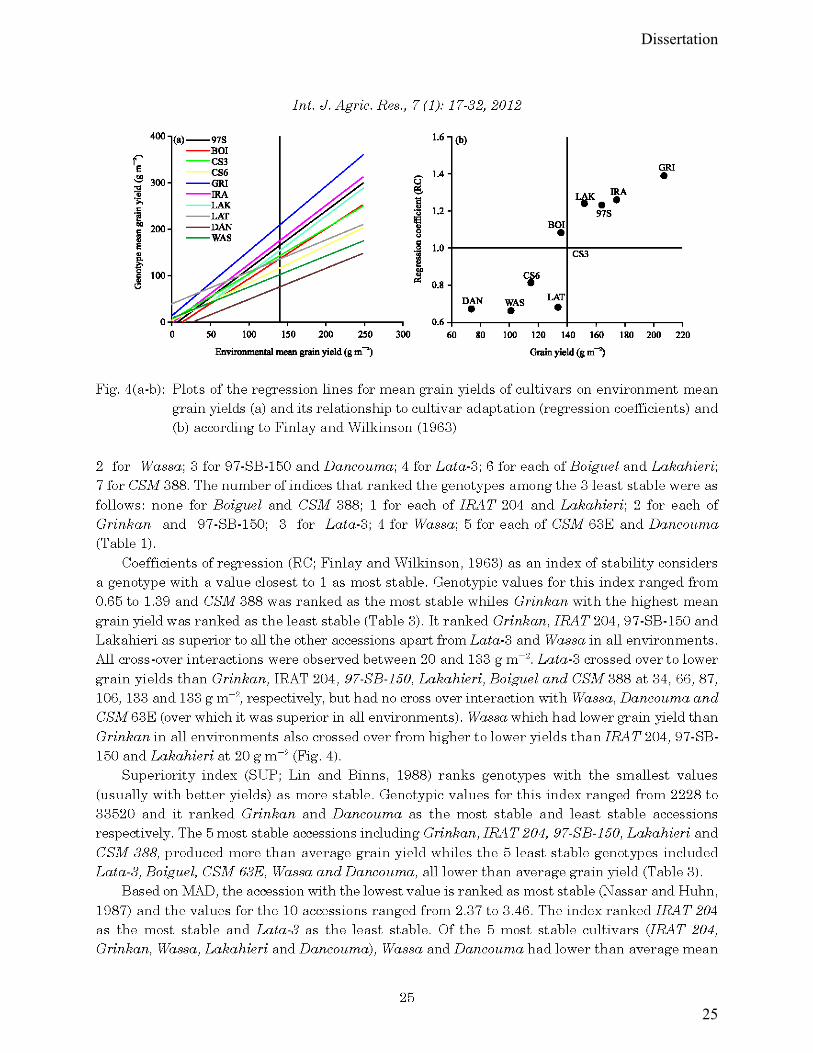
Figure 5.7: Plots of the regression lines for mean grain yields of cultivars on environment mean
grain yields (a) and its relationship to cultivar adaptation (regression coefficients) (b) according
to Finlay and Wilkinson (1963) (Abdulai et al., 2012). ................................................................ 68
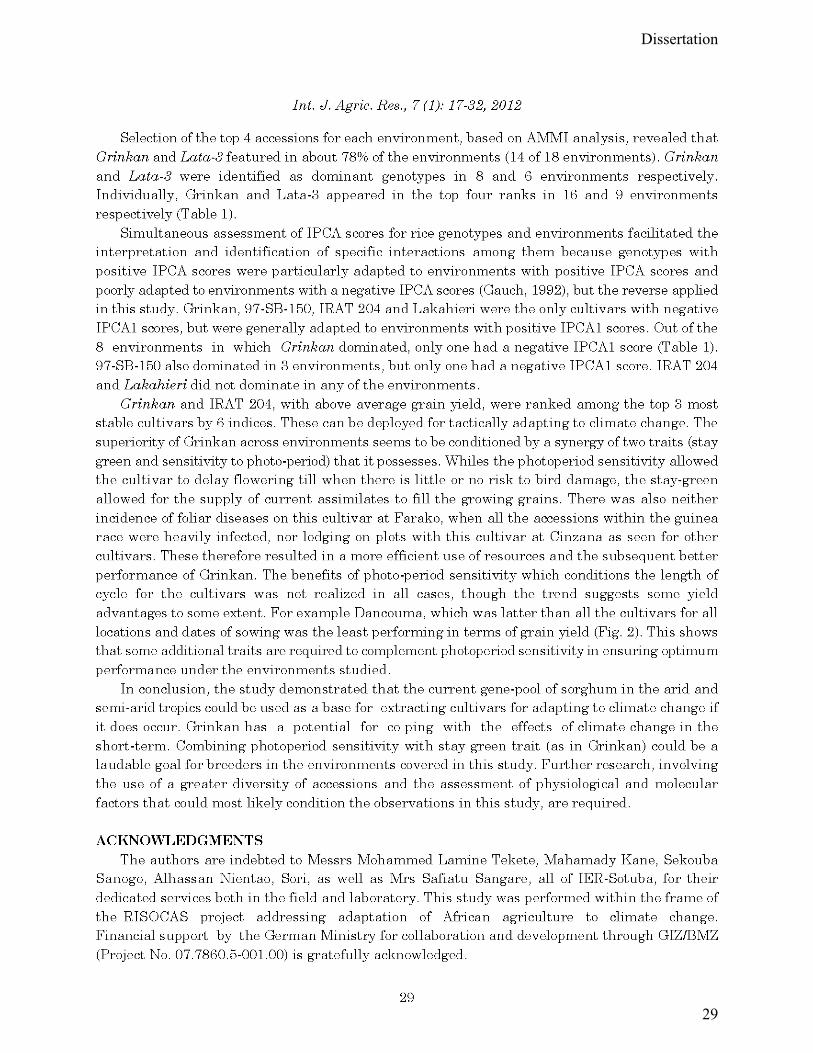
Figure 5.8- Latitude effect on the photoperiodism coefficient (Kp) of seven sorghum cultivars
evaluated at three locations (Cinzana, Sotuba, and Farako) along a North-South latitude gradient
in Mali. .......................................................................................................................................... 72

VI
Summary
Climate change poses various challenges to crop production systems. Coping with the changing
climate requires adaptation strategies that will enhance the resilience of crop production systems
to the resultant aberrant weather. However, the impacts of the changing climate are extremely
difficult to predict because the associated extreme events result in a complex of abiotic stresses.
These stresses act singly or in synergy with others to affect physiological processes at the
different growth and development stages of crop plants. Currently, the physiological and
phenological (developmental) response mechanisms of crops, as well as adaptation of cultivars
to these stresses are not very clear and well understood. The complex interactions between crops
and abiotic stresses make it difficult to accurately predict crop responses to climate change using
the available crop growth models that have been parameterized and validated using some climate
scenarios. While prediction of the complex ideotype-trait combinations may benefit breeders,
physiological models that are well validated for target environments are equally important.
Therefore, this study investigated elite grain sorghum genotypes from three races (Caudatum,
Durra, and Guinea) and a Guinea-Caudatum composite, with different degrees of sensitivity to
photoperiod and adaptation to a wide range of latitude locations, for their grain yield and yield
stability responses to different environments. The aim was to calibrate growth models in for use
in quantifying climate change effects on rainfed sorghum production systems. Field experiments
were established to investigate the yield performance and yield stability of ten genotypes in
eighteen environments created from a factorial combination of three locations (along a latitudinal
gradient) and three monthly-staggered dates of sowing within years in 2008 and 2009. Field
trials to study the phenology of seven of the ten genotypes were also established in a similar
fashion in 2009 and 2010. Data were also collected on yield and other traits for the first two
dates of sowing on six of the genotypes used for the yield performance trial to analyze the
relations between grain yield and the selected traits and also evaluate the potential of path
analysis in improving understanding of trait yield relations of grain sorghum. Mean grain yields
of 0 to 248 g m were recorded across environments and from 74 to 208 g m-2 across the 10
genotypes and generally reduced with delayed sowing. Grain yield was significantly influenced
by the main and interactive effects of location, year, sowing date, and genotype, necessitating the
assessment of yield superiority and stability for each of the ten cultivars. The only two Caudatum

VII
cultivars (Grinkan and IRAT 204) were ranked among the top three by six of the indices. The
study also brought to the fore that some yield stability indices correlate perfectly or very highly
and could be substituted one for the other when assessing yield stability of sorghum. Very strong
correlations were found between grain yield and each of shoot biomass, panicle weight, the
number of grains per panicle, and threshing ability across environments, but path coefficient
analysis confirmed that these traits are auto-correlated, with grains per panicle being the major
mediating trait in all the relationships. Relationships between grain yield and the remaining traits
were weak to medium and very inconsistent across the environments. This study brings to the
fore, the location- and / or environment-specific adaptation of existing genotypes which should
be exploited for tactical adaptation to changed climates, whiles genotypes with general or wider
adaptations to environments are being sought. The phenology study showed that for photoperiod
sensitive (PPS) genotypes, the number of days from emergence to panicle initiation and the
number of leaves increased with latitude and decreased with sowing date, a day-length difference
between locations of < 8 minutes increasing crop duration of some varieties by up to 3 weeks
and decreasing number of leaves by up to 11 for the same sowing date. Some varieties exhibited
photoperiod-insensitivity at one location and photoperiod-sensitivity at another location,
indicating the complex nature of photoperiod responses. The study also showed that existing
models do not accurately simulate the effect of latitude on the phenology of PPS sorghum, and
latitude has to be taken into account in adjusting coefficients to improve the accuracy of such
simulations. We conclude that genotypic response of rainfed sorghum is influenced by latitude,
sowing date, and their interactions, but very little by years. Some existing cultivars could be
deployed as tactical adaptive measures, while efforts are intensified to develop strategic adaptive
measures. If changes in rainfall and temperature reduce the length of growing seasons, genotypes
which are currently adapted to higher latitudes could easily be shifted southwards to lower
latitudes, while those at lower latitudes may fit poorly into the new environments. A large
potential for contributing to food security exist for the low latitudes if climates change in the
direction predicted in future. It is absolutely necessary to develop new models that will be able to
accurately simulate effects of sowing date and latitude on phenology. More research is needed to
understand physiological response mechanisms of the pronounced latitude effects on sorghum
phenology.

VIII
Zussammenfassung
Der Klimawandel stellt heutige Produktionssysteme vor eine Vielzahl von Herausforderungen.
Der Umgang mit dem Klimawandel erfordert Anpassungsstrategien um die Widerstandsfähigkeit
der Anbausysteme gegen sich wandelnde Wettergegebenheiten zu erhöhen. Allerdings sind die
Auswirkungen des Klimawandels äußerst schwierig vorherzusagen. Die damit verbundenen
Extremereignisse resultieren in einem Komplex von abiotischen Stressfaktoren, die einzeln oder
im Zusammenwirken mit anderen, unterschiedliche Auswirkungen auf die physiologischen
Prozesse in den verschiedenen Wachstums- und Entwicklungsstadien der Kulturpflanzen haben
können. Derzeit sind die physiologischen und phänologischen Reaktionsmechanismen von
Nutzpflanzenarten, sowie die Anpassung der verschiedenen Sorten auf diese Belastungen sind
nicht sehr klar oder eindeutig verstanden. Die komplexen Wechselwirkungen zwischen Pflanzen
und abiotische Stressfaktoren machen es schwierig deren Reaktionsweise auf den Klimawandel
vorherzusagen, selbst unter Verwendung der verfügbaren Pflanzenwachstumsmodelle, obwohl
die parametriert und für einige Aspekte der prognostizierten Klimaszenarien validiert sind.
Obwohl die Vorhersage der komplexen „Ideotype-Trait-Kombinationen“ den Züchter bei ihrer
Arbeit helfen kann sind physiologische Modelle, die für die Zielumgebungen validiert sind,
ebenso wichtig. Daher untersucht diese Studie Elite Sorghum-Genotypen (Caudatum, Durra,
Guinea), mit unterschiedlichen Graden der Empfindlichkeit gegenüber Aspekten der
Lichtperiode, die an eine breiten Palette Standorte angepasst sind, hinsichtlich ihres Kornertrags
und Ertragsstabilität unter verschiedene Umwelten, um die Wachstumsmodelle zu kalibrieren die
die Quantifizierung der Auswirkungen des Klimawandels auf niederschlagsgespeiste Sorghum
Produktionssysteme erleichtern sollen. Zwei Feldversuche wurden etabliert, insgesamt wurden
dafür achtzehn Umwelten aus einer faktoriellen Kombination der drei Standorte (entlang eines
Breiten Gradienten) sowie dreier monatlich gestaffelter Aussaattermine über zwei Jahre hinweg
untersucht. Ziel war es die Stabilität der Ertragsleistung der zehn Genotypen im Jahr 2008 und
2009 zu untersuchen, sowie für die Jahre 2009 und 2010 Phänologische Aspekte von sieben
Genotypen zu erfassen. Von sechs der untersuchten Genotypen wurden zudem Ertragsdaten und
zusätzliche phenologische Merkmale detailliert erhoben, um die Beziehungen zwischen
Kornertrag und selektierten traits zu analysieren sowie das Potenzial der Pfadanalyse für ein

IX
besseres Verständnis der Trait-Ausbeute Beziehungen von Sorghum zu klären. Mittlere
Kornerträge von 0 bis 248 g m-2 wurden in den verschiedenen Umwelten erfasst, ebenso
Erträge von 74 bis 208 g m-2 für die Versuche zu den 10 selektierten Genotypen; diese
reduzierten sich als Faustregel mit verzögerter Aussaat. Die wichtigsten (signifikanten und
interaktiven) Effekte auf den Kornertrag hatten die Faktoren Lage, Jahr, Datum der Aussaat
sowie Genotyp, was eine detailliertere Untersuchung der Ertragsstabilität und Ertragsleistung für
die selektierten Kultivare nötig machte. Die einzigen beiden caudatum Sorten (Grinkan und
IRAT 204) wurden unter den Top Drei für sechs der Indizes einsortiert. Die Studie zeigt
außerdem dass einige der Indices zur Ertragsstabilität zueinander korreliert sind und deswegen
für eine Beurteilung der Erträge von Sorghum wechselseitig austauschbar sind. Es wurden sehr
starke Korrelationen zwischen Kornertrag und den folgenden Faktoren festgestellt:
Sprossbiomasse, Gewicht der Rispe und Anzahl der Körner pro Rispe. Eine Analyse der
Pfadkoeffizienten bestätigte, dass diese Charakteristika Auto-korreliert sind, wobei aber Körner
pro Rispe das Hauptvermittlungsmerkmal in allen Beziehungen darstellt. Beziehungen zwischen
Kornertrag und den restlichen Charakteristika waren schwach bis mittelgroß und sehr
uneinheitlich über die für die Studie verwendeten Umwelten. In dieser Studie konnten die Orts-
Umweltbedingten Anpassungen der Genotypen aufgezeigt werden, die für eine taktische
Anpassung an veränderte Klimabedingungen ausgenutzt werden sollen, während weitere
Genotypen mit allgemeinen oder größeren Anpassungen an sich verschiedene Umgebungen
gesucht werden. Die phenologische Studie zeigte, dass bei photoperiodisch sensitiven Genotypen
die Anzahl der Tage vom Auflauf bis zur Initiierung der Rispe sowie die Anzahl der Blätter sich
stark erhöht mit dem Breitengrad und verringert mit dem Datum der Aussaat. Die Studie zeigte
auch, dass die Unterschiede in der Breite, trotz eines Unterschieds in der maximalem
Tageslängendifferenz zwischen Standorten von weniger als <8 min, für einige Sorten eine
deutlich (bis zu 3 Wochen) verlängerte Anbauperiode ergab. Einige Sorten wiesen an einem
Standort eine Unempfindlichkeit gegenüber der Photoperiode auf, während sie an anderer Stelle
empfindlich auf die Photoperiode reagierten. Dies verdeutlicht die Komplexität von
Fragestellung in Bezug auf die Photoperiode. Die Studie zeigte auch, dass die vorhandenen
Modelle die Auswirkung der Breite auf die Phänologie von Sorghum nicht korrekt einschätzen.
Um die Bestimmung der optimalen Bereiche für die Sorten in Westafrika zu erleichtern und die
Auswirkungen des Klimawandels prognostizieren zu können wird eine Korrektur der
X
Simulationskoeffizienten unter Berücksichtigung des Breitengrades vorgeschlagen.
Abschließend folgere ich aus dieser Studie dass die genotypische Antwort von Sorghum durch
den Breitengrad, den Zeitpunkt der Aussaat und deren Wechselwirkungen, aber sehr wenig von
interannuellen Schwankungen beeinflusst wird. Einige der existierenden Sorten sollten für
taktische Anpassungsstrategien auf lokale umwelt-spezifische Bedingungen genutzt werden,
während gleichzeitig die Zuchtbemühungen intensiviert werden müssen um geeignete Sorten für
die strategische Anpassung an veränderte Klimabedingungen zu entwickeln. Bei sinkenden
Niederschlagsmengen und steigenden Temperaturen, könnten Genotypen aus höheren
Breitengraden, bedingt durch eine Verkürzungen der Anbauperiode neue optimale
Anbaubedingungen in niedrigeren Breiten finden . Gleichzeitig würden Genotypen die derzeit
niedrige Breitegrade angepasst sind schlecht in höhere Breiten passen, hauptsächlich wegen ihrer
langen Anbaudauer und des Phänomens der mit dem Breitengrad ansteigenden Anbaudauer aus
dieser Studie. Ein großes Potenzial für einen Beitrag zur Ernährungssicherheit besteht in den
niedrigen Breitengraden, vor allem unter Berücksichtigung der zukünftigen Klimaszenarien. Es
ist absolut notwendig neue Modelle zu entwickeln, die in der Lage sind die Auswirkungen der
beiden Faktoren „Tag der Aussaat“ und „Breitengrad“ vorherzusagen. Mehr Forschung ist
notwendig, um die physiologischen Reaktionsmechanismen der ausgeprägten Auswirkungen des
Breitengrades auf die Sorghum Phänologie zu verstehen.
Dissertation
1
1 General introduction
1.1 Sorghum (Sorghum bicolor L. Moench)
The genus Sorghum is incredibly diverse with members of the genus present throughout the
semi-arid tropics. The center of origin is in Eastern Africa; a significant amount of diversity still
exists in this region today (Dahlberg, 2001). Based on phenology and genetics, Garber (1950)
and Celarier (1959) subdivided the genus into five subgenera: Sorghum, Chaetosorghum,
Heterosorghum, Parasorghum, and Stiposorghum. The cultivated sorghums are included in the
Sorghum subgenera and Snowden (1936) completed the classification of this subgenera. Celarier
(1959) reported that the base chromosome number in the Sorghum subgenera is n = 10 and most
members of the subgenera were diploid (2n = 2x = 20); but several members were polyploid (2n
= 4x = 40). de Wet (1978) further classified the Sorghum subgenera by recognizing three distinct
species: S. propinquum, S. halepense, and S. bicolor. Furthermore, S. bicolor was divided into
three sub-species: drumondii, bicolor, and verticilliflorum. All of the cultivated sorghums are
classified as S. bicolor subsp. bicolor. Finally, the primary gene pool of S. bicolor L. Moench
was finally partitioned into five basic races (designated Bicolor, Guinea, Caudatum, Kafir, and
Durra) and 10 intermediate races from the combinations of the five basic races (Harlan and de
Wet, 1972) that have different but overlapping geographic distributions (House, 1985). These
races are used today for the classification of sorghum germplasm collections. In addition, these
races are reflective of different patterns of production and utilization in specific geographic
regions.
Sorghum [Sorghum bicolor (L.) Moench] is an important and widely cultivated small-grain
cereal grown between 40°N and 40°S of the equator (Doggett, 1988). It is mainly a rainfed crop
of lowland, semi-arid areas of the Tropics and Sub-Tropics and a post-rainy season crop grown
on residual soil moisture, particularly in India. Depending on the location, sorghum is grown for
many different purposes. The grain is used for food, feed, and industrial purposes, while the stalk
is used as forage in many production systems. The specific type of sorghum grown depends on
the ultimate end use which varies with location. For example, in many regions of Africa,
sorghum is a vital food grain and the stalk and leaves are valued as forage and building materials.
In these production systems, the farmers demand pure-line cultivars that are tall with specific

2
food quality parameters and stable production under stress. Farmers grow Bicolor throughout
much of Africa, Durra predominantly in East Africa, Kafir primarily in Southern Africa,
Caudatum in East Africa to Nigeria, and Guinea in West and Southern Africa (Dahlberg, 2000).
However, in the developed world, sorghum is grown as a feed grain with high input and
management. The production system is mechanized and demands sorghum hybrids with high
yield potential, relatively short, lodging resistant, and responsive to favorable environmental
conditions.
In 2014, sorghum was grown on more than 44 million hectares globally with an average yield of
1536 kg ha-1
to produce a total of more than 67 million metric tons (Figure 1.1). In the same
year, Africa accounted for 65% of the global area cropped to sorghum (more than 29 million
hectares) to produce nearly 29 million metric tons, representing more than 40% of global
production, with a mean yield of 999 kg ha-1
(FAO, 2016). The area cultivated to sorghum in
West Africa was more than 12.5 million hectares in 2014. With an average yield of more than
900 kg ha-1
, West Africa produced more than 12 million metric tons of sorghum in 2014 (FAO,
2016). From 1979 to 2001, sorghum production in West Africa increased from 5.1 to 13 million
tons, but declined to 12 million tons in 2014, and mean yields are stagnant (890 kg ha-1
in 1979;
780 kg ha-1
in 1992-94; 830 kg ha-1
in 2001; 900 kg ha-1
in 2014) (FAO, 2016).
More than 70% of the world’s total production of sorghum comes from developing countries in
Asia and Africa where the crop is the mainstay of resource and technology poor farmers and is
grown with limited inputs of water and nutrients. As a result of being relatively tolerant of heat
and drought, sorghum constitutes an integral component of agricultural production throughout
Africa (House et al., 2000) and plays a pivotal role in the economies of nations within the semi-
arid and sub-humid regions of tropical Africa, contributing substantially to total cereal
production in these areas. In West Africa, sorghum is grown mainly as a rainfed crop between
May and November, so climatic factors play a significant role in its productivity. The sorghum
plants grow mostly under progressively decreasing day length resulting in a shortening of crop
duration for photoperiod sensitive cultivars, particularly when sowing is delayed.

Dissertation
3
Figure 1.1: Global sorghum production. MT = Metric tons
1.2 Climate change, abiotic stresses, and sorghum
The Inter-governmental Panel on Climate Change (IPCC) projects a 1.8-4.0ºC rise in surface air
temperature together with the very likely occurrence of frequent extreme weather (heat waves,
drought, floods) in the 21st century (IPCC, 2007). Increased concentration of CO2 in the
atmosphere, rising temperature, and increased variability in the onset, amount, distribution, and
cessation of rainfall are the major climate change related phenomena with potential impact on
sorghum production. These phenomena threaten crop productivity in the most vulnerable regions
of the world and could have substantial negative impacts (Nelson, 2009; Parry et al., 2004).
The potential benefits of increased CO2 concentration in the atmosphere are negated through a
reduction in grain yield due to the shortening of the growth cycle, the increase in maintenance
respiration and the decrease in sink size resulting from the increase in temperature (Matthews
and Wassmann, 2003). No significant yield increases in sorghum were found by von Caemmerer
and Furbank (2003) under carbon dioxide fertilization because in C4 crops photosynthesis is CO2
saturated. However, some experiments have conclusively shown the stimulation of carbon
assimilation under elevated CO2 during drought or short-term water stress conditions because of
a reduction in stomatal conductance which improved water use efficiency (Ghannoum et al.,
2000; Vu and Leon, 2009).
Sorghum and other C4 plants have a higher optimum temperature for photosynthesis than C3
plants, and Maiti (1996) published the mean optimum temperature ranges for sorghum as 21-
35ºC for germination; 26-34ºC for vegetative growth and development; and 25-28ºC for
Source: USDA, 2015.

4
reproductive growth. Attri and Rathore (2003) found that higher temperatures reduced yield by
triggering a rapid accumulation of growing degree days which hastened growth and development
of the crop and resulted in the reduction of pheno-phase duration. Others found that high
temperatures decreased the rate of biomass accumulation, pollen viability, seed setting and
duration of seed-filling (Schoper et al., 1986; Fuhrer, 2003;), resulting in smaller seeds and lower
seed weights (Chowdhury and Wardlaw, 1978; Kiniry and Musser, 1988; Abrol and Ingran,
1996). Physiologically, higher than optimum temperatures reduce the activity of Rubisco (the
enzyme responsible for CO2 assimilation in plants), its specificity for CO2, and the solubility of
CO2 relative to O2 (Jordan and Ogren, 1984; Brooks and Farquhar, 1985; Holiday et al., 1992),
thus resulting in a net loss of carbon assimilates.
In sorghum, drought stress at either pre-flowering or post-flowering stage can result in heavy
yield loss. Traits such as greater leaf photosynthetic rates, greater canopy temperature
depression, improved panicle exsertion, and increased pollen viability have been cited as being
associated with pre-flowering drought tolerance (Ayeneh et al., 2002; Lawlor and Cornic, 2002).
For tolerance to post-flowering drought, improved rooting depth, stay-green, longer seed filling
duration, increased seed filling rate, and increased individual seed weight have been cited
(Tuinstra et al ., 1997; Rajcan and Tollenaar, 1999; Borrell et al., 2000; Hoad et al., 2001; Sharp
et al., 2004; Harris et al., 2007). Mild drought stress accelerated flowering of sorghum, while
severe drought stress resulted in delayed flowering of sorghum (Seetharama et al., 1984).
Matthews et al. (1990) found that moisture stress delayed panicle initiation and suggested that if
drought occurs before panicle initiation, sorghum plants tend to delay switching to the
reproductive phase in order to wait for favorable weather conditions, but hastens maturity when
drought stress occurs after panicle initiation.
1.3 Climate variability and sorghum production
Climate variability is a characteristic feature of the Tropics, particularly West Africa where the
summer monsoon starts from May/June and ends mostly in October (Sivakumar, 1988). But this
has been increased by climate change to create challenges for farmers in the form of
unpredictably variable onset of rains and length of growing seasons. Cooper et al. (2008) showed
for Eastern and Southern Africa that variability of rainfall increases with decreasing amount of
Dissertation
5
rain. So, the most vulnerable farmers face the stiffest challenges posed by climate change and
variability.
Sorghum panicles are affected by grain mold if flowering coincides with high atmospheric
humidity (Ratnadass et al., 2003). Birds damage sorghum panicles if the crop sets grain at a time
wild flora and crops on neighboring cultivated plots have not set grain (Cochemé and Franquin,
1967; Curtis, 1968). To reduce bird damage and grain mold infection, farmers have to combine
cultivars and sowing dates in such a manner that flowering occurs during the last 20 days of the
rainy season, so that the grain filling process will not be perturbed (Kouressy et al., 2008; Traoré
et al., 2000; Vaksmann et al., 1996) and the risk of terminal drought (detrimental to grain
filling), due to flowering later than this time, is averted (Borrell et al., 2000).
Sensitivity to photoperiod is a trait that effectively synchronizes the final developmental stages
with the end of the rainy season. Photoperiod-sensitive varieties are, therefore, very important for
African farmers (Soumaré et al., 2008) who have to contend with the conditions mentioned
above.
Accurate prediction of phenology is highly relevant for coping with such conditions. Under
optimal moisture and fertility conditions, the phenology of day-neutral varieties can be easily
predicted, because panicle initiation occurs after a constant thermal time, but is more complex
for photoperiod-sensitive varieties in which day length and/or temperature modify the duration of
the vegetative phase. For these cultivars, panicle initiation occurs when photoperiod drops below
a cultivar-specific and age-dependent threshold (Folliard et al., 2004). Jarvis et al. (2011) stated
that the projected increase in climate variability will intensify the cycle of poverty, natural
resource degradation, vulnerability and dependence on external assistance if effective
interventions are not made.
1.4 Genotypic Adaptability and Stability
Adaptability of a genotype is conditioned by both major and minor genes. For example, some
major genes for vernalization requirement, photoperiod insensitivity and semi-dwarfism have
played major roles in adapting wheat and rice to new environments. Minor genes for adaptability
have been discovered using quantitative traits locus (QTL) analysis. For example, QTLs
conditioning both general adaptability and also specific adaptability to rain-fed conditions have

6
been found in wheat (Farshadfar and Sutka, 2003; Kato et al., 2000). Separate Amplified
fragment length polymorphism (AFLP) markers for grain yield, stability and adaptability were
identified in spring barley by Kraakman et al., in 2004. Traits that ensure phenotypic plasticity,
diversity for adaptation within a genetically heterogeneous variety or plant stand, and direct
conferment of tolerance or resistance to abiotic and biotic stresses, could help attain yield
stability of sorghum in unpredictably variable environments (Haussmann et al., 2012).
Natural factors such as geography, climate, season and relief as well as human factors such as
agronomy determine environments (Dencic et al., 2000; Farshadfar and Sutka, 2003; Chloupek
et al., 2004) and associated biotic and abiotic conditions. Matching phenology to given abiotic
and biotic conditions is a prerequisite for good varietal adaptation within a given environment.
That is particularly important in the context of climate change because the temperature increase
is likely to modify the precocity of the varieties (Craufurd and Wheeler, 2009). Agricultural
crops are considered to originate from nine homelands but became adapted to new environments
as they advanced across the world (Chloupek and Hrstkova, 2005), and were exposed to
selection pressures, which were absent from their origins. Human selection favored
characteristics of low selective value in the wild and a dependence on man-made habitats
(Harlan, 1992).
Modern plant breeding programs aim to develop genotypes with high and stable yields because
yield stability has become more important for sustainable plant production. Farmers feel more
secure with cultivars that have stable yields than with cultivars with high potential yield in
favorable environments (Dawson et al., 2007). Yield stability could either be static or dynamic
(Becker and Léon, 1988). A genotype has static stability if its performance is constant across
different environments and this is desired for qualitative traits, such as resistance to certain stress
characters. A genotype is said to have dynamic stability if its performance at any given
environment is near the expected yield potential of that environment. Dynamic stability is more
appropriate for yield measures since static stability tends to favor low yielding genotypes
(Becker and Léon, 1988). Genotypes with greater stability show weak GxE interactions (GEI).
The aim of genotypic stability, therefore, is to minimize GEI.
Understanding and exploiting GEI is important for setting up new breeding programs. At both
the species and variety levels, variations in adaptability to different environments have been
observed (e.g. Dencic et al., 2000; Banziger and Cooper, 2001). The ability to perform at

Dissertation
7
acceptable levels in a range of environments is general adaptability, while specific adaptability
refers to an ability to perform well only in particular environments (Dencic et al., 2000;
Chloupek et al., 2003; Farshadfar and Sutka, 2003).
1.5 Adaptability Traits of Sorghum
Crop cultivars targeted at adaptation to climate change and variability can be developed through
direct selection for performance in the target stress environments or indirect selection through
specific morphological, phenological or physiological characteristics. However, the use of
indirect selection should involve traits that are easy to identify, cheap and fast to measure and /
or have a strong genetic correlation with yield performance under the target condition (Falconer,
1989). Combining multi-locations, multi-years, and staggered sowing dates within a year can be
used to create an array of environments for testing and / or selecting cultivars for adaptation to
each of the environments.
Photoperiod sensitivity is among the most important escape traits for a multitude of abiotic and
biotic stresses, as it allows the plant to complete its reproductive stage under environmentally
optimal conditions (Dingkuhn and Asch, 1999; Dingkuhn et al., 2007; Kouressy et al., 2007a).
For a long time, photoperiod sensitivity was believed to be a genetic constant that needed to be
broken via breeding to better fit genotypes to the requirements of modern agriculture (Khush,
1977). A number of authors have shown that photoperiod sensitivity also depends on
environmental factors, such as water availability and radiation (Shresta, 2007; Dingkuhn and
Asch, 1999). Photoperiod sensitivity allows cultivars sown on different dates to mature at the
same time, and could be used indirectly for selecting cultivars targeted at situations where the
onset of the cropping season requires the use of varied sowing dates (Curtis, 1968). Flowering
patterns of a single early sowing date can be used to indirectly measure photoperiod sensitivity
because a strong relationship has been found between later maturity and photoperiod sensitivity
in sorghum (Clerget et al., 2007). Haussmann et al. (2012), have presented a list of potential
traits for adaptation to climate change to include the following: photoperiod sensitivity for
matching vegetative the crop cycle to available growing period despite variable sowing dates and
to reduce risks of biotic (damage by birds, grain moulds) and abiotic (terminal drought) stress
because of variable sowing dates; plastic tillering for spreading flowering/maturity period,
reducing exposure to severe stress at a single point in time and inherent capacity to respond to

8
improved conditions; very early maturity for completion of grain filling in more predictably
short growing period; flood tolerance for plant survival under temporary flooding. The authors
also tagged phosphorus efficiency, stay green, drought-induced senescence, and root architecture
as traits that still need to be investigated for their usefulness to sorghum cultivars cultivated in
Africa.
The highly variable sowing dates, due in part to erratic onset of the rainy season, present great
challenges to farmers who generally want their grains to mature during a more fixed calendar
window to ensure successful grain filling and pest avoidance (Niangado, 2001), as well as
minimal loss of quantity and quality of grain to bird damage and grain mold complex.
The duration of a crop is one other trait that can influence its adaptability to a given environment.
The time a crop takes to flower influences its duration, while the transition of plant growth from
the vegetative to the reproductive stage is the primary determinant of flowering time of
determinate crops such as sorghum. Sorghum as a short-day plant will, therefore, initiate panicles
when the appropriate day-length which serves as a trigger is sensed. Therefore, under conditions
of climate change, sensitivity to photoperiod will be a useful trait for adapting flowering time to
temperature and water requirements of the crop (Vaksmann et al., 1996), since it will allow
batches of sorghum crops sown at different times to initiate panicles at almost the same time,
thus widening the window for sowing. Thus, photoperiod-sensitive flowering responses of
sorghum in West and Central Africa (WCA) enhance adaptation by enabling more or less fixed
maturity dates despite variable sowing dates (Vaksmann et al., 1996; Haussmann et al., 2007;
Clerget et al, 2008).
A better understanding of the mechanisms of coping with current climate variability is not only
essential but is a prerequisite for adaptation to future climate change (Cooper et al., 2008).
Climatologists, breeders, and agronomists need tools to translate variable climatic conditions into
probable crop performance, and to identify suitable genotypic characteristics that can enhance
adaptation to the different agro-ecological zones. Crop adaptation strategies such as the
introduction of new crop varieties, adjustment of planting dates to fit the new cropping calendars,
and development of appropriate component technologies are required for coping with the
changing climate. However, significant gaps in knowledge on how the performance of specific
crop plants respond to latitude, shifting planting dates and their complex interactions exist and
need to be filled.

Dissertation
9
1.6 Research hypothesis
Rainfed sorghum is influenced to a large extent by spatiotemporal variability in climatic
conditions determined mostly by the availability of water and nutrients, and the length of the
growing season. Water is a major limiting factor to rainfed sorghum production because sorghum
is cultivated in arid to semi-arid areas with very high production potentials due to the lack of
cloud cover and the consequent high solar radiation input. Climate change influences the onset
and cessation of rainfall which determines the length of the growing season and the type of
cultivar to grow for any given year.
The hypothesis of this study is that phenology, yield, and yield stability of grain sorghum are
influenced by the effect of latitude and staggered monthly sowing dates since the microclimate at
different development phases of genotypes will depend on the environments. Differences in
latitude will differentially influence the phenology of sorghum cultivars because the amplitude of
photoperiod increases with latitude.
1.7 Research objectives
The main objective of this study was to investigate genotypic responses of tropical grain
sorghum to different environments with the sole aim of combining crop responses with models to
facilitate the evaluation of adaptation mechanisms of genotypes under climate change scenarios.
This should make it possible to propose crop ideotypes that will enhance the resilience of
production systems via appropriate adaptation to specific changes in the environment, and thus
contribute to the development of tools that can be used for tactical and strategic decisions to
ensure adaptation of agriculture to the changing climates.
Field trials that combine the assessment of phenology, yield, and yield stability as well as how
grain yield relates with other plant characters of rainfed sorghum along a latitudinal gradient
have not been given much attention so far. This study was initiated based on the following
specific objectives:
to determine the attainable yield and yield stability of various grain sorghum genotypes
across diverse climate scenarios in the arid and semi-arid Tropics.
10
to measure the effect of latitude on the development of selected sorghum varieties in
order determine the precision with which available models predict the phenological
responses of short-day sorghum varieties to photo-thermal regimes at different latitudes.
to evaluate the effect of genotype by environment interactions on plant characters in order
to identify specific genotypic characters that significantly contribute to stabilizing grain
yield across locations along a latitude gradient.
1.8 References
Abrol, Y.P., Ingran, K.T., 1996. Effects of higher day and night temperatures on growth and
yields of some crop plants. In: Bazzaz, F., Sombroek, W. (Eds.), Global Climate Change
and Agricultural Production. FAO, John Wiley&Sons, Rome, pp. 101-121.
Attri, S.D., Rathore, R.S., 2003. Simulation of impact of projected climate change on wheat in
India. Int. J. Climatol. 23, 693-705.
Ayeneh, A., van Ginkel, M., Reynolds, M.P., Ammar, K., 2002. Comparison of leaf, spike,
peduncle and canopy temperature depression in wheat under heat stress. Field Crop Res.
79, 173–184.
Banziger, M., Cooper, M., 2001. Breeding for low input conditions and consequences for
participatory plant breeding: examples from tropical maize and wheat. Euphytica 122, 503-
519.
Becker, H., Léon, J., 1988. Stability Analysis in Plant Breeding. Plant Breeding. 101, 1-23.
Borrell, A.K., Hammer, G.L., Henzell, R.G., 2000. Nitrogen dynamics and the physiological
basis of stay-green in sorghum. Crop Sci. 40, 1295-1307.
Brooks, A., Farquhar, G.D., 1985. Effect of temperature on the CO2/O2 specificity of ribulose-
1,5-bisphosphate carboxylase/oxygenase and the rate of respiration in the light. Planta 165,
397-406.
Celarier, R. P., 1959. Cytotaxonomy of the Andropogonea. III. Sub-tribe sorgheae, genus,
Sorghum. Cytologia23, 395-418.
Chloupek, O., Ehrenbergerová, J., Opitz von Boberfeld, W.R., Řiha, P, 2003. Selection of white
clover (Trifolium repens L.) using root traits related to dinitrogen fixation. Field Crop Res.
80, 57-62.

Dissertation
11
Chloupek, O., Hrstková P., Schweigert, P., 2004. Yield and its stability, crops diversity,
adaptability and response to climate changes, weather and fertilization over 75 years in the
Czech Republic in comparison to some European countries. Field Crops Res. 85,167-190.
Chloupek, O., Hrstkova, P., 2005. Adaptation of crops to environment. Theor. Appl. Genet. 111,
1316-1321.
Chowdhury, S.I. Wardlaw, I.F., 1978. The effect of temperature on kernel development in
cereals. Aust. J. Agric. Res. 29, 205–223.
Clerget, B, Dingkuhn, M., Gozé, E., Rattunde, H.F.W., Ney, B., 2008. Variability of
phyllochron, plastochron, and rate of increase in height in photoperiod sensitive Sorghum
varieties. Ann. Bot. 101, 579-594.
Clerget, B., Rattunde, H. F. W., Dagnoko, S., Chantereau, J., 2007. An easy way to assess
photoperiod sensitivity in sorghum: relationships of the vegetative-phase duration and
photoperiod sensitivity. E-Journal of SAT Research. Sorghum, millets and other cereals.
Vol. 3, 4pp. [http://ejournal.icrisat. org/].
Cocheme´, J., Franquin, P., 1967: A Study of the Agroclimatology of the Semi-arid Area South
of the Sahara in West Africa. Technical Report, FAO/UNESCO/WMO Interagency Project
on Agroclimatology, FAO, Rome, Italy.
Cooper, P. J. M., Dimes, J., Rao, K.P.C., Shapiro, B. Shiferaw, B., Twomlow, S., 2008. Coping
better with current climatic variability in the rain-fed farming systems of sub-Saharan
Africa: an essential first step in adapting to future climate change? Agric. Ecosyst.
Environ. 126, 24–35.
Curtis, D. L., 1968: The relation between yield and date of heading of Nigerian sorghums. Expl.
Agric. 4, 93–101.
Dahlberg, J.A., 2000. Classification and characterization of sorghum. In Smith, W. C. (ed.),
Sorghum: Origin, History, Technology, and Production, John Wiley & Sons, Inc, New
York, pp. 99-130.
Dawson, J.C., Murphy, K.M., Jones, S.S., 2007. Decentralized selection and participatory
approaches in plant breeding for low-input systems. Euphytica. 160, 143-154.
de Wet, J. M., 1978. Systematics and evolution of sorghum Sect. Sorghum (Graminae). Am. J.
Bot. 65, 477-484.

12
Dencic, S., Kastori, R., Kobiljski, B., Duggan, B., 2000. Evaluation of grain yield and its
components in wheat cultivars and landraces under near optimal and drought conditions.
Euphytica 113, 43-52.
Dingkuhn M., Asch, F.,1999. Phenological Responses of Oryza sativa, O. glaberrima and Inter-
specific Rice Cultivars on a Toposequence in West Africa. Euphytica 110, 109-126.
Doggett, H., 1988. “Sorghum”. Wiley, New York.
FAOSTAT data (2016). Sorghum production statistics. [Online]
http://faostat3.fao.org/download/Q/QC/E. FAOSTAT. Accessed on May 23, 2016 at
17:26:45 CEST.
Farshadfar E., Sutka, J., 2003. Locating QTLs controlling adaptation in wheat using AMMI
model. Cereal Res. Commun. 31, 249-256.
Folliard, A., Traore, P.C.S., Vaksmann, M., Kouressy, M., 2004. Modeling of sorghum response
to photoperiod: a threshold-hyperbolic approach. Field Crops Res. 89, 59-70.
Fuhrer, J., 2003. Agroecosystem response to combinations of elevated CO2, ozone, and global
climate change. Agric. Ecosyst. Environ. 97, 1-20.
Garber, E. D., 1950. Cytotaxonomic studies in the genus Sorghum. Univ. Calif. Publ. Bot.23,
283-361.
Ghannoum, O., von Caemmerer, S., Ziska, L.H., Conroy, J.P., 2000. The growth response of C4
plants to rising atmospheric CO2 partial pressure: a reassessment. Plant Cell Environ. 23,
931-942.
Harlan J.R., 1992. Origin and processes of domestication. In: Chapman GP (ed) Grass evolution
and domestication. Cambridge University Press, Cambridge, pp 159-175.
Harlan, J. R., de Wet, J. M., 1972. A simplified classification of cultivated sorghum. Crop Sci.
12, 172-176.
Harris, K., Subudhi, P.K., Borrell, A.K., Jordan, D., Rosenow, D., Nguyen, H., Klein, P., Klein,
R., Mullet, J., 2007. Sorghum stay-green QTL individu-ally reduce post-flowering
drought-induced leaf senescence. J. Exp. Bot. 58, 327–338.
Haussmann, B. I. G., Rattunde, F.H., Rattunde, E.W., Traore, P.S.C., vom Brocke, K., Parzies,
H.K., 2012. Breeding Strategies for Adaptation of Pearl Millet and Sorghum to Climate
Variability and Change in West Africa. J. Agro. Crop Sci. 198, 327-339

Dissertation
13
Haussmann, B.I.G., Boureima, S.S., Kassari, I.A., Moumouni, K.H., Boubacar, A., 2007. Two
mechanisms of adaptation to climate variability in West African pearl millet landraces - a
preliminary assessment. SAT eJournal 3(1). http:// ejournal.icrisat.org/.
Hoad, S.P., Russell, G., Lucas, M.E., Bingham, I.J., 2001. The management of wheat, barley and
oat root systems. Adv. Agron. 74, 193–246.
Holiday, A.S., Martindale, W., Alred, R., Brooks, A.L., Leegood, R.C., 1992. Changes in
activities of enzymes of carbon metabolism in leaves during exposure of plants to low
temperature. Plant Physiol. 98, 1105-1114.
House, L. R., 1985. A Guide to Sorghum Breeding, ICRISAT (International Crops Research
Institute for the Semi-Arid Tropics), Pantancheru, India.
House, L., Gomez, M.R., Murty, D.S., Sun, Y., Verma, B.N., 2000. Development of some
agricultural industries in several African and Asian countries. In Smith,W. C. (ed.),
Sorghum: Origin, History, Technology, and Production. John Wiley & Sons, Inc., New
York, pp 131–190.
IPCC, 2007. Summary for policymakers. In: Parry, M.L., Canziani, O.F., Palutikof, J.P., van der
Linden P.J., Hanson, C.E. (Eds.), Climate Change 2007: Impacts, Adaptation and
Vulnerability. Contribution of Working Group II to the Fourth Assessment Report of the
Intergovernmental Panel on Climate Change. Cambridge University Press, Cambridge,
UK, pp. 7-22.
Jarvis, A., Lau, C., Cook, S., Wollenberg, E., Hansen, J., Bonilla, O., Challinor, A., 2011. An
integrated adaptation and mitigation framework for developing agricultural research:
synergies and trade-offs. Expl. Agric. 47: 185–203.
Jordan, D.B., Ogren, W.L., 1984. The CO2/O2 specificity of ribulose 1,5-bisphosphate
carboxylase/oxygenase. Planta 161, 308-313.
Kato K., Miura, H., Sawada, S., 2000. Mapping QTLs controlling grain yield and its components
on chromosome 5A of wheat. Theor. Appl. Genet. 101, 1114-1121.
Kiniry, J.R., Musser, R.L., 1988. Response of kernel weight of sorghum to environment early
and late in grain filling. Agron. J. 80, 606-610.
Kouressy, M., Dingkuhn, M., Vaksmann M., Heinemann, A.B., 2008 Adaptation to diverse
semi-arid environments of sorghum genotypes having different plant type and sensitivity to
photoperiod. Agric. For. Meteorol. 148, 357-371.
14
Kouressy, M., Dingkuhn, M., Vaksmann M., Heinemann, A.B., 2008 Adaptation to diverse
semi-arid environ- ments of sorghum genotypes having different plant type and sensitivity
to photoperiod. Agric. For. Meteorol. 148, 357-371.
Kraakman A.T.W., Niks, R.E., Van den Berg, P.M.M.M., Stam, V. Van Eeuwijk, F.A., 2004.
Linkage disequilibrium mapping of yield and yield stability in modern spring barley
cultivars. Genetics 168: 435-446.
Lawlor, D.W., Cornic, G., 2002. Photosynthetic carbon assimilation and associated metabolism
in relation to water deficits in higher plants. Plant Cell Environ. 25, 275–294.
Maiti, R.K., 1996. Sorghum Science. Science Publishers, Lebanon, NH. pp. 352.
Matthews, R. B., Reddy, D. M., Rani, A. U., Azam-Ali, S. N., Peacock, J. M., 1990. Response of
four sorghum lines to mid season drought. I. Growth, water use and yield. Field Crops Res.
25, 279–296.
Matthews, R., Wassmann, R., 2003. Modeling the impacts of climate change and methane
emission reductions on rice production. A review. Eur. J. Agron. 19, 573-598.
Nelson, G.C., 2009. Agriculture and climate change: An agenda for negotiation in Copenhagen,
2020 vision focus 16, International Food Policy Research Institute (IFPRI).
Niangado, O., 2001. The state of millet diversity and its use in West Africa. In Broadening the
Genetic Base of Crop Production. Edited by: Cooper H.D., Spillane C., Hodgin T. Rome:
IPGRI/FAO, pp. 147-157.
Parry, M.L., Rosenzweig, C., Iglesias, A., Livermore, M., Fischer, G., 2004. Effects of climate
change on global food production under SRES emissions and socio-economic scenarios.
Global Environ. Change 14, 53-67.
Rajcan, I., Tollenaar, M., 1999. Source-sink ratio and leaf senescence in maize I. Dry matter
accumulation and partitioning during the grain-filling period. Field Crop Res. 90, 245–253.
Ratnadass, A., Butler, D. R., Marley, P. S., Bandyopadhyay, R., Hess, D. E., Akintayo, I., 2003:
Sorghum head-bugs and grain molds in West and Central Africa: II. Relationships between
weather, head-bug and mold damage on sorghum grains. Crop Prot. 22, 853–858.
Schoper, J.B., Lambert, R.J., Vasilas, B.L., 1986. Maize pollen viability and ear receptivity
under water and high temperature stress. Crop Sci. 26, 1029-1033
Seetharama, N., Mahalakshmi, V., Bidinger, F. R., Singh S., 1984. Response of sorghum and
pearl millet to drought stress in semi-arid India. In Agrometerology of sorghum and millet

Dissertation
15
in the semi-arid tropics. Proceedings of international symposium, 15–20 Nov 1982,
Patancheru, India, ICRISAT. pp. 159–173.
Sharp, R.E., Poroyko, V., Hejlek, L.G., Spollen, W.G., Springer, G.K., Bohnert, H.J., Nguyen,
T., 2004. Root growth maintenance during water deficits: physiology to functional
genomics. J. Exp. Bot. 55, 2343–2351.
Shresta S.P., 2007 Phenological and agronomical responses of rice genotypes to changes in
planting date in a high altitude cropping system of Nepal. MSc Thesis, University of Bonn.
Pp 64).
Snowden, J. D., 1936. “The Cultivated Races of Sorghum”. Adlard and Son, London.
Soumare´, M., Kouressy M., Vaksmann, . Maikano, M., Bazle, I D. P., Traoré, S., Dingkuhn, M.,
Touré, A., Vom Brocke, K., Some´, L., Barro Kondombo, V, 2008. Pre´vision de l’aire de
diffusion des sorghos photope´riodiques en Afrique de l’ouest. Cahiers Agricultures 17,
160–164.
Traoré, S. B., Reyniers, F. N., Vaksmann, M., Koné, B., Sidibé, A., Yoroté, A., Yattara, K.,
Kouressy, M., 2000: Adaptation á la sécheresse des écotypes locaux de sorghos du Mali.
Sécheresse 11, 27–237.
Tuinstra,M.R., Grote, E.M., Goldsbrough, P.B., Ejeta,G., 1997. Genetic analysis of post-
flowering drought tolerance and components of grain development in Sorghum bicolor (L.)
Moench. Mol. Breed. 3, 439–448.
Vaksman, M., Traoé, S. Niangado, O., 1996. Le photopériodisme des sorghos africains.
Agriculture et Dévélopment 9, 13-18.
von Caemmerer S., Furbank, R.T., 2003. The C-4 pathway: an efficient CO2 pump. Photosynth.
Res. 77, 191-207.
Vu, J.V.C., Leon Jr., H.A., 2009. Growth at elevated CO2 delays the adverse effects of drought
stress on leaf photosynthesis of the C4 sugarcane. J. Plant Physiol. 166, 107-116.

16
2 Yield Stability of Photoperiod Sensitive Sorghum [Sorghum bicolor L.
(Moench)] Accessions under Diverse Climatic Environments.
This chapter has been pulished as:
Abdulai, A.L., Parzies, H., Kouressy, M., Vaksmann, M., Asch, F., Brueck, H., 2012. Yield
Stability of Photoperiod-Sensitive Sorghum [Sorghum bicolor L. (Moench)] Accessions under
Diverse Climatic Environments. International Journal of Agricultural Research 7, 17-32.

Dissertation
17

18

Dissertation
19
20

Dissertation
21
22

Dissertation
23

24
Dissertation
25
26

Dissertation
27

28
Dissertation
29

30
Dissertation
31

32

Dissertation
33
3 Latitude and Date of Sowing Influences Phenology of Photoperiod-
Sensitive Sorghums
This chapter has been published as:
Abdulai, A.L., Kouressy, M., Vaksmann M., Asch, F., Giese, M., Brueck H., 2012. Latitude and
date of sowing influence phenology of photoperiod-sensitive sorghums. J. of Agron. and Crop
Sci. 198, 340-348.
MISCELLANEOUS
Latitude and Date of Sowing Influences Phenology ofPhotoperiod-Sensitive SorghumsA. L. Abdulai1,2, M. Kouressy3, M. Vaksmann4, F. Asch1, M. Giese1 & B. Holger1
1 University of Hohenheim Stuttgart, Germany
2 CSIR-SARI Ghana
3 IER Bamako, Mali
4 CIRAD Bamako, Mali
Keywords
latitude; phenology; photoperiodism;
sorghum; sowing date
Correspondence
A. L. Abdulai
University of Hohenheim, Garben Str. 13,
Stuttgart D 70593, Germany
Tel.: +49 (0) 176 625 90850
Fax: +49 (0) 711 459 24207
Email: [email protected]
Accepted February 22, 2012
doi:10.1111/j.1439-037X.2012.00523.x
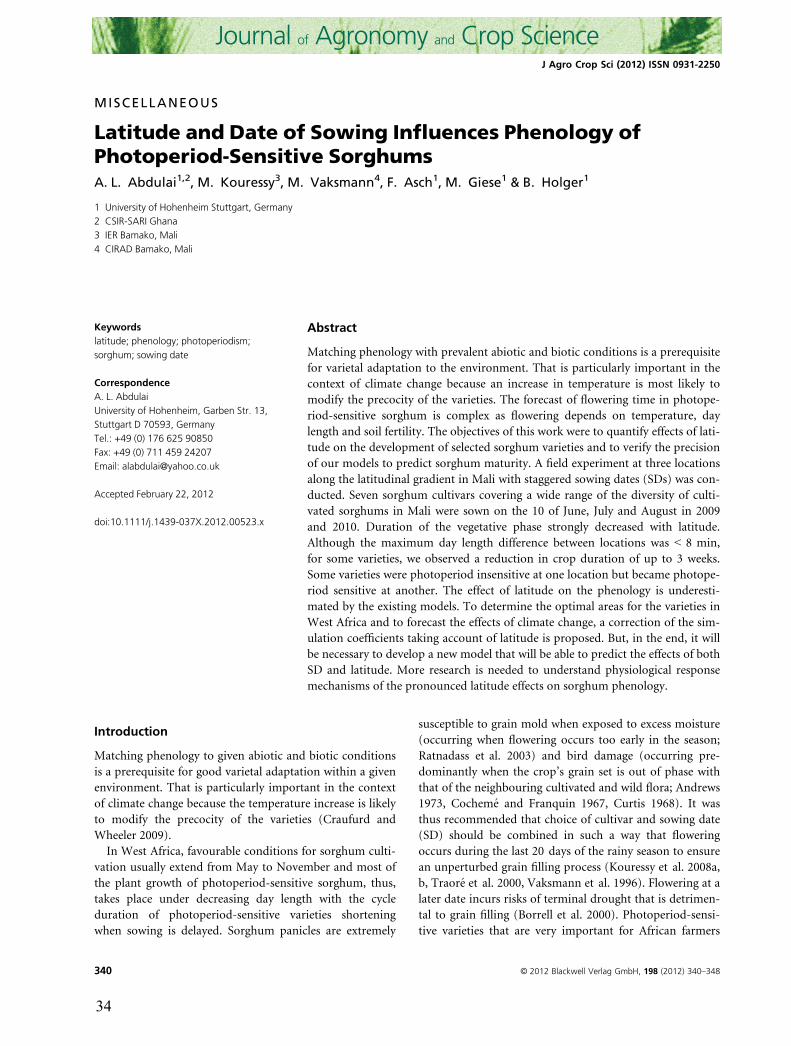
Abstract
Matching phenology with prevalent abiotic and biotic conditions is a prerequisite
for varietal adaptation to the environment. That is particularly important in the
context of climate change because an increase in temperature is most likely to
modify the precocity of the varieties. The forecast of flowering time in photope-
riod-sensitive sorghum is complex as flowering depends on temperature, day
length and soil fertility. The objectives of this work were to quantify effects of lati-
tude on the development of selected sorghum varieties and to verify the precision
of our models to predict sorghum maturity. A field experiment at three locations
along the latitudinal gradient in Mali with staggered sowing dates (SDs) was con-
ducted. Seven sorghum cultivars covering a wide range of the diversity of culti-
vated sorghums in Mali were sown on the 10 of June, July and August in 2009
and 2010. Duration of the vegetative phase strongly decreased with latitude.
Although the maximum day length difference between locations was < 8 min,
for some varieties, we observed a reduction in crop duration of up to 3 weeks.
Some varieties were photoperiod insensitive at one location but became photope-
riod sensitive at another. The effect of latitude on the phenology is underesti-
mated by the existing models. To determine the optimal areas for the varieties in
West Africa and to forecast the effects of climate change, a correction of the sim-
ulation coefficients taking account of latitude is proposed. But, in the end, it will
be necessary to develop a new model that will be able to predict the effects of both
SD and latitude. More research is needed to understand physiological response
mechanisms of the pronounced latitude effects on sorghum phenology.
Introduction
Matching phenology to given abiotic and biotic conditions
is a prerequisite for good varietal adaptation within a given
environment. That is particularly important in the context
of climate change because the temperature increase is likely
to modify the precocity of the varieties (Craufurd and
Wheeler 2009).
In West Africa, favourable conditions for sorghum culti-
vation usually extend from May to November and most of
the plant growth of photoperiod-sensitive sorghum, thus,
takes place under decreasing day length with the cycle
duration of photoperiod-sensitive varieties shortening
when sowing is delayed. Sorghum panicles are extremely
susceptible to grain mold when exposed to excess moisture
(occurring when flowering occurs too early in the season;
Ratnadass et al. 2003) and bird damage (occurring pre-
dominantly when the crop’s grain set is out of phase with
that of the neighbouring cultivated and wild flora; Andrews
1973, Cocheme and Franquin 1967, Curtis 1968). It was
thus recommended that choice of cultivar and sowing date
(SD) should be combined in such a way that flowering
occurs during the last 20 days of the rainy season to ensure
an unperturbed grain filling process (Kouressy et al. 2008a,
b, Traore et al. 2000, Vaksmann et al. 1996). Flowering at a
later date incurs risks of terminal drought that is detrimen-
tal to grain filling (Borrell et al. 2000). Photoperiod-sensi-
tive varieties that are very important for African farmers
© 2012 Blackwell Verlag GmbH, 198 (2012) 340–348340
J Agro Crop Sci (2012) ISSN 0931-2250
34
(Soumare et al. 2008) can cope with variation in SD, as
triggering of flowering by day length effectively serves to
synchronize final developmental stages with the end of the
rainy season.
Farmers choose which crop varieties to grow where, and
in what proportions, allocating them to a range of biophys-
ical and social environments over both space and time.
Farmers’ preference for varieties depends mainly on their
knowledge of the crop’s phenology in relation to the local
characteristics of the wet season (Lacy et al. 2006). Such
knowledge and the requisite skills are often acquired
through ancestral transmission and are not always easy to
express scientifically (Sissoko et al. 2008). Climatologists,
breeders and agronomists need tools to translate variable
climatic conditions into probable crop performance and to
identify suitable genotypic characteristics for adapting to
the different agro-ecological zones. Prediction of phenology
is highly relevant for the reasons mentioned previously.
Under optimal moisture and fertility conditions, the phe-
nology of day-neutral varieties can be easily predicted,
because panicle initiation (PI) occurs after a constant ther-
mal time (TT), but is more complex for photoperiod-sensi-
tive varieties in which day length and/or temperature
modify the duration of the vegetative phase. For these culti-
vars, PI occurs when photoperiod drops below a cultivar-
specific and age-dependent threshold (Folliard et al. 2004).
Model-assisted analyses of agricultural production sys-
tems are required for upscaling from plot and field data to
regional and larger scales. The impatience model integrated
into the simulation software SARRA-H (Dingkuhn et al.
2008) takes photoperiod sensitivity into account to delin-
eate SD effects on phenology. Coupling this model with a
climatic database within a geographical information system
could allow delineation of suitable areas for sorghum varie-
ties in West Africa and the forecast of these under various
climate change scenarios.
Multi-location field trials (e.g. along latitudinal or altitu-
dinal gradients) in combination with staggered SDs can be
employed for creating a range of environments allowing for
the assessment of varietal differences in phenology. How-
ever, depending on the climatic variability along the gradi-
ent or between SDs, effects of photoperiod can be masked
by interactions with temperature (Bonhomme et al. 1991)
as well as soil fertility levels.
Relations between photothermal environments and phe-
nology have been studied by some authors to improve
understanding of the phenological basis of adaptation to
environment in sorghum (Craufurd et al. 1999, Kouressy
et al. 2008b), culminating in the subsequent use of models
to successfully simulate the effects of temperature and/or
photoperiod on the phenology of sorghum (Folliard et al.
2004, Dingkuhn et al. 2008, Kouressy et al. 2008a). The
impatience version of SARRA-H has been reported as the
most appropriate for short-day varieties (Kouressy et al.
2008a). The extent to which latitude modifies or influences
photothermal effects on phenology of photoperiod-sensi-
tive sorghum varieties as well as the precision with which
available simulation models predicts the phenology of pho-
toperiod-sensitive varieties under different latitudes have
not been investigated.
The objectives of this work were to (i) measure the effect
of latitude on the development of selected sorghum varie-
ties and to (ii) determine the precision with which the
SARRA-H model is able to predict the phenological
responses of short-day sorghum varieties to photothermal
regimes at different latitudes.
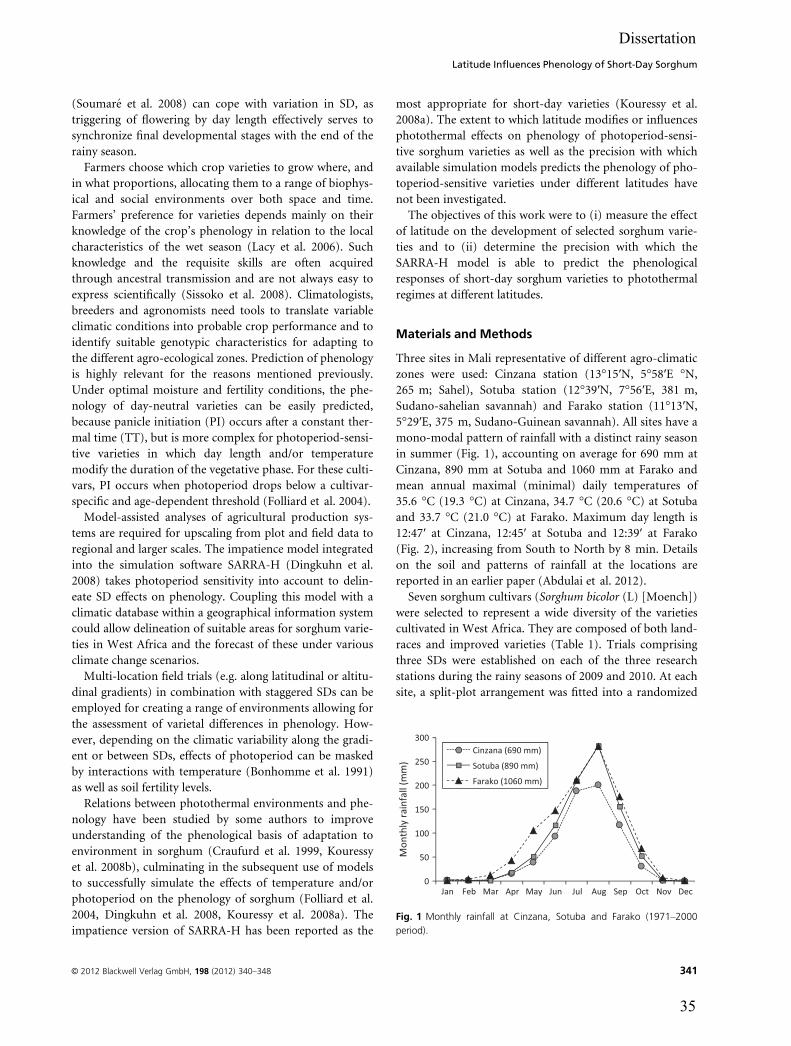
Materials and Methods
Three sites in Mali representative of different agro-climatic
zones were used: Cinzana station (13°15′N, 5°58′E °N,265 m; Sahel), Sotuba station (12°39′N, 7°56′E, 381 m,
Sudano-sahelian savannah) and Farako station (11°13′N,5°29′E, 375 m, Sudano-Guinean savannah). All sites have a
mono-modal pattern of rainfall with a distinct rainy season
in summer (Fig. 1), accounting on average for 690 mm at
Cinzana, 890 mm at Sotuba and 1060 mm at Farako and
mean annual maximal (minimal) daily temperatures of
35.6 °C (19.3 °C) at Cinzana, 34.7 °C (20.6 °C) at Sotubaand 33.7 °C (21.0 °C) at Farako. Maximum day length is
12:47′ at Cinzana, 12:45′ at Sotuba and 12:39′ at Farako
(Fig. 2), increasing from South to North by 8 min. Details
on the soil and patterns of rainfall at the locations are
reported in an earlier paper (Abdulai et al. 2012).
Seven sorghum cultivars (Sorghum bicolor (L) [Moench])
were selected to represent a wide diversity of the varieties
cultivated in West Africa. They are composed of both land-
races and improved varieties (Table 1). Trials comprising
three SDs were established on each of the three research
stations during the rainy seasons of 2009 and 2010. At each
site, a split-plot arrangement was fitted into a randomized
0
50
100
150
200
250
300
Jan Feb Mar Apr May Jun Jul Aug Sep Oct Nov Dec
Mon
thly
rai
nfal
l (m
m)
Cinzana (690 mm)
Sotuba (890 mm)
Farako (1060 mm)
Fig. 1 Monthly rainfall at Cinzana, Sotuba and Farako (1971–2000
period).
© 2012 Blackwell Verlag GmbH, 198 (2012) 340–348 341
Latitude Influences Phenology of Short-Day Sorghum
Dissertation
35

complete block design (RCBD) with two replications. The
three dates of sowing (June 10; July 10 and August 10) were
the main plot treatments and the seven varieties formed the
subplots. Each experimental unit comprised 12 plants sown
in two ridges of 3 m length, with a spacing of 0.5 m
between plants and 0.75 m between ridges. To ensure non-
limiting conditions, supplemental irrigation (provided
from sowing until the moment when the rains became suf-
ficiently stable and regular) and chemical fertilizers (76 kg
N, 30 kg P and 30 kg K per hectare) were applied at all the
sites. Flooding was not observed in any of the sites because
the experimental plots were well drained. No phyto-patho-
logical problems were encountered before flowering.
Eight plants on each plot were studied by recording date
of flag leaf appearance and total leaf number. A leaf was
considered fully expanded when its’ ligule became visible
above the enclosing sheath of the previous leaf. Date of PI
was recorded on the sorghum variety Keninkeni which was
sown in additional plots. Three plants were harvested two
times a week, dissected and panicle development observed
under a light microscope. PI was defined as the time when
the panicle had attained a length of 2 mm (Borrell et al.
2000). The average standard error of time to flowering for
the 2009 and 2010 was < 2 days. Therefore, for each
variety and date of sowing combination, phenology was
calculated using averages of the 2-year data.
For ‘short day’ plants such as sorghum, the most visible
expression of photoperiodism is the reduction in the vege-
tative phase when sowing is delayed. This reduction
between two sowings is usually used to compare the varie-
ties (Clerget et al. 2007). The mean coefficient of photo-
periodism, Kp, was calculated according to Clerget et al.
(2007) by dividing the difference in days to flag leaf emer-
gence (FLi) of the first and third SD by the number of days
between these two SDs as presented below:
Kp ¼ FL1 � FL3SD3 � SD1
Kp varies between 0 and 1, and Kp is equal to 0 if FLi is not
influenced by SD (photoperiod-insensitive varieties) or
close to 1 when shortening of the vegetative growth phase
compensates exactly for the difference of SDs (photo-
period-sensitive varieties).
For the calculation of TT, the broken-stick model was
implemented (Dingkuhn and Miezan 1995) using hourly
temperature values estimated from daily, observed minimal
and maximal temperatures. Cardinal temperatures were
11 °C for base temperature (Tb) (Clerget et al. 2004, Laf-
arge et al. 2002), 34.8 °C for optimum temperature (Topt)
and 44 °C for maximum temperature (Tmax) (Ritchie and
Alagarswamy 1989). The resulting TT per time step (day)
served, on an additive basis, to calculate the progress of
developmental processes.
dTT ¼ 0 T\Tb or T[Tmax
dTT ¼ T � Tb Tb\T\Topt
dTT ¼ ðTopt � TbÞ½1� ðT � ToptÞ=ðTmax
� Topt� Topt\T\Tmax
The crop model used in this study is SARRA-H (http://
ecotrop.cirad.fr/sommaire.php3). This model is particu-
larly suited for the analysis of climate impacts on cereal
growth and yield in dry, tropical environments (Sultan
Fig. 2 Comparison of astronomical day length around the summer
solstice for the three studied sites. The three sowing dates are indicated
by a vertical line.
Table 1 Description of the varieties studied
Name Improved/Landrace Botanical type Adaptation Maturity type Height
Boiguel Malian landrace Durra Sahelian zone Early (100 days) Tall
CSM 63E Improved Malian landrace Guinea Sahelian zone Early (90 days) Tall
CSM 388 Malian Landrace Guinea Sudano-Sahelian zone Intermediate (120 days) Tall
Dancouma Malian Landrace Guinea Sudano-Guinean zone Late (140 days) Tall
Grinkan Improved variety Composite Not yet determined Intermediate (110 days) Dwarf
Keninkeni Improved variety Composite Not yet determined Intermediate (110 days) Dwarf
IRAT 204 Improved variety Caudatum Supplied by CIRAD Early (90 days) Dwarf
© 2012 Blackwell Verlag GmbH, 198 (2012) 340–348342
Abdulai et al.
36

et al. 2005). The version used here was equipped with the
phenological sub-model ‘Impatience’ specifically developed
to simulate effects of temperature and day length on
sorghum crop duration (Dingkuhn et al. 2008).
The originality of the Impatience model resides in the
calculation of the photoperiod-sensitive phase (PSP). The
underlying hypothesis is that the short-day requirements
for floral induction diminish as the PSP or wait state for
the inducing signal advances. In other words, older plants
are less demanding of short days to flower. The TT history
(degree days elapsed since end of basic vegetative phase;
BVP) and the current astronomic day length (Pi) are com-
bined in a single state variable. For PI to occur, this state
variable has to become equal or smaller than a genotypic
threshold parameter (Psens). Panicle initiation occurs
when the following condition is met:
1000Pi¼BVP
dtti
0B@
1CA
P exp
Pi� 11
13:5� 11� Psens
Where Pexp is a coefficient that provides for a curvilin-
ear effect of ∑dtti, dtti is the daily TT, Pi is the current
photoperiod, Psens is a genotypic parameter, while 13.5
and 11 are the upper limit and critical photoperiods,
respectively. Pexp generally is smaller than 1, typically
between 0.05 and 0.2 (Kouressy et al. 2008a). The model
is most sensitive to variation of Psens, which may
assume values around 0.4 in highly photoperiod-sensitive
genotypes and >1 in insensitive genotypes. Genotype-spe-
cific coefficients were calculated from results of the SD
trials. BVP was estimated from the shortest duration of
the vegetative phase observed on each variety. Genotype-
specific values of Psens and Pexp were determined using
all possible combinations of Psens and Pexp. For every
pair of values, date of PI was simulated for the three
planting dates of each site and compared with observa-
tions. The set of values that minimized the root mean
square deviation, RMSD, was selected as the best esti-
mate for the parameters (Kobayashi and Salam 2000).
RMSD is defined here as follows:
RMSD ¼ffiffiffiffiffiffiffiffiffiffiffiffiffiffiffiffiffiffiffiffiffiffiffiffiffiffiffiffiffiffiffiffiffiffiffiffiffiffiffiffiffiffiffiP
EFLcalc � EFLobsð Þ2n
s
where n is the number of SDs, EFL the number of days
from emergence to flag leaf and the subscripts calc and obs
stand for calculated and observed, respectively. Although
the model operates with four parameters, only one (Psens)
or two (Psens and Pexp) were adjusted to fit the model to
observations (Dingkuhn et al. 2008). To compare the
adjustment of the model on the three sites, Psens and Pexp
were fitted at Sotuba station (the mid-latitude location).
We then regarded Pexp as fixed for each variety and
adjusted only Psens for the two other sites.
Results and Discussion
Panicle initiation and total number of leaves
The TT (in GDD) from emergence to panicle initiation
(EPI) and total number of leaves (TLN) were substantially
influenced by latitude and date of sowing. The TT for EPI
generally reduced with delayed sowing and increased with
latitude, except for the day-neutral cultivar ‘IRAT 204’
which recorded increases in TT for EPI with delayed sow-
ing from July to August at Cinzana and Farako and from
June to July at Sotuba. For a given date of sowing, TT s for
EPI increased with latitude except for IRAT 204 that
recorded more TT for EPI at Sotuba the mid-latitude site
than at Cinzana the northern site (Fig. 3). A similar trend,
as for TT for EPI, was observed for TLN.
The phenotyping procedure used in this study is eco-
nomical because it requires only one observation (date of
flag leaf ligulation for this study) on three specific SDs,
backed by daily atmospheric temperature records. It is also
based on some simplifications that have the potential of
masking component traits of phenology that are not con-
sidered by the model. For example, it does not distinguish
PSP from the juvenile phase (because the latter cannot be
measured in the field) and estimates PSP on the assump-
tion that the thermal duration from PI to flag leaf ligula-
tion is constant (Dingkuhn et al. 2008).
In this study, it was found that duration of PI to flag leaf
appearance of 22 days was most appropriate. This value is
slightly higher than the 18 days used in SARRA-H
(Kouressy et al. 2008a) but coherent with the formula
presented by Folliard et al. (2004). The date of PI can
therefore be estimated by simply deducting 22 days from
the date on which the ligule on the flag leaf has appeared.
Effect of latitude and sowing dates on precocity of the
varieties
Latitude and SDs had substantial effects on the duration of
the vegetative phase expressed in days (EPI) as well as the
TLN produced (Table 2). Except for the day-neutral variety
(IRAT 204), duration of the vegetative phase decreased
with delayed sowing, indicating that they are photoperiod-
sensitive varieties. For the same date of sowing, the dura-
tion of the vegetative period increases with latitude, with
the effects being most pronounced between the most
northern and southern sites. Latitude effects on phenology
became smaller at later SDs. In sharp contrast to other vari-
eties, IRAT 204 had a longer duration of vegetative phase at
© 2012 Blackwell Verlag GmbH, 198 (2012) 340–348 343
Latitude Influences Phenology of Short-Day Sorghum
Dissertation
37
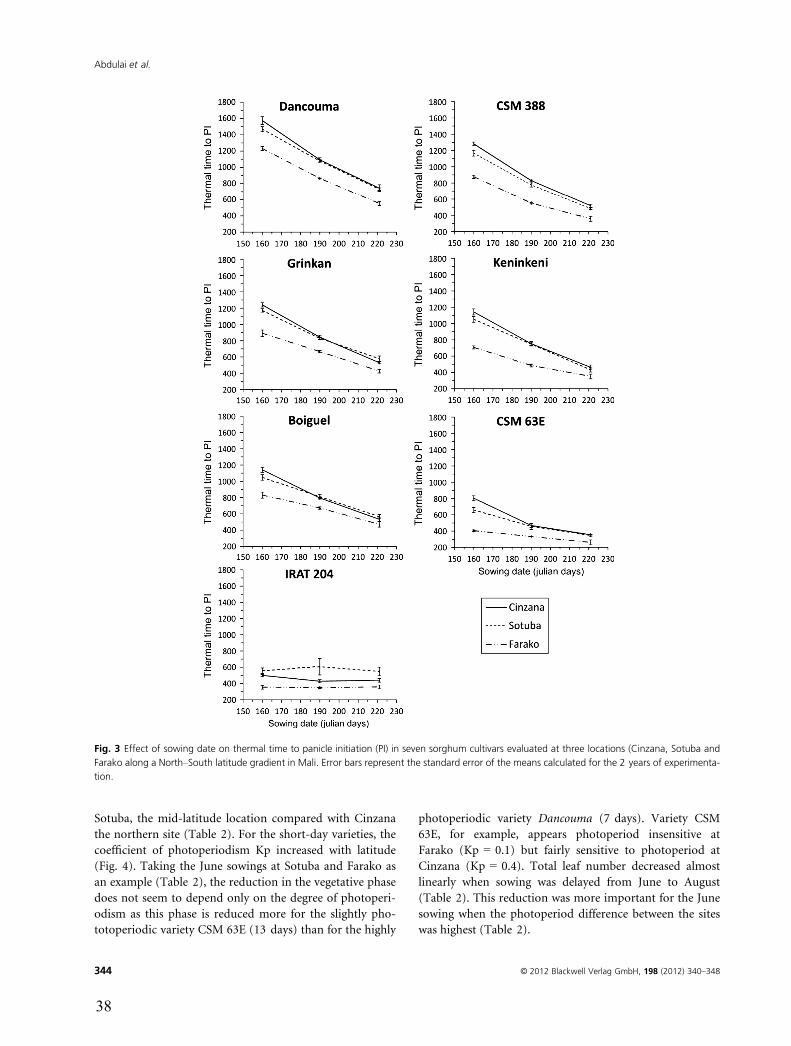
Sotuba, the mid-latitude location compared with Cinzana
the northern site (Table 2). For the short-day varieties, the
coefficient of photoperiodism Kp increased with latitude
(Fig. 4). Taking the June sowings at Sotuba and Farako as
an example (Table 2), the reduction in the vegetative phase
does not seem to depend only on the degree of photoperi-
odism as this phase is reduced more for the slightly pho-
totoperiodic variety CSM 63E (13 days) than for the highly
photoperiodic variety Dancouma (7 days). Variety CSM
63E, for example, appears photoperiod insensitive at
Farako (Kp = 0.1) but fairly sensitive to photoperiod at
Cinzana (Kp = 0.4). Total leaf number decreased almost
linearly when sowing was delayed from June to August
(Table 2). This reduction was more important for the June
sowing when the photoperiod difference between the sites
was highest (Table 2).
Fig. 3 Effect of sowing date on thermal time to panicle initiation (PI) in seven sorghum cultivars evaluated at three locations (Cinzana, Sotuba and
Farako along a North–South latitude gradient in Mali. Error bars represent the standard error of the means calculated for the 2 years of experimenta-
tion.
© 2012 Blackwell Verlag GmbH, 198 (2012) 340–348344
Abdulai et al.
38

There are not many crop models developed for sorghum
cultivars adapted to the conditions found in the semi-arid
tropics where low-input agricultural production systems
are found. The few models that exist for these scenarios
have focused mainly on depicting phenology based on
photothermal responses of genotypes (Folliard et al. 2004,
Dingkuhn et al. 2008, Kouressy et al. 2008a). To the best
of our knowledge, no model has considered latitude effects
in the simulation of phenology of photoperiod-sensitive
sorghums so far. The current study demonstrates that it is
possible, when working on photoperiod-sensitive sorghum
genotypes, to accurately estimate genotypic coefficients for
a location by applying latitude correction to the coefficients
from another location. This approach presents or reveals
one major means by which laborious experiments and
associated high costs could be minimized while scouting
for appropriate cultivars for specific locations, especially
also in view of climate change in West Africa.
‘Impatience’ model adjustment
To determine the accuracy with which the model predicts
parameters for a location, using those determined for
another location and adjusting for latitude, the genetic
coefficients of the Impatience model were calculated and
used to compare observed and simulated days from emer-
gence to flag leaf ligulation for the three SDs. To carry out
this adjustment, we eliminated IRAT 204 from calculations
because the Impatience model is unable to perform
Latitude11.0 11.5 12.0 12.5 13.0 13.5
Kp
0.0
0.2
0.4
0.6
0.8
1.0
IRAT 204 CSM 63E Keninkeni
Boiguel Grinkan CSM 388 Dancouma
Farako Sotuba Cinzana
Fig. 4 Latitude effect on the photoperiodism coefficient (Kp) of seven
sorghum cultivars evaluated at three locations (Cinzana, Sotuba and
Farako) along a North–South latitude gradient in Mali.
Table 2 Duration from emergence to panicle initiation (EPI; expressed in days) and total leaf number of seven sorghum varieties evaluated at three
sowing dates at three Malian locations with different latitude (Cinzana, Sotuba and Farako), averaged across two test years and two replications. The
± symbol precedes the standard error of measurement
Days to panicle initiation Total leaf number
Varieties Sowing Cinzana Sotuba Farako Cinzana Sotuba Farako
Boiguel June 10 70 ± 2.1 65 ± 1.3 56 ± 2.1 38.8 36.3 27.8
July 10 52 ± 0.3 53 ± 2.8 49 ± 1.3 32.3 27 24.5
August 10 36 ± 1.5 38 ± 1.3 36 ± 2.5 21 23.5 18
CSM 388 June 10 79 ± 1.9 73 ± 0.3 60 ± 0.9 34.3 32.8 24.5
July 10 53 ± 0.9 50 ± 1.2 40 ± 0.6 28 23.8 19.8
August 10 36 ± 1.2 33 ± 2.0 28 ± 2.4 18.5 18 15
CSM 63E June 10 49 ± 1.3 41 ± 1.5 28 ± 0.7 26 23.3 17.5
July 10 31 ± 1.0 30 ± 2.4 25 ± 0.5 19.8 17.3 14.5
August 10 26 ± 0.5 24 ± 1.5 21 ± 2.2 15.5 15.8 12
Grinkan June 10 76 ± 1.1 73 ± 0.4 61 ± 2.4 36.5 34.5 26.5
July 10 55 ± 0.9 54 ± 1.1 47 ± 0.3 30.3 25.8 22.3
August 10 36 ± 1.1 39 ± 3.1 33 ± 1.6 20 19.3 15.5
IRAT 204 June 10 31 ± 0.5 35 ± 1.8 24 ± 1.2 19.8 21 17.3
July 10 28 ± 0.9 40 ± 6.1 26 ± 0.3 17.8 19.5 15
August 10 31 ± 1.9 35 ± 3.0 28 ± 1.7 17.3 17.8 14.3
Keninkeni June 10 70 ± 2.0 66 ± 1.2 49 ± 1.0 33 31.8 22
July 10 48 ± 1.1 48 ± 1.7 35 ± 1.2 26.8 22.5 18
August 10 32 ± 2.3 29 ± 2.5 28 ± 2.6 17.3 16.3 13.3
Dancouma June 10 98 ± 2.1 92 ± 1.0 85 ± 1.2 39.5 37 32.5
July 10 71 ± 0.8 71 ± 1.8 62 ± 0.8 32 28.8 25
August 10 46 ± 1.7 48 ± 1.8 39 ± 0.3 23 22.5 18.3
© 2012 Blackwell Verlag GmbH, 198 (2012) 340–348 345
Latitude Influences Phenology of Short-Day Sorghum
Dissertation
39
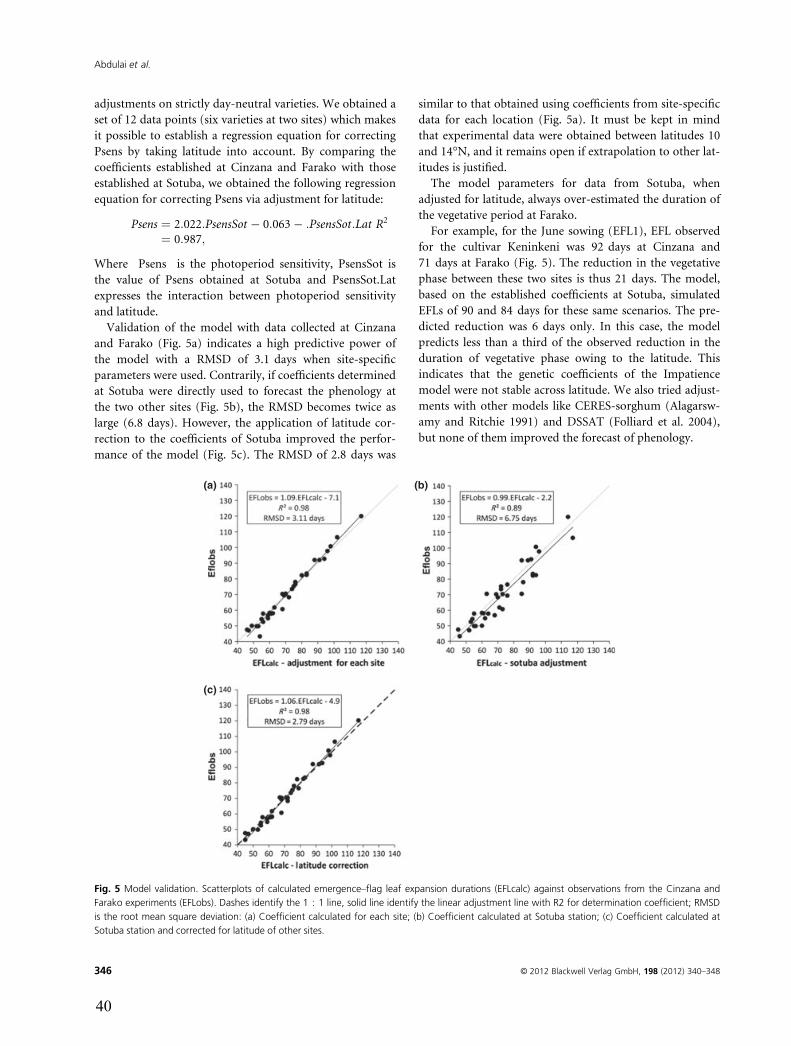
adjustments on strictly day-neutral varieties. We obtained a
set of 12 data points (six varieties at two sites) which makes
it possible to establish a regression equation for correcting
Psens by taking latitude into account. By comparing the
coefficients established at Cinzana and Farako with those
established at Sotuba, we obtained the following regression
equation for correcting Psens via adjustment for latitude:
Psens ¼ 2:022:PsensSot � 0:063� :PsensSot:Lat R2
¼ 0:987;
Where Psens is the photoperiod sensitivity, PsensSot is
the value of Psens obtained at Sotuba and PsensSot.Lat
expresses the interaction between photoperiod sensitivity
and latitude.
Validation of the model with data collected at Cinzana
and Farako (Fig. 5a) indicates a high predictive power of
the model with a RMSD of 3.1 days when site-specific
parameters were used. Contrarily, if coefficients determined
at Sotuba were directly used to forecast the phenology at
the two other sites (Fig. 5b), the RMSD becomes twice as
large (6.8 days). However, the application of latitude cor-
rection to the coefficients of Sotuba improved the perfor-
mance of the model (Fig. 5c). The RMSD of 2.8 days was
similar to that obtained using coefficients from site-specific
data for each location (Fig. 5a). It must be kept in mind
that experimental data were obtained between latitudes 10
and 14°N, and it remains open if extrapolation to other lat-
itudes is justified.
The model parameters for data from Sotuba, when
adjusted for latitude, always over-estimated the duration of
the vegetative period at Farako.
For example, for the June sowing (EFL1), EFL observed
for the cultivar Keninkeni was 92 days at Cinzana and
71 days at Farako (Fig. 5). The reduction in the vegetative
phase between these two sites is thus 21 days. The model,
based on the established coefficients at Sotuba, simulated
EFLs of 90 and 84 days for these same scenarios. The pre-
dicted reduction was 6 days only. In this case, the model
predicts less than a third of the observed reduction in the
duration of vegetative phase owing to the latitude. This
indicates that the genetic coefficients of the Impatience
model were not stable across latitude. We also tried adjust-
ments with other models like CERES-sorghum (Alagarsw-
amy and Ritchie 1991) and DSSAT (Folliard et al. 2004),
but none of them improved the forecast of phenology.
(a) (b)
(c)
Fig. 5 Model validation. Scatterplots of calculated emergence–flag leaf expansion durations (EFLcalc) against observations from the Cinzana and
Farako experiments (EFLobs). Dashes identify the 1 : 1 line, solid line identify the linear adjustment line with R2 for determination coefficient; RMSD
is the root mean square deviation: (a) Coefficient calculated for each site; (b) Coefficient calculated at Sotuba station; (c) Coefficient calculated at
Sotuba station and corrected for latitude of other sites.
© 2012 Blackwell Verlag GmbH, 198 (2012) 340–348346
Abdulai et al.
40
Conclusion
The effect of latitude on the phenology has been definitely
more important than portrayed by existing crop growth
models. The largest difference in day length was 8 min;
however, this caused a variation in the duration of the veg-
etative phase of up to 3 weeks. Photoperiod sensitivity is
therefore influenced by the latitude in a subtle manner.
CSM 63E behaved as a photoperiod-insensitive cultivar at
the lowest latitude site and as a photoperiod-sensitive
cultivar at the highest latitude site.
Existing models do not sufficiently take into account this
phenomenon. The Impatience model allows for the calcula-
tion of genetic coefficients for each site to forecast the SD
effect on phenology, but the genetic parameters obtained
were not stable with latitude. The model established for So-
tuba always over-estimates the duration of the vegetative
period at Farako. This result could explain the failure of
photoperiodism studies based on trials with various
latitudes or with artificial light.
Integrating photoperiod sensitivity into a crop model
and using a geographic information system (GIS) makes it
possible to identify optimum growing areas for different
cultivars by combining varietal traits, length of the growing
season, climatic uncertainty and farmers’ practices (Sou-
mare et al. 2008). Adaptation maps derived can help plant
breeders in determining areas of cultivar adaptation espe-
cially under climate change in West Africa, with its poten-
tial displacement of isohyets from North to South and the
concomitant movement of varieties from one zone to
another (Traore et al. 2000).
The latitude correction should not yet be extrapo-
lated beyond the range of latitude explored by our
experiments. Further studies are required to test the
behaviour of the varieties on a broader range of lati-
tudes. The statistical fitting of Psens with latitude, as
suggested here, helps in depicting the improved forecast
of phenology along latitudinal gradients in the Sudano-
Sahelian zone, but does not offer any physiological
explanations for this phenomenon. It will be first nec-
essary to decipher the physiological basis for the strong
effect of latitude observed.
Acknowledgements
The authors are indebted to Messrs Mohammed Lamine
Tekete, Mahamady Kane, Sekouba Sanogo, Alhassan Nien-
tao, Sori, Mrs Safiatu Sangare and all of IER-Sotuba for
their dedicated services both in the field and laboratory.
This study was performed within the frame of the RISO-
CAS project addressing adaptation of African agriculture to
climate change. Financial support by the Federal Ministry
for Economic Cooperation and Development, German
through GIZ/BMZ (Project No.: 07.7860.5-001.00) is grate-
fully acknowledged.
References
Alagarswamy, G., and J.T. Ritchie, 1991: Phasic Development in
CERES-Sorghum Model. In: T. Hodges , ed. Predicting Crop
Phenology, pp. 143–152. CRC Press, Boca Raton, FL, USA.
Andrews, D. J., 1973: Effects of date of sowing on photosensitive
Nigerian Sorghums. Exp. Agric. 9, 337–346.
Abdulai, A. L., H. Parzies, M. Kouressy, M. Vaksmann, F. Asch,
and H. Brueck, 2012: Yield stability of photoperiod sensitive
sorghum (Sorghum bicolor L. Moench) accessions under
diverse climatic environments. Int. J. Agric. Res. 7, 17–32.
ISSN 1816-4897/DOI: 103923/ijar2012.
Bonhomme, R., M. Derieux, J. R. Kiniry, G. O. Edmeades, and
H. Ozier-Lafontaine, 1991: Maize leaf number sensitivity in
relation to photoperiod in multilocation field trials. Agron. J.
83, 153–157.
Borrell, A. K., G. L. Hammer, and A. C. L. Douglas, 2000: Does
maintaining green leaf area in sorghum improve yield under
drought? I. Leaf growth and senescence. Crop Sci. 40, 1026–
1037.
Clerget, B., M. Dingkuhn, J. Chantereau, J. Hemberger, G.
Louarn, and M. Vaksmann, 2004: Does panicle initiation in
tropical sorghum depend on day-to-day change in photo
period? Field Crops Res. 88, 21–37.
Clerget, B., H. F. W. Rattunde, S. Dagnoko, and J. Chantereau,
2007: An easy way to assess photoperiod sensitivity in sor-
ghum: relationships of the vegetative-phase duration and pho-
toperiod sensitivity. J. SAT Agric. Res. 3, Available at: http://
www.icrisat.org/journal/Sorgum Millet other Cereals3.htm.
Cocheme, J., and P. Franquin, 1967: A Study of the Agroclima-
tology of the Semiarid Area South of the Sahara in West
Africa. Technical Report, FAO/UNESCO/WMO Interagency
Project on Agroclimatology, FAO, Rome, Italy.
Craufurd, P. Q., and T. R. Wheeler, 2009: Climate change and
the flowering time of annual crops. J. Exp. Bot. 60, 2529–2539.
Craufurd, P. Q., V. Mahalakshmi, F. R. Bidinger, S. Z. Mukuru,
J. Chantereau, P. A. Omanga, A. Qi, E. H. Roberts, R. H. Ellis,
R. J. Summerfield, and G. L. Hammer, 1999: Adaptation of
sorghum: characterization of genotypic flowering responses to
temperature and photoperiod. Theor. Appl. Genet. 99, 900–
911.
Curtis, D. L., 1968: The relation between yield and date of head-
ing in Nigerian sorghums. Exp. Agric. 4, 93–101.
Dingkuhn, M., and K. M. Miezan, 1995: Climatic determinants
of irrigated rice performance in the Sahel. II. Validation of
photothermal constants and characterization of genotypes.
Agric. Syst. 48, 411–434.
Dingkuhn, M., M. Kouressy, M. Vaksmann, B. Clerget, and
J. Chantereau, 2008: A model of sorghum photoperiodism
using the concept of threshold-lowering during prolonged
appetence. Eur. J. Agron. 28, 74–89.
© 2012 Blackwell Verlag GmbH, 198 (2012) 340–348 347
Latitude Influences Phenology of Short-Day Sorghum
Dissertation
41

Folliard, A., P. C. S. Traore, M. Vaksmann, and M. Kouressy,
2004: Modeling of sorghum response to photoperiod: a
threshold-hyperbolic approach. Field Crops Res. 89, 59–70.
Kobayashi, K., and M. U. Salam, 2000: Comparing simulated
and measured values using mean squared deviation and its
components. Agron. J. 92, 345–352.
Kouressy, M., M. Dingkuhn, M. Vaksmann, and A. B. Heine-
mann, 2008a: Adaptation to diverse semi-arid environ-
ments of sorghum genotypes having different plant type
and sensitivity to photoperiod. Agric. For. Meteorol. 148,
357–371.
Kouressy, M., S. B. Traore, M. Vaksmann, M. Grum, I. Maik-
ano, M. Soumare, P. S. Traore, D. Bazile, M. Dingkuhn, and
A. Sidibe, 2008b: Adaptation des sorghos du Mali a la variabi-
lite climatique. Cah. Agric. 17, 95–100.
Lacy, S.M.,D.A.Cleveland, andD. Soleri, 2006: Farmer choice of
sorghumvarieties in SouthernMali.Hum.Ecol. 34, 331–353.
Lafarge, T. A., I. J. Broad, and G. L. Hammer, 2002: Tillering in
grain sorghum over a wide range of population densities:
identification of a common hierarchy for tiller emergence, leaf
area development and fertility. Ann. Bot. 90, 87–98.
Ratnadass, A., D. R. Butler, P. S. Marley, R. Bandyopadhyay, D.
E. Hess, and I. Akintayo, 2003: Sorghum head-bugs and grain
molds in West and Central Africa: II. Relationships between
weather, head-bug and mold damage on sorghum grains.
Crop Prot. 22, 853–858.
Ritchie, J. T., and G. Alagarswamy, 1989: Simulation of
Sorghum and Pearl Millet Phenology. In: S. M. Viramani,
H. L. S. Tandon, G. Alagarswamy, eds. Modeling the Growth
and Development of Sorghum and Pearl Millet, pp. 24–29.
ICRISAT, Patanchery, India.
Sissoko, S., S. Doumbia, M. Vaksmann, H. Hocde, D. Bazile, B.
Sogoba, M. Kouressy, K. Vom Brocke, M. M. Coulibaly, A.
Toure, and B. G. Dicko, 2008: Prise en compte des savoirs
paysans en matiere de choix varietal dans un programme de
selection. Cahiers Agricultures 17, 128–133.
Soumare, M., M. Kouressy, M. Vaksmann, I. Maikano, D. Baz-
ile, P. S. Traore, S. Traore, M. Dingkuhn, A. Toure, K. Vom
Brocke, L. Some, and C. P. Barro Kondombo, 2008: Prevision
de l’aire de diffusion des sorghos photoperiodiques en Afrique
de l’ouest. Cahiers Agricultures 17, 160–164.
Sultan, B., C. Baron, M. Dingkuhn, B. Sarr, and S. Janicot, 2005:
Agricultural impacts of large-scale variability of the West Afri-
can monsoon. Agric. For. Meteorol. 128, 93–110.
Traore, S. B., F. N. Reyniers, M. Vaksmann, B. Kone, A. Sidibe,
A. Yorote, K. Yattara, and M. Kouressy, 2000: Adaptation a la
secheresse des ecotypes locaux de sorghos du Mali. Secheresse
11, 27–237.
Vaksmann, M., S. B. Traore, and O. Niangado, 1996: Le pho-
toperiodisme des sorghos africains. Agric. Dev. 9, 13–18.
© 2012 Blackwell Verlag GmbH, 198 (2012) 340–348348
Abdulai et al.
42
Dissertation
43
4 Grain yield and its relations with some characters of grain sorghum under 1
diverse environments 2
This chapter was submitted to Field Crops Research; Manuscript Number: FIELD-D-15-01276 3
Title: Grain yield and its relations with some characters of grain sorghum under diverse 4
environments 5
Article Type: Research Paper 6
Keywords: Climate change. Sorghum, AMMI Analysis, Correlation Analysis, Path analysis 7
Corresponding Author: Mr. Alhassan Lansah Abdulai, MSc. 8
Corresponding Author's Institution: University of Hohenheim 9
First Author: Alhassan Lansah Abdulai, MSc. 10
Order of Authors: Alhassan Lansah Abdulai, MSc.; Folkard Asch, PhD; Bettina Haussmann, 11
PhD; Mamoutou Kouressy, PhD; Michel Vaksmann, PhD 12
Abstract: 13
Genotypic options for coping with climate variability as well as tactical and strategic adaptation 14
to climate change entail the introduction, development and deployment of genotypes with 15
adequate plasticity of phenology together with component technologies that will optimize yield. 16
Such genotypes should be based on ideotype concepts that assemble the most appropriate traits 17
selected based on a comprehensive understanding of the relationship among characters and their 18
individual and joint contribution to grain yield as well as their responses to various 19
environments.Six sorghum cultivars, drawn from three races, were evaluated in twelve 20
environments created from a factorial combination of two monthly sowing dates, three locations 21
(along a latitudinal gradient) and two years (2008 and 2009) in Mali. Data were collected on 22
twelve (12) plant characters and grain yield. Analysis of Variance (for individual and general 23
environments), AMMI analysis, AMMI1 AMMI2 biplots were performed for grain yield. 24
Correlations were used to determine relations between grain yield and the twelve characters as 25
well as among the characters. Path analysis was used to determine direct coefficients to grain 26
yield and indirect coefficients through other characters to grain yield for six of the characters that 27
had strong correlations with grain yield.Genotypic differences for grain yield were significant at 28
eight of the twelve environments and the general ANOVA showed significant differences for 29
genotypes, environments and interaction. The proportion of total variance explained by each of 30

44
environment and interaction was more than twice that of genotype. Majority of the high potential 31
environments were found at the highest latitude location. Grinkan and IRAT 204 were found to 32
have high minimum yields and good responsiveness to environments. Strong positive 33
correlations were found between grain yield and each of shoot biomass, panicle weight, number 34
of grains per panicle and threshing ability, but path analysis showed that the relations of the other 35
characters to grain yield was influenced to a large extent by their relations to number of grains 36
per panicle. The implications of the findings for plant breeders are discussed. 37
Highlights of manuscript: 38
Environments and interaction each contributed more than twice the contribution of 39
cultivars to total variance. 40
Cultivars showed specific adaptation for particular environments 41
Grain yield correlated strongly with shoot biomass, panicle weight, number of grains 42
per panicle and threshing ability. 43
Number of grains per panicle played an important mediatory role in relations between 44
grain yield and most of the characters 45
Path analysis complement correlation in improving understanding of relations between 46
sorghum grain yield and other characters 47
4.1 Introduction 48
Grain sorghum (Sorghum bicolor L. (Moench) is one of the main staple foods for the world's 49
poorest and most food insecure people (El Naim et al., 2012). Globally, it is the fifth most 50
important cereal crop following rice, maize, wheat and barley (FAO, 2006), and is cultivated 51
mainly under rain-fed conditions in the arid to semi-arid regions of West Africa (House, 1985). 52
Genetically, it is suited to hot and dry agro-ecologies where occasional extreme events (flood 53
and drought) make it difficult to profitably grow other food grains, and have many traits that 54
enhance phenotypic plasticity and/or tolerance to particular stresses created by particular 55
environments (Ezeaku et al., 1997; Haussmann et al., 2012). 56
In the semi-arid tropics, especially West Africa, sorghum production systems are highly 57
vulnerable because the bulk of sorghum production is by poor and subsistent small-holder 58
farmers having very low adaptive capacity for climate-related challenges. 59

Dissertation
45
IPCC (2007) predicted that climate change will adversely affect crop production systems of the 60
semi-arid tropics where the majority of the world’s poorest and least food secure people reside. 61
The realization of these predictions will further worsen the global food security problem since 62
many more of the small-holder farmers in such areas will become food insecure. 63
Currently, the majority of farmers in the semi-arid tropics use diverse well adapted but 64
unimproved, tall, and photoperiod sensitive sorghum genotypes with low yield potentials. Major 65
reasons adduced for the preference for these genotypes include their ability to mature uniformly 66
(at the end of the rainy season) irrespective of time of sowing (due to photoperiod sensitivity), 67
the reduced risk of damage from birds, and the production of grains with good quality (with no 68
grain mold contamination). Improving the yield potential of these preferred genotypes is one 69
major way by which the problem can be addressed. 70
Grain yield and yield-associated traits are complex quantitative traits controlled by multiple 71
genes and are highly influenced by environmental conditions and thus have low heritability 72
estimates (Grafius, 1959; Shi et al., 2009), so indirect selection through other traits with high 73
heritability could simplify the task of yield improvement. Currently, information on the 74
responses of individual traits and yield to changes in the environment, and whether it is possible 75
as well as how to exploit these for crop improvement purposes is very scanty. Adequate 76
knowledge of relations between the various traits and their linkage to grain yield (especially 77
under different climatic conditions) is required for effectively using these traits in improving 78
grain yield. Fadlalla and Abdalla (1994) found the weight of 1000-grains and number of 79
grains/spike to be the most reliable traits for improving yield. Other authors have shown that 80
early senescence under stress, number of panicles, panicle size, harvest index, grain number, and 81
seed weight correlate positively with grain yield in sorghum (Heinrich et al., 1983; Saeed and 82
Francis, 1983; Craufurd and Peacock, 1993; Can and Yoshida, 1999; Hausmann et al., 1999; 83
Soltani et al., 2001; Kouresy et al., 2008). 84
We took advantage of the wide range of different latitudes across Mali and staggered sowing 85
dates to create a large number of diverse sorghum growing environments. The environments so 86
created were used to investigate responses of selected traits and yield performance to different 87
environmental conditions using a set of sorghum cultivars sampled to represent a share of the 88
global genetic variation of rain-fed grain sorghum. 89
46
Specifically, we sought to (i) to determine environmental influences on yield performance of 90
selected sorghum cultivars; (ii) to analyze the relation between selected traits and grain yield in 91
the sorghum cultivars; (iii) to determine if and how environment affects the relations among 92
traits and grain yield; (iv) to evaluate the potential of path analysis in improving understanding 93
of trait-yield relations for sorghum cultivars. 94
4.2. Materials and Methods 95
4.2.1 Characteristics of experiment and the study sites 96
Three sites located on different latitudes and with obvious differences in amplitude of 97
photoperiod were selected in Mali for field trials. The research fields of the Institute d’Economie 98
Rurale (IER) at Cinzana (13°15'N; 5°52'W; 312 m as1; Sahel) with a sandy clay loam, Sotuba 99
(12°17'N; 7°57'W; 364 m asl; Sudan Savannah) with a sandy loam soil, and Farako (11°21'N, 100
5°41'W; 441 m as1, Guinea Savannah) with a loamy sand soil, were used for the experiments. 101
Details on the physicochemical properties of soils at each of the sites are presented in Table 4.1. 102
All the sites have a hot, tropical climate and the decadal means for rainfall and temperature for 103
the 2008 and 2009 seasons are presented in Figure 4.1. 104
4.2.2 Experimental units and Cultivars 105
Experimental units for this study were sampled from a bigger experiment designed to study the 106
yield performance of 10-grain sorghum cultivars under three monthly sowing dates in 2008 and 107
2009 at the afore mentioned locations. The full details on experimental units and design, cultural 108
practices as well as grain yield and yield stability performance for the bigger experiment are 109
reported by Abdulai et al., 2012. For this study, only the first two sowing dates (because of zero 110
yields recorded for the third sowing date at one location due to a complex of stressors) were 111
used. The two dates of sowing were combined with the three locations and two years to create 12 112
environments. Six of the ten sorghum cultivars, including 3 races (Guinea, Durra, and 113
Caudatum), with different degrees of sensitivity to photoperiod, were also used for this study. 114
Details on these cultivars are presented in Appendix 1. 115
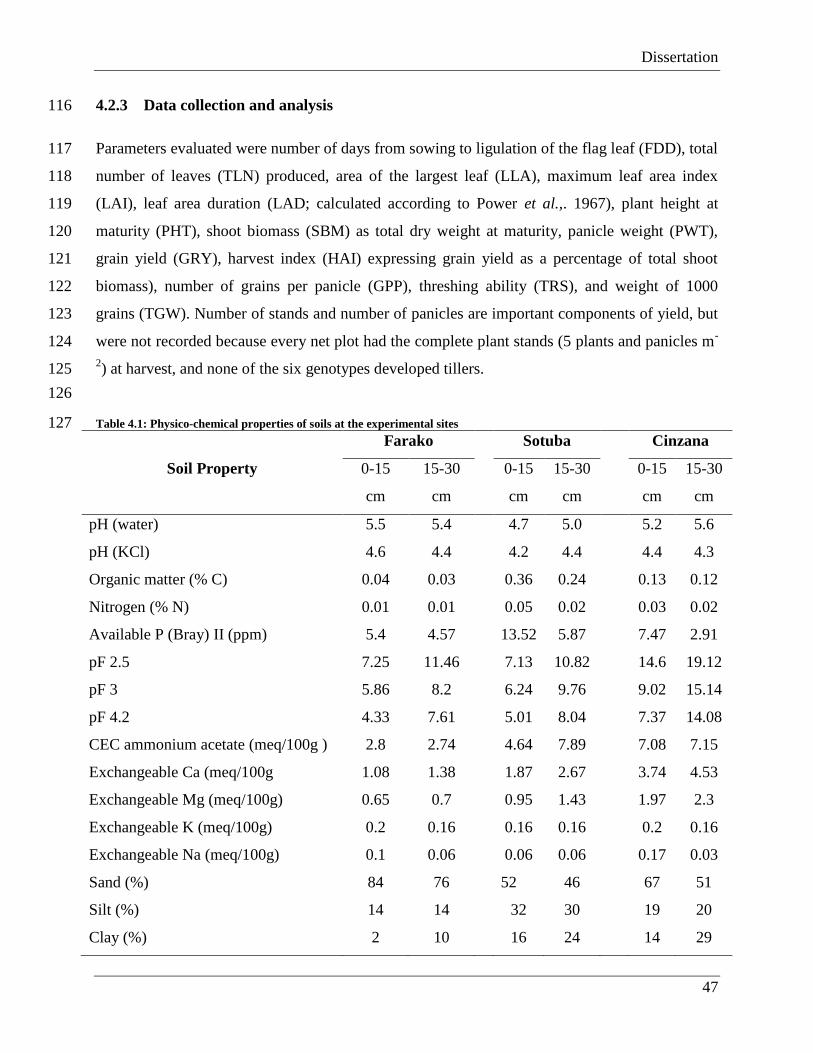
Dissertation
47
4.2.3 Data collection and analysis 116
Parameters evaluated were number of days from sowing to ligulation of the flag leaf (FDD), total 117
number of leaves (TLN) produced, area of the largest leaf (LLA), maximum leaf area index 118
(LAI), leaf area duration (LAD; calculated according to Power et al.,. 1967), plant height at 119
maturity (PHT), shoot biomass (SBM) as total dry weight at maturity, panicle weight (PWT), 120
grain yield (GRY), harvest index (HAI) expressing grain yield as a percentage of total shoot 121
biomass), number of grains per panicle (GPP), threshing ability (TRS), and weight of 1000 122
grains (TGW). Number of stands and number of panicles are important components of yield, but 123
were not recorded because every net plot had the complete plant stands (5 plants and panicles m-
124
2) at harvest, and none of the six genotypes developed tillers. 125
126
Table 4.1: Physico-chemical properties of soils at the experimental sites 127
Soil Property
Farako
Sotuba
Cinzana
0-15
cm
15-30
cm
0-15
cm
15-30
cm
0-15
cm
15-30
cm
pH (water) 5.5 5.4
4.7 5.0
5.2 5.6
pH (KCl) 4.6 4.4
4.2 4.4
4.4 4.3
Organic matter (% C) 0.04 0.03
0.36 0.24
0.13 0.12
Nitrogen (% N) 0.01 0.01
0.05 0.02
0.03 0.02
Available P (Bray) II (ppm) 5.4 4.57
13.52 5.87
7.47 2.91
pF 2.5 7.25 11.46
7.13 10.82
14.6 19.12
pF 3 5.86 8.2
6.24 9.76
9.02 15.14
pF 4.2 4.33 7.61
5.01 8.04
7.37 14.08
CEC ammonium acetate (meq/100g ) 2.8 2.74
4.64 7.89
7.08 7.15
Exchangeable Ca (meq/100g 1.08 1.38
1.87 2.67
3.74 4.53
Exchangeable Mg (meq/100g) 0.65 0.7
0.95 1.43
1.97 2.3
Exchangeable K (meq/100g) 0.2 0.16
0.16 0.16
0.2 0.16
Exchangeable Na (meq/100g) 0.1 0.06
0.06 0.06
0.17 0.03
Sand (%) 84 76
52 46
67 51
Silt (%) 14 14
32 30
19 20
Clay (%) 2 10
16 24
14 29

48
128
Figure 4.2: 10-day averages for rainfall and temperature for the growing seasons of 2008 and 2009 at the locations used 129 for the study in Mali. Vertical arrows indicate dekads within which the sowings were done. 130
The data collected on GRY were subjected to analysis of variance (ANOVA) for individual 131
environments and a combined ANOVA based on the AMMI model using GENSTAT Twelfth 132
Edition; Version 12.1.0.3278 (VSN International ltd., 2009). AMMI1 and AMMI2 biplots for 133
GRY were also plotted. Phenotypic correlation coefficients (r) between GRY and each of the 134
traits studied were computed for sowing date (data pooled over locations and years), locations 135
(data pooled over sowing date and years) and environments (genotypic means across 136
environments). However, correlation coefficients for all possible pairs of traits were computed 137
for the environment data only. Path analysis was used to partition relations between each trait 138
Tmax (°C) Tmin (°C) Rainfall
Cinzana 2008
Decads
6 8 10 12 14 16 18 20 22 24 26 28 30 32 34 36
Tem
per
atu
re (
°C)
10
15
20
25
30
35
40
45
50Cinzana 2009
Decads
6 8 10 12 14 16 18 20 22 24 26 28 30 32 34 36
Rain
fall
(m
m)
0
20
40
60
80
100
120
140
160
180
200
Sotuba 2009
Rain
fall
(m
m)
0
20
40
60
80
100
120
140
160
180
200Sotuba 2008
Tem
per
atu
re (
°C)
10
15
20
25
30
35
40
45
50
Farako 2008
Tem
per
atu
re (
°C)
10
15
20
25
30
35
40
45
50Farako 2009
Rain
fall
(m
m)
0
20
40
60
80
100
120
140
160
180
200First 1065 mm
Second 930 mm
First 792 mm
Second 703 mm
First 765 mm
Second 516 mm
First 793 mm
Second 666 mm
First 429 mm
Second 268 mm
First 437 mm
Second 342 mm
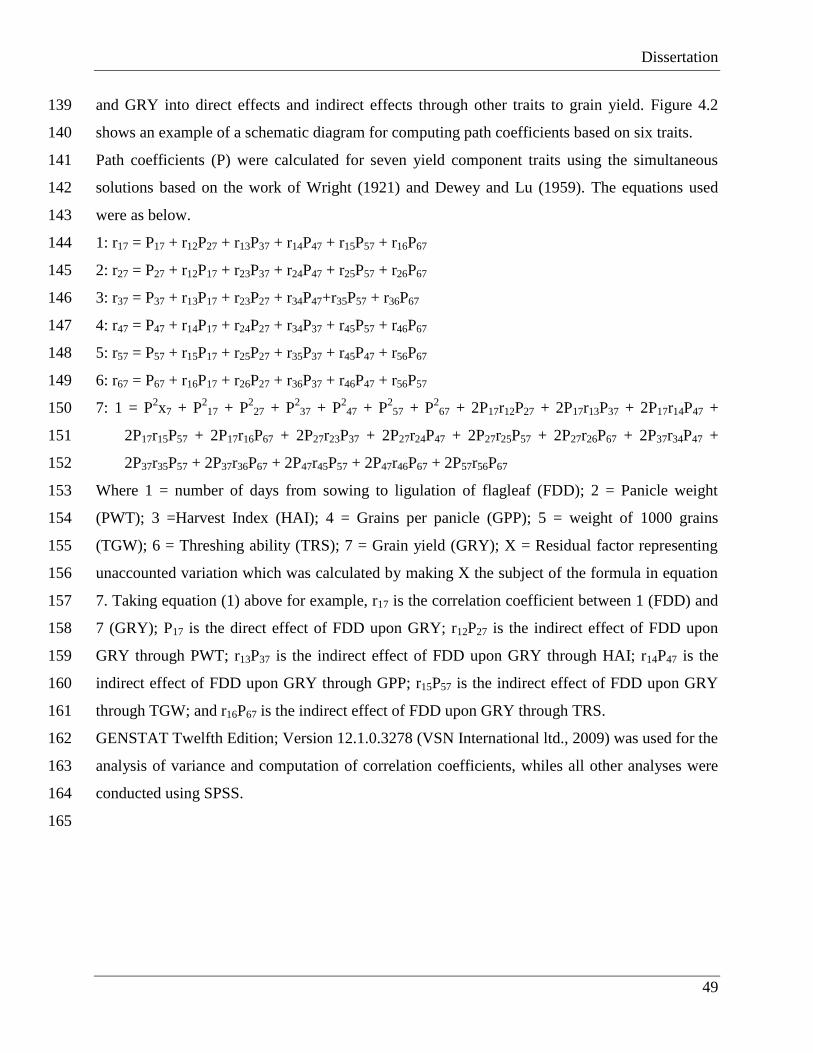
Dissertation
49
and GRY into direct effects and indirect effects through other traits to grain yield. Figure 4.2 139
shows an example of a schematic diagram for computing path coefficients based on six traits. 140
Path coefficients (P) were calculated for seven yield component traits using the simultaneous 141
solutions based on the work of Wright (1921) and Dewey and Lu (1959). The equations used 142
were as below. 143
1: r17 = P17 + r12P27 + r13P37 + r14P47 + r15P57 + r16P67 144
2: r27 = P27 + r12P17 + r23P37 + r24P47 + r25P57 + r26P67 145
3: r37 = P37 + r13P17 + r23P27 + r34P47+r35P57 + r36P67 146
4: r47 = P47 + r14P17 + r24P27 + r34P37 + r45P57 + r46P67 147
5: r57 = P57 + r15P17 + r25P27 + r35P37 + r45P47 + r56P67 148
6: r67 = P67 + r16P17 + r26P27 + r36P37 + r46P47 + r56P57 149
7: 1 = P2x7 + P
217 + P
227 + P
237 + P
247 + P
257 + P
267 + 2P17r12P27 + 2P17r13P37 + 2P17r14P47 + 150
2P17r15P57 + 2P17r16P67 + 2P27r23P37 + 2P27r24P47 + 2P27r25P57 + 2P27r26P67 + 2P37r34P47 + 151
2P37r35P57 + 2P37r36P67 + 2P47r45P57 + 2P47r46P67 + 2P57r56P67 152
Where 1 = number of days from sowing to ligulation of flagleaf (FDD); 2 = Panicle weight 153
(PWT); 3 =Harvest Index (HAI); 4 = Grains per panicle (GPP); 5 = weight of 1000 grains 154
(TGW); 6 = Threshing ability (TRS); 7 = Grain yield (GRY); X = Residual factor representing 155
unaccounted variation which was calculated by making X the subject of the formula in equation 156
7. Taking equation (1) above for example, r17 is the correlation coefficient between 1 (FDD) and 157
7 (GRY); P17 is the direct effect of FDD upon GRY; r12P27 is the indirect effect of FDD upon 158
GRY through PWT; r13P37 is the indirect effect of FDD upon GRY through HAI; r14P47 is the 159
indirect effect of FDD upon GRY through GPP; r15P57 is the indirect effect of FDD upon GRY 160
through TGW; and r16P67 is the indirect effect of FDD upon GRY through TRS. 161
GENSTAT Twelfth Edition; Version 12.1.0.3278 (VSN International ltd., 2009) was used for the 162
analysis of variance and computation of correlation coefficients, whiles all other analyses were 163
conducted using SPSS. 164
165

50
166
Figure 4.3: Schematic diagram for path coefficient computations involving five sorghum traits and grain yield as the 167 response variable 168
4.3 Results 169
4.3.1 Analysis of Variance, AMMI Analysis, and Biplots 170
The yield performance of the six genotypes considered for this study is presented in Appendix 171
Table 1. The Individual analyses of variance for each of the environments revealed significant 172
differences (p ≤ 0.05) among genotypes in all except four (4) environments (E5, E8, E11, and 173
E12), but the analysis revealed that there was sufficient genetic variability to be exploited by 174
selection (Table 4.2) 175
Table 4.2: Means sum of squares of individual analysis of variance, means, and coefficients of variation (CV) for grain 176 yield (GRY) of 6 genotypes in twelve environments in Mali in the crop seasons of 2008 and 2009 177
Source d.f. E1 E2 E3 E4 E5 E6 E7 E8 E9 E10 E11 E12
Rep. 2 3191 10616 868 1440 3231 1386.1 2348 228 254 124 14673 227
Genotype 5 36912** 27829** 26606** 16484* 6647ns 2566.6** 9024* 7590ns 10510** 7214* 4956ns 14041ns
Error 10 4173 2758 1809 3779 2706 372.5 2559 3360 1580 1630 7018 5375
Mean (g/m2)
227 206 187 160 176 85.7 195 169 245.4 145.2 291 237
Cv (%)
23.3 25.5 22.7 38.5 29.6 22.5 26.0 34.4 16.2 27.8 28.8 31.0
ns = non-significant; * = significant at p ≤ 0.05; ** = significant at p ≤ 0.01 178
Residual factors (X)
Grain Yield (6)
Flagleaf ligulation (1)
Panicle Weight (2)
Harvest index (3)
Grains panicle-1(4)
1000 grain weight (5)
r12
r23
r34
r45
r 35
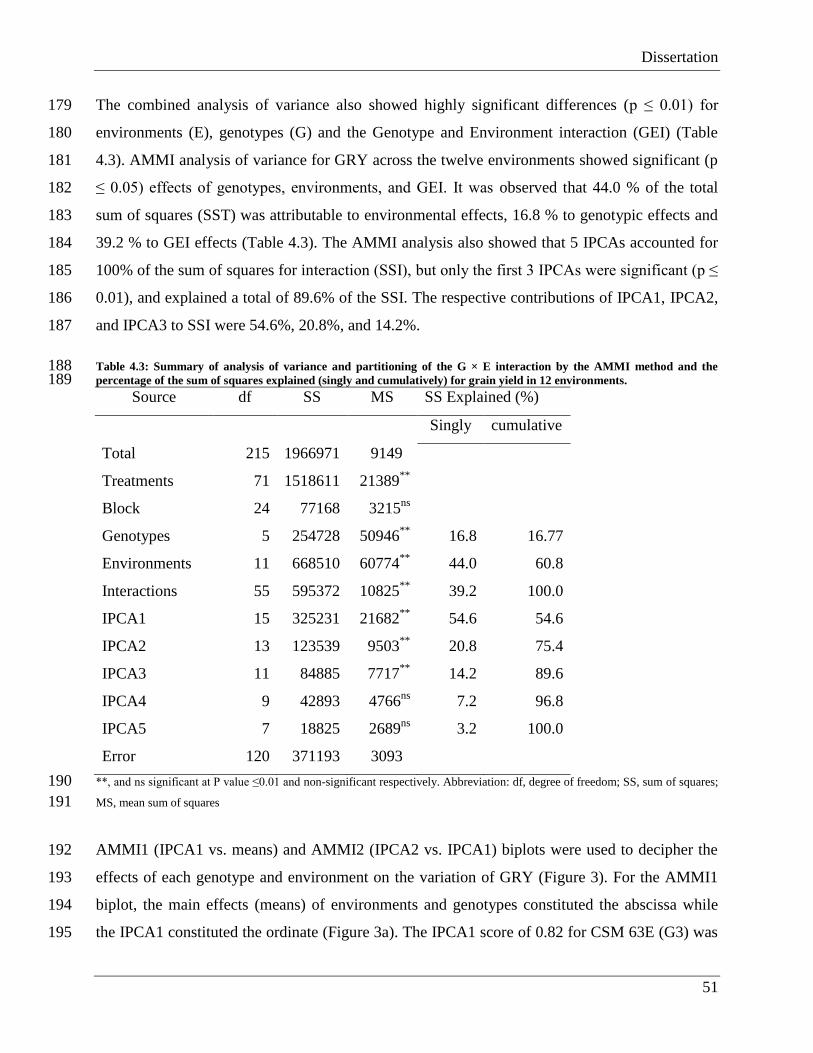
Dissertation
51
The combined analysis of variance also showed highly significant differences (p ≤ 0.01) for 179
environments (E), genotypes (G) and the Genotype and Environment interaction (GEI) (Table 180
4.3). AMMI analysis of variance for GRY across the twelve environments showed significant (p 181
≤ 0.05) effects of genotypes, environments, and GEI. It was observed that 44.0 % of the total 182
sum of squares (SST) was attributable to environmental effects, 16.8 % to genotypic effects and 183
39.2 % to GEI effects (Table 4.3). The AMMI analysis also showed that 5 IPCAs accounted for 184
100% of the sum of squares for interaction (SSI), but only the first 3 IPCAs were significant (p ≤ 185
0.01), and explained a total of 89.6% of the SSI. The respective contributions of IPCA1, IPCA2, 186
and IPCA3 to SSI were 54.6%, 20.8%, and 14.2%. 187
Table 4.3: Summary of analysis of variance and partitioning of the G × E interaction by the AMMI method and the 188 percentage of the sum of squares explained (singly and cumulatively) for grain yield in 12 environments. 189
Source df SS MS SS Explained (%)
Singly cumulative
Total 215 1966971 9149
Treatments 71 1518611 21389**
Block 24 77168 3215ns
Genotypes 5 254728 50946**
16.8 16.77
Environments 11 668510 60774**
44.0 60.8
Interactions 55 595372 10825**
39.2 100.0
IPCA1 15 325231 21682**
54.6 54.6
IPCA2 13 123539 9503**
20.8 75.4
IPCA3 11 84885 7717**
14.2 89.6
IPCA4 9 42893 4766ns
7.2 96.8
IPCA5 7 18825 2689ns
3.2 100.0
Error 120 371193 3093
**, and ns significant at P value ≤0.01 and non-significant respectively. Abbreviation: df, degree of freedom; SS, sum of squares; 190
MS, mean sum of squares 191
AMMI1 (IPCA1 vs. means) and AMMI2 (IPCA2 vs. IPCA1) biplots were used to decipher the 192
effects of each genotype and environment on the variation of GRY (Figure 3). For the AMMI1 193
biplot, the main effects (means) of environments and genotypes constituted the abscissa while 194
the IPCA1 constituted the ordinate (Figure 3a). The IPCA1 score of 0.82 for CSM 63E (G3) was 195

52
the closest to zero while the IPCA1 score of -10.06 for Grinkan (G4) was the furthest from zero. 196
G4 produced the highest mean GRY (256.6 g m-2
) while CSM 63E produced the lowest mean 197
GRY (160.4 g m-2
). Among the genotypes, only G4 and IRAT 204 (G5) produced above the 198
average mean GRY recorded for the study. Boiguel (G1) and CSM 388 (G2) had more or less 199
similar average GRY as G3, but their IPCA1 scores were respectively, the fourth and third 200
furthest away from zero. GRY for Lakahieri (G6) was very close to the average for the study, 201
and its IPCA1 score was the second closest to zero (Figure 4.3a). 202
The environment with the highest mean for GRY was E1, whiles E6 had the lowest mean for 203
GRY. Mean GRY for five of the twelve environments (E1, E2, E9, E11 and E12) were above the 204
average GRY recorded for the study (Figure 4.3a). The IPCA1 score for E10 (0.16) was closest 205
to zero while that for E12 (7.61) was the furthest from zero. Six of the environments (E1, E2, E3 206
E5, E11 and E12) had IPCA1 scores of more than 5 units away from zero; four environments 207
(E4, E6, E7 and E9) had IPCA1 scores greater than 1 but less than 5 units away from zero; while 208
IPCA1 scores for E10 and E8 were fractions of a unit from zero (Figure 4.3a). 209
210
Figure 4.4: Biplot of Additive Main effects and Multiplicative Interaction (AMMI) analysis for genotypes and 211 environments. (a) AMMI-1 biplot where ordinate is interaction Principal Component Axes 1 (IPCA-1) scores and the 212 abscissa is genotype and environment mean grain yield (g m-2). (b) AMMI-2 biplot where the ordinate is IPCA-2 and 213 abscissa is IPCA-1 214
Figure 4.3b presents an AMMI2 biplot (with IPCA1 scores as abscissa and IPCA2 scores as 215
ordinate) that showed that among the genotypes, G4 and G1 were the farthest and closest 216
respectively to the origin, while among the environments. Environments E9, E10, and E7 were 217
the three closest and E1, E2, and E12 were three farthest from the origin. The remaining six 218
a
Genotype and Environment means
50 100 150 200 250 300 350
IPC
A-1
-12.0
-10.0
-8.0
-6.0
-4.0
-2.0
0.0
2.0
4.0
6.0
8.0
10.0
G1G2
G3
G4G5
G6
E9
E10
E11E12
E1E2E3
E4
E5
E6 E7
E8
b
IPCA-1
-10.0 -8.0 -6.0 -4.0 -2.0 0.0 2.0 4.0 6.0 8.0
IPC
A-2
-8.0
-6.0
-4.0
-2.0
0.0
2.0
4.0
6.0
8.0
10.0
G1
G2
G3
G4
G5
G6
E9E10
E11
E12
E1
E2
E3
E4
E5
E6
E7
E8
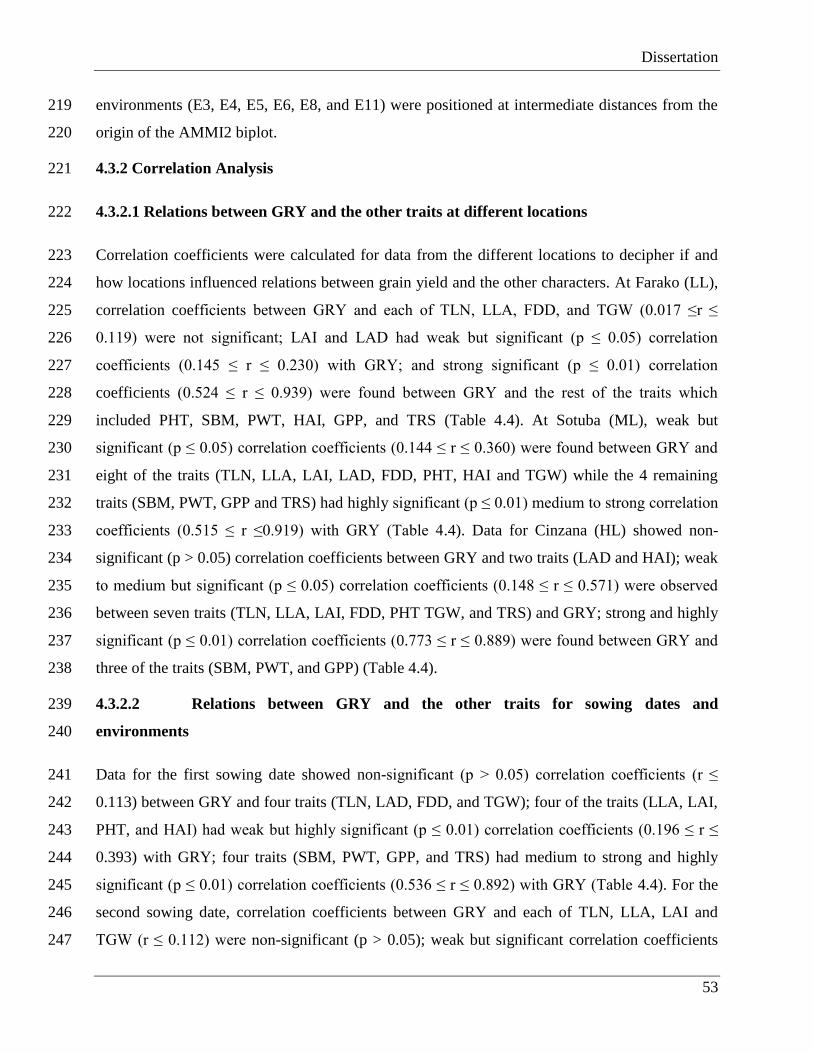
Dissertation
53
environments (E3, E4, E5, E6, E8, and E11) were positioned at intermediate distances from the 219
origin of the AMMI2 biplot. 220
4.3.2 Correlation Analysis 221
4.3.2.1 Relations between GRY and the other traits at different locations 222
Correlation coefficients were calculated for data from the different locations to decipher if and 223
how locations influenced relations between grain yield and the other characters. At Farako (LL), 224
correlation coefficients between GRY and each of TLN, LLA, FDD, and TGW (0.017 ≤r ≤ 225
0.119) were not significant; LAI and LAD had weak but significant (p ≤ 0.05) correlation 226
coefficients (0.145 ≤ r ≤ 0.230) with GRY; and strong significant (p ≤ 0.01) correlation 227
coefficients (0.524 ≤ r ≤ 0.939) were found between GRY and the rest of the traits which 228
included PHT, SBM, PWT, HAI, GPP, and TRS (Table 4.4). At Sotuba (ML), weak but 229
significant (p ≤ 0.05) correlation coefficients (0.144 ≤ r ≤ 0.360) were found between GRY and 230
eight of the traits (TLN, LLA, LAI, LAD, FDD, PHT, HAI and TGW) while the 4 remaining 231
traits (SBM, PWT, GPP and TRS) had highly significant (p ≤ 0.01) medium to strong correlation 232
coefficients (0.515 ≤ r ≤0.919) with GRY (Table 4.4). Data for Cinzana (HL) showed non-233
significant (p > 0.05) correlation coefficients between GRY and two traits (LAD and HAI); weak 234
to medium but significant (p ≤ 0.05) correlation coefficients (0.148 ≤ r ≤ 0.571) were observed 235
between seven traits (TLN, LLA, LAI, FDD, PHT TGW, and TRS) and GRY; strong and highly 236
significant (p ≤ 0.01) correlation coefficients (0.773 ≤ r ≤ 0.889) were found between GRY and 237
three of the traits (SBM, PWT, and GPP) (Table 4.4). 238
4.3.2.2 Relations between GRY and the other traits for sowing dates and 239
environments 240
Data for the first sowing date showed non-significant (p > 0.05) correlation coefficients (r ≤ 241
0.113) between GRY and four traits (TLN, LAD, FDD, and TGW); four of the traits (LLA, LAI, 242
PHT, and HAI) had weak but highly significant (p ≤ 0.01) correlation coefficients (0.196 ≤ r ≤ 243
0.393) with GRY; four traits (SBM, PWT, GPP, and TRS) had medium to strong and highly 244
significant (p ≤ 0.01) correlation coefficients (0.536 ≤ r ≤ 0.892) with GRY (Table 4.4). For the 245
second sowing date, correlation coefficients between GRY and each of TLN, LLA, LAI and 246
TGW (r ≤ 0.112) were non-significant (p > 0.05); weak but significant correlation coefficients 247

54
(0.134 ≤ r ≤ 0.334) were found between GRY and four traits (LAD, FDD, PHT and HAI); 248
medium to strong and highly significant (p ≤ 0.01) correlation coefficients were found between 249
GRY and each of SBM, PWT, GPP and TRS (0.652 ≤ r ≤ 0.905) (Table 4.4). 250
Considering the data for environments, correlation coefficients (r ≤ 0.092) between GRY and 251
three of the traits (LAD, FDD and TGW) were non-significant (p > 0.05); correlation coefficients 252
between GRY and each of TLN, LLA, LAI, PHT, and HAI were weak (0.163 ≤ r ≤ 0.339) but 253
significant (p ≤ 0.05); medium to strong and highly significant (p ≤ 0.01) correlation coefficients 254
(0.621 ≤ r ≤ 0.899) were observed between GRY and four of the traits including SBM, PWT, 255
GPP and TRS (Table 4.4). 256
Table 4.4: Correlation coefficients between grain yield and other plant traits1 as affected by sowing date, location and 257 genotypic means across environments 258
Farako
(LL)
Sotuba
(ML)
Cinzana
(HL)
First
Sowing
Second
sowing Pooled
TLN 0.051ns
0.360**
0.399**
0.113ns
-0.071ns
0.177**
LLA 0.067ns
0.152* 0.517
** 0.224
** 0.112
ns 0.262
**
LAI 0.230**
0.266**
0.194**
0.196**
-0.037ns
0.208**
LAD 0.145* 0.275
** 0.106
ns -0.009
ns -0.134
* 0.092
ns
FDD -0.017ns
0.300**
0.352**
0.001ns
-0.232**
0.070ns
PHT -0.524**
0.174* 0.148
* -0.281
** -0.270
** -0.163
*
SBM 0.848**
0.762**
0.889**
0.771**
0.877**
0.840**
PWT 0.897**
0.830**
0.773**
0.777**
0.837**
0.816**
HAI 0.457**
0.277**
0.103ns
0.393**
0.334**
0.339**
GPP 0.939**
0.919**
0.791**
0.892**
0.905**
0.899**
TGW -0.119ns
0.144* 0.358
** 0.029
ns -0.040
ns 0.048
ns
TRS 0.708**
0.515**
0.571**
0.536**
0.652**
0.621**
TLN = Total number of leaves; LLA = Area of largest leaf; LAI = Leaf area Index; LAD = Leaf Area Duration; FDD = Number 259
of days to ligulation of flagleaf; PHT = Plant height; SBM = Shoot biomass; PWT = Panicle weight; HAI = Harvest index; GPP 260
= number of grains per panicle; TGW = thousand grain weight; TRS = Threshing ability 261
4.3.2.3 Phenotypic Correlation among the traits across environments 262
Table 4.5 presents the phenotypic correlation coefficients among the traits recorded. For 263
correlations involving leaf characters (TLN, LLA, LAI, and LAD) medium to strong positive 264

Dissertation
55
relations (0.502 ≤ r ≤ 0.836) were found between TLN and the other leaf characters, between 265
LAI and LAD, and between FDD and each of TLN, LLA, and LAD. All other relations involve 266
leaf characters were weak (Table 4.5). 267
For PLHT, correlations with all the other characters were weak, with those involving SBM and 268
PWT being non-significant, while those involving HAI, GPP and TRS had negative coefficients. 269
With the exception of PWT and TRS not being related, all other possible pairs of SBM, PWT, 270
GPP, and TRS, had strong and highly significant correlation coefficients (Table 4.5). 271
HAI was not related to SBM and HAI but had weak significant relations with all other 272
characters. Its relations with all the other characters were negative, with the exception of PWT. 273
None of SBM and HAI was related to TGW, while all other characters had weak to average 274
correlations with TGW (Table 4.5). PWT was not significantly correlated with any of PHT and 275
TRS but was positively and significantly correlated with the rest of the traits. 276
Table 4.5: Phenotypic Correlations among the traits for environment data (pooled over genotypes). 277
TLN LLA LAI LAD FDD PLHT SBM PWT HI GPP TGW
LLA 0.638**
LAI 0.502** 0.374**
LAD 0.585** 0.427** 0.836**
FDD 0.737** 0.529** 0.44** 0.649**
PHT 0.313** 0.238** 0.363** 0.45** 0.349**
SBM 0.343** 0.268** 0.341** 0.292** 0.252** -0.001ns
PWT 0.336** 0.326** 0.309** 0.175* 0.133* 0.001ns 0.682**
HAI -0.203** 0.038ns -0.176** -0.289** -0.264** -0.278** -0.183** 0.289**
GPP 0.033ns 0.155* 0.117ns -0.014ns -0.04 ns -0.272** 0.73** 0.626** 0.362**
TGW 0.354** 0.307** 0.192** 0.251** 0.321** 0.232** 0.061ns 0.260** -0.014ns -0.345**
TRS -0.163* 0.015ns -0.09ns -0.117ns -0.089ns -0.262** 0.510** 0.107ns 0.254** 0.693** -0.259**
TLN = Total number of leaves; LLA = Area of largest leaf; LAI = Leaf area Index; LAD = Leaf Area Duration; FDD = Number 278
of days to ligulation of flagleaf; PHT = Plant height; SBM = Shoot biomass; PWT = Panicle weight; HAI = Harvest index; GPP 279
= number of grains per panicle; TGW = thousand grain weight; TRS = Threshing ability 280
HAI was revealed by correlation coefficients to have no significant correlations with both LLA 281
and TGW; significant positive correlation coefficients were found between HAI and each of 282
PWT, GPP, and TRS; correlation coefficients between HAI and the remaining six traits were 283
negative but significant. 284
Four of the traits (TLN, LAI, LAD and FDD) did not correlate significantly (p < 0.05) with GPP; 285
two traits (PHT and TGW) had significant negative correlations with GPP; five traits (PWT, 286
56
LLA, SBM, HAI, and TRS) had significant positive correlations with GPP. When TGW we 287
related to the other traits, we found that SBM and HAI did not correlate significantly with TGW, 288
that two of the traits (GPP and TRS) had significant negative correlations with TGW, while the 289
remaining seven traits had significant positive correlations with SBM. Significant negative 290
correlations were found between TRS and three traits (TLN, PHT, and TGW). Three other traits 291
(SBM, HAI, and GPP) had significant positive correlations with TRS, while the remaining five 292
traits were not significantly correlated with TRS. 293
4.3.3 Path Analysis 294
4.3.3.1 Path Analysis for Locations 295
Table 4.6 presents the path coefficients (to GRY) for six yield component traits for the three 296
study locations. The dataset for Farako (LL) included E1 to E4; dataset for Sotuba (ML) 297
involved E5 to E8; dataset for Cinzana (HL) involved E9 to E12. We found that direct path 298
coefficients for FDD to GRY were between -0.004 and -0.014 for the three locations. The 299
indirect path coefficients of FDD through the other traits to GRY were between -0.059 (for TRS 300
at LL) and 0.172 (for PWT at HL). Only indirect path coefficients through PWT and GPP at ML 301
and HL were greater than 0.100 (Table 6). For the path coefficients of PWT to GRY, we found 302
that: direct path coefficients were between 0.312 and 0.476 for all locations; indirect path 303
coefficients through other traits had absolute values between 0.019 and 0.460; only indirect path 304
coefficients through GPP for all locations and TGW for HL had absolute values greater than 305
0.100 (Table 4.6). Direct path coefficients for HAI to GRY were negative for all the locations 306
and had values between -0.039 and -0.077. Indirect path coefficients for HAI were positive for 307
all except that through TGW at ML, but only those through GPP at each of LL and ML as well 308
as those through PWT and TRS at LL were greater than 0.100 (Table 4.6). Path coefficients for 309
GPP were all positive and ranged between 0.429 and 0.677 across locations. For the indirect path 310
coefficients of GPP, those through HAI and TGW were negative, while all those through PWT 311
and TRS were positive for all the locations, however only the indirect path coefficients of GPP 312
through PWT and TRS were above 0.100 (Table 6). Direct path coefficients of TGW were 313
positive for all locations and were between 0.114 and 0.291. Indirect path coefficients for TGW 314
showed that: those through FDD, GPP, and TRS were negative while those through PWT were 315
positive for all locations; those through HAI were negative for LL and HL but positive for ML; 316
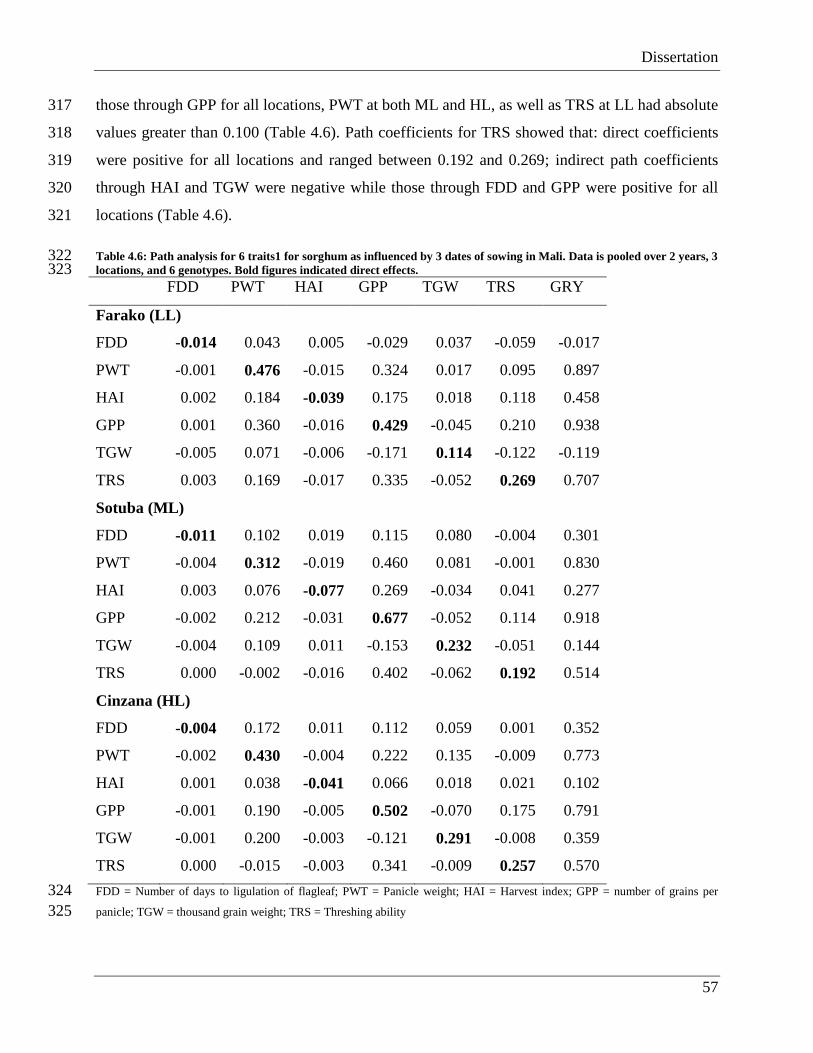
Dissertation
57
those through GPP for all locations, PWT at both ML and HL, as well as TRS at LL had absolute 317
values greater than 0.100 (Table 4.6). Path coefficients for TRS showed that: direct coefficients 318
were positive for all locations and ranged between 0.192 and 0.269; indirect path coefficients 319
through HAI and TGW were negative while those through FDD and GPP were positive for all 320
locations (Table 4.6). 321
Table 4.6: Path analysis for 6 traits1 for sorghum as influenced by 3 dates of sowing in Mali. Data is pooled over 2 years, 3 322 locations, and 6 genotypes. Bold figures indicated direct effects. 323
FDD PWT HAI GPP TGW TRS GRY
Farako (LL)
FDD -0.014 0.043 0.005 -0.029 0.037 -0.059 -0.017
PWT -0.001 0.476 -0.015 0.324 0.017 0.095 0.897
HAI 0.002 0.184 -0.039 0.175 0.018 0.118 0.458
GPP 0.001 0.360 -0.016 0.429 -0.045 0.210 0.938
TGW -0.005 0.071 -0.006 -0.171 0.114 -0.122 -0.119
TRS 0.003 0.169 -0.017 0.335 -0.052 0.269 0.707
Sotuba (ML)
FDD -0.011 0.102 0.019 0.115 0.080 -0.004 0.301
PWT -0.004 0.312 -0.019 0.460 0.081 -0.001 0.830
HAI 0.003 0.076 -0.077 0.269 -0.034 0.041 0.277
GPP -0.002 0.212 -0.031 0.677 -0.052 0.114 0.918
TGW -0.004 0.109 0.011 -0.153 0.232 -0.051 0.144
TRS 0.000 -0.002 -0.016 0.402 -0.062 0.192 0.514
Cinzana (HL)
FDD -0.004 0.172 0.011 0.112 0.059 0.001 0.352
PWT -0.002 0.430 -0.004 0.222 0.135 -0.009 0.773
HAI 0.001 0.038 -0.041 0.066 0.018 0.021 0.102
GPP -0.001 0.190 -0.005 0.502 -0.070 0.175 0.791
TGW -0.001 0.200 -0.003 -0.121 0.291 -0.008 0.359
TRS 0.000 -0.015 -0.003 0.341 -0.009 0.257 0.570
FDD = Number of days to ligulation of flagleaf; PWT = Panicle weight; HAI = Harvest index; GPP = number of grains per 324
panicle; TGW = thousand grain weight; TRS = Threshing ability 325

58
4.3.3.2 Path Analysis for Sowing date and Environment 326
Path coefficients for the traits, as influenced by sowing date and environment are presented in 327
Table 4.7. Direct path coefficients of FDD to GRY for first sowing date and environments were 328
positive while that for the second sowing date was negative, but were between -0.042 and 0.014. 329
Path coefficients of FDD through other traits to GRY were between -0.146 and 0.066, with that 330
through GPP for second sowing date only having a value greater than 0.100 or less than -0.100 331
(Table 4.7). 332
Table 4.7: Path analysis for 5 traits1 for sorghum as influenced by 3 dates of sowing in Mali. Data is pooled over 2 years, 3 333 locations, and 6 genotypes. Bold figures indicated direct effects. 334
FDD PWT HAI GPP TGW TRS GRY
First Sowing
FDD -0.042 0.056 0.008 -0.035 0.064 -0.050 0.000
PWT -0.006 0.406 -0.011 0.335 0.070 -0.018 0.776
HAI 0.008 0.117 -0.040 0.218 0.023 0.068 0.393
GPP 0.002 0.225 -0.014 0.606 -0.090 0.163 0.891
TGW -0.011 0.120 -0.004 -0.231 0.237 -0.082 0.029
TRS 0.008 -0.028 -0.011 0.391 -0.077 0.253 0.536
Second sowing
FDD 0.014 -0.092 0.024 -0.146 0.049 -0.082 -0.232
PWT -0.003 0.468 -0.018 0.313 0.023 0.054 0.837
HAI -0.006 0.154 -0.055 0.182 -0.020 0.079 0.334
GPP -0.004 0.315 -0.022 0.464 -0.064 0.215 0.905
TGW 0.004 0.069 0.007 -0.188 0.157 -0.088 -0.039
TRS -0.004 0.084 -0.014 0.330 -0.046 0.302 0.651
Pooled
FDD -0.016 0.053 0.012 -0.022 0.066 -0.023 0.070
PWT -0.002 0.401 -0.013 0.350 0.054 0.027 0.817
HAI 0.004 0.116 -0.045 0.202 -0.003 0.065 0.339
GPP 0.001 0.251 -0.016 0.559 -0.071 0.176 0.899
TGW -0.005 0.104 0.001 -0.193 0.206 -0.066 0.047
TRS 0.001 0.043 -0.011 0.387 -0.053 0.254 0.621

Dissertation
59
FDD = Number of days to ligulation of flagleaf; PWT = Panicle weight; HAI = Harvest index; GPP = number of grains per 335
panicle; TGW = thousand grain weight; TRS = Threshing ability 336
Direct path coefficients of PWT to GRY were positive for all dates of sowing and environments, 337
with values between 0.401 and 0.468. The path coefficients of PWT through other traits to GRY 338
had values between -0.018 and 0.350, but only those through GPP were greater than 0.100 or less 339
than -0.100 (Table 4.7). 340
Across dates of sowing and environments, direct path coefficients of HAI to GRY were all 341
negative with values ranging between -0.055 and -0.040. On the other hand, only the path 342
coefficients of HAI through PWT and GPP were greater than 0.100 for all dates of sowing and 343
environments (Table 4.7). Direct path coefficients of GPP to GRY were positive, with 0.606, 344
0.464, and 0.559 for first sowing, second sowing, and environment respectively. Apart from the 345
indirect path coefficients of GPP through PWT and TRS to GRY, none other was greater than 346
0.100 for all dates of sowing and environment datasets (Table 4.7). 347
Path coefficients of TGW and TRS to GRY were all positive. The path coefficients for TGW 348
were between 0.157 and 0.237 while those for TRS were between 0.253 and 302 for all the dates 349
of sowing and environment datasets. The following were true for indirect path coefficients of 350
TGW and TRS: Path coefficients of both TGW and TRS through FDD and HAI had absolute 351
values less than 0.100 for all the datasets; the path coefficients of TGW and TRS through GPP 352
had absolute values of between 0.188 and 0.391 for all the datasets; absolute values for path 353
coefficients of TGW through PWT were higher than 0.100 for the first sowing date and 354
environment but lower than 0.100 for the second sowing date (Table 4.7). 355
4.4. Discussion 356
The value of genetic resources in the progress of developing new cultivars has been well realized 357
(Upadhyaya, 2005). Over the years, the variability in environmental factors created by climate 358
change has disrupted genotypic adaptation and / or specialization (Wassmann et al., 2009) to the 359
extent that new genotypic and environmental niches are being created. In Mali, sorghum is 360
produced along a latitude gradient, and cultivars have been selected or bred for optimizing yield 361
under local environments, but climate change has necessitated a critical redefinition of genotypic 362
niches or environmental suitability for sorghum. The current study sort to extend the yield and 363

60
yield stability study of Abdulai et al., 2012 by evaluating six of the genotypes under twelve of 364
the environments they used for potential general or specific genotypic adaptation. It also sought 365
to evaluate relations between grain yield and phenotypic traits, with the view to finding traits that 366
have very stable close relations with grain yield, so that these would be exploited for higher and 367
stable yields in the future. Genotypes had variable performance across environments, with the 368
proportion of treatment sum of squares explained by each of environments and interaction being 369
more twice of that explained by genotypes (Table 4.3). AMMI analysis, which distinguishes the 370
part of interaction sum of squares (SSI) attributable to the effect of genotypes and environments 371
from an unpredictable or un-interpretable residual part (Crossa et al., 1990), showed that the first 372
principal component axis retained the greatest proportion of SSI and values for subsequent axes 373
were always lower (Table 3). The first three principal component axes explained 89.6% of the 374
SSI, and we could have used AMMI4 based on the recommendation of Cornelius et al. (1992). 375
Though increasing the number of principal component axes could explain more of SSI, some 376
authors have stated that this option may also increase the influence of noise (Gauch and Zobel, 377
1988; Piepho, 1995). In this study, IPCA4 and IPCA5 non-significantly contributed to 378
accounting for 100% of SSI (Table 4.3). The stability of the genotypes used in this study in 379
addition to four other genotypes was reported by Abdulai et al., 2012 who used two static and 380
five dynamic indices (including IPCA1). 381
The contribution of any component to GEI depends on how far the component is positioned or 382
the length of its vector from the origin of the AMMI2 biplot. Boiguel (G1), an early maturing 383
durra, was shown to contribute the least to GEI while Grinkan (G4), a dwarf, photoperiod-384
sensitive, medium maturing and improved composite, contributed the most to GEI. IRAT 204 385
(G5), an improved dwarf, photoperiod insensitive and early maturing caudatum and G4 were 386
shown to be most responsive to environments and could be used for optimizing yield in both 387
high and low potential environments while better alternatives are being sought. 388
Two environments (E8 at ML and E10 at HL) were shown to be very small contributors to GEI 389
while six environments (E1, E2, E3 E5, E11, and E12) made large contributions to GEI, with the 390
remaining four environments (E4, E6, E7, and E9) making average contributions to GEI. 391
We noted that E1 and E2 from LL and three environments from HL (E9, E11, and E12) could be 392
classified as favorable environments for obtaining high GRY. The amount and distribution of 393

Dissertation
61
precipitation and the relatively higher available phosphorus for soils at HL (Table 1) could 394
explain why 75% of its environments were favorable. 395
It is generally difficult to find cultivars with wide environmental adaptation, so it is important to 396
identify cultivars adapted to available environments or create environments to which available 397
cultivars are adapted. It was found in this study that the following could optimize performance: 398
Boiguel (G1) and Lakahieri (G6) be considered for E7, E11, and E12; IRAT 204 (G5) be 399
considered for E2, E4, and E9; Grinkan (G4) should be used for E3 and E1; CSM 63E (G3) and 400
CSM 388 (G2) be considered for E5, E6, and E8 (Figure 3b). 401
Crop cultivars targeted at adaptation to climate change and variability can be developed through 402
direct selection for performance in the target stress environments or indirect selection through 403
specific morphological, phenological or physiological characteristics. However, the use of 404
indirect selection should involve traits that are easy to identify, cheap and fast to measure or 405
those that have a strong genetic correlation with yield performance under the target condition 406
(Falconer 1989). Using a directional model for direct and / or indirect selection for grain yield 407
requires information on the interrelationship of plant characters, which is provided by correlation 408
analysis (Khan et al., 2004). However, Toker and Cagirgan., (2004) stated that indirect selection 409
based on characters with high heritability might prove more effective because direct selection 410
could be misleading. In this study, we found that four characters (SBM, PWT, GPP, and TRS) 411
had consistently strong relations (0.52 ≤r ≤ 0.94) with GRY across all the sets of data analyzed. 412
Actually, among the four characters, only TRS had correlation coefficients less than 0.761 (Table 413
4). Apparent auto-correlations exist between some of the traits found to be strongly correlated 414
with GRY. The path coefficient analysis showed that neither location nor date of sowing 415
differentially influenced the direct effects of the characters on GRY (Tables 6 and 7). Direct path 416
coefficients of PWT, GPP, TGW and TRS to GRY ranged from 0.114 to 0.677. The path 417
analysis showed that GPP mediated to a larger extent, in the relationships between the other 418
characters and GRY, as indicated by the strong indirect effects on relations between yield and 419
most of the characters. Breeding efforts that target the study environments and /or its analogues 420
should concentrate first on selecting for high GPP. Molecular techniques targeted at GPP could 421
be deployed for rapid results. Traditionally, correlation and path-coefficient analyses are used for 422
determining character interrelationships and yield criteria for indirect selection (Singh et al., 423
1990; Toker and Cagirgan, 2004). 424

62
4.5 Conclusion and Recommendations 425
In this study, we attempted for the first time to look at how newly developed and existing grain 426
sorghum varieties in Mali respond to environments as well as relationships between characters 427
and grain yield under different environments. Grinkan (photoperiod sensitive guinea-caudatum 428
composite) and IRAT 204 (day-neutral caudatum) were found to have high minimum yields and 429
good responsiveness to environments. The majority of the high potential environments were 430
found at Cinzana (the high latitude location) where rainfall the lowest rainfall amounts was 431
received. Strong positive correlations were found between four characters (SBM, PWT, GPP, 432
and TRS) and GRY, suggesting that direct selection for each could improve yield, but path 433
analysis showed selecting for GPP would not improve grain yield only, but the other three 434
characters as well. 435
The number of cultivars used in this study is so limited for generalization, but the findings will 436
serve as an important input for the exploiting genotypic options for adaptation to climate change 437
for the studied target environments and its analogues. The effects of weather elements, especially 438
rainfall, temperature, solar radiation, vapor pressure deficit and evapotranspiration, as it interacts 439
with different phenological phases of the crop were not covered in this study but are very 440
important for proper attribution of causes. 441
4.6 Acknowledgements 442
The authors are indebted to Messrs Mohammed Lamine Tekete, Mahamady Kane, Sekouba 443
Sanogo, Alhassan Nientao, Sori, as well as Mrs. Saphiatu Sangare, all of IER-Sotuba, for their 444
dedicated services both in the field and laboratory. This study was performed within the frame of 445
the RISOCAS project addressing adaptation of African agriculture to climate change. Financial 446
support was by the German Ministry for collaboration and development through GIZ/BMZ 447
(Project No.: 07.7860.5-001.00) and is gratefully acknowledged. 448
449

Dissertation
63
Appendix 450
Table A.1 - Description of the varieties used in the study 451
Name Improved/Landrace Botanical
type Adaptation Maturity type Height
Boiguel Malian landrace Durra Sahelian zone early (100 days) tall
Lakahieri Malian landrace Durra Sahelian Zone Medium (110
days) tall
CSM 63E Improved Malian
landrace Guinea Sahelian zone early (90 days) tall
CSM 388 Malian Landrace Guinea Sudano-Sahelian
zone
intermediate
(120 days) tall
Grinkan Improved variety Composite Not yet
determined
intermediate
(110 days) dwarf
IRAT 204 Improved variety Caudatum supplied by
CIRAD early (90 days) dwarf
452
64
4.7 References 453
Abdulai A.L., Parzies H., Kouressy M., Vaksmann M., Asch F., Brueck H., 2012. Yield Stability 454
of photoperiod-sensitive sorghum [Sorghum bicolor L. (Moench)] accessions under 455
diverse climatic environments. International Journal of Agricultural Research 7, 17-32. 456
Can, N.D., Yoshida, T., 1999. Genotypic and phenotypic variances and co-variances in early 457
maturing grain sorghum in a double cropping. Pl. Prod. Sci. 2, 67–70. 458
Cornelius, P.L.; Crossa, J.; Seyedsadr, M.S., 1996. Statistical tests and estimators of 459
multiplicative models for genotype-by-environment interaction. pp. 199–234. In: Kang, 460
M.S.; Gauch, H.G., eds. Genotype-by-environment interaction. CRC Press, Boca Raton, 461
FL, USA. 462
Cornelius, P.L.; Seyedsadr, M.; Crossa, J., 1992. Using the shifted multiplicative model to search 463
for “separability” in crop cultivar trials. Theor. Appl. Genet. 84, 161–172. 464
Craufurd, P.Q., Peacock, J.M., 1993. Effect of heat and drought stress on sorghum (Sorghum 465
bicolor). II. Grain yield. Exp. Agric. 29, 77-86. 466
Dewey, D.R., Lu, K.H., 1959. A correlation and path coefficient analysis of components of 467
crested wheatgrass seed production. Agron. J. 51, 515-518. 468
El Naim, A.M., Ibrahim, I.M., Abdel Rahman M.E., Ibrahim, A.E., 2012. Evaluation of some 469
local sorghum (Sorghum bicolor L.Moench) genotypes in rain-fed. International Journal 470
of Plant Research 2, 15-20. 471
Fadlalla, H.A., A.H. Abdalla, 1994. Selection indices and genetic advance in bread wheat 472
(Triticum Aestivum L.). U.K. J. of Agric. Sci. 2, 46-54 473
FAO, 2006. FAOstatistics division. Available from 474
http://www.Faostat.fao.org/site/408/DestopDefauIt.aspx?pageID:408. [Accessed 29 August 475
2006]. 476
Gauch, H.G., Zobel, R.W., 1988. Predictive and postdictive success of statistical analysis of 477
yield trial. Theor. Appl. Genet 76, 1-10. 478
Grafius, J.E., 1959. Heterosis in barley. Agron. J. 51, 551-554. 479
Haussmann, B.I.G., Obilana, A.B., Ayiecho, P.O., Blum, A., Schipprack, W., Geiger, H.H., 480
1999. Quantitative genetic parameters of sorghum [Sorghum bicolor (L.) Moench] grown 481
in semi-arid areas of Kenya. Euphytica, 105,109-118. 482

Dissertation
65
Haussmann, B. I. G., Rattunde, F.H., Rattunde, E.W., Traore, P.S.C., vom Brocke, K., Parzies, 483
H.K., 2012. Breeding strategies for adaptation of pearl millet and sorghum to climate 484
variability and change in West Africa. J Agro Crop Sci. 198, 327-339. 485
Heinrich, G.M., Francis, C.A., Eastin, J.D., 1983. Stability of grain sorghum yield components 486
across diverse environments. Crop Sci. 23, 209-212. 487
House, L.R., 1985. A guide to sorghum breeding, 2nd
ed. Patancheru, India: International Crops 488
Research Institute for the Semi-Arid Tropics. 489
IPCC, 2007. Climate change: Impacts, adaptation, and vulnerability. Contribution of working 490
group II to the fourth assessment report of the IPCC. ISBN 978 0521 88010-7. Available 491
at: www.ipcc-wg2.org. 492
Khan, M.D., Khalil, I.H Khan, M.A. Ikramullah, 2004. Genetic divergence and association for 493
yield and related traits in mash bean. Sarhad J. Agric. 20, 555-61. 494
Kouressy, M., Dingkuhn, M., Vaksmann, M., Clément-Vidal, A., Chantereau J., 2008. Potential 495
contribution of dwarf and leaf longevity traits to yield improvement in photoperiod 496
sensitive sorghum. Eur. J. Agron. 28, 195-209. 497
Piepho, H.P. 1995. Robustness of statistical test for multiplicative terms in the additive main 498
effects and multiplicative interaction model for cultivar trial. Theoretical and Applied 499
Genetics 90, 438–443. 500
Power, J.F., Willis, W.O., Grunes, D.L., Reichman, G.A., 1967. Effect of soil temperature, 501
phosphorus and plant age on growth analysis of barley. Agron. J. 59, 231-234. 502
Saeed, M., Francis, C.A., 1983. Yield stability in relation to maturity in grain sorghum. Crop Sci. 503
23, 683-687 504
Singh, K. B., Bejiga, G., Malhorta, R. S., 1990. Associations of some characters with grain yield 505
in chickpea collection. Euphytica, 49, 83-88. 506
Soltani, A., Rezai, A.M., Pour, R.K., 2001. Genetic variability of some physiological and 507
agronomic traits in grain sorghum (Sorghum bicolor L. Moench). J. Sci. Tech. Agric. Nat. 508
Resources, 5, 127–37 509
Toker, C., Cigirgan, M.I., 2004. The use of phenotypic correlation and factor analysis in 510
determining characters for grain yield selection in chickpea (Cicer arietinum L.). 511
Heriditas, 140, 226-228 512
Wright, S., 1921. Correlation and causation. Journal of Agricultural Research, 20, 557-587. 513

66
5. Discussion
5.1 Environments and performance of the genotypes
The thrust of the study was to expose the grain sorghum genotypes to different environments
created by staggering sowing dates at the three locations along a latitude gradient. The first level
of variable conditions was found in the different annual mean rainfall figures for the different
sites (Figure 5.1).
Figure 5.5: Map of Mali depicting the trial sites and isohyets
The sites have a hot, tropical climate with a mean, annual, maximal (minimal) daily temperature
of 36.0°C (21.7°C) at Cinzana, 34.4°C (21.9°C) at Sotuba, and 33.7°C (21.0°C) at Farako
(Kouressy et al., 2008). The second level of variation of the climate scenarios used for this study
resides in different amounts of rainfall received by the different year-location-sowing date
combinations (Figure 5.2). There were also marked differences in the fertility levels of the sites,
especially the amounts of nitrogen and phosphorus.
BAMAKO
TESSALIT
KIDAL
TOMBOUCTOU
GAO
MENAKA
HOMBORINARA
MOPTIKAYES
SEGOU
SANKITA
KOUTIALA
BOUGOUNI SIKASSO
600 mm
800 mm
1000 mm1200 mm
400 mm
Cinzana
Sotuba
Farako

Dissertation
67
Figure 5.6: 10-day averages for rainfall and temperature for the growing seasons of 2008 and 2009 at Farako, Sotuba, and
Cinzana in Mali. Arrows indicate decads when sowing was done. First = first sowing; second = second sowing; third =
third sowing. Figures after first, second, and third indicate the total amount of rainfall received for the sowing dates.
5.2 Grain yield, yield stability, and trait relations
Based on genotypic means for grain yield, number of grains per panicle, and harvest index, the
Caudatum, and Caudatum-related genotypes proved to be superior genotypes from the other
races. Grinkan is a composite of the Caudatum and Guinea races and possess both stay-green and
photoperiod sensitivity traits that it drives from its relationship with the Caudatum and Guinea
races respectively. Mann et al. (1983) described the Caudatum race as high yielding and used it
as a source of germplasm for their sorghum breeding programs. In this study, it was found that
the genotype that combined photoperiod sensitivity and stay-green produced stably higher yield
than the other genotypes. This result concurs with the findings of Kouressy et al. (2008) that
Tmax (°C) Tmin (°C) Rainfall
Farako 2008
Tem
per
atu
re (
°C)
10
15
20
25
30
35
40
45
50First 792 mm
Second 703 mm
Third 442 mm
Farako 2009
Rain
fall
(m
m)
0
20
40
60
80
100
120
140
160
180
200First 1065 mm
Second 930 mm
Third 682 mm
Sotuba 2009
Rain
fall
(m
m)
0
20
40
60
80
100
120
140
160
180
200First 793 mm
Second 666 mm
Third 420 mm
Sotuba 2008
Tem
per
atu
re (
°C)
10
15
20
25
30
35
40
45
50First 765 mm
Second 516 mm
Third 313 mm
Cinzana 2008
Decads
6 8 10 12 14 16 18 20 22 24 26 28 30 32 34 36
Tem
per
atu
re (
°C)
10
15
20
25
30
35
40
45
50First 429 mm
Second 268 mm
Third 39 mm
Cinzana 2009
Decads
6 8 10 12 14 16 18 20 22 24 26 28 30 32 34 36
Rain
fall
(m
m)
0
20
40
60
80
100
120
140
160
180
200First 437 mm
Second 342 mm
Third 103 mm

68
genetic dwarfing of tall-traditional cultivars can increase grain yield potential as a result of the
reduced competition for assimilates exerted by an otherwise overwhelming sink activity of the
elongating internodes. Grinkan was followed closely by IRAT 204, the only wholly-Caudatum
genotype in the study. In fact, only one of the six Guinean genotypes used in the study was
among the top five yielders. Stay-green characteristics have been found to benefit grain yield
(Borrell et al., 2000), straw quality for fodder (Zerbini and Thomas, 2003), and drought tolerance
(Borrell et al., 2000).
Exploitation of genetic variability based on phenotypic expression is an important screening and
breeding strategy. Phenotypic differences are largely dictated by the environment, and this
variability is complicated because no two environments are exactly the same, and genotypes do
not react in the same way to changes in the environment (Mutava et al., 2011). Mean yield across
environments ceases to be an adequate indicator of genotypic performance in the presence of
genotype by environment interaction, and the differential genotypic responses across at different
environments complicate breeding, testing, and selection of superior genotypes (Mutava et al.,
2011).
Figure 5.7: Plots of the regression lines for mean grain yields of cultivars on environment mean grain yields (a) and its
relationship to cultivar adaptation (regression coefficients) (b) according to Finlay and Wilkinson (1963) (Abdulai et al.,
2012).
It is, therefore, important to identify genotypes that are adapted or are stable across
environments. In this study, the Caudatum genotypes (Grinkan and IRAT 204) showed higher
yield potential than the other genotypes across environments (Figure 5.3). These two cultivars
are therefore recommended for use in tactical adaptation to climate change. Grinkan can be used
Environmental mean grain yield (g m-2)
0 50 100 150 200 250 300Gen
oty
pe
mea
n g
rain
yie
ld (
g m
-2)
0
100
200
300
400 97S
BOI
CS3
CS6
GRI
IRA
LAK
LAT
DAN
WAS
E Mean
Grain yield (g m-2)
60 80 100 120 140 160 180 200 220
Reg
ress
ion
coef
fici
ent
(RC
)
0.6
0.8
1.0
1.2
1.4
1.6
GRI
IRA
97S
DAN
LAK
BOI
CS3
LAT
CS6
WAS
Dissertation
69
at all the sites, but IRAT 204 to should be deployed at sites analogous to the northern most site
because of its earliness and the short length of growing season at such sites.
Grain yield was positively correlated with panicle weight (r=0.816), number of grains per panicle
(r=0.899) and harvest index (r=0.339). The strong correlation observed between grain yield and
number of grains per panicle in this study concurs with observations made by Bidinger and Raju
(2000) in pearl millet (Pennisetum glaucum (L.) R. Br.) and Craufurd and Peacock (1993) in
sorghum. Harvest index, the ratio of grain yield to total aboveground plant biomass, is an
indication of a plant's efficiency in converting biological yield into economic yield (Kusalkar et
al., 2003), and can be been used as a criterion in selection for high yielding genotypes. The
negative correlation, between harvest index and plant height, found in this study concurs with
observations made by Can and Yoshida (1999) and Tariq et al. (2007) on sorghum. The
significant positive correlation observed between crop duration and plant height in this study is
not surprising for tropical germplasm (such as those used in the present study) because this could
have resulted from the reported linkage between one of the height loci (Dw2) and the major
photoperiod sensitivity locus, Ma1 (Lin et al., 1995). Number of grains per panicle was found to
be the most important trait to target for rapid direct improvement in grain yield because it could
be improved simultaneously with panicle weight, threshing ability, and harvest index, due to the
magnitude of its indirect contribution to grain yield via these traits. This concurs with
Veerabadbiran et al. (1994) who earlier reported that grains per panicle had the highest positive
effect on grain yield. Similar results were obtained by Mahajan et al. (2011) who found that
grains per panicle and panicle length had direct positive effects on grain yield. The path analysis
showed that grains per panicle mediated, to a larger extent, relationships between grain yield and
the other traits, as indicated by its strong indirect effects on grain yield via the other traits.
Breeding efforts that target the study environments and /or its analogues should be skewed
towards selecting for high grains per panicle. Molecular techniques targeted at grains per panicle
could be deployed for rapid results.
5.3 Photo-thermal and latitudinal effects on phenology
Matching the phenology of cultivars to environments in order to evade devastating abiotic and
biotic conditions is important for adapting varieties to environments. That is very important
under changed climates because an increase in temperature is most likely to modify the duration
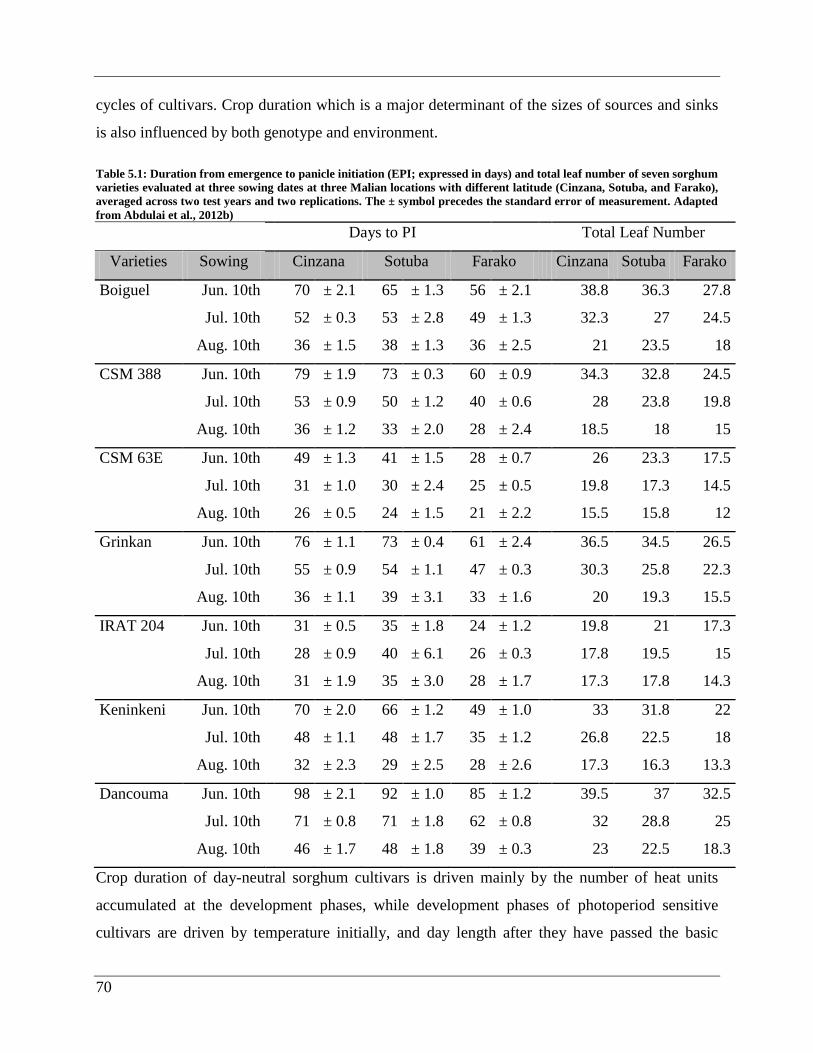
70
cycles of cultivars. Crop duration which is a major determinant of the sizes of sources and sinks
is also influenced by both genotype and environment.
Table 5.1: Duration from emergence to panicle initiation (EPI; expressed in days) and total leaf number of seven sorghum
varieties evaluated at three sowing dates at three Malian locations with different latitude (Cinzana, Sotuba, and Farako),
averaged across two test years and two replications. The ± symbol precedes the standard error of measurement. Adapted
from Abdulai et al., 2012b)
Days to PI
Total Leaf Number
Varieties Sowing
Cinzana Sotuba Farako Cinzana Sotuba Farako
Boiguel Jun. 10th
70 ± 2.1 65 ± 1.3 56 ± 2.1
38.8 36.3 27.8
Jul. 10th
52 ± 0.3 53 ± 2.8 49 ± 1.3
32.3 27 24.5
Aug. 10th
36 ± 1.5 38 ± 1.3 36 ± 2.5
21 23.5 18
CSM 388 Jun. 10th
79 ± 1.9 73 ± 0.3 60 ± 0.9 34.3 32.8 24.5
Jul. 10th
53 ± 0.9 50 ± 1.2 40 ± 0.6
28 23.8 19.8
Aug. 10th
36 ± 1.2 33 ± 2.0 28 ± 2.4 18.5 18 15
CSM 63E Jun. 10th
49 ± 1.3 41 ± 1.5 28 ± 0.7
26 23.3 17.5
Jul. 10th
31 ± 1.0 30 ± 2.4 25 ± 0.5
19.8 17.3 14.5
Aug. 10th
26 ± 0.5 24 ± 1.5 21 ± 2.2
15.5 15.8 12
Grinkan Jun. 10th
76 ± 1.1 73 ± 0.4 61 ± 2.4
36.5 34.5 26.5
Jul. 10th
55 ± 0.9 54 ± 1.1 47 ± 0.3
30.3 25.8 22.3
Aug. 10th
36 ± 1.1 39 ± 3.1 33 ± 1.6
20 19.3 15.5
IRAT 204 Jun. 10th
31 ± 0.5 35 ± 1.8 24 ± 1.2
19.8 21 17.3
Jul. 10th
28 ± 0.9 40 ± 6.1 26 ± 0.3
17.8 19.5 15
Aug. 10th
31 ± 1.9 35 ± 3.0 28 ± 1.7
17.3 17.8 14.3
Keninkeni Jun. 10th
70 ± 2.0 66 ± 1.2 49 ± 1.0
33 31.8 22
Jul. 10th
48 ± 1.1 48 ± 1.7 35 ± 1.2
26.8 22.5 18
Aug. 10th
32 ± 2.3 29 ± 2.5 28 ± 2.6
17.3 16.3 13.3
Dancouma Jun. 10th
98 ± 2.1 92 ± 1.0 85 ± 1.2
39.5 37 32.5
Jul. 10th
71 ± 0.8 71 ± 1.8 62 ± 0.8
32 28.8 25
Aug. 10th
46 ± 1.7 48 ± 1.8 39 ± 0.3
23 22.5 18.3
Crop duration of day-neutral sorghum cultivars is driven mainly by the number of heat units
accumulated at the development phases, while development phases of photoperiod sensitive
cultivars are driven by temperature initially, and day length after they have passed the basic

Dissertation
71
vegetative phase (BVP) and started responding to day length for development. This makes the
simulation of the time to flowering for photoperiod-sensitive sorghum cultivars complex.
The thrust of this study was, first of all, to determine if and how latitude affects the development
of existing sorghum cultivars, and secondly, the precision with which available crop models
predict the phenology of photoperiod sensitive sorghum if they are sown at different latitudes.
From this study, it was found that the duration of the vegetative phase, and for that matter crop
duration as well as the number of leaves, increased with latitude. For example, the highest
difference in day-length between the locations was less than 8 minutes, but for the same sowing
date, a difference in crop duration of up to 21 days was recorded for some cultivars at different
latitudes (Table 5.1).
It was also revealed in this study that for some varieties, sensitivity to day length is a function of
location and / or latitude because some cultivars which behaved as day-neutral at one location
became photoperiod sensitive at another (Figure 5.4), buttressing the complexity of the
photoperiod sensitivity trait. The complexity of photoperiodic responses in sorghum has been
acknowledged by a number of researchers (Clerget et al., 2004; Dingkuhn et al., 2008). One
other major finding from this study was that existing models underestimate the effect of latitude
on the phenology of sorghum, especially the photoperiod sensitive.
Latitude
11.0 11.5 12.0 12.5 13.0 13.5
Kp
0.0
0.2
0.4
0.6
0.8
1.0
IRAT 204
CSM 63E
Keninkeni
Boiguel
Grinkan
CSM 388
Dancouma
Farako Sotuba Cinzana
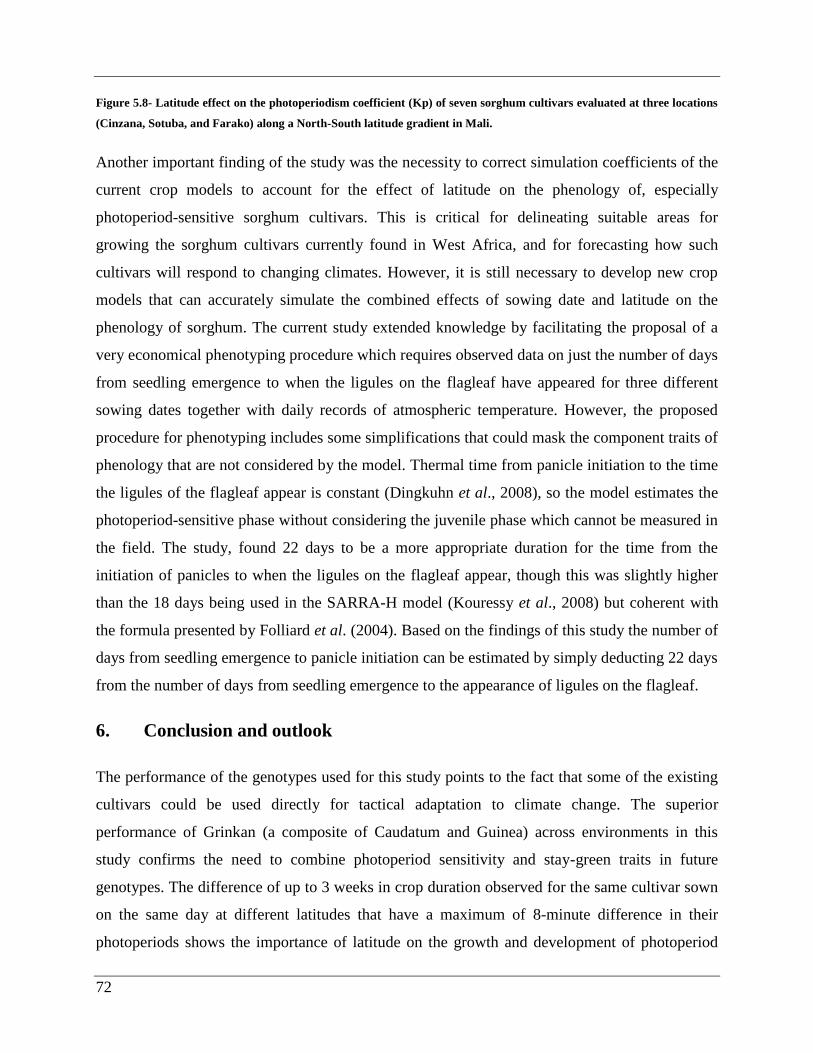
72
Figure 5.8- Latitude effect on the photoperiodism coefficient (Kp) of seven sorghum cultivars evaluated at three locations
(Cinzana, Sotuba, and Farako) along a North-South latitude gradient in Mali.
Another important finding of the study was the necessity to correct simulation coefficients of the
current crop models to account for the effect of latitude on the phenology of, especially
photoperiod-sensitive sorghum cultivars. This is critical for delineating suitable areas for
growing the sorghum cultivars currently found in West Africa, and for forecasting how such
cultivars will respond to changing climates. However, it is still necessary to develop new crop
models that can accurately simulate the combined effects of sowing date and latitude on the
phenology of sorghum. The current study extended knowledge by facilitating the proposal of a
very economical phenotyping procedure which requires observed data on just the number of days
from seedling emergence to when the ligules on the flagleaf have appeared for three different
sowing dates together with daily records of atmospheric temperature. However, the proposed
procedure for phenotyping includes some simplifications that could mask the component traits of
phenology that are not considered by the model. Thermal time from panicle initiation to the time
the ligules of the flagleaf appear is constant (Dingkuhn et al., 2008), so the model estimates the
photoperiod-sensitive phase without considering the juvenile phase which cannot be measured in
the field. The study, found 22 days to be a more appropriate duration for the time from the
initiation of panicles to when the ligules on the flagleaf appear, though this was slightly higher
than the 18 days being used in the SARRA-H model (Kouressy et al., 2008) but coherent with
the formula presented by Folliard et al. (2004). Based on the findings of this study the number of
days from seedling emergence to panicle initiation can be estimated by simply deducting 22 days
from the number of days from seedling emergence to the appearance of ligules on the flagleaf.
6. Conclusion and outlook
The performance of the genotypes used for this study points to the fact that some of the existing
cultivars could be used directly for tactical adaptation to climate change. The superior
performance of Grinkan (a composite of Caudatum and Guinea) across environments in this
study confirms the need to combine photoperiod sensitivity and stay-green traits in future
genotypes. The difference of up to 3 weeks in crop duration observed for the same cultivar sown
on the same day at different latitudes that have a maximum of 8-minute difference in their
photoperiods shows the importance of latitude on the growth and development of photoperiod

Dissertation
73
sensitive sorghum cultivars. The current crop model equipped with the "impatience" sub-model
for handling photo-thermal the response of the phenology of photoperiod sensitive cultivars does
not accurately simulate the effect of latitude when simulating for one location with parameters
derived from data collected at another location. It is possible to improve the performance of the
"impatience" model if latitude is considered in the adjustment of coefficients of one location to
simulate phenology of photoperiod sensitive sorghum cultivars at another location. The results
obtained in the study could explain why many of the studies on photoperiodism on trials with
various latitudes or with artificial light have not been successful. It is possible to identify niches
for different cultivars by integrating photoperiod sensitivity into a crop model and using a
Geographic Information System (GIS).
Little is known about how accurately the latitude correction used in this study will work if
extrapolated beyond the range of latitude explored by our experiments. It will be first necessary
to decipher the physiological basis for the strong effect of latitude observed and also test a larger
number of cultivars at a wider range of latitude to confirm and /or improve on the findings of this
study.
7 References
Bidinger, F.R., Raju, D.S., 2000. Mechanisms of adjustment by different pearl millet plant types
to varying plant populations. J. Agric. Sci. 134, 181-189.
Borrell, A.K., Hammer, G.L., Henzell, R.G., 2000. Nitrogen dynamics and the physiological
basis of stay-green in sorghum. Crop Sci. 40, 1295-1307.
Can, N.D., Yoshida, T., 1999. Genotypic and phenotypic variances and covariances in early
maturing grain sorghum in a double cropping. Plant Prod. Sci. 2, 67-70.
Clerget, B., Dingkuhn, M., Chantereau, J., Hemberger, J., Louarn, G., Vaksmann, M., 2004.
Does panicle initiation in tropical sorghum depend on day-to-day change in photoperiod?
Field Crops Res. 88, 11-27.
Craufurd, P.Q., Peacock, J.M., 1993. Effect of heat and drought stress on sorghum (Sorghum
bicolor). II. Grain yield. Exp. Agric. 29, 77-86.
Dingkuhn, M., Kouressy, M., Vaksmann, M., Clerget, B., Chantereau, J., 2008. A model of
sorghum photoperiodism using the concept of threshold-lowering during prolonged
appetence. Euro. J. Agron. 28, 171-177.
74
Folliard, A., Traore, P.C.S., Vaksmann, M., Kouressy, M., 2004. Modeling of sorghum response
to photoperiod: a threshold-hyperbolic approach. Field Crops Res. 89, 59-70.
Kouressy, M., Dingkuhn, M., Vaksmann M., Heinemann, A.B., 2008 Adaptation to diverse
semi-arid environ- ments of sorghum genotypes having different plant type and sensitivity
to photoperiod. Agric. For. Meteorol. 148, 357-371.
Kusalkar, D.V., Awari, V.R., Pawar, V.Y., Shinde, M.S., 2003. Physiological parameters in
relation to grain yield in rabi sorghum on medium soil. Adv. Plant Sci. 16, 119-122.
Lin, Y. R., Schertz, K. F., Paterson, A. H., 1995. Comparative analysis of QTLs affecting plant
height and maturity across the Poaceae, in reference to an interspecific sorghum
population. – Genetics 141, 391-411.
Mahajan, R.C., Wadikar, P.B., Pole, S.P., Shupe, M.V., 2011. Variability, Correlation and Path
analysis Studies in Sorghum. Res. J. Agric. Sci. 2, 101-103.
Mann, J.A., Kimber, C.T., Miller, F.R., 1983. The origin and early cultivation of sorghums in
Africa. Tex. Agric. Exp. Stn. Bull., 1454.
Mutava, R.N., Prasad, P.V.V. Tuinstra, M.R., Kofoid, K.D., Yu, J., 2011. Characterization of
sorghum genotypes for traits related to drought tolerance Field Crops Res. 123, 10-18.
Tariq, M., Shahid, I., Muhammad, I., 2007. Genetic variability and character association for
harvest index in sorghum under rainfed conditions. Int. J. Agric. Biol. 9, 470-472.
Veerabadhiran, P., Palamisamy, S., Sammy, G.A., 1994. Association analysis in grain sorghum.
Madras Agric. J. 81, 532-534.
Zerbini, E., Thomas, D., 2003. Opportunities for improvement of nutritive value in sorghum and
pearl millet residues in South Asia through genetic enhancement. Field Crops Res. 84, 3-
15.

Dissertation
75
Declaration of Originality
I hereby declare that this doctoral thesis is independently written by me. In addition, I confirm
that no other sources than those specified in the thesis have been used. I certify that this thesis,
either in the current or similar format, has not been submitted to any other institution in order to
obtain a Ph.D. or any other academic degree.
Ich erkläre hiermit, dass ich diese Dissertation selbständig angefertigt habe. Es wurden nur die
im Literaturverzeichnis aufgeführtn Hilfsmittel benutzt und fremdes Gedanengut als solches
kenntlich gemacht. Ich versichere, das ich diese Arbeit in gleicher oder ähnlicher Form noch
keiner anderen Institution zur Prüfung vorgelegt habe.
Stuttgart 10/12/2015 Alhassan Lansah Abdulai

76
Alhassan Lansah Abdulai
CSIR-SARI
P.O.Box TL 52, Tamale-N/R,
Ghana
Email: [email protected]
Mobile Phone:
(+233) (0) 509864053
Date of Birth
August 8, 1966
Since 02/2008
Since 04/2005
01/1991 - 03/2005
Work Experience
PhD student in the frame of RISOCAS project on "Developing Rice and
Sorghum Crop Adaptation Strategies to cope with Climate Change in
Vulnerable Environments in Africa"
Research Scientist (Agrometeorologist)
Research Assistant - Sorghum Breeding
03/2003 - 04/2005
09/1998 - 07/2001
09/1996 - 07/1998
02/1988 - 12/1990
Education
University of Bonn, Germany
Agricultural Science and Resource Management in the Tropics and Sub-
Tropics
Degree Awarded: Master of Science (MSc.)
Kwame Nkrumah University of Science and Technology,
Kumasi Ghana.
Degree Awarded: Bachelor of Science (BSc. Honours)
Kwame Nkrumah University of Science and Technology,
Kumasi Ghana.
Degree Awarded: Diploma in Horticulture
Nyankpala Agricultural College, Tamale, Ghana
General Certificate of Agriculture
Peer Reviewed Journal
Articles
Publications
1. Etwire, P.M., Atokple, I.D.K., Buah, S.S.J., Abdulai, A.L., Karikari,
A.S., Asungre, P., 2013. Analysis of the seed system in Ghana Int. J.
Adv. Agric. Res., 1:7-13.

Dissertation
77
Conference Oral
Presentations
2. Abdulai, A.L., Kouressy, M., Vaksmann, M., Asch, F., Giese, M.,
Brueck, H., 2012. Latitude and date of sowing influence phenology
of photoperiod-sensitive sorghums. J. of Agron. and Crop Sci. 198,
340-348.
3. Abdulai, A.L., Parzies, H., Kouressy, M., Vaksmann, M., Asch, F.,
Brueck, H., 2012. Yield Stability of Photoperiod-Sensitive Sorghum
[Sorghum bicolor L. (Moench)] Accessions under Diverse Climatic
Environments. Int. J. Agric. Res. 7, 17-32.
4. Owusu, R. K., Clottey, V. A., Abdulai, A.L., 2007. Blanching of hot
peppers employing the solarisation method in northern Ghana. Bots.
J. Agric. Appl. Sci. 3, 106-111.
1. Abdulai, A.L., Kouressy, M., Vaksmann, M., Tekete, M.L., Kane,
M., Asch, F., Giese, M., Brueck, H., 2011. Effect of phenological
variation on photoperiod-sensitive sorghum production in the Sahel.
Oral presentation at the International Conference on “Crop
improvement, Ideotyping, and Modelling for African Cropping
Systems under Climate Change (CIMAC)”. February 7-9, 2011.
University of Hohenheim, Stuttgart, Germany.
2. Abdulai, A.L., Brueck, H., Kouressy, M., Vaksmann, M., Asch, F.,
2011. Morphological traits for sorghum ideotype development to
cope with climate variability in Africa. Oral presentation at the
International Conference on “Crop improvement, Ideotyping, and
Modelling for African Cropping Systems under Climate Change
(CIMAC)”. February 7-9, 2011. University of Hohenheim, Stuttgart,
Germany.
3. Abdulai, A.L., Kouressy, M., Vaksmann, M., Asch, F., Giese, M.,
Brueck, H., 2011. Latitude effect on the development of photoperiod
sensitive sorghum. Oral presentation at the International Conference
on “Crop improvement, Ideotyping, and Modelling for African
Cropping Systems under Climate Change (CIMAC)”. February 7-9,
2011. University of Hohenheim, Stuttgart, Germany.
78
Conference Poster
Presentations
Dissertations
4. Abdulai, A.L., Brueck, H., Asch, F., Kouressy, M., Vaksmann, M.,
2010. Water-use Efficiency of Sorghum (Sorghum bicolor L.
Moench) Genotypes in Mali, West Africa, is Affected by Climate
Variability. Oral presentation at the 12th
annual Tropentag on “World
Food System: A Contribution from Europe”. September 14-16, 2010.
Zurich, Switzerland.
5. Abdulai, A.L., Kouressy, K., Vaksmann, M., Brueck, H., Asch, F.,
2009. Responses of Sorghum Varieties to Climatic Variability — a
Case Study Within the RISOCAS Project. Oral presentation at the
11th
annual Tropentag on “Biophysical and Socio-economic Frame
Conditions for the Sustainable Management of Natural Resources”.
October 6-8, 2009. Hamburg, Germany.
1. Abdulai, A.L., Kouressy, M., Vaksmann, M., Brueck, H., Asch, F.,
2010. Growth Analysis of Biomass Production for Diverse Sorghum
Genotypes under different scenarios of climate. Poster presented at
the 11th
European Society of Agronomy Conference. August 29 –
September 03, 2010. Montpellier, France.
2. Abdulai, A.L., Asch, F., van de Giesen, N., 2004. Physiological and
morphological responses of Sorghum bicolor Moench to static and
dynamic drought conditions. Poster presented at the 6th
annual
“Tropentag” for International Research on Food Security, Natural
Resource Management and Rural Development. October 5-7, 2004.
Berlin, Germany.
1. Abdulai, A.L., 2005. Morphological and physiological responses of
sorghum (Sorghum bicolor Moench.) to static and dynamic drought
in a green house. MSc. Thesis. University of Bonn, Germany March
2005.
2. Abdulai, A.L., 2001. Studies of the morphology and performance of
six (6) local hot pepper (Capsicum annuum L.) cultivars. Dissertation
for BSc. Agriculture, Kwame Nkrumah University of Science and
Technology, Kumasi-Ghana.
Dissertation
79
3. Abdulai, A.L., 1998. Use of Physic nut (Jatropha Curcas L.) seed
oil in the control of diamond-back moth (Plutella xylostella) and
cabbage worms (Hellula spp) of cabbage. Dissertation for Diploma
in Horticulture, Kwame Nkrumah University of Science and
Technology, Kumai-Ghana
Referees Folkard Asch (PhD)
Professor, Plant Production and Ecology in the Tropics and Subtropics
University of Hohenheim, Stuttgart, Germany
(+49)15110667864
Stephen K. Nutsugah (PhD)
Director, CSIR-SARI,
P. O. Box TL. 52, Tamale,
(+233)243265430
Abdulai Baba Salifu (PhD)
Former Director General, CSIR
P.O. Box M 32, Accra
(+233)244942384
Hohenheim, Stuttgart, December 10, 2015 Alhassan Lansah Abdulai