Embed Size (px)
Citation preview
Dissolving the Fermi Paradox Anders Sandberg, Eric Drexler & Toby Ord
Future of Humanity Institute University of Oxford

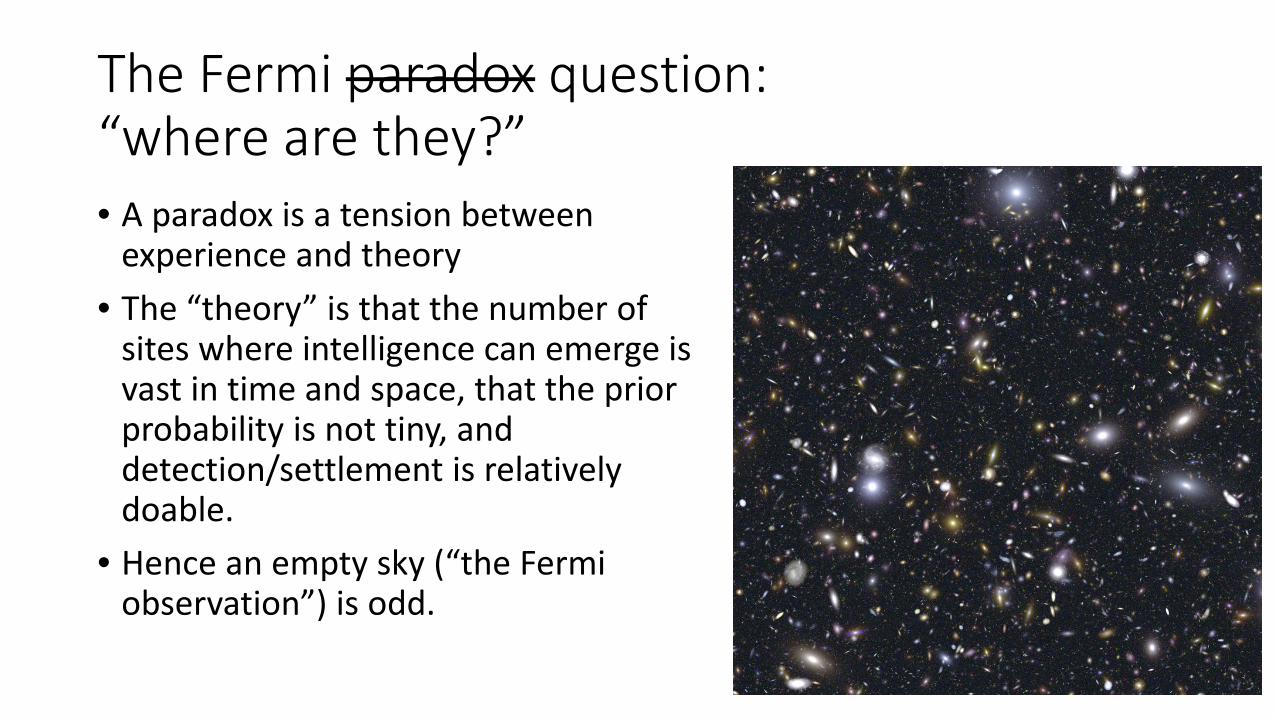
The Fermi paradox question: “where are they?” • A paradox is a tension between
experience and theory • The “theory” is that the number of
sites where intelligence can emerge is vast in time and space, that the prior probability is not tiny, and detection/settlement is relatively doable.
• Hence an empty sky (“the Fermi observation”) is odd.
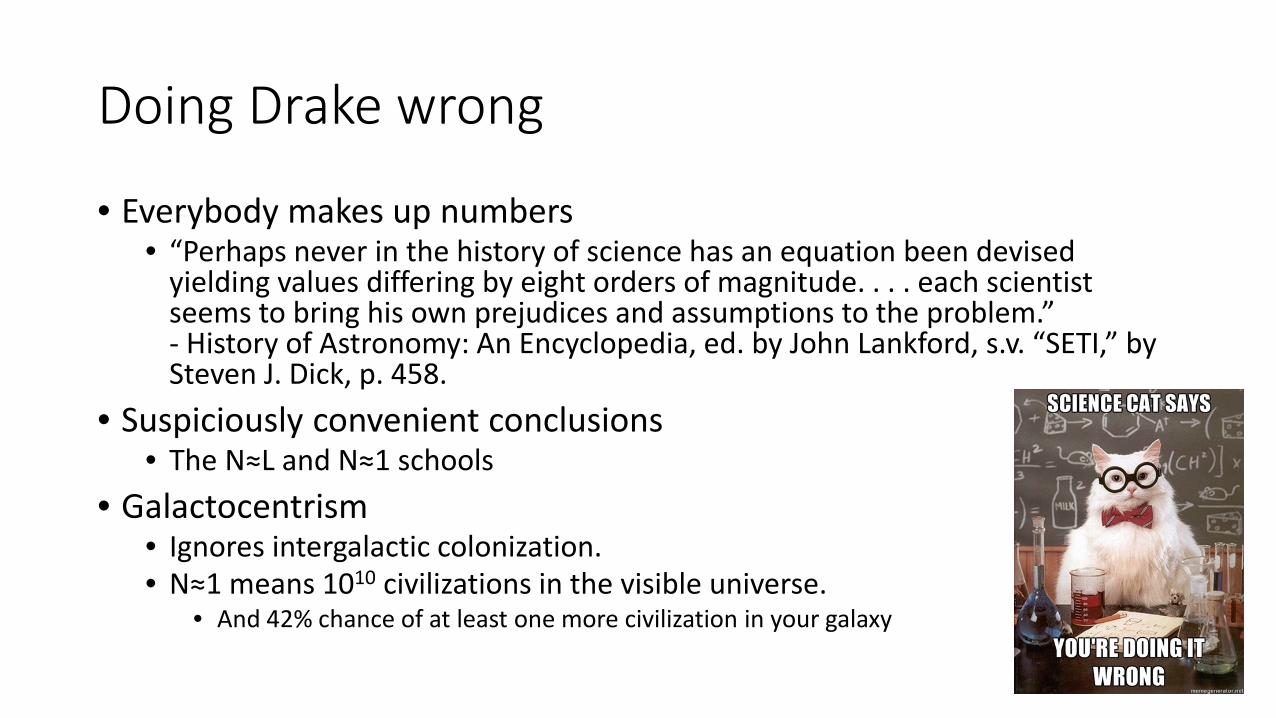
Doing Drake wrong
• Everybody makes up numbers • “Perhaps never in the history of science has an equation been devised
yielding values differing by eight orders of magnitude. . . . each scientist seems to bring his own prejudices and assumptions to the problem.” - History of Astronomy: An Encyclopedia, ed. by John Lankford, s.v. “SETI,” by Steven J. Dick, p. 458.
• Suspiciously convenient conclusions • The N≈L and N≈1 schools
• Galactocentrism • Ignores intergalactic colonization. • N≈1 means 1010 civilizations in the visible universe.
• And 42% chance of at least one more civilization in your galaxy
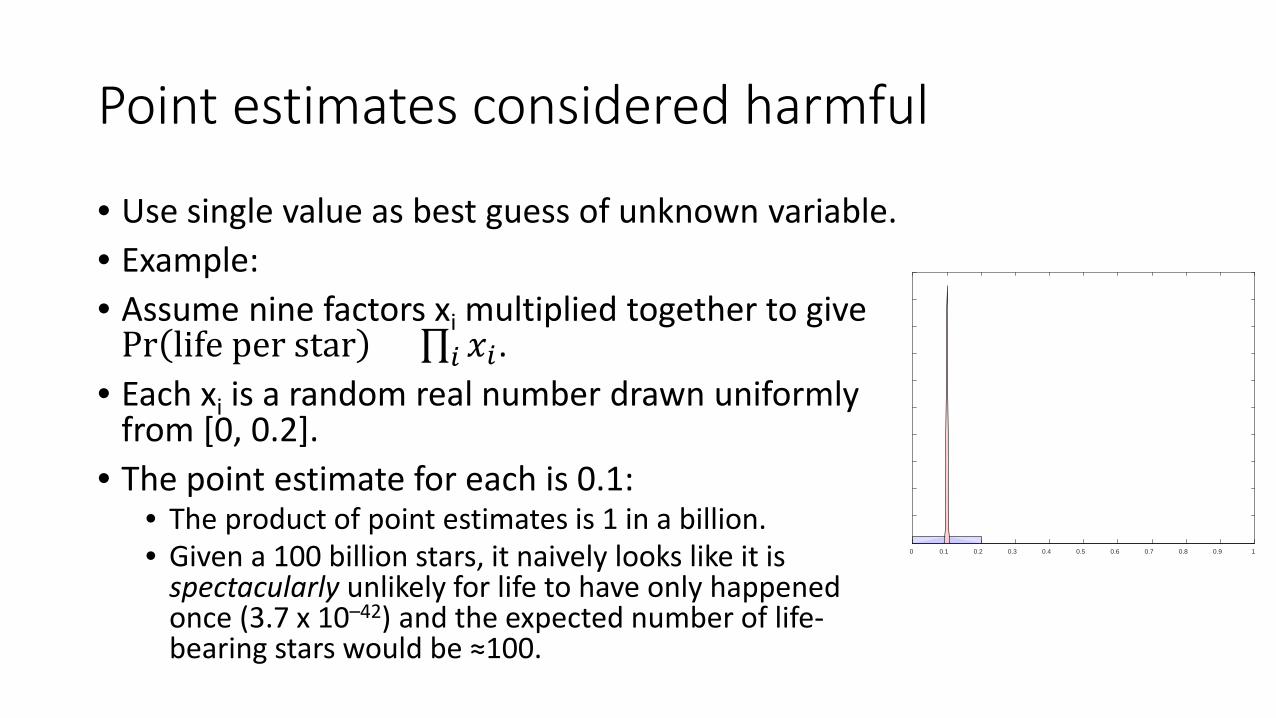
Point estimates considered harmful
• Use single value as best guess of unknown variable. • Example: • Assume nine factors xi multiplied together to give
Pr life per star = ∏ 𝑥𝑥𝑖𝑖𝑖𝑖 . • Each xi is a random real number drawn uniformly
from [0, 0.2]. • The point estimate for each is 0.1:
• The product of point estimates is 1 in a billion. • Given a 100 billion stars, it naively looks like it is
spectacularly unlikely for life to have only happened once (3.7 x 10–42) and the expected number of life-bearing stars would be ≈100.
0 0.1 0.2 0.3 0.4 0.5 0.6 0.7 0.8 0.9 1

Point estimates considered harmful
• However, actually combining the probabilities as distributions:
• The median number of life-bearing stars is just 8.7 (the mean is still 100).
• “Life only once” actually occurs 8% of the time
• Multiplying point estimates can be incorrect and misleading, and we need to convolve probability distributions instead.
• Implicit certainty in use of Drake equation produces problematic conclusions.
-8 -6 -4 -2 0 2 4 6 8
log10
(N)
0
0.01
0.02
0.03
0.04
0.05
0.06
Freq
uenc
y
0 0.1 0.2 0.3 0.4 0.5 0.6 0.7 0.8 0.9 1
Pr(N=1)
0
0.1
0.2
0.3
0.4
0.5
Freq
uenc
y

Distribution of claims: what is the view of researchers? • Literature resampling: review parameter estimates from the SETI
literature, produce a distribution by random resampling. • Some issues of copying estimates bringing down variance. • Bias in who makes estimates, of course.
• We should expect strong optimism bias!

Histogram of parameter values, on log scales. Note the existence of extreme outlier for 𝑓𝑓𝑙𝑙 due to (Behroozi & Peeples 2015).

-100 -90 -80 -70 -60 -50 -40 -30 -20 -10 0 10 20 30 40 50
log10
(N)
0
0.02
0.04
0.06
0.08
0.1
0.12
Freq
uenc
yProbability density from resampling
-100 -90 -80 -70 -60 -50 -40 -30 -20 -10 0 10 20 30 40 50
log10
(N)
0
0.1
0.2
0.3
0.4
0.5
0.6
0.7
0.8
0.9
1
Pr(
Ntru
e<N
)
-100 -90 -80 -70 -60 -50 -40 -30 -20 -10 0 10 20 30 40 50
log10
(N)
0
0.1
0.2
0.3
0.4
0.5
0.6
0.7
0.8
0.9
1
Pr(
Ntru
e<N
)
Alone in visible universe
Alone in the galaxy

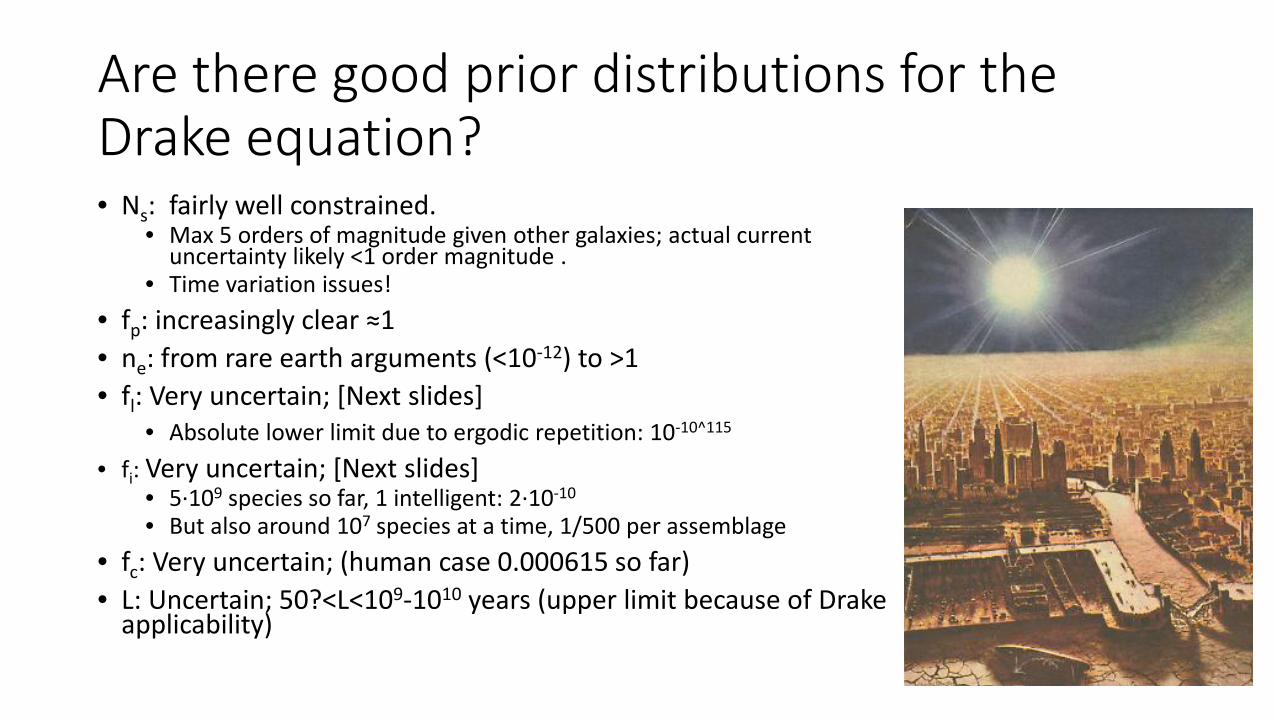
Are there good prior distributions for the Drake equation? • Ns: fairly well constrained.
• Max 5 orders of magnitude given other galaxies; actual current uncertainty likely <1 order magnitude .
• Time variation issues! • fp: increasingly clear ≈1 • ne: from rare earth arguments (<10-12) to >1 • fl: Very uncertain; [Next slides]
• Absolute lower limit due to ergodic repetition: 10-10^115 • fi: Very uncertain; [Next slides]
• 5·109 species so far, 1 intelligent: 2·10-10
• But also around 107 species at a time, 1/500 per assemblage • fc: Very uncertain; (human case 0.000615 so far) • L: Uncertain; 50?<L<109-1010 years (upper limit because of Drake
applicability)

Abiogenesis as a physical process
• Instead of thinking in terms of fraction of planets having life, consider a rate of life formation in suitable environments: what is the induced probability distribution?
• The emergence of a genetic system is a physical/chemical transition
• Transition events occur in some medium at some rate per unit volume: 𝑓𝑓𝐿𝐿 ≈ 𝜆𝜆𝜆𝜆𝜆𝜆
• High rates would imply that almost all suitable planets originate life • Low rates would imply that almost no suitable planets originate life
• The nature of transitions and suitable media are largely unknown.
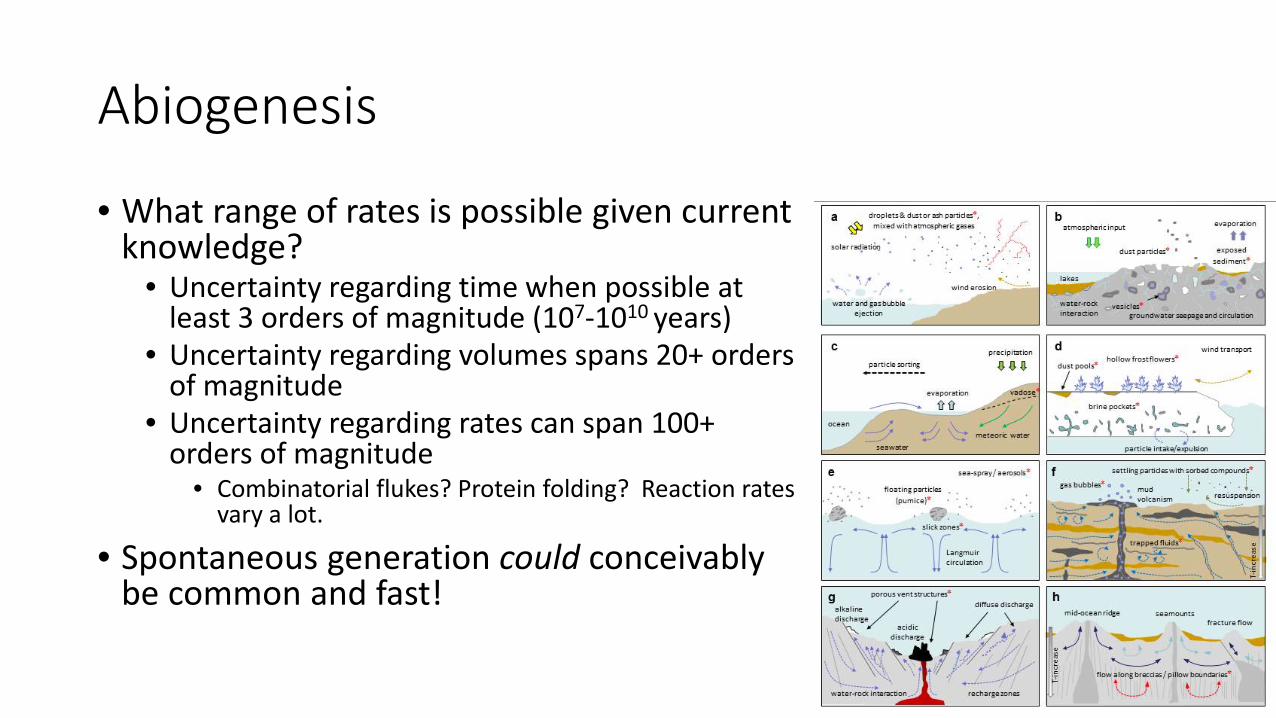
Abiogenesis
• What range of rates is possible given current knowledge?
• Uncertainty regarding time when possible at least 3 orders of magnitude (107-1010 years)
• Uncertainty regarding volumes spans 20+ orders of magnitude
• Uncertainty regarding rates can span 100+ orders of magnitude
• Combinatorial flukes? Protein folding? Reaction rates vary a lot.
• Spontaneous generation could conceivably be common and fast!

Genetic transitions: potential alternative forms of life • All life on Earth shares almost exactly the same genetic systems
• Only rare and minor changes have occurred in ≈1040 cell divisions • Nonetheless, other genetic systems preceded the modern form
• The transition to the modern form required major changes • It would be unsurprising if the rate were < 1 per 10100 cell divisions • Modern genetics required >1/5 the age of the universe to evolve
intelligence • A genetic system like the one that preceded ours might
• (1) Be stable across >10100 cell divisions • (2) Evolve more slowly by a factor of 10, and run out the clock
• If the rate of discovering it is 𝜆𝜆𝐵𝐵 and the rate of discovering “our” kind of capable life is 𝜆𝜆𝐴𝐴, then the fraction of A-life is 𝜆𝜆𝐴𝐴 𝜆𝜆𝐵𝐵⁄ .
• Rates can differ many orders of magnitude, producing a life-rich but evolution/intelligence-poor universe.
• Multiple step models add integer exponents to rates: multiply order of magnitude differences.
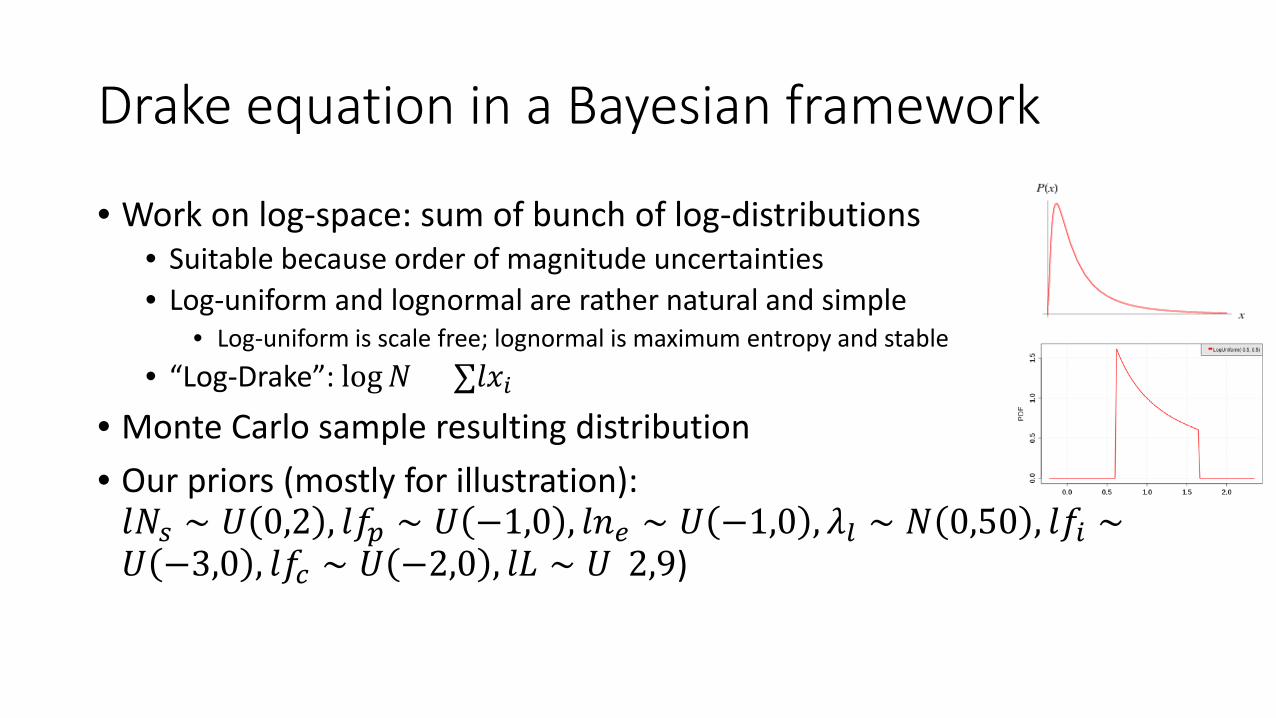
Drake equation in a Bayesian framework
• Work on log-space: sum of bunch of log-distributions • Suitable because order of magnitude uncertainties • Log-uniform and lognormal are rather natural and simple
• Log-uniform is scale free; lognormal is maximum entropy and stable • “Log-Drake”: log𝑁𝑁 = ∑𝑙𝑙𝑥𝑥𝑖𝑖
• Monte Carlo sample resulting distribution • Our priors (mostly for illustration): 𝑙𝑙𝑁𝑁𝑠𝑠 ∼ 𝑈𝑈 0,2 , 𝑙𝑙𝑓𝑓𝑝𝑝 ∼ 𝑈𝑈 −1,0 , 𝑙𝑙𝑙𝑙𝑒𝑒 ∼ 𝑈𝑈 −1,0 , 𝜆𝜆𝑙𝑙 ∼ 𝑁𝑁 0,50 , 𝑙𝑙𝑓𝑓𝑖𝑖 ∼𝑈𝑈 −3,0 , 𝑙𝑙𝑓𝑓𝑐𝑐 ∼ 𝑈𝑈 −2,0 , 𝑙𝑙𝑙𝑙 ∼ 𝑈𝑈(2,9)

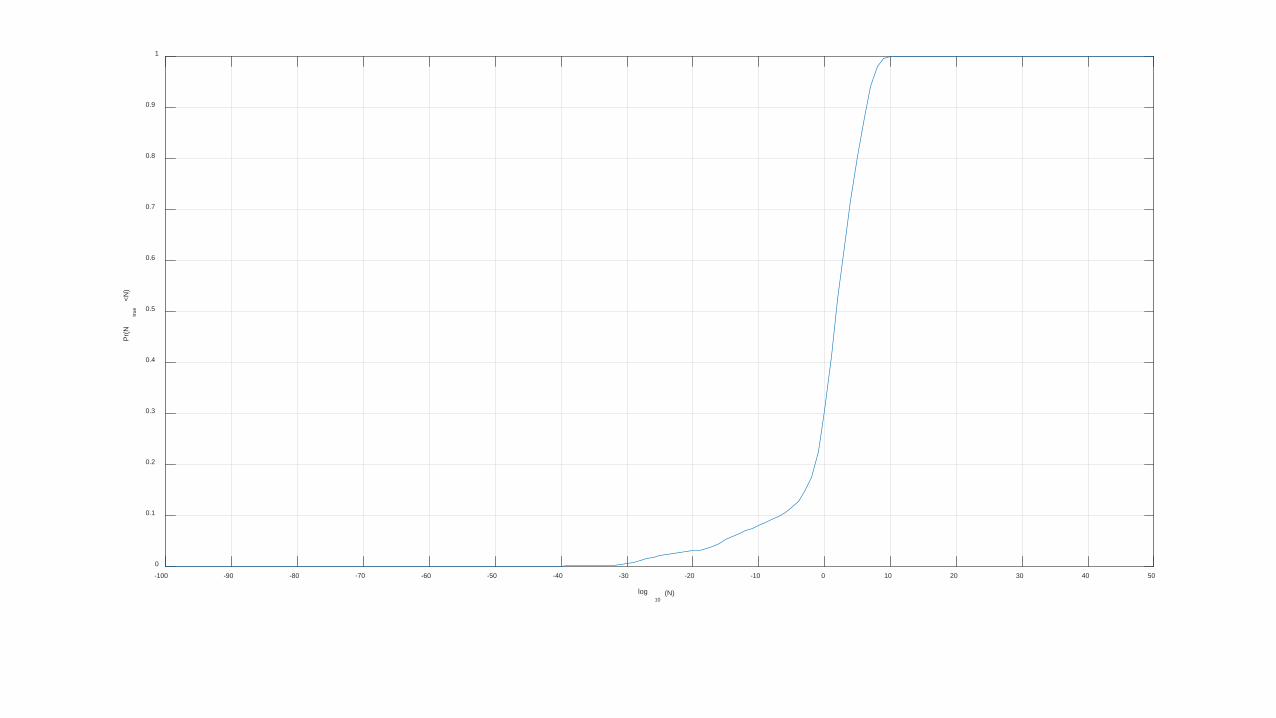
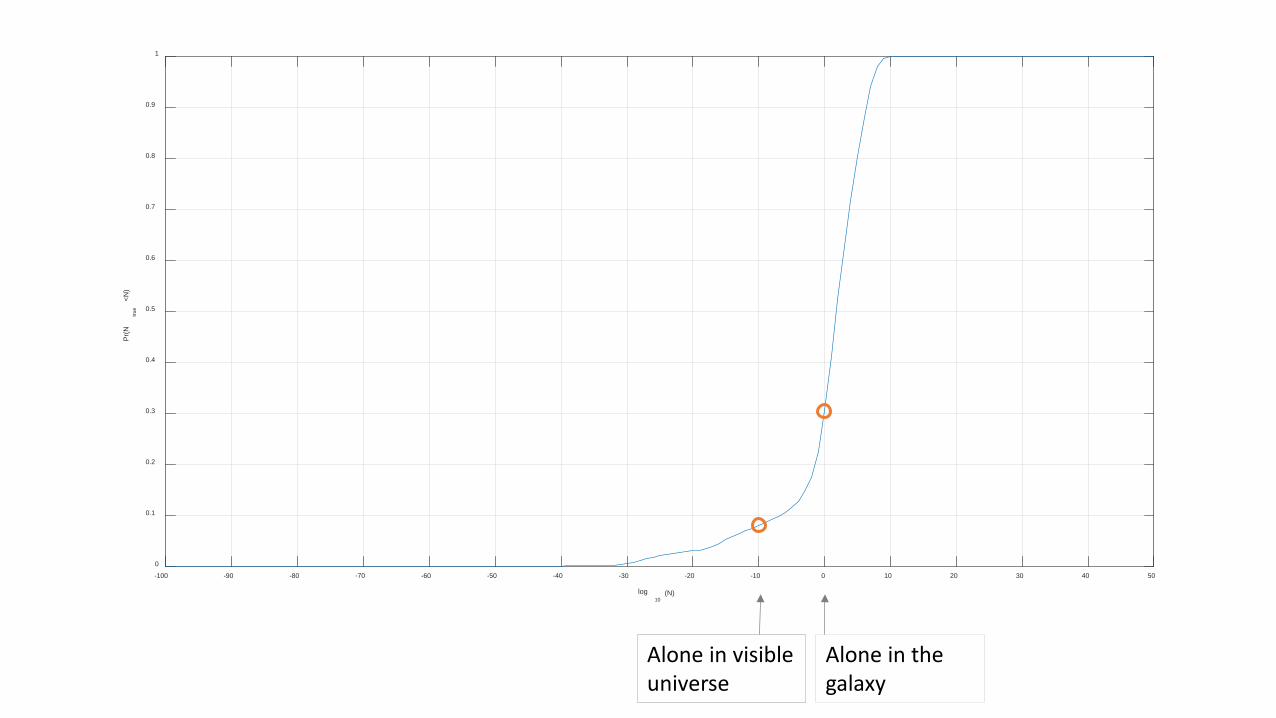
Monte Carlo results
-100 -90 -80 -70 -60 -50 -40 -30 -20 -10 0 10 20 30 40 50
log10
(N)
0
0.002
0.004
0.006
0.008
0.01
0.012
0.014
0.016
0.018
0.02
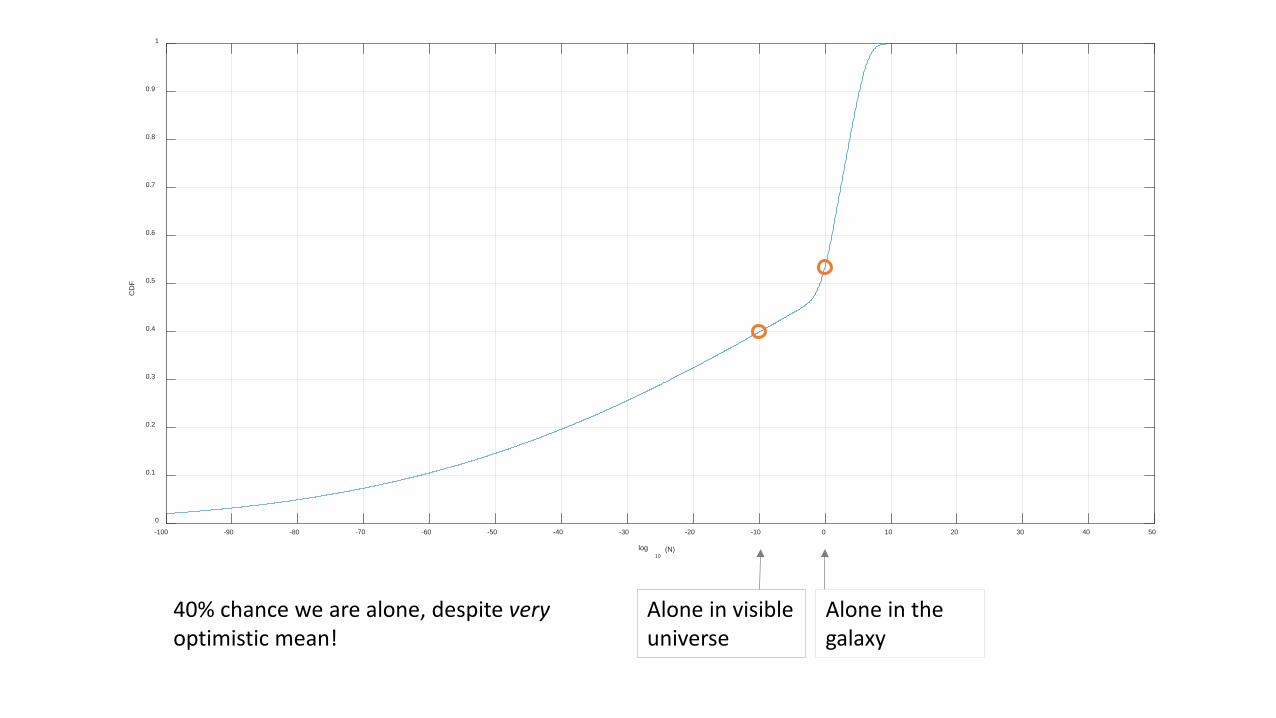
Mean N = 3.2e6 Median N = 0.18
-100 -90 -80 -70 -60 -50 -40 -30 -20 -10 0 10 20 30 40 50
log10
(N)
0
0.1
0.2
0.3
0.4
0.5
0.6
0.7
0.8
0.9
1
CD
F
Alone in visible universe
Alone in the galaxy
40% chance we are alone, despite very optimistic mean!

Conclusion 1: the Fermi paradox isn’t very paradoxical • Overconfident guesses makes it seem hard to get empty
universe • When our uncertainty is properly accounted for in the model,
we find a substantial a priori chance that there is no other intelligent life in our observable universe, and thus that there should be little or no surprise when this is what we see.
• Reasonable priors (or even the literature!) give enough uncertainty to make empty universe fairly likely
• In order to produce a non-empty universe but not an overabundant one parameters need to lie in a small interval (Carter)
• Also similar to Tegmark’s argument, but with more process
• Note that this conclusion does not mean we are alone! Just that we should not be surprised if this is the case.
• This is a statement about knowledge and priors, not a measurement: armchair astrobiology

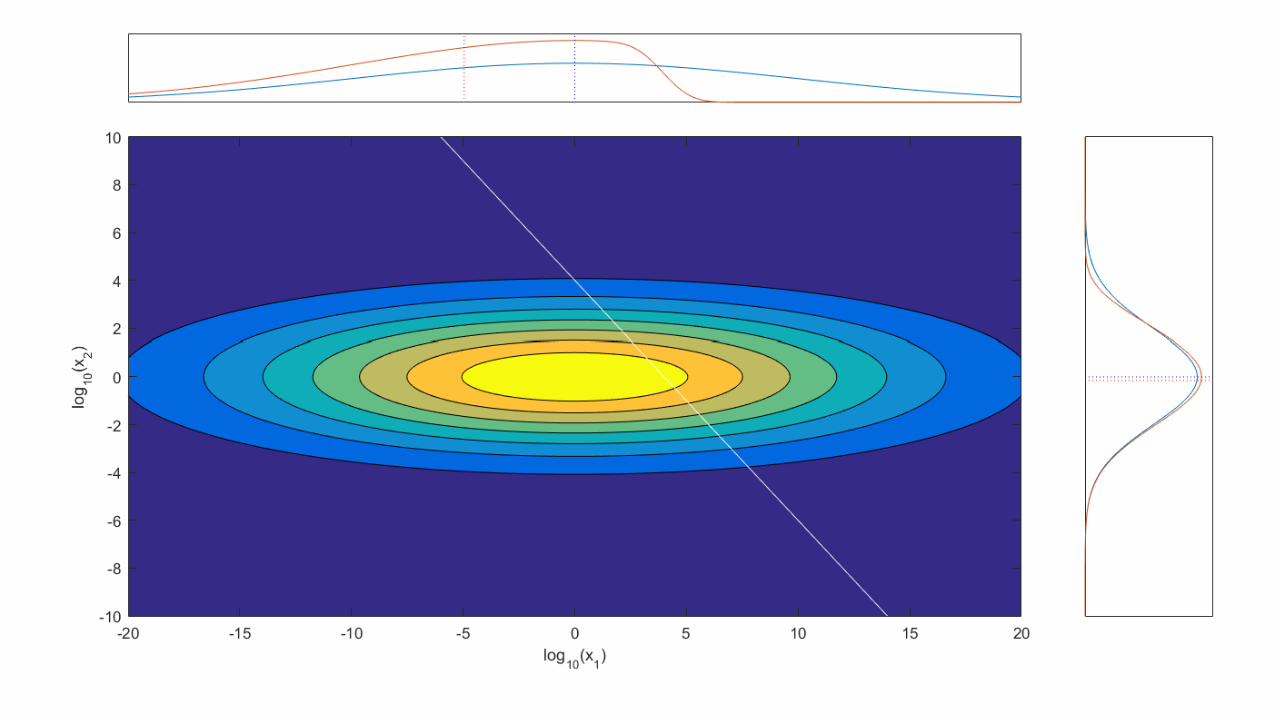
The Fermi observation and oblong distributions • No visible aliens: what is the effect on parameters?
• 𝑓𝑓(𝑥𝑥𝑖𝑖|∑ 𝑥𝑥𝑖𝑖 < 𝜃𝜃)𝑖𝑖
• Oblong joint distributions • 𝑓𝑓𝑋𝑋 𝑥𝑥1, 𝑥𝑥2, … , 𝑥𝑥𝑛𝑛 = ∏ 𝑓𝑓𝑖𝑖(𝑥𝑥𝑖𝑖)𝑖𝑖 (conveniently independent) • 𝜆𝜆𝑉𝑉𝑉𝑉 𝑥𝑥1 ≫ 𝜆𝜆𝑉𝑉𝑉𝑉(𝑥𝑥𝑗𝑗) • Oblong distributions react most with their most
uncertain component!

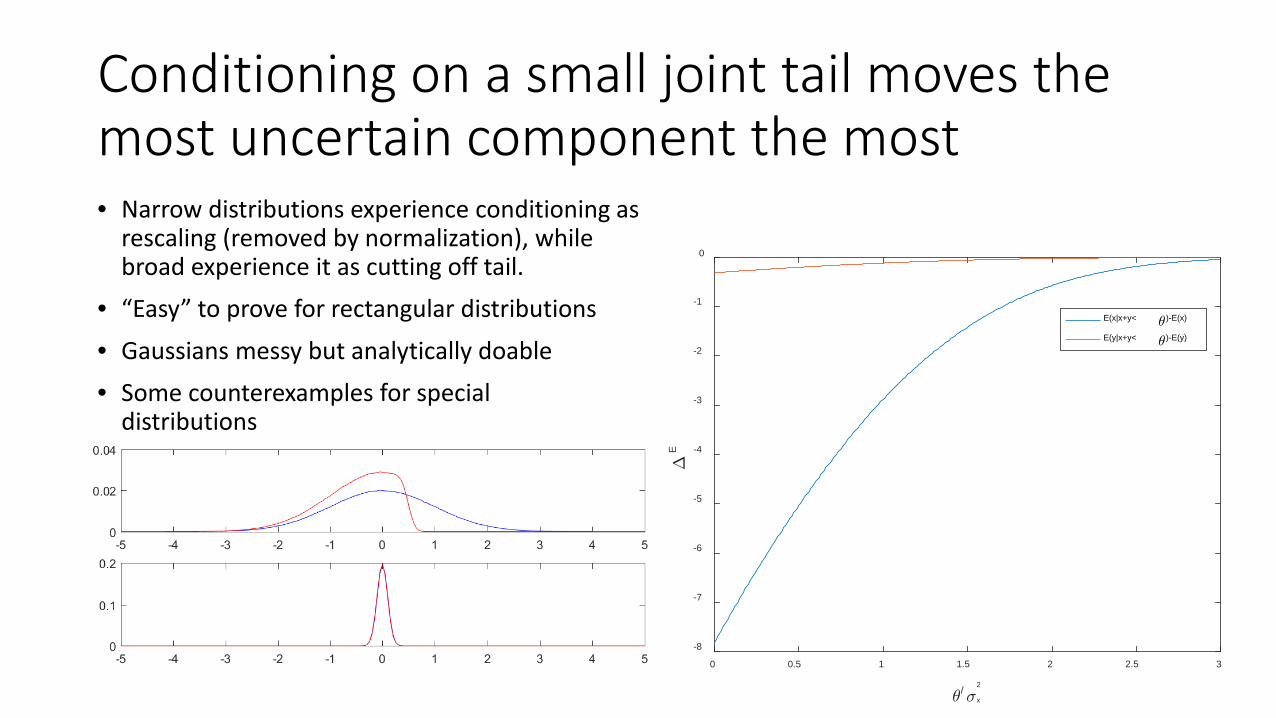
Conditioning on a small joint tail moves the most uncertain component the most • Narrow distributions experience conditioning as
rescaling (removed by normalization), while broad experience it as cutting off tail.
• “Easy” to prove for rectangular distributions
• Gaussians messy but analytically doable • Some counterexamples for special
distributions
0 0.5 1 1.5 2 2.5 3
/x
2
-8
-7
-6
-5
-4
-3
-2
-1
0
E
E(x|x+y< )-E(x)
E(y|x+y< )-E(y)
0 2 4 6 8 10 12 14 16 18
/1
2
-20
-18
-16
-14
-12
-10
-8
-6
-4
-2
0
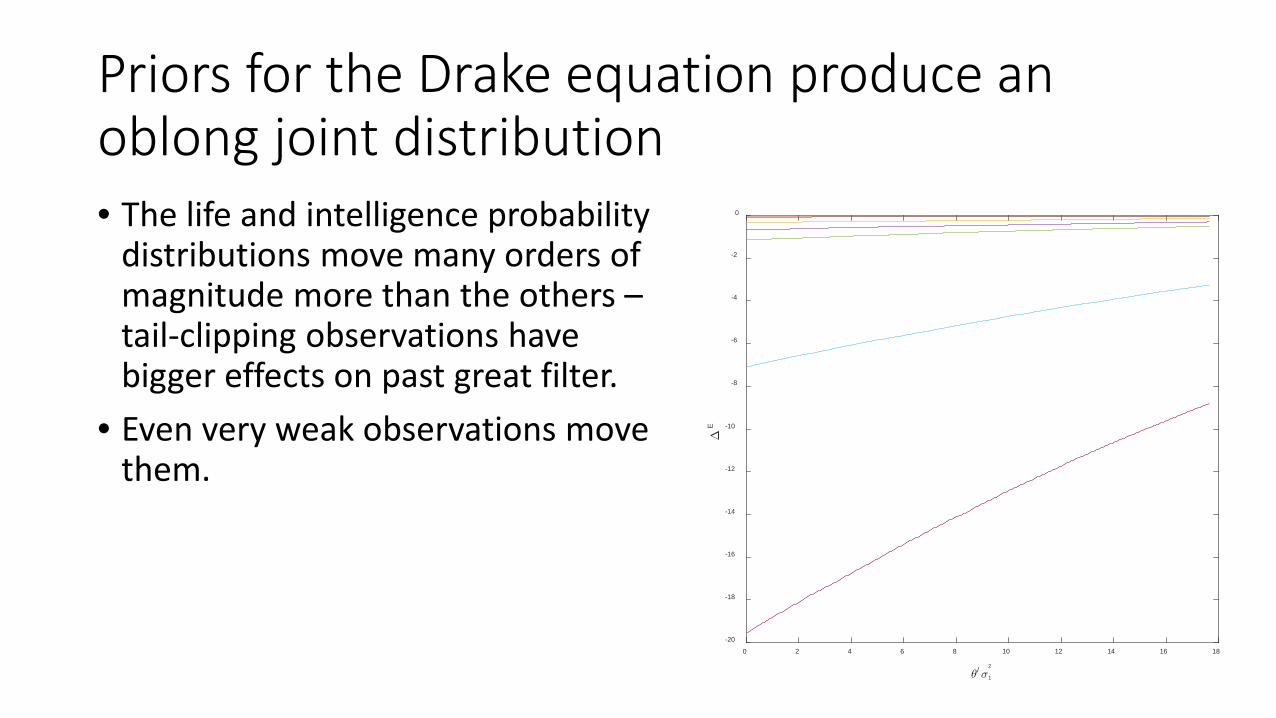
E
Priors for the Drake equation produce an oblong joint distribution • The life and intelligence probability
distributions move many orders of magnitude more than the others – tail-clipping observations have bigger effects on past great filter.
• Even very weak observations move them.
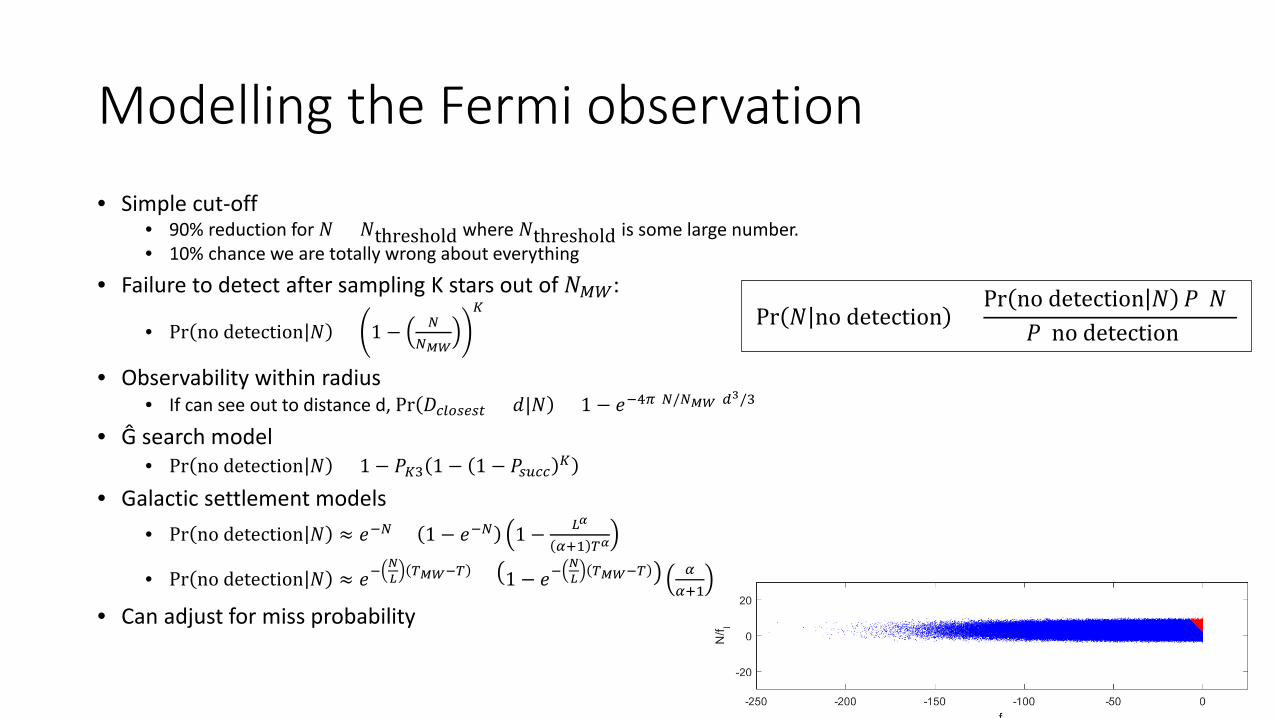
Modelling the Fermi observation • Simple cut-off
• 90% reduction for 𝑁𝑁 > 𝑁𝑁threshold where 𝑁𝑁threshold is some large number. • 10% chance we are totally wrong about everything
• Failure to detect after sampling K stars out of 𝑁𝑁𝑀𝑀𝑀𝑀:
• Pr no detection 𝑁𝑁 = 1 − 𝑁𝑁𝑁𝑁𝑀𝑀𝑀𝑀
𝐾𝐾
• Observability within radius • If can see out to distance d, Pr 𝐷𝐷𝑐𝑐𝑙𝑙𝑐𝑐𝑠𝑠𝑒𝑒𝑠𝑠𝑐𝑐 > 𝑑𝑑|𝑁𝑁 = 1 − 𝑒𝑒−4𝜋𝜋(𝑁𝑁/𝑁𝑁𝑀𝑀𝑀𝑀)𝑑𝑑3/3
• Ĝ search model • Pr no detection 𝑁𝑁 = 1 − 𝑃𝑃𝐾𝐾3 1 − 1 − 𝑃𝑃𝑠𝑠𝑠𝑠𝑐𝑐𝑐𝑐 𝐾𝐾
• Galactic settlement models • Pr no detection 𝑁𝑁 ≈ 𝑒𝑒−𝑁𝑁 + 1 − 𝑒𝑒−𝑁𝑁 1 − 𝐿𝐿𝛼𝛼
𝛼𝛼+1 𝑇𝑇𝛼𝛼
• Pr no detection 𝑁𝑁 ≈ 𝑒𝑒−𝑁𝑁𝐿𝐿 𝑇𝑇𝑀𝑀𝑀𝑀−𝑇𝑇 + 1 − 𝑒𝑒−
𝑁𝑁𝐿𝐿 𝑇𝑇𝑀𝑀𝑀𝑀−𝑇𝑇 𝛼𝛼
𝛼𝛼+1
• Can adjust for miss probability
Pr 𝑁𝑁 no detection =Pr no detection 𝑁𝑁 𝑃𝑃(𝑁𝑁)
𝑃𝑃(no detection)


-100 -90 -80 -70 -60 -50 -40 -30 -20 -10 010
-5
10-4
10-3
10-2
10-1
10 0
fl
2 3 4 5 6 7 8 910
-3
10-2
10-1
L
Original mean log 𝑙𝑙 = 5.50 Posterior mean log 𝑙𝑙 = 5.02
Original mean log 𝑓𝑓𝐿𝐿 = −19.97 Posterior mean log 𝑓𝑓𝐿𝐿 = −28.49

Conclusion 2: the great filter is likely in the past • Given the priors and the Fermi observation, the default guess should
be that the low-probability term(s) are in the past. • The conclusion can be changed if:
• We reduce the uncertainty of past terms to less than 7 orders of magnitude • The distributions have weird shapes
• Note that a past great filter does not imply our safety • (The stars just don’t foretell our doom)

Summary
• The Fermi question is not a paradox: it just looks like one if one is overconfident in how well we know the Drake equation parameters.
• Doing a distribution model shows that even existing literature allows for a substantial probability of very little life, and a more cautious prior gives a significant probability for rare life.
• The Fermi observation makes the most uncertain priors move strongly, reinforcing the rare life guess and an early great filter.
• Getting even a little bit more information can update our belief state a lot!