Embed Size (px)
Citation preview

DISCUSSION PAPER SERIES
IZA DP No. 10997
Peter BergmanJeffrey T. DenningDayanand Manoli
Broken Tax Breaks? Evidence from a Tax Credit Information Experiment with 1,000,000 Students
SEPTEMBER 2017

Any opinions expressed in this paper are those of the author(s) and not those of IZA. Research published in this series may include views on policy, but IZA takes no institutional policy positions. The IZA research network is committed to the IZA Guiding Principles of Research Integrity.The IZA Institute of Labor Economics is an independent economic research institute that conducts research in labor economics and offers evidence-based policy advice on labor market issues. Supported by the Deutsche Post Foundation, IZA runs the world’s largest network of economists, whose research aims to provide answers to the global labor market challenges of our time. Our key objective is to build bridges between academic research, policymakers and society.IZA Discussion Papers often represent preliminary work and are circulated to encourage discussion. Citation of such a paper should account for its provisional character. A revised version may be available directly from the author.
Schaumburg-Lippe-Straße 5–953113 Bonn, Germany
Phone: +49-228-3894-0Email: [email protected] www.iza.org
IZA – Institute of Labor Economics
DISCUSSION PAPER SERIES
IZA DP No. 10997
Broken Tax Breaks? Evidence from a Tax Credit Information Experiment with 1,000,000 Students
SEPTEMBER 2017
Peter BergmanTeachers College, Columbia University and IZA
Jeffrey T. DenningBrigham Young University and IZA
Dayanand ManoliUniversity of Texas at Austin and NBER

ABSTRACT
IZA DP No. 10997 SEPTEMBER 2017
Broken Tax Breaks? Evidence from a Tax Credit Information Experiment with 1,000,000 Students*
There is increasing evidence that tax credits for college do not affect college enrollment.
This may be because prospective students do not know about tax benefits for credits or
because the design of tax credits is not conducive to affecting educational outcomes.
We focus on changing the salience of tax benefits by providing information about tax
benefits for college using a sample of over 1 million students or prospective students in
Texas. We sent emails and letters to students that described tax benefits for college and
tracked college outcomes. For all three of our samples – rising high school seniors, already
enrolled students, and students who had previously applied to college but were not
currently enrolled – information about tax benefits for college did not affect enrollment
or reenrollment. We test whether effects vary according to information frames and found
that no treatment arms changed student outcomes. We conclude that salience is not the
primary reason that tax credits for college do not affect enrollment.
JEL Classification: I22, I23, H2
Keywords: tax benefits for college
Corresponding author:Jeffrey T. DenningBrigham Young UniversityDepartment of Economics165 FOBProvo, UT 84602USA
E-mail: [email protected]
* Previously circulated as “Is Information Enough? Evidence from a Tax Credit Information Experiment with
1,000,000 Students”. The authors would like to thank the Texas Higher Education Coordinating Board for providing
the data and invaluable assistance. We also acknowledge funding from JPAL-North America and the UT-Austin
Population Research Center. The conclusions of this research do not necessarily reflect the opinion or official position
of the Texas Higher Education Coordinating Board. All errors are our own.

1 Introduction
The United States Federal Government has given money to students in the form of finan-
cial aid for higher education since the 1970s. Recently, tax benefits for college have been
employed as an additional subsidy for college-going students. Tax benefits for college
rose to prominence with the Hope and Lifetime Learning Credit in 1997 and have grown
since. Tax benefits for college tuition have quickly risen in magnitude and are expected
to be $18.4 billion in 2016, or approximately 60% the size of expenditures on Pell Grants
(Joint Committee on Taxation, 2017).
As tax benefits for college have grown, several studies have studied tax benefits for
college’s affect student outcomes. These studies have generally found that they did not
affect college enrollment (Long, 2004; LaLumia et al., 2012; Bulman and Hoxby, 2015;
Hoxby and Bulman, 2016) where Turner (2011a) finds an increase in enrollment with tax
aid generosity.1 Bulman and Hoxby (2015); Hoxby and Bulman (2016) offer the most con-
vincing evidence on the effect of both tax credits and the tuition deduction respectively.
These two studies use administrative data from the IRS along with regression kink (Bul-
man and Hoxby, 2015) and discontinuity (Hoxby and Bulman, 2016) methods to examine
the effect of tax benefits for college on student outcomes. In both cases, tax benefits are
not found to affect any measured educational outcomes including enrollment or type of
institution attended.
The lack of effects of tax benefits for college stands in contrast to the the large liter-
ature on financial aid. Many studies have documented that financial aid affects student
enrollment decisions.2 Both financial aid and tax benefits for college affect the price of
college but both do not affect student enrollment.
With a growing consensus emerging that tax benefits do not affect student educational
1Other studies have found that taxpayers did not maximize their credits (Turner, 2011b), and that taxcredits can be captured by schools Turner (2012). LaLumia et al. (2012) does find that for some students taxcredits increase enrollment but finds no effects for the sample as a whole.
2See Deming and Dynarski (2009) for a summary of these studies.
2

outcomes, questions about why these tax credits do not affect enrollment have arisen.
Are tax credits for college ineffective because students are not aware of them? Are tax
credits for college ineffective because of the timing? Are tax credits for college ineffective
because they are poorly targeted (Hoxby and Bulman, 2016)? This paper addresses the
first question and the issue of salience by providing information about tax credits for
college in a large scale randomized controlled trial with over 1,000,000 students in Texas.
We reached out to students who had used the official and universal portal for college
application to public universities in Texas, ApplyTexas.
We sent information, addressed from ApplyTexas, to students on tax credits for col-
lege including the potential benefits, how to claim, and links for additional information.3
We presented the information via mailed letters and emails and varied the type of infor-
mation presented. We then tracked whether the information received affected student en-
rollment outcomes using administrative records from all public colleges and universities
in Texas supplemented with enrollments outside of Texas using data from the National
Student Clearinghouse (NSC).
We targeted three groups of students. First, we targeted rising seniors who had ap-
plied to college. Many students who apply to college including accepted students do not
enroll and previous interventions have been shown to mitigate this phenomenon, which
is known as “summer melt” (Castleman, Page and Schooley, 2014; Castleman and Page,
2015b). Second, we focused on students who had enrolled in college with the intention
of potentially affecting persistence. Information interventions have been shown to be ef-
fective at increasing persistence for enrolled students, which motivates our targeting of
already enrolled students (Castleman and Page, 2016). Many students who start college
do not finish; the six year graduation rate is below 60% at four-year institutions and finan-
cial aid has been shown to increase graduation for enrolled students (National Center for
Education Statistics, 2015; Barr, 2016; Goldrick-Rab et al., 2016; Denning, 2017). Third, we
3For an example of the type of information see Figure 1.
3

targeted students who had previously applied to Texas universities or colleges but who
did not enroll in Texas. “Non traditional” students, such as students who do not start
college directly after high school, students who are older, or students have some work
experience, are an increasing share of higher education. This intervention was designed
to target older people whose enrollment has been shown to be affected by financial aid
(Seftor and Turner, 2002) and information about financial aid (Barr and Turner, 2015).4
This outreach was inspired by several information interventions that were found to
change behavior.5 These interventions are appealing to policymakers due to their low
cost and ease of implementation. They also appeal to two broad groups of models. In
neoclassical economic models of behavior, additional information allows rational agents
to optimize more effectively and, in turn, improve outcomes. The provision of informa-
tion can also leverage insights from behavioral-economic models by “nudging” people to
overcome behavioral biases like inattention or procrastination and improving the effec-
tiveness of public policies (Chetty, 2015).
Several studies have found that low-cost information interventions can change out-
comes in higher education contexts. These interventions can range from filling out a
FAFSA for students increasing college enrollment (Bettinger et al., 2012), text messages,
reminders, and counselors affecting enrollment, persistence, and borrowing (Castleman
and Page, 2015a,b; Castleman, Owen and Page, 2015; Barr, Bird and Castleman, 2016;
ideas42, 2016), to booklets about college and fee waivers affecting enrollment for low-
income, high ability students (Hoxby and Turner, 2013). However this line of research
frequently studies a package of treatments where information is conveyed along with
other treatments, and less is known about which aspects of each drive success or failure.
Notably, Bettinger et al. (2012) find that telling students how much aid they would qualify
4Barr and Turner (2015) demonstrated that letters informing displaced workers about the Pell Grantincreased post-secondary enrollment.
5Informational and behavioral nudges have been shown to impact education outcomes that can affecteducational attainment (Jensen, 2010), college enrollment (Hoxby and Turner, 2013; Castleman and Page,2015b), school choice (Hastings and Weinstein, 2008), and student achievement (Bergman, 2014; York andLoeb, 2014).
4

for rather than filling out the FAFSA had no effect on enrollment. Similarly, Hoxby and
Turner (2013) found that information had an effect on college outcomes but the included
fee waivers were an important determinant of the application effects. Also, Darolia (2016)
finds that letters about student loans had minimal effect on student borrowing decisions.
We contribute to this literature by considering an explicitly information-only intervention
that varies the presentation and framing of information in a variety of ways.
Information interventions have been found to affect behavior in tax settings as well.
Bhargava and Manoli (2015); Manoli and Turner (2014b) examine outreach to people el-
igible for the Earned Income Tax Credit (EITC) who did not take up the EITC and find
that reminders can influence a decision to take up tax credits. In both of these studies
the targeted population received additional information. However, the experiments also
changed the method that taxpayers could claim the credits by mailing simplified work-
sheets. The present study exists at the intersection of education and tax credit interven-
tions.
We provide evidence that the null effect of tax credits for college is not driven by
a lack of information. We can not definitively know that students comprehended the
information we sent to them. However, several characteristics of our intervention and
empirical strategies provide evidence that students even among students who opened
our emails did change enrollment. First, the mail and email came from an official source,
ApplyTexas. ApplyTexas is the official portal for college application for all universities in
Texas which made the emails come from an official channel. Moreover, all students had
interacted with ApplyTexas to apply for college. So while we cannot know if students
comprehended the information, the source of the information was trusted and official. We
also show that even after account for email open rates, there was no change in enrollment
probabilities. Among students who opened the emails, approximately one third opened
the email multiple times suggesting engagement with the material.
Our study addresses the issue that tax credits for college may not be salient for stu-
5

dents when they make their decision by providing them with this information. Our null
findings suggest that a lack of salience cannot explain the inefficacy of tax credits for
college. We discuss other reasons including timing and targeting of benefits later in the
paper.
Further, given that we find the provision of information did not affect student out-
comes, we hypothesize that information and interventions that reduce the cost of action
may be important complements to successfully influence education outcomes.6 Information-
only interventions have more mixed impacts on education outcomes (Bettinger et al.,
2012; Darolia, 2016).
The rest of the paper proceeds as follows. Section 3 describes the institutional back-
ground and the intervention. Section 2 describes the intervention. Section 4 describes
the data and estimating strategy. Section 5 presents the results. Section 6 discusses the
findings. Finally, Section 7 concludes.
2 Experiment
In collaboration with the Texas Higher Education Coordinating Board (THECB), we ob-
tained physical address and email information for students who had applied to all public
Texas colleges or universities using the ApplyTexas.org portal. ApplyTexas is an online
portal that allows students to apply to any Texas public university as well as to participat-
ing community colleges and private colleges. Our sample is formed of students who had
used the ApplyTexas portal from Fall 2011 to Fall 2014. We sent both emails and physical
letters to students in our sample. Messages to students were from ApplyTexas. This was
intentional as 1) all students had interacted with ApplyTexas and 2) ApplyTexas is a well
known and official application portal. This was done to imbue messages with authority
6Bhargava and Manoli (2015); Manoli and Turner (2014b); Bettinger et al. (2012); Castleman and Page(2015a,b); Castleman, Owen and Page (2015); Barr, Bird and Castleman (2016) all fit in this category whereinformation was conveyed in addition to a connection to counseling, a change in the decision makingprocess, etc.
6

and importance.
Samples
We targeted three groups of students using the ApplyTexas sample as a base. The three
groups were students who were at different points in their college education and thus
could have different responses to information about tax credits for college. The content
delivered to these students was essentially the same.7 The groups also received the infor-
mation at different times, as described below. The description of the three groups follows
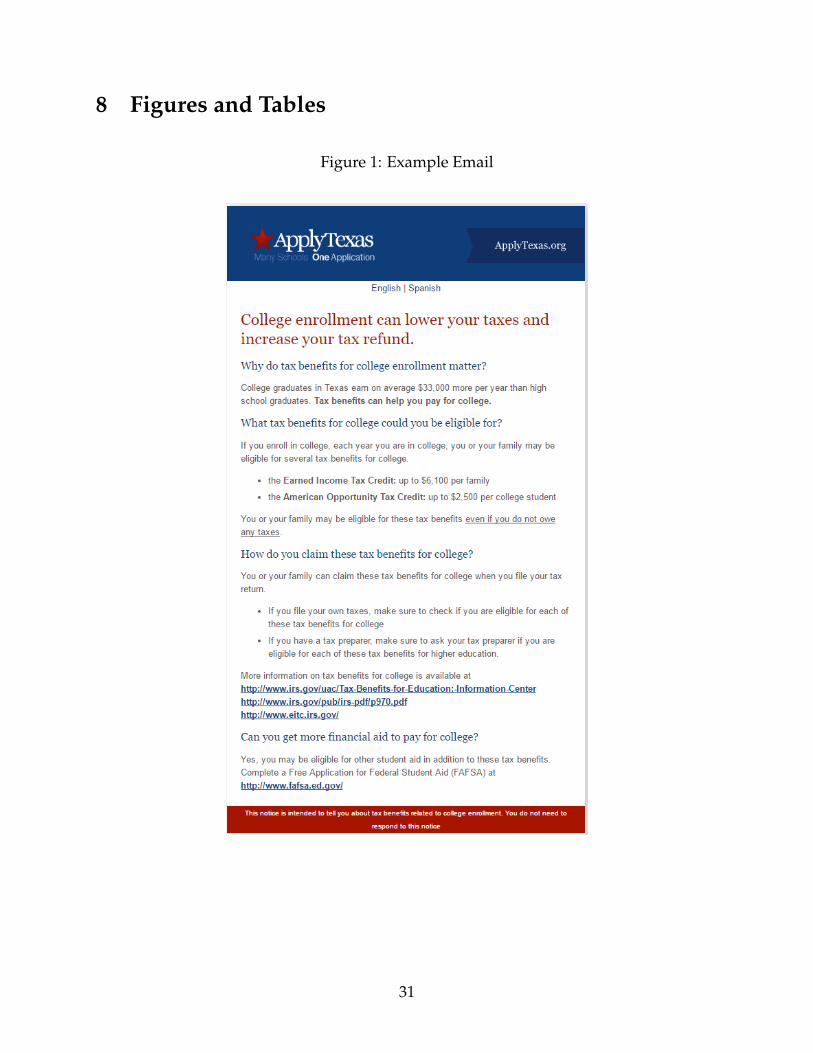
below and the timing and contents of treatment are summarized in Table 1. A timeline
of when communications were sent and relevant deadlines and outcomes is included in
Figure 2.
Enroll Sample: The first group we targeted was high school seniors of the class of
2014 who had applied to college. The intent was to provide information to students and
study how their decision to enroll in college in the fall after their high school graduation
was affected. This group will be referred to as the “Enroll group.” The Enroll group had
an email sent on April 1, 2014 and July 16, 2014. They also received a letter sent on June
1, 2014. Many of of these students intend to enroll in college but do not for a variety
of reasons. This phenomenon is known as summer melt. (Castleman and Page, 2014)
The information provided was designed to potentially affect the enrollment decision. We
sent this email when students could still apply to non selective colleges and when they
were making decisions about whether and where to attend college, pay fees, make other
preparations, etc. The first email also arrived around the deadline for tax filing which
may have made it more salient.
The THECB requested that some students in the enroll sample only receive the FAFSA
7The exact phrasing of the information changed from the initial emails as we experimented with changesin the content to bypass email spam filters. We did this by sending test emails to a set of emails we hadaccess to in order to see what got caught in the spam filters. The changes were small and typically changedthe punctuation of the messages. Also, as discussed later, the Enroll sample received slightly differentinformation.
7
emails so some treated students only received an email about the FAFSA. However, all
other treated students received mail about tax credits, two emails about tax credits, and
an email about filing the FAFSA. The first email the Enroll group received was sent Feb
18, 2014 and encouraged students to file their FAFSA. Two variations of this email were
sent: one was a simple message about filing the FAFSA and the other had more detail
about the process for filing the FAFSA.
ReEnroll Sample: These students enrolled in college in the calendar (and tax) year of
2013. These students were very likely to be eligible for tax credits for college because they
were enrolled in college. They were informed about tax credits for college in order to see
if reenrollment decisions were changed. This will be referred to as the “ReEnroll group.”
Information was sent around tax filing season to help student claim benefits they were
eligible for. Larger tax refunds have been shown to increase college attendance which
motivated information being sent around tax filing season (Manoli and Turner, 2014a).
The first email was sent on January 17, 2014 which corresponds to the beginning of the
tax filing season. The second email was sent March 25, 2014 which corresponds to the last
three weeks of the tax filing season. The outcome of interest was reenrollment in the Fall
of 2014.
ReApply Sample: The last group of students we targeted had previously applied to
college from Fall 2011 to Spring 2013 but did not enroll in college in the 2011-12 or 2012-13
school years. These students had indicated interest in college by previously applying but
ultimately did not enroll in a Texas public institution. We sent emails to this group with
the intention of testing whether this changed students decision to enroll to college. This
will be referred to as the “ReApply group.” The emails were sent to this group around
deadlines for application for non selective institutions, including community colleges, to
affect enrollment. The first email was sent on November 6, 2013 and the second was sent
on July 16, 2014. The outcome of interest was enrolling in either Spring or Fall of 2014.
The timing of the information could potentially affect the interpretation of the results.
8

We discuss the reasons for the timing decisions we made above but acknowledge that
timing of information could be important. However, the timing was different across the
three groups and was intended to come at times where students made decisions about
college enrollment or tax filing.
Content
The emails and mailings were designed by a design firm to present the information in
a visually appealing way. The ApplyTexas logo and website appear at the top of each
communication. The emails were sent from a THECB email account to add legitimacy
to the message conveyed. All communication also included Spanish language versions
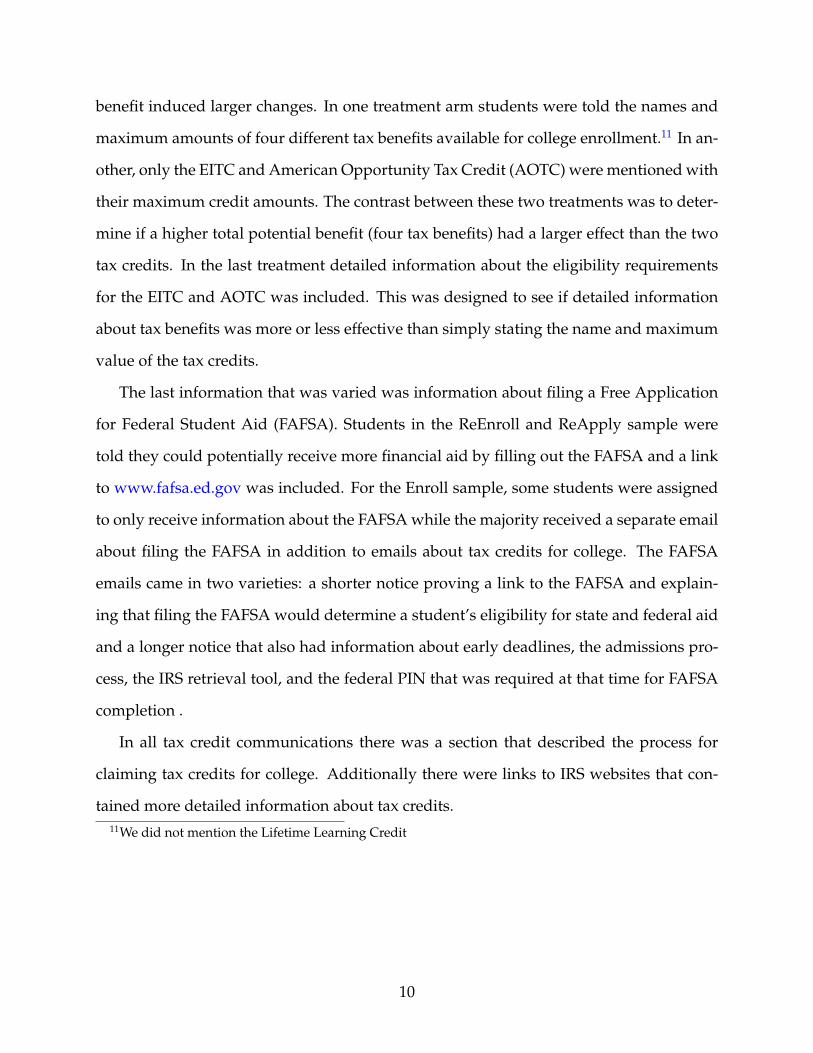
of the information. An example of the email can be seen in Figure 1.8 The content of
the emails was varied to test what information, if any, affected student’s decisions. The
content for each group is summarized in Table 1.
The first set of content variations was designed to test whether information about po-
tential tax credits had a different effect when coupled with information about costs or
benefits of college attendance. In the benefits variation, students were told that college
graduates in Texas earn on average $33,000 more per year than high school graduates.9
In the costs variation, students were told that tuition in Texas was $2,400 per year for 2-
year colleges and $7,700 per year for 4-year public colleges.10 For students in the ReEnroll
group, the information on the costs of college was omitted because students had already
paid tuition at their institution. The final variation was neutral and there was no discus-
sion of the costs or benefits of college.
The second set of content variations was about how much information students were
given about tax credits for college. This was designed to test if a different maximum
8All email templates can be seen at the following link. The subject for the emails was always the same“Tax Benefits for College.”
9This number was derived from the American Community Survey and accessed at the Business Journalsbizjournals.com.
10These tuition figures came from collegeforalltexans.com and are for the 2013-2014 school year.
9
benefit induced larger changes. In one treatment arm students were told the names and
maximum amounts of four different tax benefits available for college enrollment.11 In an-
other, only the EITC and American Opportunity Tax Credit (AOTC) were mentioned with
their maximum credit amounts. The contrast between these two treatments was to deter-
mine if a higher total potential benefit (four tax benefits) had a larger effect than the two
tax credits. In the last treatment detailed information about the eligibility requirements
for the EITC and AOTC was included. This was designed to see if detailed information
about tax benefits was more or less effective than simply stating the name and maximum
value of the tax credits.
The last information that was varied was information about filing a Free Application
for Federal Student Aid (FAFSA). Students in the ReEnroll and ReApply sample were
told they could potentially receive more financial aid by filling out the FAFSA and a link
to www.fafsa.ed.gov was included. For the Enroll sample, some students were assigned
to only receive information about the FAFSA while the majority received a separate email
about filing the FAFSA in addition to emails about tax credits for college. The FAFSA
emails came in two varieties: a shorter notice proving a link to the FAFSA and explain-
ing that filing the FAFSA would determine a student’s eligibility for state and federal aid
and a longer notice that also had information about early deadlines, the admissions pro-
cess, the IRS retrieval tool, and the federal PIN that was required at that time for FAFSA
completion .
In all tax credit communications there was a section that described the process for
claiming tax credits for college. Additionally there were links to IRS websites that con-
tained more detailed information about tax credits.11We did not mention the Lifetime Learning Credit
10

Randomization
Enroll Sample: The enroll sample consists of 80,802 students. The steps of the random-
ization can be seen in Figure 3. We wanted to test for informational spillovers and so
we structured the randomization to have three groups: students who received treatment,
students at schools where no one received treatment, and students who did not receive
treatment but were at schools where some students did receive treatment. In order to
accomplish this we first split the sample between high schools that had more or less than
10 students use the ApplyTexas portal.
For high schools with more than 10 students who applied via ApplyTexas, 20% of
high schools were assigned to be in the control group where no students in the high
school received the information. The remaining 80% of schools had their students split
between three groups. 60% of students assigned to receive information about tax credits,
20% assigned to a peer group that did not receive any communication but were at the
same high schools as students who received communication, and 20% of students were
assigned to receive a FAFSA only treatment at the request of the THECB. This enables a
test of whether information was diffused throughout high schools. That is, did sending
information to some students in a high school create information spillovers to students
who did not receive the information? This can be answered by comparing students who
did not receive the information at schools where some students did to students at schools
where no student received the information.
The process was slightly different for high schools with fewer than 10 students ap-
plying. Due to the limited number of potential peers, we omitted the “peer” treatment.
Among schools that had fewer than 10 students apply, 20% of the high schools were as-
signed to be in the control group and had no treated students. Of the remaining schools,
80% of students were assigned to receive information about tax credits and 20% to receive
a FAFSA only treatment.
The ReApply sample consists of 526,614 students with roughly 75% assigned to treat-
11

ment and 25% assigned to control. There were 18 different email templates used that
contained different variations of the information about tax credits for college. A stratified
randomization process was employed to randomly assign students to treatment arms or
the control group. We stratified on application date, family income, type of school applied
to, and age.
A similar process was employed for the 434,887 students in the ReEnroll sample with
75% being assigned to treatment and 25% being assigned to control. We did not include
variations about the price of college because enrolled students had already paid tuition at
the time of our contact.
3 Institutional Background
3.1 Tax Credits
Tax credits for college are a substantial expenditure totalling $31.8 billion in 2013. This
is roughly the same size as the Pell Grant program, which is the largest grant for college
in the United States. Not only do tax credits for college constitute a large expenditure,
they have increased in recent years. In 1998 there was roughly $5 billion in expenditures
on tax credits for college (Bulman and Hoxby, 2015). A lot of this growth occurred in
the 2009 tax year with the enactment of the American Opportunity Tax Credit (AOTC).
Dynarski and Scott-Clayton (2016) offer an excellent overview of the history and effects
of tax credits for college. At the time of this study there were five different tax benefits
for college students. The first was the American Opportunity Tax Credit, a partially re-
fundable tax credit. Second, taxpayers could deduct students’ tuition and fees. Third,
full-time students over the age of 19 could count in the calculation of the Earned Income
Tax Credit. Fourth, the Lifetime Learning Credit was available which is less generous
than the AOTC. Lastly, full-time students over the age of 19 could still qualify taxpayers
for the dependent exemption.
12

Several studies examine the effect of tax credits for college on student outcomes. Tax
credits have generally been shown to not effect college enrollment (Long, 2004; LaLumia
et al., 2012). LaLumia et al. (2012) studies older, potential students in the NLSY79 and
finds that overall there is no overall effect on enrollment. However, for older men whose
educational expectations were below early life expectations, the authors finds an effect.
Turner (2011a) however finds an increase in enrollment with tax aid generosity. Other
studies have found that taxpayers did not maximize their credits (Turner, 2011b), and
that tax credits can be captured by schools (Turner, 2012).12 Bulman and Hoxby (2015);
Hoxby and Bulman (2016) offer convincing evidence on the effect of both tax credits and
tuition deductions respectively. These two studies use administrative data from the In-
ternal Revenue Service along with regression kink and regression discontinuity designs
methods to examine the effect of tax benefits for college on student outcomes. In both
cases, the authors find tax benefits do not affect any educational outcomes including en-
rollment or type of institution attended. We discuss the details of the various tax benefits
for college in the Appendix.
The lack of an enrollment effect for tax credits contrasts with the findings for grant aid.
The lack of an enrollment effect for tax credits puzzle and several potential hypotheses
for the null effect exist. The first is the timing of aid receipt. A student who enrolls in
school in the fall of calendar year t does not receive tax benefits until they file taxes in
year t + 1—sometime between February and May. The delay between student decision
making and the receipt of benefits is a minimum of five months. The delay is even more
pronounced for enrollment in January of year t where the delay is over 12 months. This
delay between enrollment and the additional funds means that tax credits are not well
suited to ease credit constraints. While tax credits may appear to work as an incentive
that changes the price of college, the timing makes it easy for families to perceive tax
credits as a change in income rather than a change in the price of college.
12In Turner (2011b), the finding is that on average aid is captured by schools. However, for individualstudents the information sent is still relevant because they will receive less tax aid if they do not file.
13

Another potential reason for tax credits’ null effect on student outcomes is a lack of
salience. Many students and families may simply not be aware of the availability or
generosity of tax credits for college. The most obvious time for a student to learn about
tax credits for college is when they (or their parents) file taxes after college attendance.
However, this occurs after students have made enrollment decisions. The intervention
studied was primarily designed to address the issue of salience. Given our null result,
salience does not seem to be the key reason that tax credits for college do affect student
enrollment.
3.2 ApplyTexas
ApplyTexas is a portal used by all public universities in Texas and many public com-
munity colleges.13 Students can create a profile and use this to submit applications to
any public university in Texas as well as participating community colleges and private
universities. In Fall 2015, 97% of first time undergraduates in Texas Public Community
Colleges had used ApplyTexas. Similarly 57% of community college of first time under-
graduate community college students had used ApplyTexas.14 Hence, our sample is very
representative of students who are applying to Texas universities but is less representa-
tive of community college applicants. ApplyTexas is an official state portal which gives
the information conveyed additional importance.
4 Data and Estimation Strategy
The data from this project come from four data sources. The first is from the ApplyTexas
portal. This contains contact information and basic demographic information including
race and gender as well as indicators for parental education and self-reported family in-
come. The second source is administrative data that the THECB collects on all students13The Texas Higher Education Coordinating Board is responsible for the administration of the site.14These statistics were provided in an email conversation with the THECB.
14

in public universities and community colleges in the state of Texas. We will primarily be
using the information on student enrollment in the Fall of 2014 as the outcome of inter-
est but also have information on graduation and financial aid. The third data source is
information on who opened the emails we sent which was generated by the email soft-
ware we used. Finally, we also supplement student enrollment with National Student
Clearinghouse (NSC). The NSC data we use has enrollments for all high school students
enrolled in Texas public high schools who graduated from 2011 to 2014, or for any stu-
dents who enrolled in a public institutions of higher education in Texas from 2009 to 2015.
This should cover the entire Enroll sample and the entire ReEnroll sample. The ReApply
sample is also covered for high school seniors who graduated from 2009-2014 but would
not cover students who applied from Fall 2011 to Fall 2014 who were were not high school
seniors from 2009-2014.
Summary statistics are presented in Table 2. The samples have similar characteristics.
The samples are 43-45% male, 37-41% Hispanic, and have 12-19% of the sample reporting
that their father had a bachelor’s degree. 73% of the “Enroll” sample enrolls in college.
63% of the “ReEnroll” sample enrolls in public higher education in the next year.
Somewhat surprisingly, the ReApply sample is likely to enroll with 44% of students
enrolling, with 14% enrolling out of Texas. Those who were enrolled out of state likely
were enrolled out of state prior to the intervention but the data available did not allow us
to track out of state enrollment. This relatively high rate of enrollment shows that these
potential students may well respond to information about college enrollment because
many of them actually did enroll, despite previous nonenrollment.
In order to estimate the effect of this information intervention we will leverage the fact
that the intervention was randomly assigned. Because treatment was assigned randomly
it should be orthogonal to any student characteristics that will affect college going. For
15

the ReApply and ReEnroll groups the primary specification will be of the form
Yi = α · Treati +Xiβ + εi (1)
where i indexes students, Yi is an outcome (either enrollment in Fall 2014 or Spring 2014),
Treati is an indicator for students receiving some type of intervention, Xi is a vector of
student characteristics, and εi is an idiosyncratic error term.15 Xi includes indicators for
gender, race, father education, mother’s education, family income, and student classifi-
cation if applicable.16 The coefficient of interest is α which is the intent-to-treat effect of
being assigned treatment.17 The intent to treat parameter α, is a policy-relevant parameter
because it incorporates both the size of the treatment effect and the fraction of students
who were actually treated. Sometimes Treati will be separated into different indicators
for different variations of the intervention. For example, Treati will be replaced with
indicators for the cost, benefit, and neutral framing of tax credits for college.18
Equation 1 is altered in an important way for the enroll group to account for the ran-
domization procedure. There are three groups of students we consider: students who
received treatment, students who did not receive treatment but went to school with stu-
dents who did receive treatment, and students who went to a school where no students
received treatment. We test for the presence of information spillovers by computing the
average enrollment rates for these groups and comparing them. To account for this struc-
ture the following estimation is used for the enroll group
Yi = α · Treati + γ · Peeri +Xiβ + εi (2)
where Peeri is an indicator for students who did not receive the letters and email but were15This equation will be estimated using Ordinary Least Squares.16Classification denotes whether the school was a freshman, sophomore, junior or senior.17For the enroll sample this would include tax emails, a FAFSA email, and a tax mailing. For the ReEnroll
and ReApply sample, treatment was only receiving an email.18We tested that all of the treatment arms had the same effect and in all of the samples we could not reject
that they had the same effect which justifies combining the treatment arms.
16

in schools where some students received the email. As a result, γ measures the effect of
information spillovers within a high school.
While we sent emails to all students assigned to treatment, many students did not
see the email for various reasons. These included having an outdated email or our email
being filtered out by the spam filters. If students did not at least open the email, they
are very unlikely to be affected by the treatment. Fortunately the email service we used
tracked whether the recipients of emails opened their email. We use this to information in
an instrumental variables framework to examine the effect of the information on students
who received and opened the email containing information about tax credits for college.
In this context the first stage equation becomes:
Openi = θ · Treati +Xiβ + νi (3)
where Openi is an indicator for a student opening the email and θ reveals the fraction of
students who were sent email that opened an email. Xi includes indicators for the three
largest email providers in the sample, Gmail, Hotmail, and Yahoo.19 The second stage
becomes
Yi = η · Openi +Xiβ + µi (4)
Yi is a student outcome like enrollment and η is the effect of a student opening an email
containing information about tax credits for college. η is the treatment on the treated
parameter and accounts for the fact that not all students who were sent emails opened
the email. η is useful in understanding the effect of information about tax credits for
college apart from issues of incomplete take by treated students. For the ReApply and
ReEnroll groups, robust standard errors are presented. For the Enroll group, standard
errors are clustered at the high school level to account for treatment being determined in
19This captures differences across these providers including spam filtering and potentially sorting acrossemail providers.
17

part by high school.
Diagnostics
We check to make sure that student characteristics are balanced across treatment and
control groups in Table 3. For the Enroll sample, the treatment group is 1.2 percentage
points more likely to be male but this is only marginally statistically significant. Similarly,
students in the “peer” group are not statistically different from the control group for any
covariate. For the ReEnroll sample, none of the tested covariates is statistically different
from zero. For the ReApply sample, one covariate is statistically different at the 5% level,
treated students are .4 percent points less likely to be male. Taken together these results
confirm that the randomization procedure allocated similar students to treatment and
control groups. We control for these variables to account for slight differences in the
composition of the treatment and control groups and to increase precision.
5 Results
5.1 Did Students Receive Information?
A shortcoming of this study is that we can not show definitively that students understood
the information in the mail and email sent to them. We try to overcome this shortcoming
in several ways. We designed the intervention so that information was sent from Apply-
Texas, the official portal for public university application in the state of Texas. Further, all
students in the sample had submitted an application via ApplyTexas and were familiar
with its official capacity. This was not an email from an entity that was not known or
unofficial.
We also use a instrumental variables strategy to address if students internalized the
information is that focus on students who opened the email. This narrows our focus
18

to treated students who had a chance to consume the information. Our instrumental
variables strategy confirms the patterns of our reduced form analysis with an associated
loss of precision.
However, opening an email does not mean that the recipient understand the informa-
tion in the email. To this end, we know that roughly one third of students who opened an
email opened it more than once. Opening the email multiple times suggests that a sub-
stantial fraction of recipients intentionally engaged with the information. While this is an
imperfect proxy, it suggests a level of engagement consistent with students absorbing the
relevant information.
Moreover, the Enroll group received both physical mail and email which means that
students had more than one source of information on tax credits. It may be that email is
a bad channel to convey this information. For the Enroll sample, they also received this
information via a different channel, namely postal mail.
Enroll
Table 4 presents the effects of the intervention for high school seniors. The main results
will combine all tax treatment arms into one indicator for treatment though the results
do not vary by different treatment content. Panels A shows the effect of assignment to
treatment which included both physical mailings and emails. The estimated impacts are
small and statistically insignificant. The standard errors are a bit larger for this sample
because there are fewer students. 73% of the control group enrolled and the top of the 95%
confidence for the intent to treat effect is 1.4 percentage points or a 1.9 percent increase
relative to the baseline. Students who did not receive the letter but were in high schools
where some students did receive the letter were similarly unaffected by the letters.
As mentioned in Section 4, not everyone who was assigned to receive an email actu-
ally opened an email. To adjust for this, we instrument for opening any email with an
indicator for assignment to treatment in Panel B as outlined in equations 3 and 4. Panel
19

B uses assignment to treatment as an instrument for opening the email. These estimates
focus on the effect of opening the email. However, the treatment also included a letter so
this examines the effect of one component of the treatment and are hence a lower bound.
Similarly there are no statistically significant effects on college enrollment with the point
estimates being small and negative. Panel C presents the first stage and shows that 43%
of students opened the emails that were sent.
ReEnroll
Table 5 considers students who were enrolled in college and whether they reenrolled in
the following year. Panel A shows that assignment to receive an email did not change
enrollment and very small effects can be ruled out of +/- .003 percentage points. This
overall zero effect could be masking an upgrading effect where students “upgraded”
from community colleges to four year institutions. Columns 2-3 explicitly test for this
by considering reenrollment in Texas community colleges and public universities sepa-
rately. The coefficients are similarly small and precisely estimated suggesting that there
was no upgrading from community colleges to universities.20
We also show that grants received did not change. We also have a proxy for students
filing the FAFSA which did not change.21 We also consider whether students graduated
in that year and find no results significant at the 5% level. There is a very small increase in
the probability of graduating from a four year school in Texas but this is only significant
at the 10% level. Further after applying the Romano Wolf multiple testing correction the
p value is .168 (Romano and Wolf, 2005)
Instrumenting for opening an email does not substantively change the conclusions—
students who opened emails were no more likely to have enrolled in college. Our esti-
mates can still rule out effects of +/- 1 percentage point. Reenrollment rates were 63% for
20Results are similar when considering out of state schools separately21Specifically the indicator is for whether a student did one of the following: filed a FAFSA, filed a Texas
Application for State Financial Aid (TAFSA), or received merit aid.
20

the control group so ruling out a 1 percentage point change rules out a very small percent
change in reenrollment. The IV estimates of “upgrading” are larger but are still substan-
tively small and statistically insignificant. Panel C shows that 33.6% of treated students
did open the email which provides evidence that some students did receive information
about tax credits for college.
ReApply
Table 6 presents results for the intervention for students who had previously applied
to college but were not currently enrolled in a Texas public institution. We consider both
enrollment in Spring 2014 and Fall 2014 because the emails were sent in time to potentially
affect both enrollments. The patterns are very similar to the ReEnroll group. Panel A
shows very small effects of the email in the intent-to-treat estimates. The top of the 95%
confidence interval is .003 for enrollment in Fall 2014 and is similarly small in Spring. The
IV estimates in Panel B show very precisely estimated zeros as well. It is worth noting
that 21.7% of students opened the emails that were sent. This is smaller than the other
interventions largely because we were better able to design the emails to get past the
spam filters as time went on and the ReApply emails were the first emails we sent. In the
IV specification the results are again quite small and statistically insignificant. Overall,
the evidence again suggests that the information had no effect on student outcomes.
Message Variations
We next test if the overall zero effect is masking whether certain message variations had
an impact on student outcomes. This is shown in Table 7 for each of the three treatment
samples. The intent to treat estimates of the effect of treatment on any enrollment. The
results are remarkably consistent and show that none of the messaging variations had any
significant impact on student outcomes. Articulating the costs vs the benefits of college
21

attendance did not have an effect. More tax credits described, detailed information about
tax credits, and simple information about tax credits similarly did not affect enrollment
or application.
The way information is framed has been shown to affect program take up.22 Fur-
ther, simplified information has been shown to be effective which motivated our use of
simplified and more complex presentations (Hastings and Weinstein, 2008; Bhargava and
Manoli, 2015). Information about benefits has been found to affect student investment
in some contexts which motivated our descriptions of the costs and benefits of schooling
(Jensen, 2010).
FAFSA Emails
We also check to see if FAFSA emails for enrolled students had an effect in Table 8. The
FAFSA emails did not affect student enrollment. None of the estimated results are signfi-
cantlly different from zero, either for enrollment or our proxy of filing a FAFSA. Roughly
5% of students who were sent the FAFSA emails clicked on any link that was included.23
Heterogeneity
We test for heterogeneous effects by demographic information. The type of information
available differs by the sample. But we find that 4% of the coefficients tested are statisti-
cally different at the 5% level which is consistent with what would be expected by chance.
In particular we examine heterogeneous effects for students who are more likely to be af-
fected. We examine heterogeneity by family income, financial dependence, and whether
a student filed the FAFSA. These results are available upon request.24
22See Saez (2009) for instance)23There is a large literature trying to understand why students do not file their FAFSA and strategies to
increase filing. Bettinger et al. (2012); Castleman and Page (2015a); Kofoed (2017). These and other studiesjustified sending this information at the THECB’s request.
24We interact treatment with indicators for race, reported family income, indicators for father’s educa-tion, indicators for mother’s education, and an indicator for being over age 24 for the ReEnroll and ReApply
22

6 Discussion
We document that sending out information about tax credits for college did not affect
enrollment. We present evidence that our information was viewed and engaged with by
some students and account for this using instrumental variables. Our results suggest that
information is not the primary barrier to tax credits for college affecting student enroll-
ment.
Even with evidence that many students engaged with the information, we still find
that it did not effect enrollment. We analyzed who opened the emails we sent to see who
was engaging with the information. Students who were most likely to open the email
were students who had characteristics that would predict higher college enrollment. We
examine what predicts who opens the emails and find that female students, students with
higher parental education, and Asian students were more likely to open emails. In fact,
students who eventually enrolled or reenrolled were more likely to open the email.25
It is not clear if students with relatively higher probability of enrollment opened the
emails is because they were more likely to receive the email because we had current email
accounts or were more likely to get through spam filters for these groups, or if students
were equally likely to receive the email but students from groups with higher college go-
ing rates were more likely to open the email. In either case, the emails disproportionately
contacted students who had characteristics that would predict higher college attendance.
This suggests that students who engaged with the information were the students who
were least likely to be on the margin of college attendance.
We now turn our attention toward why there may no effect. The delivery of informa-
tion in this paper did not address some of the other issues about tax credits for college like
timing of benefits. If students face credit constraints, then information that tax aid will
sample. We have more information for the ReEnroll sample and additionally check heterogeneity by fam-ily income as reported on the FAFSA (in bins and linearly), class standing, and financial dependence asreported on the FAFSA for the ReEnroll sample.
25Full results of this exercise are available upon request.
23

be available five months after initial enrollment will not affect enrollment. Our results
suggest that issues of timing are a likely reason that tax benefits for college do not change
enrollment behavior.
It may be that tax credits for college are not well targeted to students whose enrollment
is most likely to be affected by aid. Only 24% of tax credits for college go to families
with income less than $25,000. (Dynarski and Scott-Clayton, 2016) However, the Earned
Income Tax Credit is affected by college enrollment even though it is not typically seen
as a tax benefit of college. Students who enroll in college can continue to be a dependent
student affecting EITC eligibility after age 18 if they enroll in college. This tax benefit
of college is likely to affect lower income students than the American Opportunity Tax
Credit or Lifetime Learning Credit.26 It may be that tax credits for college were intended
to serve another purpose–provide tax breaks to middle income families. If this is the goal,
tax benefits for college are not the most straightforward way to accomplish tax breaks for
middle income families. (Dynarski and Scott-Clayton, 2016)
We also are unable to measure whether the information we conveyed increased tax
credit take up. It is possible that this information did not affect student outcomes as we
document but that it did increase take up of tax credits. Unfortunately, it is impossible to
know if this occurred without a link to administrative tax data.
7 Conclusion
Using a sample of over 1 million students in Texas we show that information about tax
credits for college did not affect student college enrollment. We show that there was no
effect for any of the treatment arms irrespective of content. We also show that accounting
for students who actually received the information by opening the email does not change
our results.26EITC benefits have been shown to affect college enrollment.(Manoli and Turner, 2014a)
24

The key insight from our study and others is that tax credits for college do not affect
student outcomes—even when students receive information them. Our results suggest that
the lack of an educational effect of tax credits for college stems from issues with the tim-
ing or targeting of tax credits rather than salience. Alternative uses of the funds for tax
credits for college would likely increase college access and success relative to tax credits
for college. As it stands now, tax credits for college operate mostly as a subsidy to middle
income college goers and their families.
25

References
Barr, Andrew. 2016. “Fighting for Education: Veterans and Financial Aid.” Discussion
paper.
Barr, Andrew, and Sarah Turner. 2015. “Aid and Encouragement: Does a Letter Increase
Enrollment among UI Recipients?” Working Paper.
Barr, Andrew, Kelli Bird, and Benjamin L Castleman. 2016. “Prompting Active Choice
Among High-Risk Borrowers: Evidence from a Student Loan Counseling Experiment.”
EdPolicyWorks Working Paper.
Bergman, Peter. 2014. “Parent-Child Information Frictions and Human Capital Invest-
ment: Evidence from a Field Experiment.” Columbia University Teachers College Working
Paper.
Bettinger, Eric P., Bridget Terry Long, Philip Oreopoulos, and Lisa Sanbonmatsu.
2012. “The Role of Application Assistance and Information in College Decisions: Re-
sults from the H&R Block Fafsa Experiment*.” The Quarterly Journal of Economics,
127(3): 1205–1242.
Bhargava, Saurabh, and Dayanand Manoli. 2015. “Psychological frictions and the in-
complete take-up of social benefits: Evidence from an IRS field experiment.” The Amer-
ican Economic Review, 105(11): 3489–3529.
Bulman, George B, and Caroline M Hoxby. 2015. “The Returns to the Federal Tax Credits
for Higher Education.” Tax Policy and the Economy, 29(1): 13–88.
Castleman, Benjamin L, and Lindsay C Page. 2014. Summer melt: Supporting low-income
students through the transition to college.
26

Castleman, Benjamin L, and Lindsay C Page. 2015a. “Freshman year financial aid
nudges: An experiment to increase FAFSA renewal and college persistence.” Journal
of Human Resources.
Castleman, Benjamin L, and Lindsay C Page. 2015b. “Summer nudging: Can personal-
ized text messages and peer mentor outreach increase college going among low-income
high school graduates?” Journal of Economic Behavior & Organization, 115: 144–160.
Castleman, Benjamin L, and Lindsay C Page. 2016. “Freshman year financial aid nudges:
An experiment to increase FAFSA renewal and college persistence.” Journal of Human
Resources, 51(2): 389–415.
Castleman, Benjamin L, Laura Owen, and Lindsay C Page. 2015. “Stay late or start
early? Experimental evidence on the benefits of college matriculation support from
high schools versus colleges.” Economics of Education Review, 47: 168–179.
Castleman, Benjamin L, Lindsay C Page, and Korynn Schooley. 2014. “The Forgotten
Summer: Does the Offer of College Counseling After High School Mitigate Summer
Melt Among College-Intending, Low-Income High School Graduates?” Journal of Policy
Analysis and Management, 33(2): 320–344.
Chetty, Raj. 2015. “Behavioral Economics and Public Policy: A Pragmatic Perspective.”
American Economic Review, 105(5): 1–33.
Darolia, Rajeev. 2016. “An Experiment on Information Use in College Student Loan De-
cisions.” Federal Reserve Bank of Philadelphia Working Paper Series, , (16-18).
Deming, David, and Susan Dynarski. 2009. “Into college, out of poverty? Policies to
increase the postsecondary attainment of the poor.” National Bureau of Economic Re-
search.
27

Denning, Jeffrey T. 2017. “Born under a lucky star: Financial aid, college completion,
labor supply, and credit constraints.”
Dynarski, Susan, and Judith Scott-Clayton. 2016. “Tax Benefits for College Attendance.”
National Bureau of Economic Research.
Goldrick-Rab, Sara, Robert Kelchen, Doug Harris, and James Benson. 2016. “Reducing
Income Inequality In Educational Attainment:experimental Evidence On The Impact
Of Financial Aid On College Completion.” American Journal of Sociology.
Hastings, Justine S, and Jeffrey M Weinstein. 2008. “Information, school choice, and
academic achievement: Evidence from two experiments.” The Quarterly journal of eco-
nomics, 123(4): 1373–1414.
Hoxby, Caroline, and Sarah Turner. 2013. “Expanding college opportunities for high-
achieving, low income students.” Stanford Institute for Economic Policy Research Discus-
sion Paper, , (12-014).
Hoxby, Caroline M., and George B. Bulman. 2016. “The Effects of the Tax Deduction
for Postsecondary Tuition: Implications for Structuring Tax-Based Aid.” Economics of
Education Review.
ideas42. 2016. “Nudging for Success: Using behavioral science to improve the postsec-
ondary student journey.”
Internal Revenue Service. 2013a. “Publication 501 Exemptions, Standard Deduction, and
Filing Information.” Department of the Treasury.
Internal Revenue Service. 2013b. “Publication 596 Earned Income Credit.” Department
of the Treasury.
Internal Revenue Service. 2013c. “Publication 970 Tax Benefits for College.” Department
of the Treasury.
28

Jensen, Robert. 2010. “The (perceived) returns to education and the demand for school-
ing.” Quarterly Journal of Economics, 125(2).
Joint Committee on Taxation. 2017. “Estimates of Federal Tax Expenditures for Fiscal
Year 2016-2020.”
Kofoed, Michael S. 2017. “To Apply or Not to Apply: FAFSA Completion and Financial
Aid Gaps.” Research in Higher Education, 58(1): 1–39.
LaLumia, Sara, et al. 2012. “Tax preferences for higher education and adult college en-
rollment.” National Tax Journal, 65(1): 59–90.
Long, Bridget T. 2004. “The impact of federal tax credits for higher education expenses.”
In College choices: The economics of where to go, when to go, and how to pay for it. 101–168.
University of Chicago Press.
Manoli, Dayanand S, and Nicholas Turner. 2014a. “Cash-on-Hand & College Enroll-
ment: Evidence from Population Tax Data and Policy Nonlinearities.” National Bureau
of Economic Research.
Manoli, Dayanand S., and Nicholas Turner. 2014b. “Nudges and Learning: Evidence
from Informational Interventions for Low-Income Taxpayers.” National Bureau of Eco-
nomic Research Working Paper 20718.
National Center for Education Statistics. 2015. “Digest of Education Statistics: 2014.”
Romano, Joseph P, and Michael Wolf. 2005. “Stepwise multiple testing as formalized
data snooping.” Econometrica, 73(4): 1237–1282.
Saez, Emmanuel. 2009. “Details matter: The impact of presentation and information on
the take-up of financial incentives for retirement saving.” American Economic Journal:
Economic Policy, 1(1): 204–228.
29

Seftor, Neil S, and Sarah E Turner. 2002. “Back to school: Federal student aid policy and
adult college enrollment.” Journal of Human Resources, 336–352.
Turner, Nicholas. 2011a. “The Effect of Tax-based Federal Student Aid on College Enroll-
ment.” National Tax Journal, 64(3): 839–862.
Turner, Nicholas. 2011b. “Why Don’t Taxpayers Maximize their Tax-Based Student Aid?
Salience and Inertia in Program Selection.” The BE Journal of Economic Analysis & Policy,
11(1).
Turner, Nicholas. 2012. “Who benefits from student aid? The economic incidence of tax-
based federal student aid.” Economics of Education Review, 31(4): 463–481.
York, Benjamin N, and Susanna Loeb. 2014. “One step at a time: The effects of an early
literacy text messaging program for parents of preschoolers.” National Bureau of Eco-
nomic Research.
30
8 Figures and Tables
Figure 1: Example Email
31

Figure 2: Timeline
Enroll
ReApply
ReEnroll
1 Jan 2014
FAFSA Filing Open for 2014-15
18 Feb 2014
FAFSA Email
1 April 2014
First Tax Email
1 June 2014
Tax Letter
17 July 2014
Second Tax Email
Sept 2014
Enrollment
6 Nov 2013
1st Tax Email
Nov/Dec
Application Deadlines for Spring 2014
16 July 2014
2nd Tax Email
16 July 2014
2nd Tax Email
July/Aug
App. Deadlines for
Fall 2014
Sept 2014
Enrollment
17 Jan 2014
1st Tax Email
31 Jan 2014
Tax Filing Opens
25 Mar 2014
2nd Tax Email
15 April 2014
Tax Filing Deadline
Sept 2014
Enrollment
32

HS < 10 Students
80% of HS
80% Tax Treatment
20% FAFSA Treatment
20 % of HS
100% Control
HS >= 10 Students
80% of HS
60% Tax Treatment
20% FAFSA Treatment
20% Peer Treatment
20% of HS
100% Control
Figure 3: Enroll Treatment Randomization

Table 1: Treatment Summary
SamplesEnroll ReEnroll ReApply
Treatment ArmsCosts v. Benefits v Neutral X XSimple v Complex v More Tax Credits X X XSeparate FAFSA email XFAFSA reminder in Tax Email X X“Peer” Treatment X
TimingFirst Tax Email 1-Apr-2014 17-Jan-2014 6-Nov-2013Second Tax Email 16-Jul-2014 25-Mar-2014 16-Jul-2014Letter 1-Jun-2014Separate FAFSA Email 18-Feb-2014Outcome Fall 2014 Fall 2014 Spring 2014,
Fall 2014
34

Table 2: Summary Statistics
Enroll ReEnroll ReApply
Variables Mean Std. Dev Mean Std. Dev Mean Std. Dev
Male 0.45 0.50 0.43 0.49 0.43 0.50Hispanic, non-white 0.14 0.35 0.15 0.36 0.16 0.36Hispanic, white 0.25 0.43 0.22 0.42 0.25 0.43Black 0.14 0.34 0.13 0.33 0.15 0.36Asian 0.06 0.23 0.04 0.19 0.02 0.15Other Race 0.05 0.22 0.04 0.21 0.05 0.21Father, no high school 0.06 0.24 0.07 0.25 0.07 0.26Father, some high school 0.07 0.26 0.08 0.27 0.09 0.29Father, some college 0.13 0.33 0.16 0.36 0.13 0.34Father, college 0.19 0.39 0.17 0.37 0.12 0.32Father, graduate degree 0.12 0.32 0.09 0.28 0.07 0.25Father, associate degree 0.04 0.20 0.05 0.22 0.04 0.19Father, missing education 0.23 0.42 0.19 0.39 0.27 0.44Mother, no high school 0.05 0.22 0.06 0.24 0.06 0.24Mother, some high school 0.06 0.24 0.06 0.25 0.08 0.27Mother, some college 0.15 0.35 0.18 0.39 0.16 0.37Mother, college 0.22 0.41 0.19 0.39 0.13 0.34Mother, graduate degree 0.10 0.29 0.07 0.26 0.06 0.23Mother, associate degree 0.07 0.25 0.07 0.26 0.06 0.24Mother, missing education 0.20 0.40 0.17 0.37 0.24 0.43Income, 0 to 39k 0.19 0.40 0.14 0.35 0.12 0.32Income, 40k to 79k 0.15 0.36 0.10 0.30 0.07 0.25Income 80k or greater 0.34 0.47 0.16 0.36 0.12 0.32Enroll, Anywhere 0.73 0.45 0.63 0.48 0.44 0.50Enrolled, Texas 2yr 0.22 0.41 0.25 0.43 0.17 0.38Enrolled, Texas 4 yr 0.45 0.50 0.36 0.48 0.13 0.34Freshman 0.60 0.49Sophomore 0.25 0.43Junior 0.09 0.29Senior 0.06 0.23
N 80,802 434,887 526,614This table presents summary statistics for the three different analytic samples in thisstudy. See the text for a description of the data.
35

Table 3: Balance of Covariates
Male White Father Mother Income Predicted FreshmanCol. Deg Col. Deg 80k+ Enroll
EnrollTreatment 0.012* 0.006 0.008 0.001 0.002 -0.002
(0.007) (0.027) (0.015) (0.016) (0.022) (0.007)
Peer 0.007 -0.008 0.011 0.002 0.003 -0.003(0.008) (0.027) (0.015) (0.017) (0.022) (0.007)
Observations 80,802 80,802 80,802 80,802 80,802 80,802ReEnrollTreatment 0.000 0.002 0.001 0.000 0.000 0.000 0.001
(0.019) (0.019) (0.014) (0.015) (0.014) (0.006) (0.019)
Observations 434,887 434,887 434,887 434,887 434,887 434,887 434,887
ReApplyTreatment -0.004** 0.001 0.001 0.000 0.000 0.000
(0.002) (0.002) (0.001) (0.001) (0.001) (0.000)
Observations 526,614 526,614 526,614 526,614 526,614 526,614
This table checks to see if student characterisitcs vary by treatment assignment. Robuststandard errors are in parenthesis for the ReEnroll and ReApply groups, and standarderrors clustered on high school are presented for the Enroll group with * p<.1 ** p<.05 ***p<.01
36

Table 4: Enroll Results
Any Enrollment Public 2yr, TX Public 4yr, TX Grants Loans File FAFSAA. Intent to TreatTreatment -0.008 -0.008 -0.002 -111.8 75.7 -0.001
(0.008) (0.006) (0.008) (85.3) (80.4) (0.009)
Peer -0.004 -0.009 0.002 -122.2 55.54 -0.001(0.008) (0.007) (0.008) (91.76) (85.98) (0.010)
Demographics Yes Yes Yes Yes Yes Yes
B. Instrumental Variables
Open Email -0.017 -0.018 -0.004(0.017) (0.014) (0.018)
Peer -0.004 -0.009 0.002(0.008) (0.007) (0.008)
Control Mean 0.733 0.224 0.458 4352.2 2413.7 0.658Demographics Yes Yes Yes Yes Yes Yes
C. First StageTreatment .431***
(.004)
Demographics YesObservations 80,802 80,802 80,802 80,802 80,802 80,802
This table examines the effect of an mail and email intervention to high school seniors who graduated in 2014. The outcomeconsidered is enrollment in the Fall of 2014. Panel A shows the intent to treat estimates of sending emails and letter. Studentswho only received a FAFSA email are not included in this estimation. Panel B shows the effect of students opening the emailand Panel C is the first stage where opening the email is the outcome. Standard errors are clustered at the high school leveland are in parenthesis with * p<.1 ** p<.05 *** p<.01
37
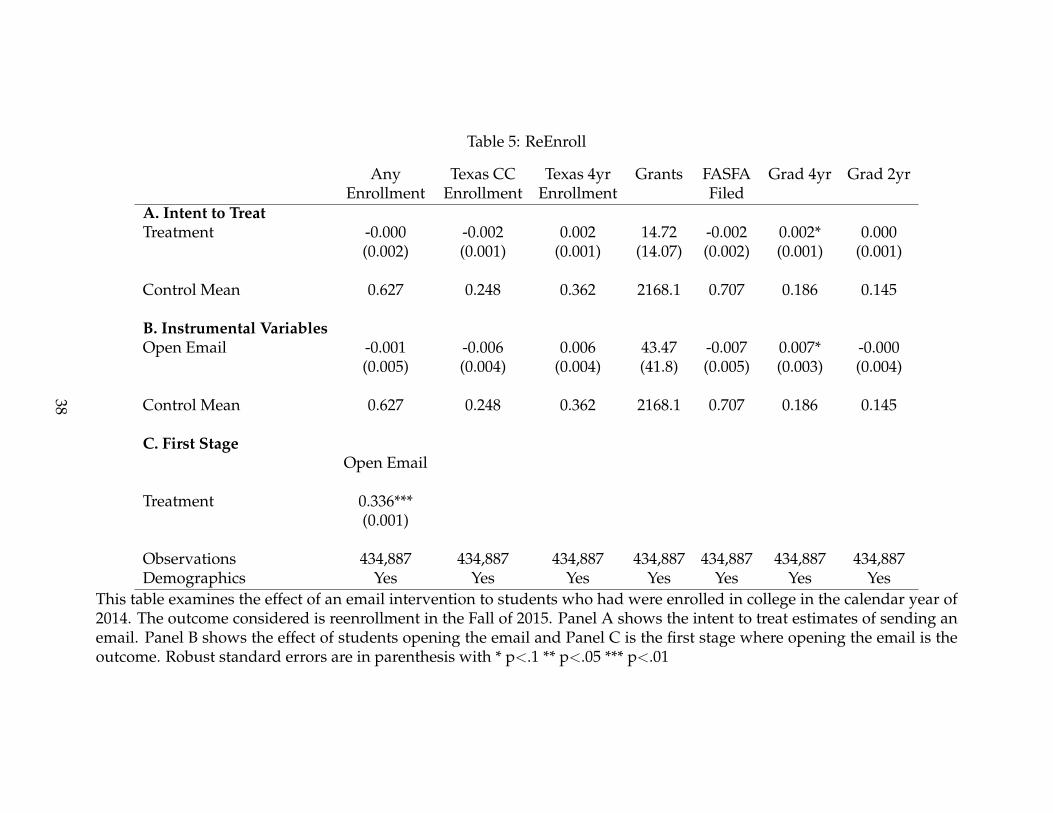
Table 5: ReEnroll
Any Texas CC Texas 4yr Grants FASFA Grad 4yr Grad 2yrEnrollment Enrollment Enrollment Filed
A. Intent to TreatTreatment -0.000 -0.002 0.002 14.72 -0.002 0.002* 0.000
(0.002) (0.001) (0.001) (14.07) (0.002) (0.001) (0.001)
Control Mean 0.627 0.248 0.362 2168.1 0.707 0.186 0.145
B. Instrumental VariablesOpen Email -0.001 -0.006 0.006 43.47 -0.007 0.007* -0.000
(0.005) (0.004) (0.004) (41.8) (0.005) (0.003) (0.004)
Control Mean 0.627 0.248 0.362 2168.1 0.707 0.186 0.145
C. First StageOpen Email
Treatment 0.336***(0.001)
Observations 434,887 434,887 434,887 434,887 434,887 434,887 434,887Demographics Yes Yes Yes Yes Yes Yes Yes
This table examines the effect of an email intervention to students who had were enrolled in college in the calendar year of2014. The outcome considered is reenrollment in the Fall of 2015. Panel A shows the intent to treat estimates of sending anemail. Panel B shows the effect of students opening the email and Panel C is the first stage where opening the email is theoutcome. Robust standard errors are in parenthesis with * p<.1 ** p<.05 *** p<.01
38

Table 6: ReApply Results
Enroll, Enroll 2yr Enroll 4y Enroll CC Enroll 4y Grants Loans FileFall 14 TX, Fall 14 TX, Fall 14 Spr 14 Spr 14 FAFSA
A. Intent to TreatTreatment 0.001 -0.001 0.001 0.000 0.000 -21.4* -16.1 -0.001
(0.002) (0.001) (0.001) (0.001) (0.001) (12.2) (12.4) (0.001)
B. Instrumental VariablesOpened Email 0.003 -0.002 0.005 -0.001 0.001 -97.8* -74.300 -0.004
(0.007) (0.006) (0.005) (0.006) (0.004) (56.2) (57.1) (0.006)
Control Mean 0.444 0.173 0.13 0.264 0.129 1399.3 1028.6 0.269
C. First StageOpen Email
Treatment 0.217***(0.001)
Demographics Yes Yes Yes Yes Yes Yes Yes Yes
Observations 526,614 526,614 526,614 526,614 526,614 526,614 526,614 526,614This table examines the effect of an email intervention to students who had applied to college from 2011-12 to 2012-13 butdid not enroll in public colleges or universities in Texas. The outcome considered is enrollment in Spring or Fall of 2014.Panel A shows the intent to treat estimates of sending an email. Panel B shows the effect of students opening the email andPanel C is the first stage where opening the email is the outcome. Robust standard errors are in parenthesis with * p<.1 **p<.05 *** p<.01
39

Table 7: Framing
Enroll Reenroll ReApplyA. ComplexitySimple, 2 Tax Credits -0.004 -0.001 0.000
(0.008) (0.002) (0.002)
Simple, 4 Tax Credits -0.009 -0.002 0.001(0.008) (0.002) (0.002)
Complex, 2 Tax Credits -0.010 0.003 0.000(0.008) (0.002) (0.002)
Peer -0.004-0.00806
B. Costs vs BenefitsBenefits -0.008 0.000 0.003
(0.008) (0.002) (0.002)
Costs -0.008 -0.001(0.008) (0.002)
Neutral -0.006 0.000 0.000(0.008) (0.002) (0.002)
Peer -0.004(0.008)
Control Mean 0.733 0.627 0.444
Observations 80,802 434,887 526,614This table examines the effect of an the types of messages that students received. Theoutcome considered is enrollment the Fall of 2014. Panel A shows the intent to treatestimates of sending an email. Panel B shows the effect of students opening the emailand. Robust standard errors are in parenthesis for the ReEnroll and ReApply groups, andstandard errors clustered on high school are presented for the Enroll group with * p<.1 **p<.05 *** p<.01
40

Table 8: FAFSA Treatment
Enroll Filed a Fafsa
FAFSA, simple -0.011 -0.007(0.008) (0.010)
FAFSA, complex -0.006 -0.003(0.008) (0.010)
Tax Treatment 0.001 0.004(0.004) (0.004)
Peer -0.004 -0.001(0.008) (0.010)
Mean for Untreated 0.733 0.658
Demographics Yes Yes
N 96,330 96,330This table examines the effect of emails about the FAFSA on enrollment. The sample iscomposed of students how had applied to college but not yet enrolled. Standard errorsclustered on high school are presented for the enroll group with * p<.1 ** p<.05 *** p<.01
41

A Description of Tax Credits for College
This section describes tax benefits for college in more detail. The rules described apply
to the 2013 tax year but are similar to the 2016 tax year. The information for this sections
comes from IRS publications 970, 596, and 501. (Internal Revenue Service, 2013a,b,c)
First, the American Opportunity Tax Credit (AOTC) started in the 2009 tax year. Stu-
dents are eligible if they are pursuing a degree, are enrolled at least half time, have not
finished the first four years of higher education, and have not claimed the AOTC or Hope
credit for more than four tax years, and have no felony drug convictions. The maximum
value of this tax credit is $2,500 of which $1,000 is refundable. This means that even if a
family has no tax liability, they can receive up to $1,000 as a tax refund.
Second, the tuition and fees deduction allows tax files to deduct up to $4,000 of qual-
ified educational expenses from taxable income. Filers cannot claim the tuition and fees
deduction and the AOTC for the same student in the same tax year. Also, the tax filer’s
income must be less than $160,000 if married filing jointly or $80,000 if the tax filer is
single.
Third, the Lifetime Learning Credit(LLC) is a nonrefundable tax credit that has a max-
imum of $2,000. In order to claim the credit, tax filers who file jointly must have an
income of less than $127,000 or $63,000 if single. There is no limit on the number of years
this credit can be claimed. Tax filers cannot claim the LLC in the same year they claim the
tuition and fees deduction. Tax filers also cannot claim the LLC and AOTC on the same
expenses.
Fourth, students may qualify taxpayers for the dependent exemption. In order to
qualify for a dependent exemption, children must be under the age of 19 at the end of the
year unless they are enrolled in college. If a child is enrolled in college, they qualify their
parents for a dependent exemption until they are 24 years old. In 2013, the dependent
exemption was $3,900.
Finally, the Earned Income Tax Credit (EITC) is a refundable tax credit for tax filers
42

with low to moderate income. Tax filers must have earned income to qualify for the
credit and the exact amount of the refund depends on the family structure and income
of the tax filer. Importantly, additional qualifying children can increase the tax benefit.
Children must be under age 19 at the end of the tax year unless they are a student, in
which case they must be under age 24. Hence, if a student enrolls in college their parents
may qualify for a higher EITC benefit.
43