Embed Size (px)
Citation preview

GRA
DE
7
© e-classroom www.e-classroom.co.za
Grad
e 7
Term
1: S
ocia
l Sci
ence
s – G
eogr
aphy
– D
istan
ce a
nd sc
ale
Name:
Distance and scale
USING A MAP SCALE
Maps use a scale to show sizes and distances in a way that people can understand. A scale compares actual distance on the ground to distance on the map.
On the scale below, one actual kilometre is represented by 1 centimetre on the map.
1cm = 1km
North Beach Ushaka Harbour Bluff
1. How many kilometres is it between North Beach and the Bluff? ___________________________
2. How many kilometres is it between uShaka and Bluff? ___________________________
3. How many kilometres is it between Harbour and North Beach? ___________________________
On this scale, one centimetre represents five kilometres.
1c= 5km
South Beach North Beach Blue Lagoon La Lucia
1 2 3 4 5
1 2 3 4 5
0 1
0 1
GRA
DE
7
© e-classroom www.e-classroom.co.za
Grad
e 7
Term
1: S
ocia
l Sci
ence
s – G
eogr
aphy
– D
istan
ce a
nd sc
ale
4. How many kilometres is it between South Beach and La Lucia? ________________
5. How many kilometres is it between North Beach and La Lucia? ________________
6. How many kilometres is it between Blue Lagoon and South Beach?_____________
7. How many kilometres is it between South Beach and Blue Lagoon?_____________

GRA
DE
7
© e-classroom www.e-classroom.co.za
Grad
e 7
Term
1: S
ocia
l Sci
ence
s – G
eogr
aphy
– D
istan
ce a
nd sc
ale
MAP SCALE PRACTICE
Maps can be drawn to represent a variety of information. This information might include things such as roads, buildings or distance. To measure distance on a map, we use a map scale. Different maps call for different types of measurements, so we must choose an appropriate map scale to use.For Example, the scale of 1cm = 1m would not suit a map of a city because a city is too large to be measured in metres.
Below is a list of different types of maps and map scales. Draw a line from each map on the left to a map scale on the right that would best suit it.
1. A map of the city of Johannesburg
2. A map of the Earth
3. A map of the aquarium
4. A map of your bathroom
5. A map of your house
6. A map of your local park
7. A map of your local mall
8. A map of a dog house
9. A map of the Indian Ocean
10. A map of your school
0 50
0
1cm = 50km
0 250
1cm = 250km
1cm = km12
12
0 1000
1cm = 1000km
0 1
0 10
1cm = 1m
1cm = 10m
GRA
DE
7
© e-classroom www.e-classroom.co.za
Grad
e 7
Term
1: S
ocia
l Sci
ence
s – G
eogr
aphy
– D
istan
ce a
nd sc
ale
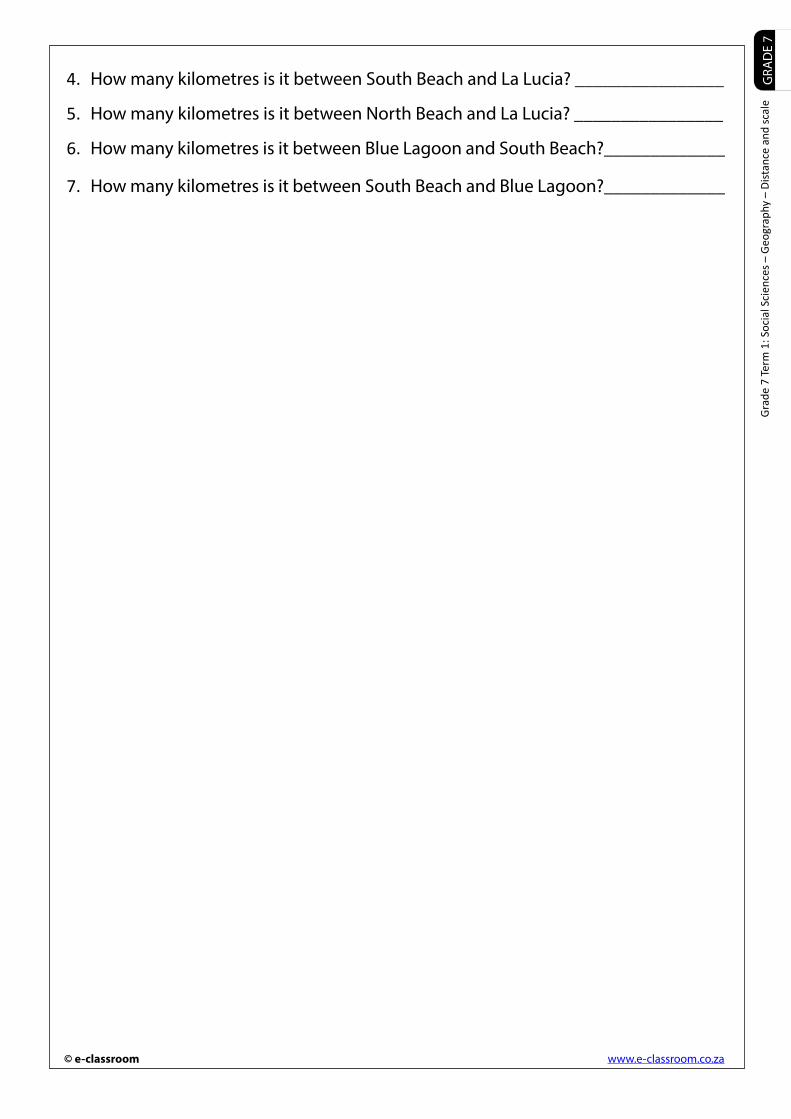
SCALEA scale shows the relationship between a distance on the map and the corresponding distance on the ground. Every map must have a scale as maps are drawn many times smaller than reality. The scale is used for finding distances and areas. The scale on a map shows how many times the land has been reduced (i.e. made smaller) in order to fit it on the map.E.g. 1:10 000 means that the land has been reduced 10 000 times in order to fit it onto the map.
The map below is drawn much smaller than the actual Earth’s surface.
1. How far is it, on the ground, from Pretoria to the Bridge? __________________
2. How far is it, on the ground, from Pretoria to Warmbaths (now called Bele-Bele)? __________________
Pretoria
Pretoria
MAP
LAND Warmbaths
one centimetre on the ground is represented by one centimetre on
the map
Warmbaths
Portion of a map
0 1 2 3 4 5 6 7 8 9 10
0 1 2 3 4 5 6 7 8 9 10 11 12 13 14

GRA
DE
7
© e-classroom www.e-classroom.co.za
Grad
e 7
Term
1: S
ocia
l Sci
ence
s – G
eogr
aphy
– D
istan
ce a
nd sc
ale
MAP ASCALE 1:2 000 000 000
MAP BSCALE 1:50 000 000
MAP CSCALE 1:100 000
1. How many times smaller than real life size is:
Map A __________________________________Map B __________________________________Map C __________________________________
2. Which map shows KwaZulu-Natal in the most detail? ________________
3. What is the scale of the map that shows:
The most detail: _______________________________
The least detail: _______________________________
4. When the scale number is bigger, what happens to the amount of detail on a map?

GRA
DE
7
© e-classroom www.e-classroom.co.za
Grad
e 7
Term
1: S
ocia
l Sci
ence
s – G
eogr
aphy
– D
istan
ce a
nd sc
ale
TYPES OF SCALE
Your scale is always given in centimetres unless you are told otherwise.
1. Word Scale
The word scale is a written statement.For example, one centimetre on the map represents one kilometre in reality.
2. Linear Scale
A linear scale is a line scale. The line has been divided into equal distances apart. This enables you to read the actual distance directly from the scale.For example, the line scale below 1 centimetre can represent 1000 metres or _____kilometre.
Draw a Line scale for the following statements:
1.One centimetre on the map represents one thousand kilometres in reality
___________________________________________________________
2.One centimetre on the map represents five hundred kilometres in reality
___________________________________________________________
3.One centimetre on the map represents four hundred kilometres in reality
___________________________________________________________
4.One centimetre on the map represents one hundred kilometres in reality
___________________________________________________________
5.One centimetre on the map represents two hundred kilometres in reality
___________________________________________________________
The scale on a map is “1cm to 1km”. Show how many kilometres in real life are represented by
1. 2 cm on the map______________________
GRA
DE
7
© e-classroom www.e-classroom.co.za
Grad
e 7
Term
1: S
ocia
l Sci
ence
s – G
eogr
aphy
– D
istan
ce a
nd sc
ale
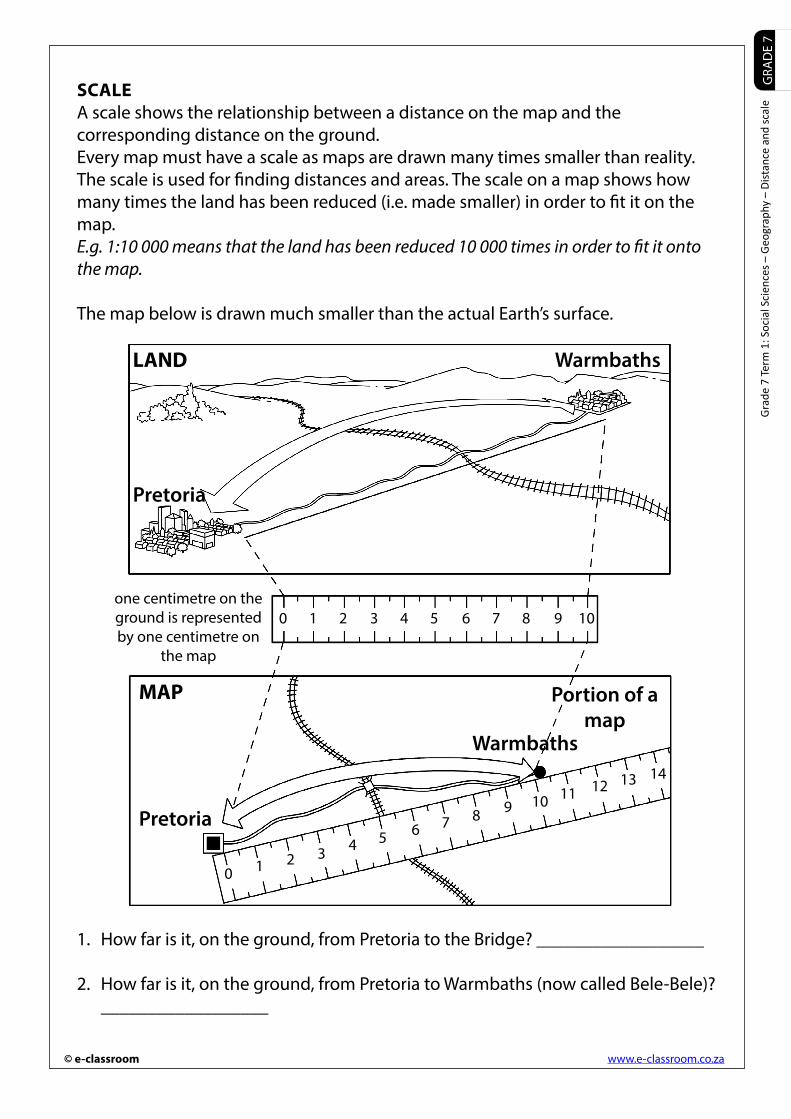
2. 4 cm on the map______________________
3. 10 cm on the map______________________
4. 5 cm on the map______________________
5. 15 cm on the map______________________
6. 100 cm on the map______________________
The map below has a scale of 1cm to 10km.
A. By using the line scale estimate the distance in kilometres.
1. Calculate the approximate distance in real life from the centre of Jerney to the centre of Sarky. _________________________________________________
2. Calculate the approximate distance in real life from the centre of Gurnley and the centre of Olderney. _______________________________________________________________________
B. Now measure the distance in centimetres with your ruler and then convert into kilometres by using the scale 1cm to 10 km.
1. Calculate the approximate distance in real life from the centre of Jerney to the centre of Sarky. _________________________________________________________________________________________________________________________
2. Calculate the approximate distance in real life from the centre of Gurnley and the centre of Olderney. ______________________________________________________________________________________________________________________
3. Calculate the total distance an aeroplane would fly from Gurnley, stopping at Sarky and landing at Olderney. ____________________________________________________________________________________________________________
GRA
DE
7
© e-classroom www.e-classroom.co.za
Grad
e 7
Term
1: S
ocia
l Sci
ence
s – G
eogr
aphy
– D
istan
ce a
nd sc
ale
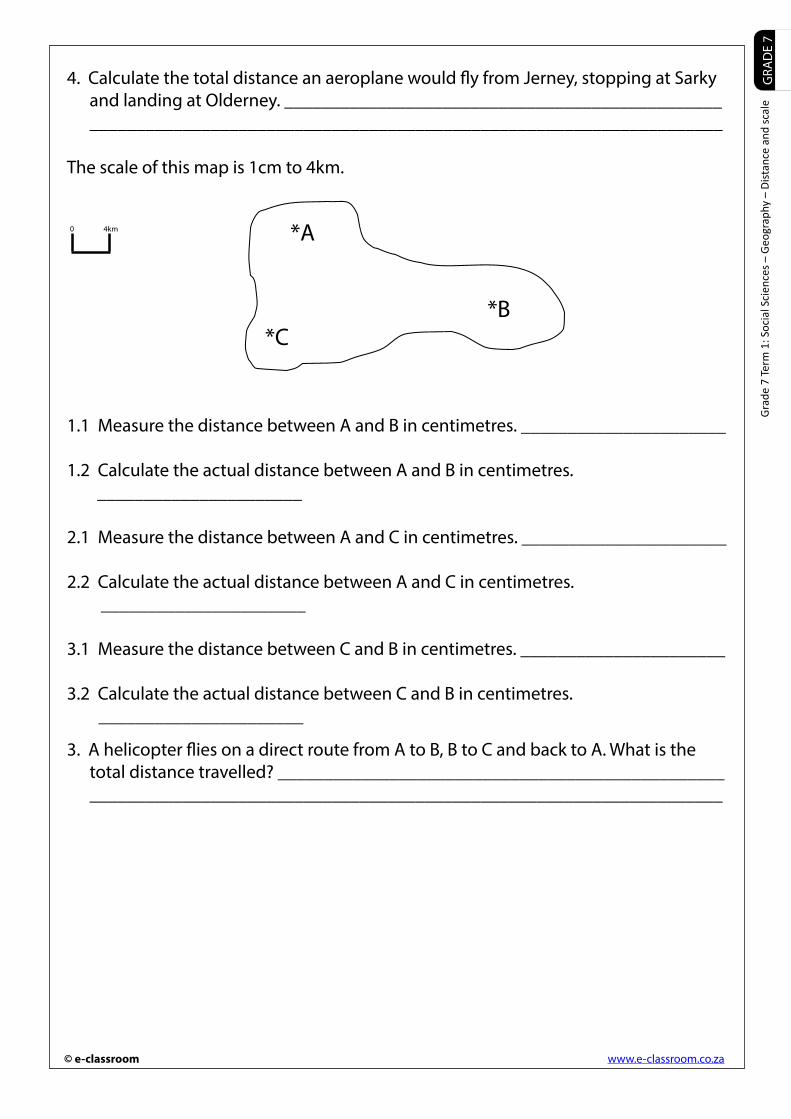
4. Calculate the total distance an aeroplane would fly from Jerney, stopping at Sarky and landing at Olderney. ___________________________________________________________________________________________________________________
The scale of this map is 1cm to 4km.
1.1 Measure the distance between A and B in centimetres. ______________________
1.2 Calculate the actual distance between A and B in centimetres. ______________________
2.1 Measure the distance between A and C in centimetres. ______________________
2.2 Calculate the actual distance between A and C in centimetres. ______________________
3.1 Measure the distance between C and B in centimetres. ______________________
3.2 Calculate the actual distance between C and B in centimetres. ______________________
3. A helicopter flies on a direct route from A to B, B to C and back to A. What is the total distance travelled? ____________________________________________________________________________________________________________________
0 4km
*A
*B*C
GRA
DE
7
© e-classroom www.e-classroom.co.za
Grad
e 7
Term
1: S
ocia
l Sci
ence
s – G
eogr
aphy
– D
istan
ce a
nd sc
ale
Memorandum
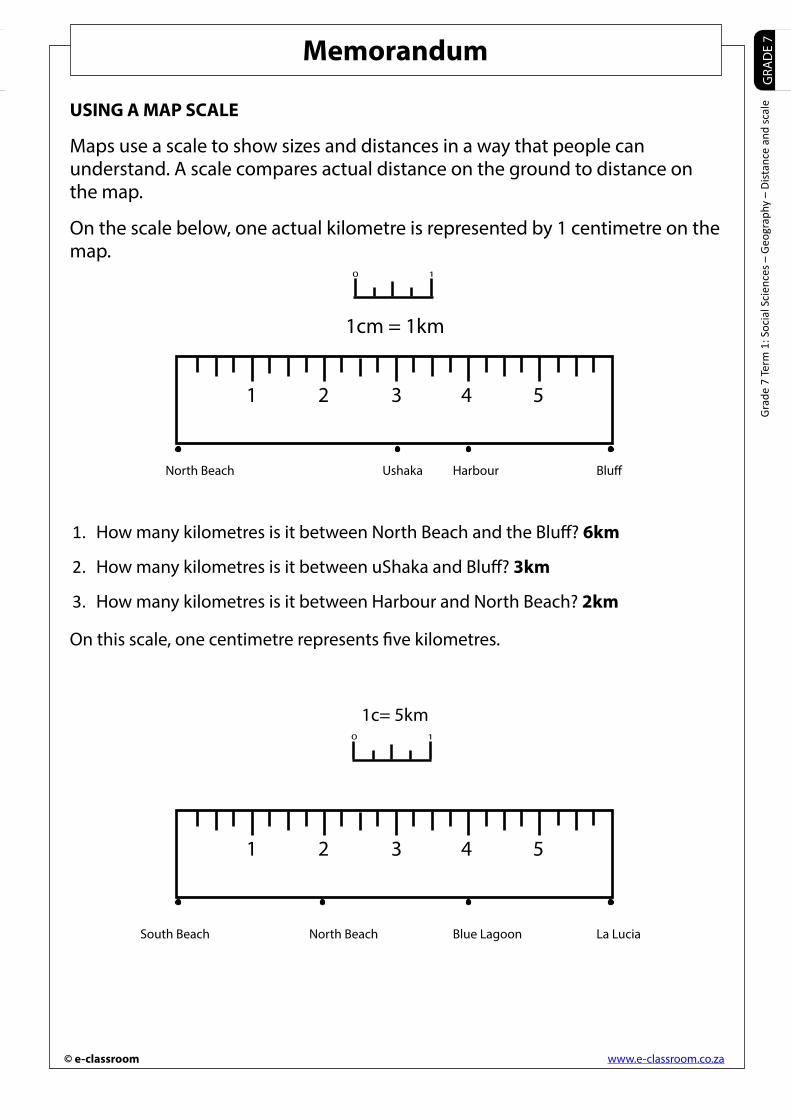
USING A MAP SCALE
Maps use a scale to show sizes and distances in a way that people can understand. A scale compares actual distance on the ground to distance on the map.
On the scale below, one actual kilometre is represented by 1 centimetre on the map.
1cm = 1km
North Beach Ushaka Harbour Bluff
1. How many kilometres is it between North Beach and the Bluff? 6km
2. How many kilometres is it between uShaka and Bluff? 3km
3. How many kilometres is it between Harbour and North Beach? 2km
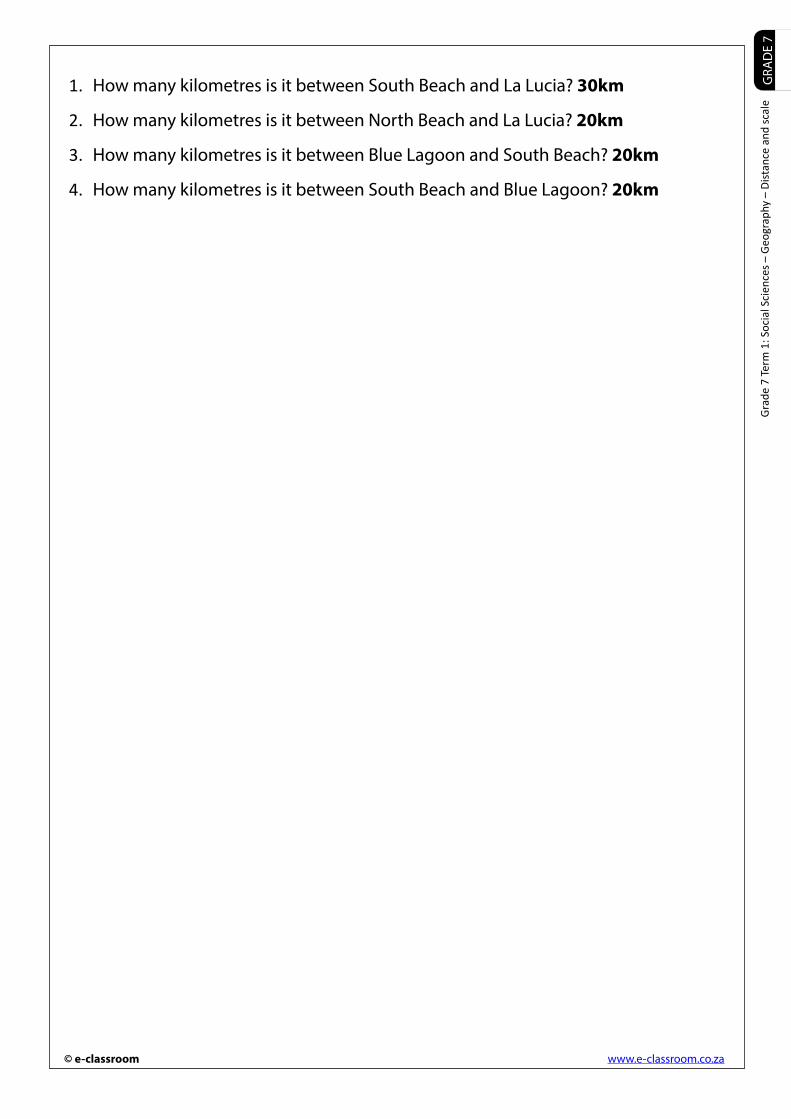
On this scale, one centimetre represents five kilometres.
1c= 5km
South Beach North Beach Blue Lagoon La Lucia
1 2 3 4 5
1 2 3 4 5
0 1
0 1
GRA
DE
7
© e-classroom www.e-classroom.co.za
Grad
e 7
Term
1: S
ocia
l Sci
ence
s – G
eogr
aphy
– D
istan
ce a
nd sc
ale
1. How many kilometres is it between South Beach and La Lucia? 30km
2. How many kilometres is it between North Beach and La Lucia? 20km
3. How many kilometres is it between Blue Lagoon and South Beach? 20km
4. How many kilometres is it between South Beach and Blue Lagoon? 20km

GRA
DE
7
© e-classroom www.e-classroom.co.za
Grad
e 7
Term
1: S
ocia
l Sci
ence
s – G
eogr
aphy
– D
istan
ce a
nd sc
ale
MAP SCALE PRACTICE
Maps can be drawn to represent a variety of information. This information might include things such as roads, buildings or distance. To measure distance on a map, we use a map scale. Different maps call for different types of measurements, so we must choose an appropriate map scale to use.For Example, the scale of 1cm = 1m would not suit a map of a city because a city is too large to be measured in metres.
Below is a list of different types of maps and map scales. Draw a line from each map on the left to a map scale on the right that would best suit it.
1. A map of the city of Johannesburg
2. A map of the Earth
3. A map of the aquarium
4. A map of your bathroom
5. A map of your house
6. A map of your local park
7. A map of your local mall
8. A map of a dog house
9. A map of the Indian Ocean
10. A map of your school
Learner’s answers may vary.
0 50
0
1cm = 50km
0 250
1cm = 250km
1cm = km12
12
0 1000
1cm = 1000km
0 1
0 10
1cm = 1m
1cm = 10m
GRA
DE
7
© e-classroom www.e-classroom.co.za
Grad
e 7
Term
1: S
ocia
l Sci
ence
s – G
eogr
aphy
– D
istan
ce a
nd sc
ale
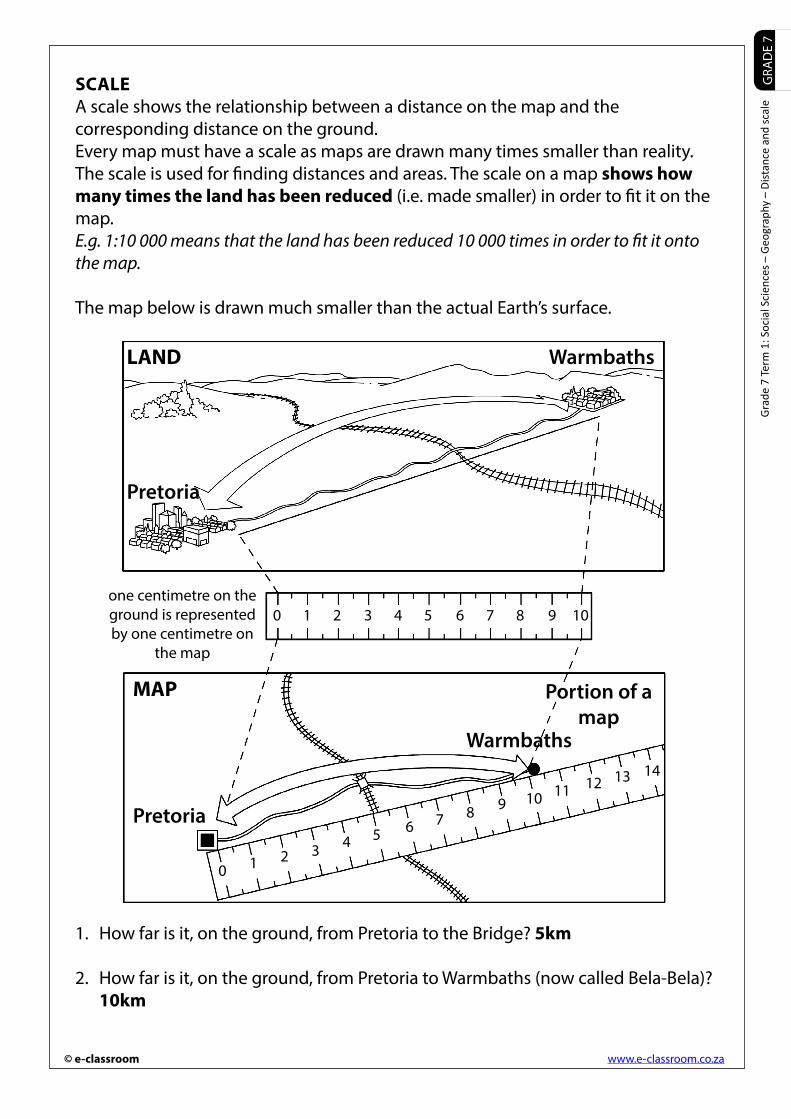
SCALEA scale shows the relationship between a distance on the map and the corresponding distance on the ground. Every map must have a scale as maps are drawn many times smaller than reality. The scale is used for finding distances and areas. The scale on a map shows how many times the land has been reduced (i.e. made smaller) in order to fit it on the map.E.g. 1:10 000 means that the land has been reduced 10 000 times in order to fit it onto the map.
The map below is drawn much smaller than the actual Earth’s surface.
1. How far is it, on the ground, from Pretoria to the Bridge? 5km
2. How far is it, on the ground, from Pretoria to Warmbaths (now called Bela-Bela)? 10km
Pretoria
Pretoria
MAP
LAND Warmbaths
one centimetre on the ground is represented by one centimetre on
the map
Warmbaths
Portion of a map
0 1 2 3 4 5 6 7 8 9 10
0 1 2 3 4 5 6 7 8 9 10 11 12 13 14

GRA
DE
7
© e-classroom www.e-classroom.co.za
Grad
e 7
Term
1: S
ocia
l Sci
ence
s – G
eogr
aphy
– D
istan
ce a
nd sc
ale
MAP ASCALE 1:2 000 000 000
MAP BSCALE 1:50 000 000
MAP CSCALE 1:100 000
1. How many times smaller than real life size is:
Map A 2 000 000 000Map B 50 000 000Map C 100 000
2. Which map shows KwaZulu-Natal in the most detail? C
3. What is the scale of the map that shows:
The most detail: C
The least detail: A
4. When the scale number is bigger, what happens to the amount of detail on a map?
The detail gets less

GRA
DE
7
© e-classroom www.e-classroom.co.za
Grad
e 7
Term
1: S
ocia
l Sci
ence
s – G
eogr
aphy
– D
istan
ce a
nd sc
ale
TYPES OF SCALEYour scale is always given in centimetres unless you are told otherwise.
1. Word Scale
The word scale is a written statement.For example, one centimetre on the map represents one kilometre in reality.
2. Linear Scale
A linear scale is a line scale. The line has been divided into equal distances apart. This enables you to read the actual distance directly from the scale.For example, the line scale below 1 centimetre can represent 1000 metres or 1kilometre.
Draw a Line scale for the following statements:
1. One centimetre on the map represents one thousand kilometres in reality
2. One centimetre on the map represents five hundred kilometres in reality
3. One centimetre on the map represents four hundred kilometres in reality
4. One centimetre on the map represents one hundred kilometres in reality
5. One centimetre on the map represents two hundred kilometres in reality
The scale on a map is “1cm to 1km”. Show how many kilometres in real life are represented by
1. 2cm on the map 2km
2. 4cm on the map 4km
3. 10cm on the map 10km
4. 5cm on the map 5km
0
0
0
0
0
1000
500
400
100
200
2000
1000
800
200
400
3000
1500
1200
300
600
4000
2000
1600
400
800
5000 Kilometres
2500 Kilometres
2000 Kilometres
500 Kilometres
1000 Kilometres
1: 1000
1: 500
1: 400
1: 100
1: 200
GRA
DE
7
© e-classroom www.e-classroom.co.za
Grad
e 7
Term
1: S
ocia
l Sci
ence
s – G
eogr
aphy
– D
istan
ce a
nd sc
ale
5. 15cm on the map 15km
6. 100cm on the map 100km