Embed Size (px)
Citation preview
Distance transform: a tool for the study of animal colour
patterns
Christopher H. Taylor*, FrancisGilbert and TomReader
School of Biology, University of Nottingham, University Park Campus, Nottingham, NG7 2RD, UK
Summary
1. The information in animal colour patterns plays a key role in many ecological interactions; quantification
would help us to study them, but this is problematic. Comparing patterns using human judgement is subjective
and inconsistent. Traditional shape analysis is unsuitable as patterns do not usually contain conserved land-
marks. Alternative statistical approaches also have weaknesses, particularly as they are generally based on
summarymeasures that discardmost or all of the spatial information in a pattern.
2. We present a method for quantifying the similarity of a pair of patterns based on the distance transform of a
binary image. The method compares the whole pattern, pixel by pixel, while being robust to small spatial
variations among images.
3. We demonstrate the utility of the distance transform method using three ecological examples. We generate a
measure of mimetic accuracy between hoverflies (Diptera: Syrphidae) and wasps (Hymenoptera) based on
abdominal pattern and show that this correlates strongly with the perception of a model predator (humans). We
calculate similarity values within a group of mimetic butterflies and compare this with proposed pairings of
M€ullerian comimics. Finally, we characterise variation in clypeal badges of a paper wasp (Polistes dominula) and
compare this with previousmeasures of variation.
4. While our results generally support the findings of existing studies that have used simpler ad hocmethods for
measuring differences between patterns, our method is able to detect more subtle variation and hence reveal
previously overlooked trends.
Key-words: image analysis, individual recognition,MATLAB,mimicry, signalling, similarity
Introduction
Colour patterns play a key role in many animal interactions
(Cott 1940). Signal receiversmust discriminate among patterns
with significant information content, such as social dominance
(Møller 1988) or toxicity (Brodie 1993). To understand such
decisions fully, we need a way of extracting the information
contained in the colour pattern observed. There exist effective
standardisedmethods for comparing colours (Endler &Mielke
2005; Stoddard 2012), but ways of quantifying the spatial
aspect of a pattern are less well developed.
Humans have extremely good visual capabilities and cogni-
tion (Pinker 1984) and hence, when studying colour patterns,
often find it easy to make qualitative decisions about the infor-
mation in a signal and classify the patterns appropriately.
However, if asked to articulate rigorously and precisely the
reasons behind such decisions, we find this far more difficult.
This means that the outcome of such comparisons is subjective
and inconsistent. Furthermore, humans, like all species,
perceive the world in a way that is subtly constrained by their
sensory and cognitive abilities. Differences in factors such as
spatial resolution and spectral sensitivity, as well as higher
processing, mean that the human perception on which a judge-
ment is based may not accurately reflect that of the most
relevant signal receiver (Endler 1990).
An alternative is therefore to use automated, computer-
basedmethods for comparing patterns. Traditionalmethods of
shape analysis are inappropriate, as they rely on the selection,
eithermanual or automatic (Boyer et al. 2011), of homologous
landmarks. These are unlikely to exist in colour patterns, espe-
cially when comparing disparate taxa, such as will often be the
case in examples ofmimicry. To capture pattern information in
amore flexibleway, there are twomain types of approach, both
well developed in computer science. The first involves ‘feature
extraction’: creating a statistical summary for each of the
patterns under study, often based on properties of the image in
the frequency domain using Fourier transforms (Zhang & Lu
2002), or on ‘moment invariants’ (Khotanzad & Yaw Hua
1990). A simple measure such as Euclidean distance between
two summary vectors can then give the dissimilarity between
two patterns (Zhang & Lu 2003). This type of method is
commonly used in image retrieval algorithms, where an image
is sought within a large database that shares similar properties
to a target image (Rui,Huang&Chang 1999).
The second approach involves direct comparison of individ-
ual pixels or regions of pixels through, for example, cross-
correlation (Briechle &Hanebeck 2001) or the sum of absolute*Correspondence author. E-mail: [email protected]
© 2013 The Authors. Methods in Ecology and Evolution © 2013 British Ecological Society
This is an open access article under the terms of the Creative Commons Attribution-NonCommercial License, which permits use, distribution
and reproduction in any medium, provided the original work is properly cited and is not used for commercial purposes.
Methods in Ecology and Evolution 2013, 4, 771–781 doi: 10.1111/2041-210X.12063
differences (Goshtasby 2005). Thismethod, known as template
matching, is commonly used for image registration (Zitov�a &
Flusser 2003). The key point here is that it compares whole
images, pixel by pixel, before the information is summarised.
By contrast, in feature extraction, the images are first summar-
ised and then compared. Thus, template matching is sensitive
to differences in specific features within the pattern (e.g. partic-
ular spots or stripes), while feature extraction is based on the
overall attributes of the pattern.
In a biological context, several authors have used Fourier
transforms to facilitate comparison of general pattern proper-
ties, such as in striped coats of mammals (Godfrey, Lythgoe &
Rumball 1987), cuttlefish displays (Barbosa et al. 2008) and
spots on bird eggs (Stoddard & Stevens 2010). Endler (2012)
suggests a slightly different approach, counting the number of
transitions from one colour to another in ‘adjacency analysis’.
However, all of these cases adopt an ‘image retrieval’-type
approach, in which the image is simplified to a few summary
values before the comparison with another image takes place.
In doing so, specific spatial information regarding the location
of particular pattern features is discarded.
In some cases, this is not a problem and could even be an
advantage. For example, in egg mimicry, the pattern on each
host egg is unique. The mimetic egg therefore resembles the
overall features and type of pattern of a host egg rather than
the exact locations of pigment blotches (Stoddard & Stevens
2010), and so the use of summary variables is more appropriate
than a consideration of individual pattern elements. On the
other hand, for strongly stereotyped patterns, such as those
seen in many insect mimicry complexes (see e.g. Cott 1940;
Ruxton, Sherratt & Speed 2004), the precise shape and posi-
tion of pattern features may be important. In summarising, we
risk discarding pertinent information, and what is retained will
depend upon the statistics chosen, increasing subjectivity.
By contrast, the ‘templatematching’ approach of comparing
specific features within an image has very rarely been applied
to biological colour patterns. A simple version was used by
Williams (2007), who subdivided bumblebee patterns into 27
regions, each of which, within individuals, is usually occupied
by a uniform colour. The patterns can then be compared
region by region. This approach can be effective, but is limited
by the fact that colour boundaries in a given individual may
not exactly coincide with the predefined regions; it relies upon
creating discrete homologous categories in patterns which are
often continuous in nature.Williams’ (2007) division of a bum-
blebee pattern into 27 regions is able to detect the presence or
absence of a spot or stripe, but not its exact outline.
To make the subdivision method more sensitive, we can use
more regions. The logical extreme is to divide the pattern into
as many separate regions as possible; in practical terms, for a
pattern recorded as a 2D digital image, regions would be the
individual pixels of the image. We can then score the dissimi-
larity at each pixel location and take the sum of all such values;
this method is known as the sum of absolute differences
(Goshtasby 2005). The dissimilarity score could be a simple
match or mismatch for binary images or a difference in bright-
ness for greyscale. Unfortunately, increasing the number of
regions introduces a different problem, which is that common
features between the two images must line up exactly to be
recognised as similar. A stripe offset by just a few pixels would
be counted as just as strong a mismatch as its complete
absence – in fact more so, since both locations will count as
mismatches. Although the method has been used to produce a
rough measure of mimetic accuracy in hoverflies (Dittrich
et al. 1993; Azmeh et al. 1998), it gives several anomalies. For
example, Azmeh (1999) observed that all-black hoverflies are
given unrealistically highmeasures of similarity to wasps.
Here, we describe a new, holistic method for the measure-
ment of similarity between two or more biological colour pat-
terns. The method is similar to the sum of absolute differences
in that it uses information from the whole pattern at the level
of the individual pixel, but it is more robust to small spatial
variations among images because it is based on the distance
transform (Borgefors 1986). In the distance transform of a bin-
ary image, each pixel is weighted by the minimum distance to
the nearest white pixel. Distance transforms have been used on
one previous occasion to analyse biological colour patterns
(Anderson et al. 2010) but to make qualitative decisions (iden-
tification) rather than the quantitative comparisons of similar-
ity we seek. The method we describe is applicable to any
pattern that consists of clearly separated colours (as opposed
to colours blending from one to another), for example, those
seen in the abdominal patterns ofmany insects, cetaceanmark-
ings, wing patterns of many butterflies and moths, amphibian
aposematic signals and body patterns of reef fish. We demon-
strate the utility and versatility of the method by applying it to
three ecological examples.
Generalmethods
We carried out automated image analysis inMATLAB (2010);
for the full code along with detailed annotations and instruc-
tions, seeAppendices S3 and S4. Some early steps in image pre-
processing (such as alignment of images and selection of the
region of interest) required user input, but this was kept to a
minimum and rarely exceeded a couple of minutes for a single
image.
IMAGE PREPROCESSING
The distance transformmethod assumes that good-quality 2D
images of the patterns of interest are available. These images
should reflect the pattern as seen by the relevant signal receiver
(see e.g. Endler & Mielke 2005). For simplicity, we have used
RGB digital photographs, but our method is equally applica-
ble to images produced using other methods, such as those
including ultraviolet (UV) components.
The input images (Fig. 1a) must first be ‘registered’, that is,
transformed in order to match in size and alignment, and
cropped down to the region of interest (Fig. 1b,c). Ideally, this
should be achieved by the use of fixed landmarks within the
image; however, homologous landmarks common to all
images within a set may be difficult or impossible to define.
If true landmarks exist, the images can be transformed
© 2013 The Authors. Methods in Ecology and Evolution © 2013 British Ecological Society, Methods in Ecology and Evolution, 4, 771–781
772 C. Taylor, F. Gilbert & T. Reader
automatically to line up these ‘control points’ as closely as pos-
sible – see Heliconius example below. In other cases, more
approximate visual landmarks such as the line of symmetry
can be used. This may add a small level of subjectivity to the
analysis, but we show our method to be robust to small errors
of rotation and scaling, as well as to noise (see Appendix S2,
Figs S1–4).
Next, each image must be simplified by converting into a set
of binary images, hereafter ‘segments’, one for each distinct
colour, with values 1 for presence and 0 for absence (Fig. 1e;
see also Fig. 2b). A key assumption here is that each segment
represents a distinct colour category in the perception of the
signal receiver. To define segments appropriately, it is neces-
sary to understand both the properties of the device used to
acquire the image (Stevens et al. 2007) and the sensory capabil-
ities of the receiver (Endler & Mielke 2005). We have chosen
examples in which the lack ofUV sensitivity of standard digital
cameras, and differences in colour perception between humans
and the most important signal receivers, are unlikely to have
an important effect on the definition of the segments, but these
issuesmust be considered carefully. For example, if the receiver
and its visual properties are known, then it is possible to calcu-
late what constitutes a ‘just noticeable difference’ in colour and
to separate the pattern into regions differing by at least this
amount (two ways of doing this are suggested by Endler 2012).
If a typical viewing distance can be estimated, the image could
also be converted to a resolution equivalent to that experienced
by the receiver (again, see Endler 2012).
The methods used to separate a pattern into its segments
will vary according to the organisms under study and the
source and quality of the images. Consequently, specific details
are to be found accompanying the three examples; see also
Appendix S1.
PAIRWISE DISSIMILARITY CALCULATION
For the sake of simplicity, we describe here how to compare
two images, A and B, each with two different segments (A1
andA2, B1 and B2; see example in Fig. 2); the method is easily
extended to cases with more than two segments. A distance
transform of A1 is carried out, such that all pixel locations are
assigned a value calculated as the smallest distance to a pixel of
value 1 (Borgefors 1986). This distance is zero for pixels which
have a value of 1 in A1, and a real number, at least one, for all
other pixels, calculated using Euclidean distance (Fig. 2c). The
distance transform values for all pixels are then multiplied by
the raw values for equivalent pixels in B1. The result is that any
pixel locations that are the same in both images (a match) will
carry a value of 0, while any nonmatching pixel locations will
be weighted in proportion to the minimum distance to a
matching pixel (Fig. 2e). Total mismatch for the whole image
is simply the sum of these pixel values.
Next, the process is repeated with image roles reversed (A1
multiplied by the distance transform of B1), and repeated in
both directions for A2 and B2. To standardise the dissimilarity
value between zero and one, we take the mean of these four
values and divide it by the maximum possible total for that size
of image. The greatest mismatch should in theory be between
an entirely white and an entirely black image of the same size
as A and B, but a distance transform cannot be obtained from
an image which is composed entirely of zeros. A single white
pixel is therefore placed in the corner of the otherwise black
image, and vice versa, before calculation of the dissimilarity as
described above, giving themaximum value obtainable.
OPTIMISATION
Two very similar patternsmight not be classified as such if they
are misaligned. An optimisation procedure is therefore used
whereby one image is shifted relative to the other by varying
small amounts horizontally and vertically, to find the lowest
possible dissimilarity value given these various alignments. For
example, in Fig. 2, if image B is translated one pixel upwards,
the total mismatch of the yellow segments would be reduced
from 7�4 to 4, giving a more optimal alignment. In preliminary
testing, a maximum translation of 15% of the image size was
sufficient to include the optimum value in the vast majority of
cases. If the images are symmetrical and have already been
(a) (b) (c) (d) (e)
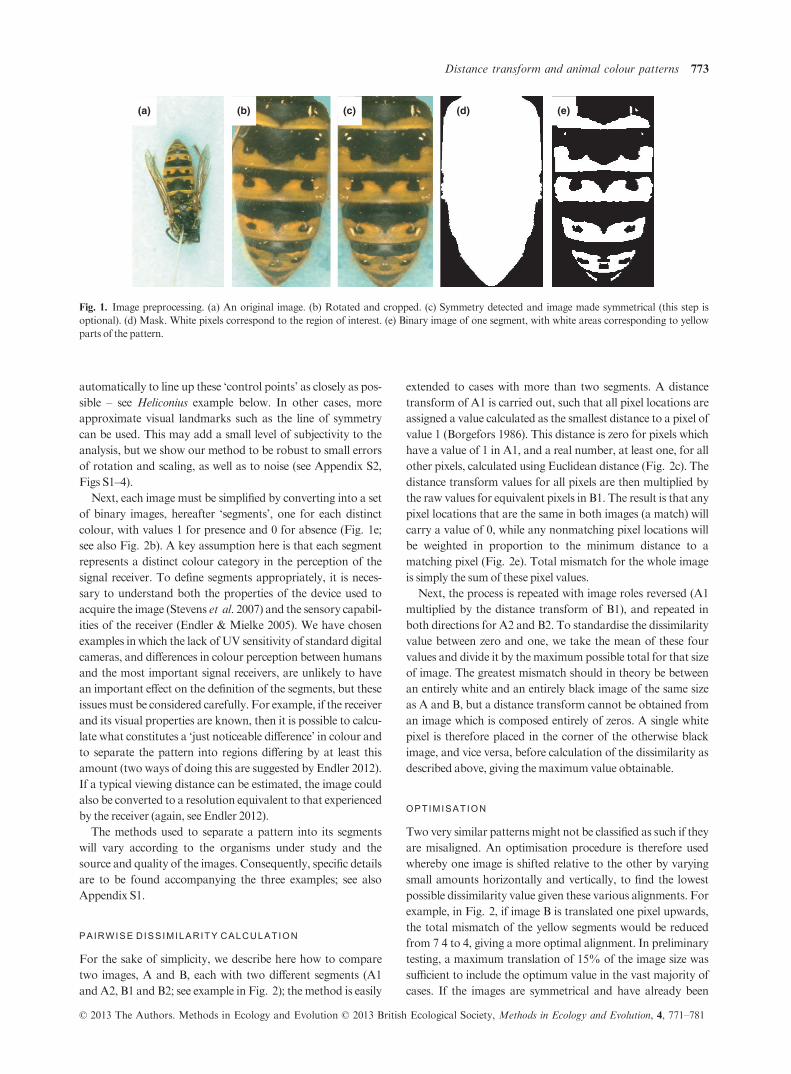
Fig. 1. Image preprocessing. (a) An original image. (b) Rotated and cropped. (c) Symmetry detected and image made symmetrical (this step is
optional). (d) Mask. White pixels correspond to the region of interest. (e) Binary image of one segment, with white areas corresponding to yellow
parts of the pattern.
© 2013 The Authors. Methods in Ecology and Evolution © 2013 British Ecological Society, Methods in Ecology and Evolution, 4, 771–781
Distance transform and animal colour patterns 773
aligned along their lines of symmetry, then translation perpen-
dicular to that line is not necessary.
A further possibility is to vary the aspect ratio of the image,
as well as horizontal and vertical alignment. This involves
stretching or compressing one image relative to the other. In
repeating patterns, such as stripes, this accounts for slight vari-
ation in scale. Again, a maximum of 15% change in height was
sufficient in preliminary testing. Other forms of transformation
could potentially be used in order to optimise image alignment
further; for example, rotation of the images could be useful in
cases without clear landmarks by which the images can be
aligned.
STATISTICAL METHODS
The output of the process this far will be a dissimilarity value
between a pair of images. If a similarity value is required, we
can use similarity = 1 – dissimilarity. In the likely case that
more than two images are to be compared, the process is
repeated for all possible pairs, leading to a matrix of pairwise
dissimilarity values (such as Table 1). Formore than a few pat-
terns, this matrix is very difficult to interpret directly, and it is
useful to summarise the information using a form of ordina-
tion. Using nonmetric multidimensional scaling (NMDS;
Legendre & Legendre 1998), each pattern is represented by a
point in Euclidean space, with the distance between any two
points being approximately equal to their dissimilarity value.
Usually, the first two dimensions represent an appropriate vi-
sualisation (see Fig. 4). Note that, while useful for visualising
trends, ordinations of relationships between multiple patterns
are approximations of the true situation, and reference should
also bemade to the raw dissimilarity values.
Applications
HOVERFLY AND WASP ABDOMINAL PATTERNS
Many species of hoverfly (Diptera: Syrphidae) are thought to
gain protection through resemblance to stinging Hymenoptera
such as wasps (Rotheray & Gilbert 2011). This is an example
of Batesian mimicry – predators mistake the palatable mimic
(hoverfly) for an unpalatable model (wasp), and thus, the
attack rate on the mimic is reduced (Bates 1862). Although we
would expect natural selection to favour those with the highest
level of mimetic accuracy, some hoverflies seem to resemble
wasps better than others. Why are some hoverflies inaccurate
mimics of wasps (Edmunds 2000; Gilbert 2005)?
Of course, we cannot answer this question without being
able to define what we mean by ‘inaccurate mimic’: some
authors have used human judgement (Penney et al. 2012),
pigeon Columba livia judgement (Dittrich et al. 1993) or the
sum of absolute differences (see above; Dittrich et al. 1993;
Azmeh et al. 1998). The most successful approach to date has
been the multivariate method used by Penney et al. (2012).
They calculated a dissimilarity value from a combination of six
1·4 1 0 1 0
0 0 0 0 0
0 0 0 0 0
0 0 0 0 0
0 0 0 0 0
1·4 1 0 1 2
1 0 0 1 2
1 0 0 1 2
1 0 1 1·4 2·2
1·4 1 1·4 2·2 2·8
0 0 0 0 1
1 0 0 1 1·4
1·4 1 1 1·4 2·2
2·2 2 2 2·2 2·8
3·2 3 3 3·2 3·6
0 0 0 0 0
0 0 0 0 0
0 1 1 0 0
0 2 0 0 0
0 0 0 0 0
1 1 1 1 0
0 1 1 0 0
0 0 0 0 0
0 0 0 0 0
0 0 0 0 0
0 0 1 0 0
0 1 1 0 0
0 1 1 0 0
0 1 0 0 0
0 0 0 0 0
1 1 0 1 0
0 0 0 0 0
0 0 0 0 0
0 0 0 0 0
0 0 0 0 0
0 0 0 0 0
0 0 0 0 0
0 1 1 0 0
0 1 0 0 0
0 0 0 0 0
(a)
(b)
(c)
(d)
(e)
Image A Image B
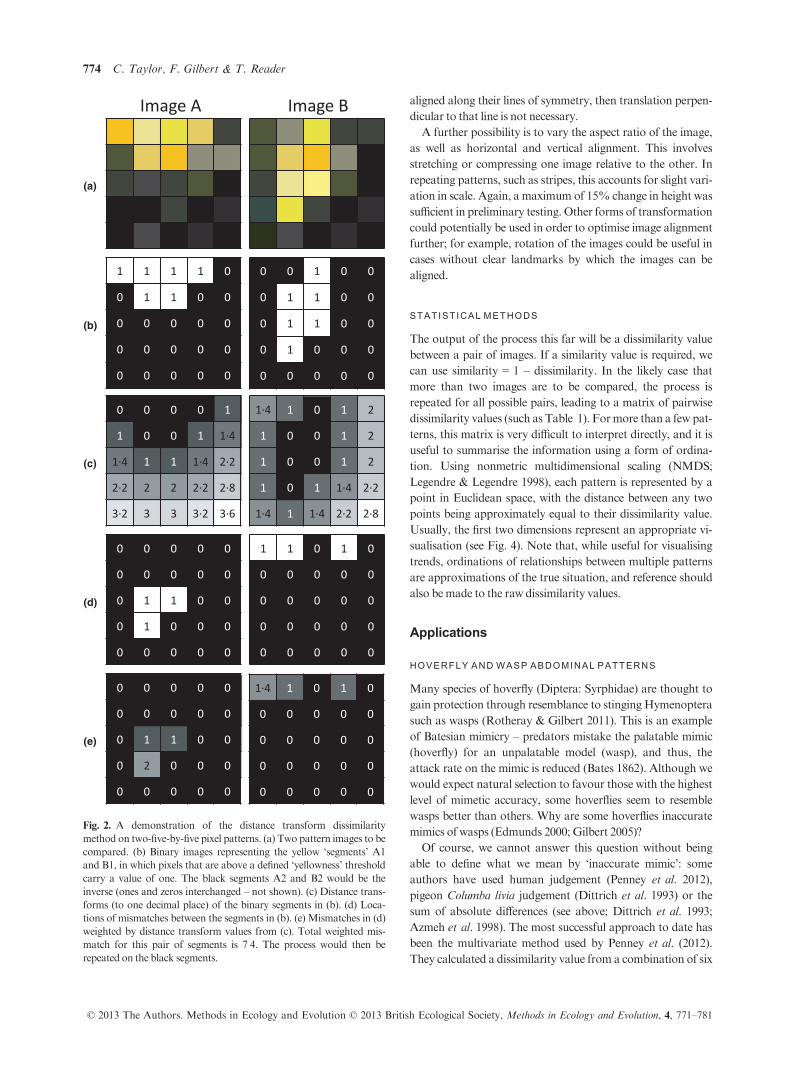
Fig. 2. A demonstration of the distance transform dissimilarity
method on two-five-by-five pixel patterns. (a) Two pattern images to be
compared. (b) Binary images representing the yellow ‘segments’ A1
and B1, in which pixels that are above a defined ‘yellowness’ threshold
carry a value of one. The black segments A2 and B2 would be the
inverse (ones and zeros interchanged – not shown). (c) Distance trans-
forms (to one decimal place) of the binary segments in (b). (d) Loca-
tions of mismatches between the segments in (b). (e) Mismatches in (d)
weighted by distance transform values from (c). Total weighted mis-
match for this pair of segments is 7�4. The process would then be
repeated on the black segments.
© 2013 The Authors. Methods in Ecology and Evolution © 2013 British Ecological Society, Methods in Ecology and Evolution, 4, 771–781
774 C. Taylor, F. Gilbert & T. Reader
different morphometric features plus summary pattern fea-
tures such as mean red, green and blue values from the RGB
image. This difference measure was found to correlate with
human estimates of similarity and enabled the authors to test a
number of the proposed explanations for the existence of inac-
curate mimicry. However, abdominal pattern was only
approximately represented in the form of six summary values,
possibly a major shortcoming given that pattern is one of the
most immediately recognisable features of a wasp. The dis-
tance transform method enables us to examine in more detail
the similarities and differences between wasp and hoverfly
colour patterns.
Materials andmethods
Weobtained 39 high-resolution photographs (in TIFF format)
of 10 species of hoverfly and eight photographs of the wasps
Vespula vulgarisL.1758andV. rufaL.1758 (imagesusedprevi-
ously by Dittrich et al. 1993). In order to facilitate comparison
with the studybyPenney et al. (2012),wealso tookhigh-resolu-
tion scans of illustrations of 20 hoverfly species from a field
guide (Stubbs&Falk2002), chosen tocorrespond toasmanyas
possibleof the ‘waspmimics’ inPenney et al.’sFig.S1 (2012).
The abdomen was selected as the region of interest, and
images aligned along their lines of symmetry. Hoverfly and
wasp patterns typically appear to have two discrete colours to
the human eye, well represented in RGB digital photographs.
Spectrometry suggests that the patterns do not include hidden
UV elements (Gilbert 2005) and hence that likely predators
(birds) also perceive them as consisting of two colour classes.
We therefore segmented the images into yellow and black
components (for full details, see Appendix S1; see also
Fig. 1).
Similarity was calculated as described in ‘General methods’
above, with optimisation using vertical translation and vertical
scaling. The lowest similarity to Vespula spp. in the data set
came from the hoverfly Syritta pipiens (L. 1758), and for ease
of interpretation, this was assigned a similarity value of 0 in
relation to Vespula spp., with all other similarity values
expressed relative to this. This scaling has no effect on the
outcome of the statistical tests. Correlation with similarity
estimates from other sources was calculated using one-tailed
Pearson’s correlation.
Results
Mean similarity values between images of each species of
hoverfly and the eight wasp images, calculated with the dis-
tance transform method, correlate strongly with human esti-
mates of similarity, which were based on separate photographs
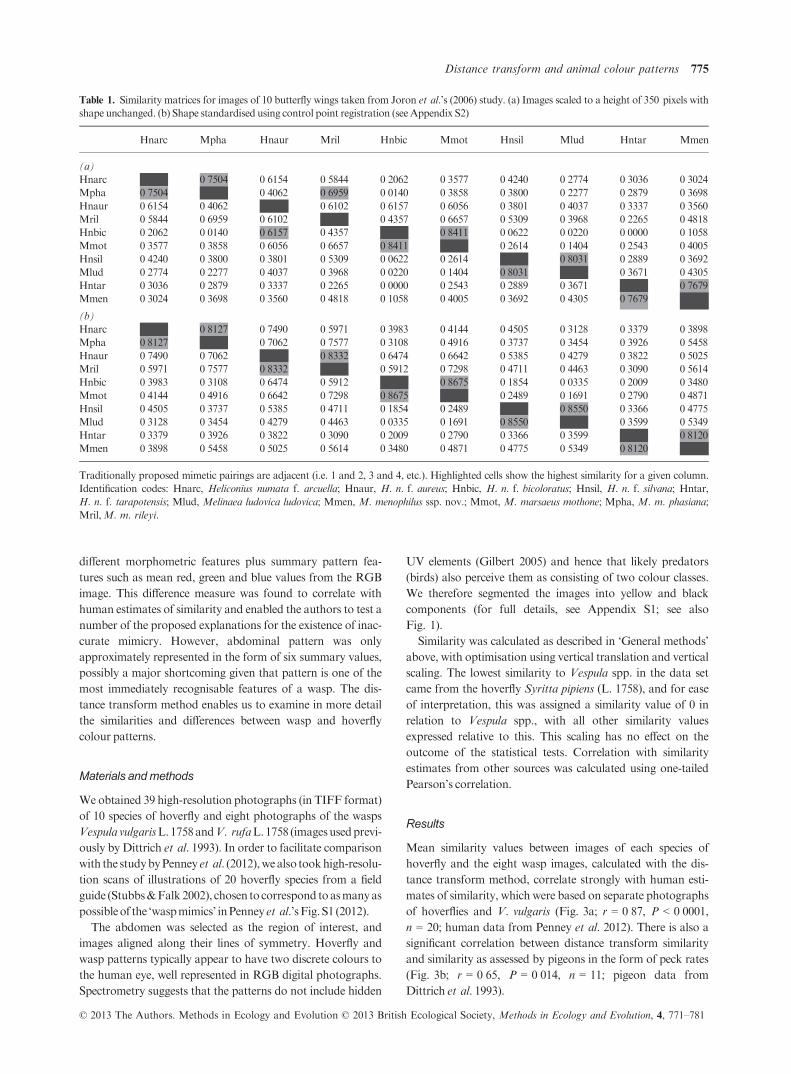
of hoverflies and V. vulgaris (Fig. 3a; r = 0�87, P < 0�0001,n = 20; human data from Penney et al. 2012). There is also a
significant correlation between distance transform similarity
and similarity as assessed by pigeons in the form of peck rates
(Fig. 3b; r = 0�65, P = 0�014, n = 11; pigeon data from
Dittrich et al. 1993).
Table 1. Similarity matrices for images of 10 butterfly wings taken from Joron et al.’s (2006) study. (a) Images scaled to a height of 350 pixels with
shape unchanged. (b) Shape standardised using control point registration (seeAppendix S2)
Hnarc Mpha Hnaur Mril Hnbic Mmot Hnsil Mlud Hntar Mmen
(a)
Hnarc 0�7504 0�6154 0�5844 0�2062 0�3577 0�4240 0�2774 0�3036 0�3024Mpha 0�7504 0�4062 0�6959 0�0140 0�3858 0�3800 0�2277 0�2879 0�3698Hnaur 0�6154 0�4062 0�6102 0�6157 0�6056 0�3801 0�4037 0�3337 0�3560Mril 0�5844 0�6959 0�6102 0�4357 0�6657 0�5309 0�3968 0�2265 0�4818Hnbic 0�2062 0�0140 0�6157 0�4357 0�8411 0�0622 0�0220 0�0000 0�1058Mmot 0�3577 0�3858 0�6056 0�6657 0�8411 0�2614 0�1404 0�2543 0�4005Hnsil 0�4240 0�3800 0�3801 0�5309 0�0622 0�2614 0�8031 0�2889 0�3692Mlud 0�2774 0�2277 0�4037 0�3968 0�0220 0�1404 0�8031 0�3671 0�4305Hntar 0�3036 0�2879 0�3337 0�2265 0�0000 0�2543 0�2889 0�3671 0�7679Mmen 0�3024 0�3698 0�3560 0�4818 0�1058 0�4005 0�3692 0�4305 0�7679(b)
Hnarc 0�8127 0�7490 0�5971 0�3983 0�4144 0�4505 0�3128 0�3379 0�3898Mpha 0�8127 0�7062 0�7577 0�3108 0�4916 0�3737 0�3454 0�3926 0�5458Hnaur 0�7490 0�7062 0�8332 0�6474 0�6642 0�5385 0�4279 0�3822 0�5025Mril 0�5971 0�7577 0�8332 0�5912 0�7298 0�4711 0�4463 0�3090 0�5614Hnbic 0�3983 0�3108 0�6474 0�5912 0�8675 0�1854 0�0335 0�2009 0�3480Mmot 0�4144 0�4916 0�6642 0�7298 0�8675 0�2489 0�1691 0�2790 0�4871Hnsil 0�4505 0�3737 0�5385 0�4711 0�1854 0�2489 0�8550 0�3366 0�4775Mlud 0�3128 0�3454 0�4279 0�4463 0�0335 0�1691 0�8550 0�3599 0�5349Hntar 0�3379 0�3926 0�3822 0�3090 0�2009 0�2790 0�3366 0�3599 0�8120Mmen 0�3898 0�5458 0�5025 0�5614 0�3480 0�4871 0�4775 0�5349 0�8120
Traditionally proposed mimetic pairings are adjacent (i.e. 1 and 2, 3 and 4, etc.). Highlighted cells show the highest similarity for a given column.
Identification codes: Hnarc, Heliconius numata f. arcuella; Hnaur, H. n. f. aureus; Hnbic, H. n. f. bicoloratus; Hnsil, H. n. f. silvana; Hntar,
H. n. f. tarapotensis; Mlud, Melinaea ludovica ludovica; Mmen, M. menophilus ssp. nov.; Mmot, M. marsaeus mothone; Mpha, M. m. phasiana;
Mril,M. m. rileyi.
© 2013 The Authors. Methods in Ecology and Evolution © 2013 British Ecological Society, Methods in Ecology and Evolution, 4, 771–781
Distance transform and animal colour patterns 775
M €ULLERIAN MIMICRY IN HELICONI INAE
A number of tropical butterfly species (Lepidoptera:
Nymphalidae) are highly distasteful to predators and employ
aposematic coloration on their wings to advertise their
unprofitability (Brown 1981). In a given geographical location,
we often see convergent evolution of patterns from well-
separated taxa, sometimes to an extraordinary degree. This
convergence first led M€uller (1879) to formulate the theory of
mimicry that bears his name.
The butterflyHeliconius numata (Cramer 1780; Nymphalidae:
Heliconiinae) exists in a number of distinct forms, each with its
own characteristic colour pattern (Joron et al. 1999; Helico-
nius Genome Consortium 2012). Each form is thought to
mimic a particular species or subspecies of another group of
butterflies, the genus Melinaea. However, to our knowledge,
mimetic pairings have always been chosen simply on the basis
of the author’s perception and geographical coincidence. Simi-
larities between proposedM€ullerian comimics certainly appear
striking to the human eye, but it would be informative to take
amore objective view of their similarities and differences.
Materials andmethods
Images of five forms of H. numata and five species/subspecies
ofMelinaeawere taken from Fig. 1 in the study of Joron et al.
(2006). Nomenclature follows Lamas et al.’s (2004) study.
Each image was cropped to a rectangle just large enough to
contain both the fore- and hind-wing of the right-hand side.
Other features such as antennae or parts of the head encroach-
ing on the defined area were removed. Two alternative meth-
ods were used to register the images, giving slightly different
results. In one case, images were scaled to a standard height of
350 pixels, preserving aspect ratio, with no other transforma-
tion. In the other, four control points were selected, using wing
veins as landmarks, and images were transformed tomatch the
control points to each other as closely as possible (see
Appendix S1).
The pattern was segmented into black and red, and a third
category of yellow/white that was present in only six of 10
images. Yellow andwhite were not separated, as they appeared
much less distinct to the human eye than the other major col-
our divisions, and often shaded from one into the other. The
most important signal receivers in this system (most likely
avian predators) may perceive the boundaries between the
colours on the wing differently. In the absence of more
complete information, however, we focus here on illustrating
how the results of our technique for comparing the spatial
arrangement of colour patches on the wing compare with the
existing classification of mimetic pairs, which was based on
human perceptions of the patterns. For full details of image
preprocessing, see Appendix S1.
Since not all patterns contained a yellow component,
pairwise dissimilarity measures were calculated using the black
and red segments only. However, this did still allow for
variation in the yellow parts to be considered, since these were
represented as areas scoring zero on both the red and the black
segments. Optimisation was carried out using horizontal and
vertical translation. For ease of interpretation, similarity values
were scaled to span the range 0–1.
Results
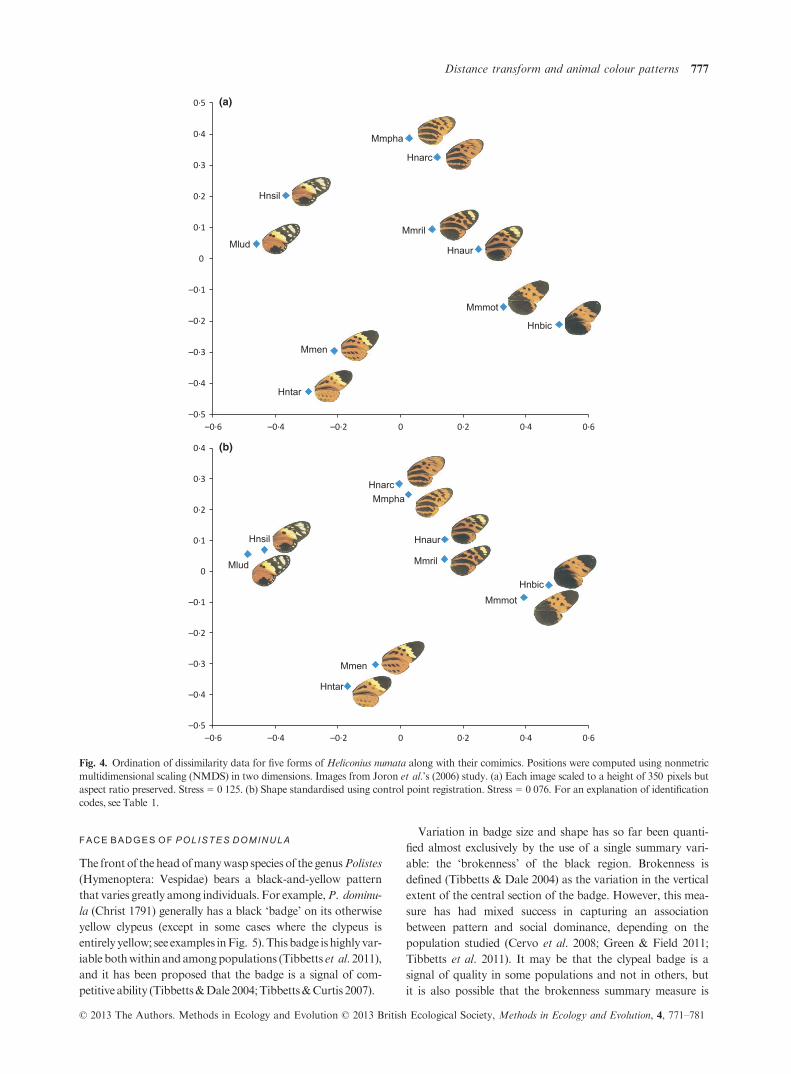
Figure 4a shows the ordination of the 10 species/morphs based
on images with a preserved shape. The similarity values
(Table 1) show that in eight out of 10 cases, the highest similar-
ity value for a given pattern corresponds to the proposed
comimic. However, M. marsaeus rileyi is more similar to its
sister subspecies phasiana and mothone than to the proposed
comimicH. numata f. aurora, and likewise, the latter is slightly
more similar to both conspecific forms bicoloratus and arcuella
than toM. m. rileyi.
By inspection, the main feature driving this result appears to
be the shape of the wing rather than the colour pattern itself,
and this can be confirmed through control point registration.
If, during the preprocessing stage, the images are transformed
to line up wing landmarks, then the results are slightly different
(Fig. 4b). Importantly, comimics are now much more closely
associated, with the highest similarity value in each case corre-
sponding to the comimic.
0
0·1
0·2
0·3
0·4
0·5
0·6
0·7
0·8
0 20 40 60
Pigeon peck rate
0
0·1
0·2
0·3
0·4
0·5
0·6
0·7
0 2 4 6 8
Sim
ilari
ty v
alue
cal
cula
ted
usin
gdi
stan
ce tr
ansf
orm
Human ranking of mime c fidelity
(a) (b)
Fig. 3. Correlation between distance transform similarity and othermeasures. (a) Compared against human assessment of similarity of hoverflies to
Vespula vulgaris, given as a score out of 10 (Penney et al. 2012). (b) Compared against peck rate from pigeons trained to peck at images of wasps, but
not at those of flies (Dittrich et al. 1993).
© 2013 The Authors. Methods in Ecology and Evolution © 2013 British Ecological Society, Methods in Ecology and Evolution, 4, 771–781
776 C. Taylor, F. Gilbert & T. Reader
FACE BADGES OF POLISTES DOMINULA
The front of the headofmanywasp species of the genusPolistes
(Hymenoptera: Vespidae) bears a black-and-yellow pattern
that varies greatly among individuals. For example,P. dominu-
la (Christ 1791) generally has a black ‘badge’ on its otherwise
yellow clypeus (except in some cases where the clypeus is
entirely yellow; see examples inFig. 5).Thisbadge is highlyvar-
iable bothwithin andamongpopulations (Tibbetts et al. 2011),
and it has been proposed that the badge is a signal of com-
petitive ability (Tibbetts&Dale 2004;Tibbetts&Curtis 2007).
Variation in badge size and shape has so far been quanti-
fied almost exclusively by the use of a single summary vari-
able: the ‘brokenness’ of the black region. Brokenness is
defined (Tibbetts & Dale 2004) as the variation in the vertical
extent of the central section of the badge. However, this mea-
sure has had mixed success in capturing an association
between pattern and social dominance, depending on the
population studied (Cervo et al. 2008; Green & Field 2011;
Tibbetts et al. 2011). It may be that the clypeal badge is a
signal of quality in some populations and not in others, but
it is also possible that the brokenness summary measure is
Hnarc
Hnaur
Hnbic
Hnsil
Hntar
Mlud
Mmen
Mmmot
Mmpha
Mmril
–0·5
–0·4
–0·3
–0·2
–0·1
0
0·1
0·2
0·3
0·4
–0·6 –0·4 –0·2 0 0·2 0·4 0·6
Hnarc
Hnaur
Hnbic
Hnsil
Hntar
Mlud
Mmen
Mmmot
Mmpha
Mmril
–0·5
–0·4
–0·3
–0·2
–0·1
0
0·1
0·2
0·3
0·4
0·5
–0·6 –0·4 –0·2 0 0·2 0·4 0·6
(a)
(b)
Fig. 4. Ordination of dissimilarity data for five forms of Heliconius numata along with their comimics. Positions were computed using nonmetric
multidimensional scaling (NMDS) in two dimensions. Images from Joron et al.’s (2006) study. (a) Each image scaled to a height of 350 pixels but
aspect ratio preserved. Stress = 0�125. (b) Shape standardised using control point registration. Stress = 0�076. For an explanation of identification
codes, see Table 1.
© 2013 The Authors. Methods in Ecology and Evolution © 2013 British Ecological Society, Methods in Ecology and Evolution, 4, 771–781
Distance transform and animal colour patterns 777
not sufficient to capture the relevant signal variation in all
cases.
We need a more robust way of quantifying badge variation
if we are to understand fully the geographical differences
between populations of P. dominula. Even within a single pop-
ulation, it is conceivable that a more holistic pattern measure
might be able to account formore of the variation in characters
such as body size (which is a useful predictor of dominance;
Tibbetts &Dale 2004). We have therefore compared the use of
the distance transform method with the brokenness measure
on images from a Portuguese population ofP. dominula.
Materials andmethods
Fifty-seven foundresses of P. dominula were taken from their
nests at Quinta de Sao Pedro, Portugal. Wet body mass was
measured using an electronic balance immediately after cap-
ture. Their faces were photographed with an Olympus E420
DSLR. The image was cropped to a rectangle containing the
clypeus and segmented into black and yellow components; for
full details, see Appendix S1. As with the hoverfly/wasp exam-
ple above, it seems reasonable to assume that the two-colour
(black and yellow) pattern, which is clear to the human eye
when viewing the P. dominula clypeus in both living specimens
and RGB photographs, is also perceived by the intended
receivers of the signal (other wasps) in this system. Wasp pat-
terns appear not to have anyUV components (Gilbert 2005).
Dissimilarity values were calculated as described in General
methods, but with one modification. Some individual wasps
had no black badge on the clypeus whatsoever, making a dis-
tance transform of the black segment of the image impossible.
The dissimilarity for all image pairs was therefore calculated
from the yellow segment alone rather than the mean of the
values from both the yellow and the black segments. Optimisa-
tion was carried out using horizontal and vertical translation.
Two-dimensional NMDS was then used to provide x and y
scores, giving a bivariate summary of the facial pattern.
Brokenness values were calculated as described in the study
of Tibbetts et al. (2011) – see Appendix S1. A second summary
variable, proportion of clypeus that is black, was also calcu-
lated. Correlations between variables were calculated using
two-tailed Pearson’s correlation tests.
Results
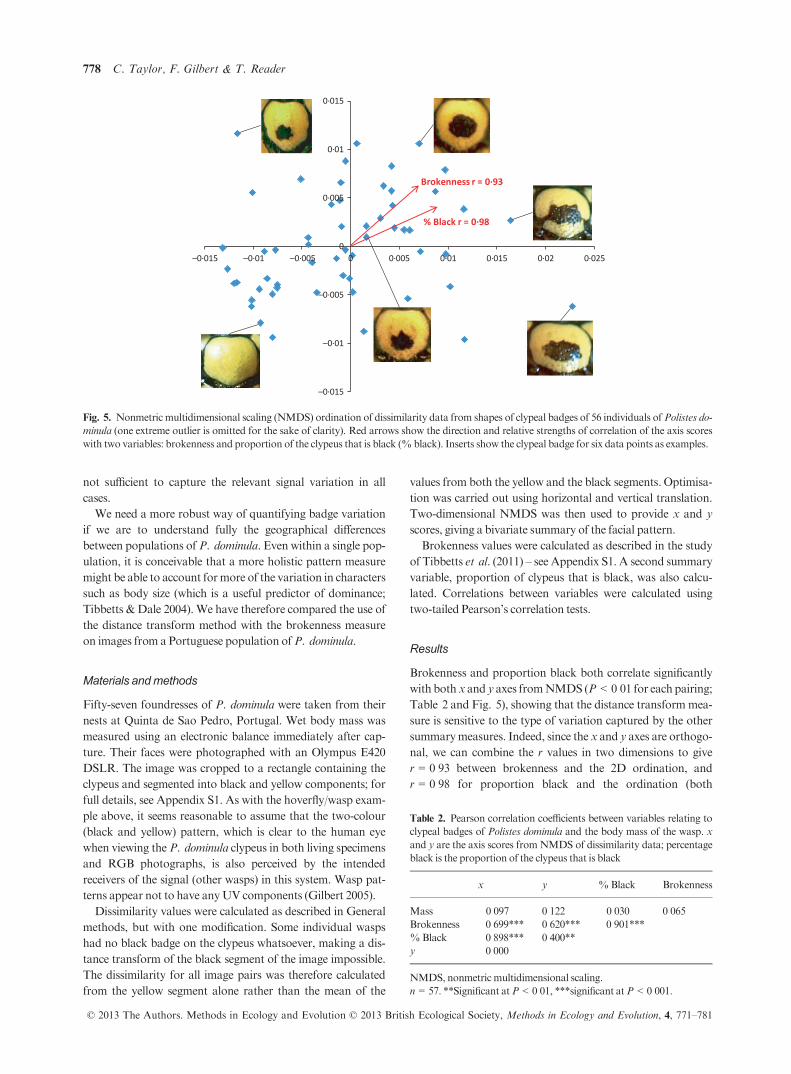
Brokenness and proportion black both correlate significantly
with both x and y axes fromNMDS (P < 0�01 for each pairing;Table 2 and Fig. 5), showing that the distance transformmea-
sure is sensitive to the type of variation captured by the other
summarymeasures. Indeed, since the x and y axes are orthogo-
nal, we can combine the r values in two dimensions to give
r = 0�93 between brokenness and the 2D ordination, and
r = 0�98 for proportion black and the ordination (both
–0·015
–0·01
–0·005
0
0·005
0·01
0·015
–0·015 –0·01 –0·005 0 0·005 0·01 0·015 0·02 0·025
Brokenness r = 0·93
% Black r = 0·98
Fig. 5. Nonmetric multidimensional scaling (NMDS) ordination of dissimilarity data from shapes of clypeal badges of 56 individuals ofPolistes do-
minula (one extreme outlier is omitted for the sake of clarity). Red arrows show the direction and relative strengths of correlation of the axis scores
with two variables: brokenness and proportion of the clypeus that is black (%black). Inserts show the clypeal badge for six data points as examples.
Table 2. Pearson correlation coefficients between variables relating to
clypeal badges of Polistes dominula and the body mass of the wasp. x
and y are the axis scores fromNMDS of dissimilarity data; percentage
black is the proportion of the clypeus that is black
x y %Black Brokenness
Mass �0�097 0�122 �0�030 0�065Brokenness 0�699*** 0�620*** 0�901***%Black 0�898*** 0�400**y 0�000
NMDS, nonmetric multidimensional scaling.
n = 57. **Significant atP < 0�01, ***significant atP < 0�001.
© 2013 The Authors. Methods in Ecology and Evolution © 2013 British Ecological Society, Methods in Ecology and Evolution, 4, 771–781
778 C. Taylor, F. Gilbert & T. Reader
P < 0�0001). However, none of the measures correlate signifi-
cantlywithbodymass (brokenness: r = 0�07,P = 0�63; propor-tion black: r = �0�03, P = 0�82; x axis: r = �0�10, P = 0�47; yaxis: r = 0�12, P = 0�37, all n = 57). Mass is a useful proxy for
social dominance (Tibbetts & Dale 2004). Therefore, in this
population, no association between pattern and dominance is
detected by any of themethods used, despite the extra informa-
tion contained in the two-dimensional ordination compared
with theone-dimensional summarymeasures.
Discussion
Wehave demonstrated the use of distance transforms to gener-
ate ameasure of similarity between two colour patterns. This is
not the first use of distance transforms for image comparison
in biology. However, in the only other instance of which we are
aware, it was used in the context of individual recognition, to
detect whether two patterns of spots were the same or different
(Anderson et al. 2010). In this qualitative approach, the pat-
tern variation was used as a means for identifying individuals
rather than being of interest in itself. We have sought to show
that there is much more potential in the method for studying
variation in patterns. To our knowledge, this is the first such
study to use distance transforms where the magnitude of the
difference is biologically relevant.
Our method captures far more pattern information than in
previous analyses of the three systems studied here, since it
does not characterise a pattern using summary variables.
Instead, it uses the full pattern, pixel by pixel, to calculate a
similarity value. The advantage gained is clear when we look at
the hoverfly example: despite using information only from the
abdominal colour pattern, the distance transformmethod gave
an assessment of similarity that correlated extremely well with
human perception of whole insect similarity (r = 0�87). Themultivariate measure from Penney et al. (2012), which
included summary variables for the pattern, as well asmorpho-
metric data from other body parts, still gave a significant corre-
lation but explained a lower proportion of the variance
(r = 0�56, from Penney et al. 2012). It is worth noting, though,
that even if the calculated dissimilarity did not correlate with a
predator’s perception of the pattern, it would still form a useful
comparison; we could then ask the question: why does the
predator not make use of the available information to distin-
guishmodels frommimics?
Similarly, in the case of Polistes clypeal badges, the broken-
ness measure (Tibbetts & Dale 2004) captures only a limited
amount of information about the shape of the badge. In the
case of the Portuguese population used in this study, the dis-
tance transform method retains almost all of the brokenness
information, while adding more detail along a second dimen-
sion (Fig. 5). Despite the extra information, we still detect no
association between mass and badge shape. As the measure we
have used is more comprehensive, it strengthens the conclusion
that the lack of a detected association is due to the genuine
absence of a link rather than failure to capture the relevant var-
iation. This supports the findings of Cervo et al. (2008) and
Green et al. (2013) in other European populations. A further
advantage of the distance transform method is that, because it
is based on an image of the whole clypeus rather than just the
badge, it captures variation in clypeus outline as well as the
badge itself. Thismay be especially useful in populations where
a large proportion of individuals have no black badge at all
(Cervo et al. 2008).
The relatively objective nature of our technique helps mini-
mise a researcher’s reliance on assumptions based on their own
perception. The data we present onM€ullerian mimicry in heli-
coniines largely confirm previous assumptions (Joron et al.
1999), but do reveal that in absolute terms, a fewmimetic pair-
ings may not be as clear cut as they initially appear. In particu-
lar, a consistent difference is picked up between subspecies of
Melinaea marseus and their Heliconius numata comimics
(Fig. 4a). This difference is connected largely with shape rather
than pattern, since it is reduced considerably when shape is
standardised (Fig. 4b). The difference may or may not be rele-
vant to a consideration of mimicry since predators may not
attend to shape information, difficult to interpret reliably with
different wing angles at rest. Predators, such as birds, may well
perceive the same striking pairings as suggested by humans,
but this should be explicitly tested, given that alternative
groupings, or a more continuousmimicry ring, also form plau-
sible descriptions. This example is also a good demonstration
of the potential scope of the technique; it can compare patterns
with more than two colours and detect differences of outline as
well as pattern.
We recognise that in our example analyses, the use of RGB
photographs and illustrations may introduce a bias towards
the human perception of colour patterns and that a more thor-
ough analysis would take into account the visual abilities of
the likely signal receivers. However, our focus is on themethod
of pattern comparison, whatever technique was used to collect
and prepare the images. Furthermore, there is no evidence in
any of the examples to suggest that human perception of the
colour boundaries is any different from that of other animals.
In the case of hoverflies, for example, responses of pigeons
were no different when presented with naturally lit specimens
(Green et al. 1999) as opposed to RGB photographs (Dittrich
et al. 1993).
One limitation of the distance transform method is that it
captures spatial variation in patterns only, not variation in
colour hue. This is because the image is converted into binary
format, with a colour classed as either present or absent; any
more subtle information on hue or brightness is lost. While
restricting the scope of the method slightly, this also brings
benefits, since brightness of colours can in some cases vary
over time, both during an animal’s lifetime and after death. If
images are taken from museum specimens, then fading of col-
ours can be a major problem. However, provided major col-
our boundaries are still detectable, fading will not affect the
binary images produced. If data on hue or brightness are
thought to be relevant to the system under study, for example,
the brightness of an aposematic signal, then this information
would need to be included through a separate analysis such as
recording of spectral reflectance values (Endler & Mielke
2005).
© 2013 The Authors. Methods in Ecology and Evolution © 2013 British Ecological Society, Methods in Ecology and Evolution, 4, 771–781
Distance transform and animal colour patterns 779
While we have aimed to develop an objective and consistent
similarity measure, it will never be possible to remove subjec-
tivity from the process entirely. The very process of represent-
ing a 3D colour pattern in a 2D digital image inevitably
changes the nature of the pattern in some ways. The choice of
colours used to segment the pattern (as in the Heliconius
example) will also inevitably alter the outcome.
Conclusions
The use of distance transforms to calculate dissimilarity is a
broadly applicable, consistent, powerful tool in the compara-
tive study of animal colour patterns. It is able to cast new light
on well-studied systems, to challenge assumptions and has the
potential to open up new avenues of investigation.
Acknowledgements
Thanks to Heather Booth, Chloe Gordon, Robert Habgood and Laura Jeffery
for their photographs of P. dominula face badges and data on body mass that
were used in this study; Damien Garcia for his MATLAB script for finding
multiple Otsu thresholds; Chris Brignell for discussions of pattern recognition
and image registration methods; and Elizabeth Tibbetts for comments on the
‘brokenness’ metric.
References
Anderson, C.J.R., Lobo, N., Roth, J.D. & Waterman, J.M. (2010) Computer-
aided photo-identification system with an application to polar bears based on
whisker spot patterns. Journal ofMammalogy, 91, 1350–1359.Azmeh, S. (1999) Mimicry and the Hoverflies. PhD, University of Nottingham,
Nottingham,UK.
Azmeh, S., Owen, J., Sørensen, K., Grewcock, D. & Gilbert, F. (1998) Mimicry
profiles are affected by human-induced habitat changes. Proceedings of the
Royal Society. B, Biological Sciences, 265, 2285–2290.Barbosa, A.,M€athger, L.M., Buresch, K.C., Kelly, J., Chubb, C., Chiao, C.-C. &
Hanlon, R.T. (2008) Cuttlefish camouflage: the effects of substrate contrast
and size in evoking uniform, mottle or disruptive body patterns. Vision
Research, 48, 1242–1253.Bates, H.W. (1862) XXXII. Contributions to an Insect Fauna of the Amazon
Valley. Lepidoptera: Heliconidæ. Transactions of the Linnean Society of
London, 23, 495–566.Borgefors, G. (1986) Distance transformations in digital images. Computer
Vision, Graphics, and Image Processing, 34, 344–371.Boyer, D., Lipman, Y., Clair, E.S., Puente, J., Funkhouser, T., Patel, B., Jernvall,
J. & Daubechies, I. (2011) Algorithms to automatically quantify the geometric
similarity of anatomical surfaces. Proceedings of the National Academy of Sci-
ences, 108, 18221–18226.Briechle, K. & Hanebeck, U.D. (2001) Template matching using fast normalized
cross correlation. SPIE Proceedings, 4387, Optical Pattern Recognition XII,
95–102.Brodie, E.D.I. (1993) Differential avoidance of coral snake banded patterns by
free-ranging avian predators in CostaRica.Evolution, 47, 227–235.Brown, K.S. (1981) The biology ofHeliconius and related genera. Annual Review
of Entomology, 26, 427–457.Cervo, R., Dapporto, L., Beani, L., Strassmann, J.E. & Turillazzi, S. (2008) On
status badges and quality signals in the paper wasp Polistes dominulus: body
size, facial colour patterns and hierarchical rank. Proceedings of the Royal
Society. B, Biological Sciences, 275, 1189–1196.Cott, H.B. (1940) Adaptive Coloration in Animals. John Dickens & Co,
Northampton,UK.
Dittrich, W., Gilbert, F., Green, P., Mcgregor, P. & Grewcock, D. (1993)
Imperfect mimicry: a pigeon’s perspective. Proceedings of the Royal Society. B,
Biological Sciences, 251, 195–200.Edmunds, M. (2000) Why are there good and poor mimics? Biological Journal of
the Linnean Society, 70, 459–466.Endler, J.A. (1990) On the measurement and classification of colour in stud-
ies of animal colour patterns. Biological Journal of the Linnean Society,
41, 315–352.
Endler, J.A. (2012) A framework for analysing colour pattern geometry: adjacent
colours.Biological Journal of the Linnean Society, 107, 233–253.Endler, J.A. & Mielke, P.W.J. (2005) Comparing entire colour patterns as birds
see them.Biological Journal of the Linnean Society, 86, 405–431.Gilbert, F. (2005) The evolution of imperfect mimicry. Insect Evolutionary Ecol-
ogy (eds M. Fellowes, G. Holloway & J. Rolff), pp. 231–288. CABI, Walling-
ford,UK.
Godfrey, D., Lythgoe, J.N. & Rumball, D.A. (1987) Zebra stripes and tiger
stripes: the spatial frequency distribution of the pattern compared to that of
the background is significant in display and crypsis. Biological Journal of the
Linnean Society, 32, 427–433.Goshtasby, A.A. (2005) 2-D and 3-D Image Registration. Wiley, Hoboken, New
Jersey,USA.
Green, J.P. & Field, J. (2011) Interpopulation variation in status signalling in the
paper waspPolistes dominulus.Animal Behaviour, 81, 205–209.Green, P.R., Gentle, L., Peake, T.M., Scudamore, R.E., McGregor, P.K.,
Gilbert, F. et al. (1999) Conditioningpigeons to discriminate naturally lit insect
specimens.Behavioural processes, 46, 97–102.Green, J.P., Leadbeater, E., Carruthers, J.M., Rosser, N.S., Lucas, E.R. & Field,
J. (2013)Clypeal Patterning in the PaperWaspPolistes dominulus: NoEvidence
of Adaptive Value in theWild. Behavioral Ecology, 24, 623–633.Heliconius Genome Consortium. (2012) Butterfly genome reveals promiscuous
exchange ofmimicry adaptations among species.Nature, 487, 94–98.Joron, M., Wynne, I., Lamas, G. & Mallet, J. (1999) Variable selection and the
coexistence of multiple mimetic forms of the butterfly Heliconius numata.
Evolutionary Ecology, 13, 721–754.Joron, M., Papa, R., Beltr�an, M., Chamberlain, N., Mav�arez, J., Baxter, S. et al.
(2006) A conserved supergene locus controls colour pattern diversity inHelico-
nius butterflies.PLoSBiology, 4, e303.
Khotanzad, A. & Yaw Hua, H. (1990) Invariant image recognition by Zernike
moments. IEEETransactions on Pattern Analysis andMachine Intelligence, 12,
489–497.Lamas, G., Callaghan, C., Casagrande,M.M.,Mielke, O., Pyrcz, T., Robbins, R.
et al. (2004) Hesperioidea – Papilionoidea. Scientific Publishers, Gainesville,
Florida,USA.
Legendre, P. &Legendre, L. (1998)Numerical Ecology, 2nd English edn. Elsevier,
Amsterdam.
MATLAB. (2010)MATLAB. TheMathworks,Natick,Massachusetts, USA.
Møller, A.P. (1988) Badge size in the house sparrowPasser domesticus.Behavioral
Ecology and Sociobiology, 22, 373–378.M€uller, F. (1879) Ituna and Thyridia: a remarkable case of mimicry in butterflies.
Proceedings of the Entomological Society, 1879, 20–29.Penney, H.D., Hassall, C., Skevington, J.H., Abbott, K.R. & Sherratt, T.N.
(2012) A comparative analysis of the evolution of imperfect mimicry. Nature,
483, 461–464.Pinker, S. (1984) Visual cognition: an introduction.Cognition, 18, 1–63.Rotheray, G.F. & Gilbert, F. (2011) The Natural History of Hoverflies. Forrest
Text, Cardigan,UK.
Rui, Y., Huang, T.S. & Chang, S.-F. (1999) Image retrieval: current techniques,
promising directions, and open issues. Journal of Visual Communication and
Image Representation, 10, 39–62.Ruxton, G.D., Sherratt, T.N. & Speed, M.P. (2004) Avoiding Attack: The Evolu-
tionary Ecology of Crypsis, Warning Signals, and Mimicry. Oxford University
Press, Oxford.
Stevens, M., P�arraga, C.A., Cuthill, I.C., Partridge, J.C. & Troscianko, T.S.
(2007) Using digital photography to study animal coloration. Biological Jour-
nal of the Linnean Society, 90, 211–237.Stoddard, M.C. (2012) Mimicry and masquerade from the avian visual perspec-
tive.Current Zoology, 58, 630–648.Stoddard, M.C. & Stevens, M. (2010) Pattern mimicry of host eggs by the
common cuckoo, as seen through a bird’s eye. Proceedings of the Royal Soci-
ety. B, Biological Sciences, 277, 1387–1393.Stubbs, A.E. & Falk, S.J. (2002) British Hoverflies: An Illustrated Identification
Guide. British Entomological andNaturalHistory Society, Reading,UK.
Tibbetts, E.A. & Curtis, T.R. (2007) Rearing conditions influence quality signals
but not individual identity signals in Polistes wasps. Behavioral Ecology, 18,
602–607.Tibbetts, E.A. & Dale, J. (2004) A socially enforced signal of quality in a paper
wasp.Nature, 432, 218–222.Tibbetts, E.A., Skaldina, O., Zhao, V., Toth, A.L., Skaldin, M., Beani, L. et al.
(2011) Geographic variation in the status signals of Polistes dominulus paper
wasps.PLoSONE, 6, e28173.
Williams, P. (2007) The distribution of bumblebee colour patterns worldwide:
possible significance for thermoregulation, crypsis, and warning mimicry.
Biological Journal of the Linnean Society, 92, 97–118.
© 2013 The Authors. Methods in Ecology and Evolution © 2013 British Ecological Society, Methods in Ecology and Evolution, 4, 771–781
780 C. Taylor, F. Gilbert & T. Reader

Zhang, D. & Lu, G. (2002) Shape-based image retrieval using generic Fourier
descriptor.Signal Processing: ImageCommunication, 17, 825–848.Zhang,D.&Lu,G. (2003) Evaluation of similaritymeasurement for image retrie-
val. Proceedings of the 2003 International Conference on Neural Networks and
Signal Processing, pp. 928–931.Zitov�a, B. & Flusser, J. (2003) Image registration methods: a survey. Image and
VisionComputing, 21, 977–1000.
Received 3 January 2013; accepted 17April 2013
Handling Editor: AndrewTatem
Supporting Information
Additional Supporting Information may be found in the online version
of this article.
Appendix S1. Supplementarymethods.
Appendix S2. Testing robustness of the distance transform method.
Includes Figs S1–S4.
Appendix S3.MATLAB code.
Appendix S4.Readme for MATLAB code.
© 2013 The Authors. Methods in Ecology and Evolution © 2013 British Ecological Society, Methods in Ecology and Evolution, 4, 771–781
Distance transform and animal colour patterns 781


![SurReal: Fréchet Mean and Distance Transform for …arXiv:1906.10048v1 [cs.CV] 24 Jun 2019 SurReal: Fréchet Mean and Distance Transform for Complex-Valued Deep Learning Rudrasis](https://img.pdfslide.net/doc/110x75/5f50a917b9c46a74a700865c/surreal-frchet-mean-and-distance-transform-for-arxiv190610048v1-cscv-24.jpg)