Embed Size (px)
Citation preview

Distinct Roles of Residual Xylan and Lignin in Limiting Enzymatic Hydrolysis of
Organosolv Pretreated Woody Biomass
Maobing Tu
Forest Products Laboratory
Auburn University
1
Tu Research Group: Carbohydrate-derived biofuels and bioproducts
Woody biomass
Pretreated biomass
Sugars
Biofuels
Pretreatment
Enzymatic hydrolysis
Fermentation
Hemicellulose Hydrolysate
Microbial and Catalytic conversion
Co-products (Lactic acid, Acrylic acid, Butanol, Xylonic acid) 2

Outline
• Background and Goals
• Effects of residual xylan/lignin on enzymatic
hydrolysis
• Effects of pectinase/xylanase supplementation
on enzymatic hydrolysis
• Ethyl xyloside production in SSF process
• Conclusion
3

Liquid Phase Rich in Hemicellulose
Background
Pretreatment
Biomass
Solid Phase Rich in Cellulose
Fermentation Fermentation
Enzymatic Hydrolysis
Biofuels
Enzymatic hydrolysis limiting factors Residual xylan and lignin Other factors (DP, crystallinity, pore size and accessible surface area) End product inhibition
4

• Goals
– Distinguish the different roles of residual xylan and lignin in enzymatic hydrolysis of pretreated woody biomass
– Improve enzymatic hydrolysis of woody biomass
• Hypotheses
– Residual xylan affects Initial hydrolysis rate
– Residual lignin affects Final hydrolysis yield
Goals
5

Methods
Organosolv Pretreatment (170 ◦C, 1.1% H2SO4 (w/w), 65%
ethanol (v/v))
Solid Fraction Liquid Fraction
Biomass Chemical Composition
Analysis (NREL)
SEM
Enzymatic Hydrolysis SSF
Langmuir Adsorption Isotherm
Loblolly pine and sweetgum
6

Langmuir Adsorption Isotherm
KC
KC
1
max
Ʈ: The surface concentration of adsorbed cellulase enzymes; Ʈmax: The surface concentration of protein at full coverage;
K: Langmuir constant; C: The free protein concentration in the bulk solution; R: The distribution coefficient
KR max
Methods
7

Compositions Untreated
loblolly pine (%)
Untreated
sweetgum (%)
OPLP substrate
(%)
OPSG substrate
(%)
Acetone extractives 1.64±0.08 0.99±0.09 8.53±0.19 8.47±0.21
Acid-insoluble lignin 28.48±0.04 23.56±0.28 18.38±0.17 8.16±0.03
Acid-soluble lignin 0.26±0.03 2.24±0.02 0.23±0.06 0.87±0.03
Glucan 41.33±0.49 41.19±0.73 63.32±1.24 69.80±1.78
Xylan 6.34±0.13 16.18±0.50 2.93±0.79 9.74±0.53
Galactan 2.16±0.09 1.87±0.32 NA NA
Arabinan 1.30±0.11 0.83±0.11 0.90±0.21 NA
Mannan 12.17±0.39 3.33±0.49 4.50±0.59 3.01±0.28
Total 93.69 90.20 98.79 100.05
Results and discussion
Table 1. Chemical composition of untreated biomass and pretreated biomass
OPLP: organosolv pretreated loblolly pine; OPSG: organosolv pretreated sweetgum.
8

SEM images of OPLP (left) and OPSG (right)
Lignin droplets
9

Effect of enzyme loading on the hydrolysis of glucan in OPLP and OPSG
0 24 48 72
0
25
50
75
100
0 24 48 72
0
25
50
75
100
Glu
co
se
yie
ld (
%)
Time (h)
OPLP + 20 FPU
OPLP + 10 FPU
OPSG + 20 FPU
OPSG + 10 FPU
1. Initial glucan hydrolysis rate (g L-1 h-1): OPLP >OPSG 1.0 vs 0.7 (10 FPU) 1.5 vs 1.2 (20 FPU)
2. Final glucan hydrolysis yield: OPSG>OPLP 89% vs 60% (10 FPU) 100% vs 81% (20 FPU)
3. Crossing point at 17 h
OPLP: organosolv pretreated loblolly pine; OPSG: organosolv pretreated sweetgum. 10

Effect of enzyme loading on the hydrolysis of xylan in OPLP and OPSG
1. Xylan hydrolysis (rate): OPSG>OPLP 0.14 vs 0.03
0.21 vs 0.05
2. Xylan hydrolysis (yield): OPSG>OPLP 87% vs 43%
100% vs 66%
0 24 48 72
0
25
50
75
100
0 24 48 72
0
25
50
75
100
Xy
los
e y
ield
(%
)
Time (h)
OPLP + 20 FPU
OPLP + 10 FPU
OPSG + 20 FPU
OPSG + 10 FPU
OPLP: organosolv pretreated loblolly pine; OPSG: organosolv pretreated sweetgum. 11

• Initial glucan hydrolysis rate: – OPLP (1.0 g· L -1·H-1)>OPSG (0.7 g· L -1·H-1) 10 FPU – OPLP (1.5 g· L -1·H-1)>OPSG (1.2 g· L -1·H-1) 20 FPU
• Final glucan hydrolysis yield: – OPSG (89%) > OPLP (60%) 10 FPU – OPSG (100%)>OPLP (81%) 20 FPU
• Xylan hydrolysis (initial rate and final yield): – OPSG>OPLP
• Question:
– Why the initial hydrolysis rate (glucan) was higher in OPLP than that in OPSG?
Results and discussion
12

Cellulase adsorption isotherms on OPLP and OPSG
Cellulases Ʈmax (mg/g) K(mL/mg) R(L/g)
Cellulases on OPLP 35.09 3.11 0.11
Cellulases on OPSG 60.19 1.31 0.08
Celluclast on EPLP* 87.69 3.48 0.31
Celluclast on SELP* 101.05 1.45 0.15
0.0 0.5 1.0 1.5 2.0
0
10
20
30
40
0.0 0.5 1.0 1.5 2.0
0
10
20
30
40
Adsorb
ed c
ellu
lases o
n s
ubstr
ate
s (
mg/g
)
Free cellulases in solution (mg/mL)
Cellulase adsorption on OPSG
Cellulase adsorption on OPLP
13
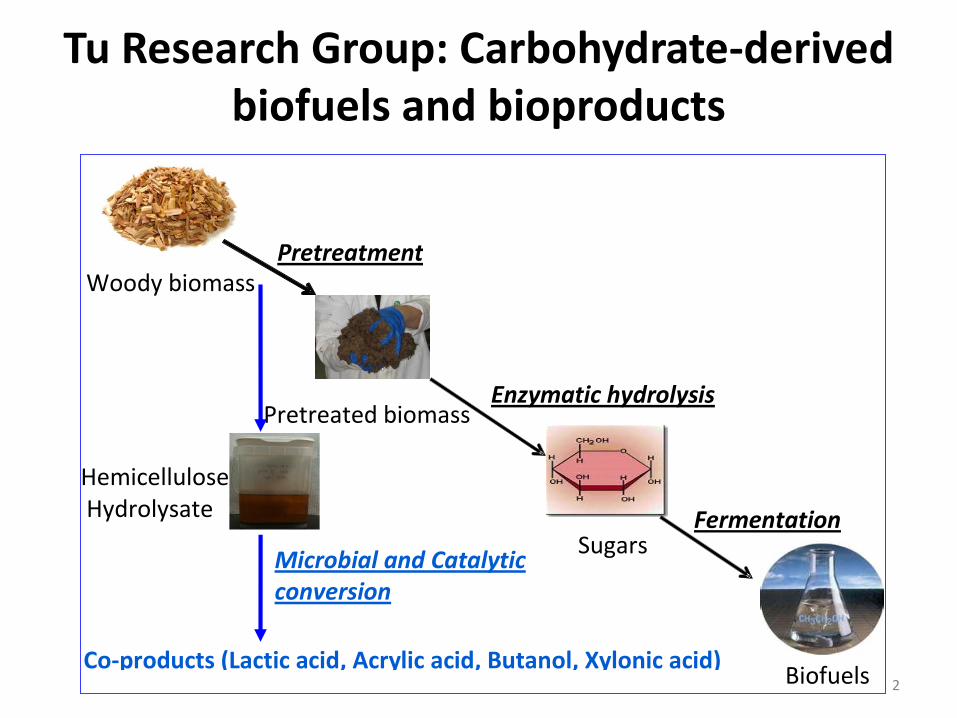
Correlation between distribution coefficient and initial hydrolysis rate
0.05 0.10 0.15 0.20 0.25 0.30 0.35
1.0
1.2
1.4
1.6
1.8
2.0
2.2
2.4In
itial
hyd
roly
sis
rate
(g/
L/h)
Distribution coefficient R (L/g)
R2=0.9, initial hydrolysis rate is well correlated to the Distribution coefficient (R)
14

Effect of pectinase on enzymatic hydrolysis of OPLP and OPSG
0 24 48 72
0
25
50
75
100
0 24 48 72
0
25
50
75
100
Glu
co
se
yie
ld (
%)
Time (hr)
OPLP + Pectinase
OPLP
OPSG + Pectinase
OPSG
Pectinase addition (3.6
mg/g glucan)
1.Initial rate (g L-1 h-1) OPLP >OPSG 1.0 vs 0.7 (10 FPU) 1.0 vs 0.8 (+Pectinase)
2. Final yield 60% to 67% in OPLP
89% to 99.9% in OPSG
15

Effect of pectinase on enzymatic hydrolysis of OPLP and OPSG
0 24 48 72
0
25
50
75
100
0 24 48 72
0
25
50
75
100
Xy
los
e y
ield
(%
)
Time (h)
OPLP + Pectinase
OPLP
OPSG + Pectinase
OPSG
1. Xylose yield increased 43% to 48% in OPLP, 87% to 99.9% in OPSG
16

0 24 48 72
0
25
50
75
100
0 24 48 72
0
25
50
75
100
Glu
co
se
yie
ld (
%)
Time (hr)
OPLP 10 FPU + Xylanase
OPLP 10 FPU
OPSG 10 FPU + Xylanase
OPSG 10 FPU
Effect of xylanase on enzymatic hydrolysis of OPLP and OPSG
Xylanase addition (2.7
mg/g glucan)
1.Initial rate (g L-1 h-1): OPLP >OPSG 1.0 vs 0.7 (10 FPU) 1.0 vs 1.0 (+Xylanase)
2. Final yield 60% to 67% in OPLP
89% to 99.9% in OPSG
17

Effect of xylanase on enzymatic hydrolysis of OPLP and OPSG
0 24 48 72
0
25
50
75
100
0 24 48 72
0
25
50
75
100
Xy
los
e y
ield
(%
)
Time (hr)
OPLP 10 FPU + Xylanase
OPLP 10 FPU
OPSG 10 FPU + Xylanase
OPSG 10 FPU
1. Xylose yield increased 43% to 52% in OPLP
87% to 100% in OPSG
18

• Pectinase supplementation (3.6 mg/g glucan)
– Initial hydrolysis rate (OPSG) did not change much (0.7 vs 0.8)
– Initial hydrolysis rate (OPLP) kept the same (1.0)
– Final hydrolysis yield increased in both substrates • From 60% to 67% in OPLP; from 89% to 99.9% in OPSG
• Xylanase supplementation (2.7 mg/g glucan)
– Initial hydrolysis rate (OPSG) increased by 50% (0.7 vs 1.0)
– Initial hydrolysis rate (OPLP) kept the same (1.0)
– Final hydrolysis yield increased in both substrates • From 60% to 67% in OPLP; from 89% to 99.9% in OPSG
Results and discussion
19

Correlation between residual xylan/lignin and enzymatic hydrolysis
0 5 10
1.0
1.2
1.4
1.6
1.8
2.0
2.2
2.4
OPSG
EPHP
OPLP
EPLP
Initia
l h
ydro
lysis
rate
(g/L
/h)
Xylan (%)
8 10 12 14 16 18 20
75
80
85
90
95
100
105
110
OPLP
EPHP
EPLPOPSG
Fin
al h
yd
roly
sis
yie
ld (
%)
Lignin (%)
Organosolv pretreated lodgepole pine (EPLP), loblolly pine (OPLP), sweetgum (OPSG) and hybrid polar (EPHP).
20

Effects of enzyme loading on SSF
0 24 48 72 96
0.0
0.5
1.0
1.5
2.00 24 48 72 96
0.0
0.5
1.0
1.5
2.0
Xy
los
e c
on
ce
ntr
ati
on
(g
/L)
Time (hr)
OPLP 20 FPU
OPLP 10 FPU
OPSG 20 FPU
OPSG 10 FPU
0 24 48 72 96
0
2
4
6
8
10
0 24 48 72 96
0
2
4
6
8
10
Eth
an
ol
co
nc
en
tra
tio
n (
g/L
)
Time (hr)
OPLP 20 FPU
OPLP 10 FPU
OPSG 20 FPU
OPSG 10 FPU
1. Initial ethanol production rate (OPLP>OPSG): 0.5 vs 0.3 (10 FPU) 0.8 vs 0.6 (20 FPU)
2. Final ethanol yield: OPSG>OPLP 8.8 vs 7.8 (10 FPU), 10.3 vs 9.8 (20 FPU)
1. Decreased in OPSG after 48hr with 20 FPU loading ?
21
• Ethanol production – Initial ethanol production rate: OPLP>OPSG
– Final ethanol yield: OPSG>OPLP
– Same trend as glucan hydrolysis but the crossing point changed (58h)
• Xylose release – Decreased after 48hr with 20 FPU loading
– Potential enzyme-catalyzed reaction between xylose and ethanol
Results and discussion
22

Formation of ethyl xylopyranoside in the process of SSF
8.0 9.0 10.0 11.0 12.0 13.0 14.0 15.0 16.0 17.0 18.0 19.0 20.0 21.0 min
0.00
0.25
0.50
0.75
1.00
uV(x100,000)
8.0 9.0 10.0 11.0 12.0 13.0 14.0 15.0 16.0 17.0 18.0 19.0 20.0 21.0 min
0.0
0.1
0.2
0.3
0.4
0.5
0.6
0.7
0.8
0.9
1.0
uV(x100,000)
Chromatograms in SSF with 20FPU/g glucan (a)softwood; (b) hardwood
Ethyl xylopyranoside
Ethanol
glycerol Xylose
0 hr
2 hr
48 hr
96 hr
23

LC/MS analysis of potential reaction product between xylose and ethanol
OOH
OHOH
OH CH3CH2OH
OOCH2CH3
OHOH
OH H2Oenzyme
H
Xylopyranose Ethanol Ethyl xylopyranoside
as is
m/z 179 180
%
0
100
Sweet gum SSF 20FPU SSF96hr_092612_3 42 (1.712) Cm (39:120) 1: TOF MS ES+ 3.21e3 179.0912
179.0273
178.5125
178.0955
178.1452 178.4682
178.5703
178.9840 178.6145
180.0247
179.1429 179.9775 179.5088
179.1866 179.6135
179.8453 180.1507
24

• Interactions between xylan/lignin and cellulase affect the enzymatic hydrolysis of pretreated biomass – Residual xylan controls the initial hydrolysis rate
– Residual lignin controls the final hydrolysis yield
– Two-phase hydrolysis
• Xylanase supplementation increases initial hydrolysis rate by removing xylan
• Linear correlation between initial hydrolysis rate and distribution coefficient
• Potential enzyme-catalyzed production of ethyl xyloside
Conclusion
25

Acknowledgement
• AAES and OVPR at Auburn University
• Dr. Yonnie Wu (Chemistry and Biochemistry)
• Dr. Sushil Adhikari (Biosystems Engineering)
• Graduate students (Mi Li, Rui Xie, Lu Lu and Jing Li)
26

SEM images of enzymatic hydrolyzed OPLP and OPSG
Enzymatic hydrolyzed biomass OPLP(left) and OPSG (right) ) after 72 hr with 10 FPU 27