Embed Size (px)
Citation preview

DISTINCTIVE DEPENDABLE DRIVEN
Second Quarter Report • June 30, 2016
TABLE OF CONTENTS
1 Message from the President and CEO 2 Management’s Discussion and Analysis 14 Consolidated Statements of Financial Position 15 Consolidated Statements of Earnings15 Consolidated Statements of Comprehensive Income 15 Consolidated Statements of Changes in Equity16 Consolidated Statements of Cash Flows 17 Notes to Consolidated Financial Statements
Accord Financial Corp. is one of North America’s leadingindependent finance companies providing distinctiveworking capital solutions to companies from coast to coast.Whether our clients are shifting into growth mode, or restructuring and rebuilding, Accord is there keepingbusiness liquid.
Our versatile finance programs cover the full spectrumof asset-based lending, from factoring and inventoryfinance, to equipment leasing and trade finance, as well asproviding small businesses with unsecured working capital loans. While our programs are fashioned to theneeds of each client, our goal remains the same: to allowour clients to transform their accounts receivable, inventory and equipment into valuable working capital,which fuels their next phase of growth.
Accord’s nearly forty years of experience allows us to servea broad base of the continent’s most dynamic industrieswith confidence. And our exceptional financial strengthmakes us the lender of choice for private equity partners,finance professionals and their client companies lookingto seize opportunity and drive success.
Accord in ActionKeeping Business Liquid
DISTINCTIVE DEPENDABLE DRIVEN
“Groupe JS International has been in business for more than 40 years.Over the last year and a half we have been financed by Accord Financial,and through the toughest times, Accord has shown the understanding,patience and support that separates them from their competitors. We are forever grateful to the team of professionals at Accord fortheir support and their understanding of the fashion business. Andbeyond their attention to financial detail, is their ability to take apersonal stake in the day-to-day intricacies of our business. I woulddescribe Accord Financial as being in the Relationship Businessmore than just the Banking Business.”
~ Mitchell Hops, PresidentGroupe JS International Apparel Manufacturer
“My experience working with Accord Financial has been nothing shortof exceptional, and I am pleased to recommend the firm and its manytalented professionals with my highest regard. Business owners shouldtake great comfort knowing that Accord Financial operates with integrity,transparency, and efficiency not typically found in the middle market.The uncertain and constantly evolving banking landscape has resultedin many entrepreneurs uncertain about where to turn for liquidity tooperate their company, or growth financing to pursue attractiveexpansion opportunities. Accord is not only a solution to these issues,but a valued added financial partner with the experience and perspective to help companies reach their potential.”
~ Tom Mills, Managing DirectorFocalPoint Partners, LLC
“Javo Beverage is a long-term client of Accord Financial and in thelast 18 months we have experienced significant new business growth.In a true partnership fashion, they have been at our side throughout,responding quickly and creatively to assist us in funding the needsof our growing business. Everyone at Accord is professional, true totheir word, and very importantly you can tell they care about ourbusiness and its success. They are great people to work with.”
~ Gerry Anderson, Chief Financial OfficerJavo Beverage Company
“For nearly ten years B-Town Group has sourced and delivered qualitynatural stone to customers on both sides of the Great Lakes. Accordbegan financing select pieces of equipment in 2010, but it’s thebroad range of financing options that have made Accord my go-tocompany for all our financing needs. We added an AccordOctet supply-chain facility last year to pay royalties as we expanded oursourcing to a fourth quarry. And we recently took advantage ofAccordAccess for short-term working capital, which helped usfinance a large, profitable order from a provincial government entity.With Accord Financial as our partner, our sales have tripled in thelast three years.”
~ Bill Sisson, OwnerB-Town Group

MESSAGE FROM THE PRESIDENT AND CEO
Enclosed are the financial statements, as well as Management’sDiscussion and Analysis, for the quarter and six months endedJune 30, 2016 together with comparative figures for the sameperiod of 2015. These financial statements have not beenreviewed by the Company’s auditors, but have been reviewedand approved by its Audit Committee and Board of Directors.
Net earnings for the second quarter of 2016 declined 6% to$1,627,000 compared with $1,736,000 in the second quarter of2015. Earnings per share (“EPS”) were 20 cents this year, 5%below the 21 cents earned last year. Second quarter net earningsdecreased on lower revenue.
Adjusted net earnings, which comprise net earnings beforenon-operating stock-based compensation and business acquisitionexpenses, totalled $1,800,000 in the second quarter of 2016, 5% below the $1,885,000 earned in the second quarter of 2015.Adjusted EPS, based on the adjusted net earnings, were 22 centsin the second quarter, 4% lower than the 23 cents earned in lastyear’s second quarter.
Revenue declined 10% to $6,897,000 in the second quartercompared to $7,657,000 last year mainly as a result of lowerreceivables management fees.
The Company's total finance receivables and loans were at $147 million at June 30, 2016, 7% lower than the $158 millionlast June 30. Average funds employed in the quarter totalled$152 million compared with $155 million last year. Equity was$72 million at June 30, 2016 compared to $66 million at June 30,2015. Book value per share was $8.69 versus $7.90 a year ago.
Net earnings for the first half of 2016 declined 10% to $3,091,000from the $3,441,000 earned in the first half of 2015. EPS decreasedto 37 cents this year compared with 41 cents last year. Net earningsdecreased as a result of lower revenue.
Adjusted net earnings totalled $3,390,000 in the first half of 2016,10% below the $3,749,000 earned in the first six months of 2015.Adjusted EPS were 41 cents, 9% below the 45 cents earned inthe first half of 2015.
Revenue declined 10% to $13,768,000 compared to $15,216,000in the first half of 2015 mainly for the reason noted above. Averagefunds employed in the first six months totalled $147 millioncompared with $148 million last year.
The first half of the year proved more difficult than expectedwith respect to growing our net funds employed. They totalled$147 million at June 30, 2016 versus $144 million at the end ofMarch, 2016 and $158 million at the end of the second quarterlast year. A number of Canadian clients qualified for traditionalfinancing during the first half of the year, while we had slowerthan planned growth in the U.S. In spite of this, funds employedhave grown since March 31, 2016. I am happy to report ournew business pipeline in both countries remains solid and amhopeful we will convert more of that pipeline to active clients inthe second half of the year.
We opened a new office at the end of June. It is located in suburbanChicago and is led by Sue Duckett an experienced factoringexecutive who has managed factoring businesses in the U.K.and the U.S. Sue is starting operations with a total staff of threewhich will grow commensurate with the increase in clientele.Named “Accord Business Finance” this new unit will providefactoring facilities for smaller businesses than those served byour South Carolina office. There are many participants in thismarket in the U.S. but none led by Sue Duckett and none thatboast the name of Accord. We expect this unit to grow andbecome an ever-increasing contributor to our earnings.
At the Board of Directors meeting held today, a quarterly dividendof 9 cents per common share was declared payable September 1,2016 to shareholders of record August 15, 2016.
Tom HendersonPresident and Chief Executive OfficerJuly 27, 2016
Second Quarter Report 2016 | 1
Tom Henderson

MANAGEMENT’S DISCUSSION AND ANALYSIS OFRESULTS OF OPERATIONS AND FINANCIAL CONDITION (“MD&A”)
Quarter and six months ended June 30, 2016 compared with quarter and six months ended June 30, 2015
2 | Accord Financial Corp.
Overview
The following discussion and analysis explains trends inAccord Financial Corp.’s (“Accord” or the “Company”) resultsof operations and financial condition for the quarter and sixmonths ended June 30, 2016 compared with the quarter and sixmonths ended June 30, 2015 and, where presented, the quarterand six months ended June 30, 2014. It is intended to helpshareholders and other readers understand the dynamics of theCompany’s business and the factors underlying its financialresults. Where possible, issues have been identified that mayimpact future results.
This MD&A, which has been prepared as at July 27, 2016,should be read in conjunction with the Company’s condensedinterim unaudited consolidated financial statements (the“Statements”) and notes thereto for the quarters and six monthsended June 30, 2016 and 2015, which are included as part ofthis 2016 Second Quarter Report, and as an update in conjunctionwith the discussion and analysis and fiscal 2015 audited consolidated financial statements and notes thereto included inthe Company’s 2015 Annual Report.
All amounts discussed in this MD&A are expressed in Canadiandollars unless otherwise stated and have been prepared inaccordance with International Financial Reporting Standards(“IFRS”). Please refer to the Critical Accounting Policies andEstimates section below and note 2 and 3 to the Statementsregarding the Company’s use of accounting estimates in thepreparation of its financial statements in accordance with IFRS.Additional information pertaining to the Company, includingits Annual Information Form, is filed under the Company’sprofile with SEDAR at www.sedar.com.
The following discussion contains certain forward-lookingstatements that are subject to significant risks and uncertaintiesthat could cause actual results to differ materially from historical
results and percentages. Factors that may impact future resultsare discussed in the Risks and Uncertainties section below.
Non-IFRS Financial Measures
In addition to the IFRS prepared results and balances presentedin the Statements and notes thereto, the Company uses a numberof other financial measures to monitor its performance andsome of these are presented in this MD&A. These measures maynot have standardized meanings or computations as prescribedby IFRS that would ensure consistency and comparability betweencompanies using them and are, therefore, considered to benon-IFRS measures. The Company primarily derives thesemeasures from amounts presented in its Statements, whichwere prepared in accordance with IFRS. The Company's focuscontinues to be on IFRS measures and any other informationpresented herein is purely supplemental to help the reader betterunderstand the key performance indicators used in monitoringits operating performance and financial position. The non-IFRSmeasures presented in this MD&A are defined as follows:
i) Return on average equity (“ROE”) – this is a profitability measure that presents the net earnings available to common shareholders as a percentage of the average equity employed to earn the income. The Company includes all components of equity to calculate the average thereof;
ii) Adjusted net earnings, adjusted earnings per common share and adjusted ROE – adjusted net earnings presents net earnings before stock-based compensation and business acquisition expenses (namely, business transaction and integration costs and amortization of intangibles). The Company considers these items to be non-operating expenses. Management believes adjusted net earnings is a more appropriate measure of operating performance than net earnings as it excludes items which do not directly relate to ongoing operating activities. Adjusted (basic and diluted)

earnings per common share is adjusted net earnings divided by the (basic and diluted) weighted average number of common shares outstanding in the period, while adjusted ROE is adjusted net earnings for the period expressed as a percentage of average equity employed in the period (expressed as an annualized percentage);
iii) Book value per share – book value is the net asset value of the Company calculated as total assets minus total liabilities and, by definition, is the same as total equity. Book value per share is the net asset value divided by the number of common shares outstanding as of a particular date;
iv) Financial condition and leverage ratios – (a) equity expressed as a percentage of total assets; and (b) debt (bank indebtedness and notes payable) expressed as a percentage of equity. These percentages provide information on trends in the Company’s financial position and leverage.
v) Average funds employed – funds employed is another name that the Company uses for its finance receivables and loans (also referred to as “Loans” in this MD&A), an IFRS measure. Average funds employed are the average finance receivables and loans calculated over a particular period.
Accord’s Business
Accord is a leading North American provider of asset-basedfinancial services to businesses, namely, asset-based lending(“ABL”), including factoring, lease and equipment financing,working capital financing, credit protection and receivablesmanagement, and supply chain financing for importers. TheCompany’s financial services are discussed in more detail in its2015 Annual Report. Its clients operate in a wide variety ofindustries, examples of which are set out in note 17(a) to theStatements.
The Company founded in 1978 operates four finance companiesin North America, namely, Accord Financial Ltd. (“AFL”),Accord Financial Inc. (“AFIC”) and Varion Capital Corp.(“Varion”) (now doing business as Accord Financial, SmallBusiness Finance (“ASBF”)) in Canada, and Accord Financial,Inc. (“AFIU”) in the United States.
The Company’s business principally involves: (i) asset-basedlending by AFIC and AFIU, which entails financing or purchasingreceivables on a recourse basis, as well as financing other tangibleassets, such as inventory and equipment; (ii) lease financingand equipment and working capital lending by ASBF; and (iii) credit protection and receivables management services byAFL, which principally involves providing credit protection andcollection services, generally without financing.
Results of OperationsQuarter ended June 30, 2016 compared with quarter ended June 30, 2015
Net earnings for the quarter ended June 30, 2016 decreased by$109,000 or 6% to $1,627,000 compared to the $1,736,000 earnedin 2015. They were 6% above 2014’s first quarter net earningsof $1,537,000. Net earnings decreased compared to 2015 as aresult of lower revenue, while it increased compared to 2014mainly due to lower income tax expense, provision for lossesand interest expense.
Earnings per common share decreased by 5% to 20 cents fromthe 21 cents earned in the second quarter of 2015. They were11% higher than the 18 cents earned in the second quarter of 2014.
Adjusted net earnings for the second quarter were $1,800,000,5% below the $1,885,000 earned in the second quarter of 2015but 13% higher than the $1,593,000 earned in the second quarterof 2014. Adjusted EPS were 22 cents compared to the 23 centsearned in the second quarter of 2015 and 19 cents earned in 2014.
Second Quarter Report 2016 | 3
Stuart Adair
The following table provides a reconciliation of net earnings toadjusted net earnings:
Three months ended June 30 (in thousands) 2016 2015
Net earnings $ 1,627 $ 1,736
Adjustments, net of tax: Stock-based compensation 79 43 Business acquisition expenses 94 106
Adjusted net earnings $ 1,800 $ 1,885
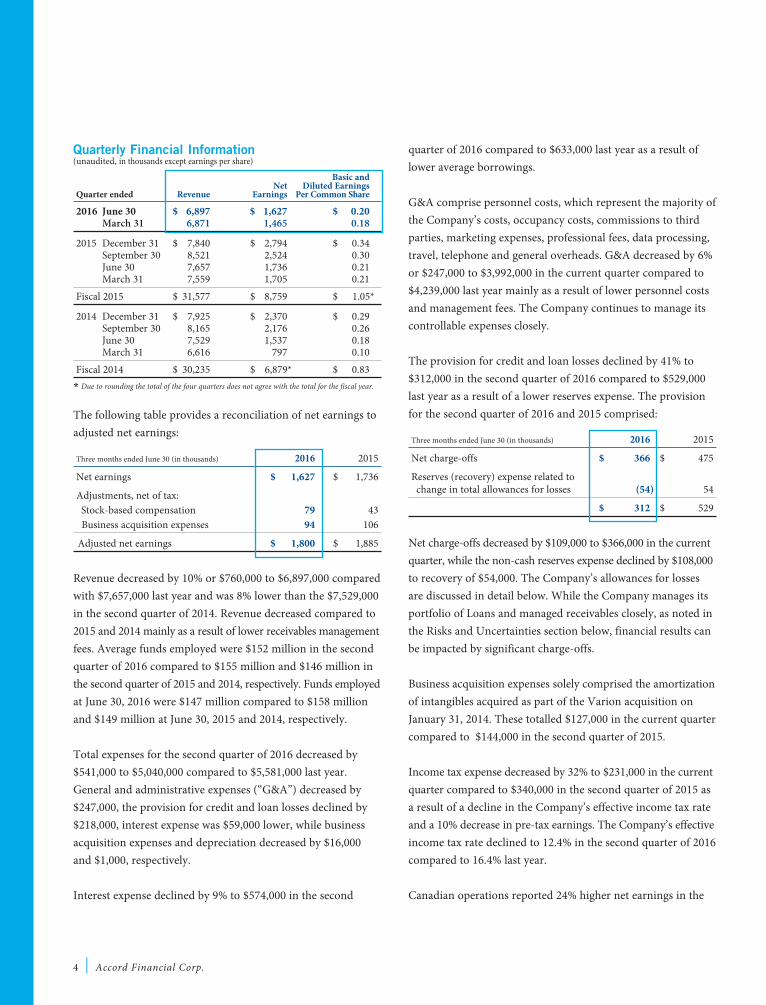
Revenue decreased by 10% or $760,000 to $6,897,000 comparedwith $7,657,000 last year and was 8% lower than the $7,529,000in the second quarter of 2014. Revenue decreased compared to2015 and 2014 mainly as a result of lower receivables managementfees. Average funds employed were $152 million in the secondquarter of 2016 compared to $155 million and $146 million inthe second quarter of 2015 and 2014, respectively. Funds employedat June 30, 2016 were $147 million compared to $158 millionand $149 million at June 30, 2015 and 2014, respectively.
Total expenses for the second quarter of 2016 decreased by$541,000 to $5,040,000 compared to $5,581,000 last year.General and administrative expenses (“G&A”) decreased by$247,000, the provision for credit and loan losses declined by$218,000, interest expense was $59,000 lower, while businessacquisition expenses and depreciation decreased by $16,000and $1,000, respectively.
Interest expense declined by 9% to $574,000 in the second
quarter of 2016 compared to $633,000 last year as a result oflower average borrowings.
G&A comprise personnel costs, which represent the majority ofthe Company’s costs, occupancy costs, commissions to thirdparties, marketing expenses, professional fees, data processing,travel, telephone and general overheads. G&A decreased by 6%or $247,000 to $3,992,000 in the current quarter compared to$4,239,000 last year mainly as a result of lower personnel costsand management fees. The Company continues to manage itscontrollable expenses closely.
The provision for credit and loan losses declined by 41% to$312,000 in the second quarter of 2016 compared to $529,000last year as a result of a lower reserves expense. The provisionfor the second quarter of 2016 and 2015 comprised:
Three months ended June 30 (in thousands) 2016 2015
Net charge-offs $ 366 $ 475
Reserves (recovery) expense related to change in total allowances for losses (54) 54
$ 312 $ 529
Net charge-offs decreased by $109,000 to $366,000 in the currentquarter, while the non-cash reserves expense declined by $108,000to recovery of $54,000. The Company’s allowances for lossesare discussed in detail below. While the Company manages itsportfolio of Loans and managed receivables closely, as noted inthe Risks and Uncertainties section below, financial results canbe impacted by significant charge-offs.
Business acquisition expenses solely comprised the amortizationof intangibles acquired as part of the Varion acquisition onJanuary 31, 2014. These totalled $127,000 in the current quartercompared to $144,000 in the second quarter of 2015.
Income tax expense decreased by 32% to $231,000 in the currentquarter compared to $340,000 in the second quarter of 2015 asa result of a decline in the Company’s effective income tax rateand a 10% decrease in pre-tax earnings. The Company’s effectiveincome tax rate declined to 12.4% in the second quarter of 2016compared to 16.4% last year.
Canadian operations reported 24% higher net earnings in the
4 | Accord Financial Corp.
Quarterly Financial Information(unaudited, in thousands except earnings per share)
Basic and Net Diluted Earnings Quarter ended Revenue Earnings Per Common Share
2016 June 30 $ 6,897 $ 1,627 $ 0.20 March 31 6,871 1,465 0.18
2015 December 31 $ 7,840 $ 2,794 $ 0.34 September 30 8,521 2,524 0.30 June 30 7,657 1,736 0.21 March 31 7,559 1,705 0.21 Fiscal 2015 $ 31,577 $ 8,759 $ 1.05*
2014 December 31 $ 7,925 $ 2,370 $ 0.29 September 30 8,165 2,176 0.26 June 30 7,529 1,537 0.18 March 31 6,616 797 0.10 Fiscal 2014 $ 30,235 $ 6,879* $ 0.83
* Due to rounding the total of the four quarters does not agree with the total for the fiscal year.

second quarter of 2016 compared to 2015 (see note 16 to theStatements). Net earnings rose by $146,000 to $760,000 on lowerexpenses. Revenue declined by 11% or $536,000 to $4,562,000.Expenses decreased by $744,000 to $3,512,000. G&A declinedby $368,000 to $2,692,000, while the provision for credit andloan losses declined by $304,000 to $107,000. Interest expense,business acquisition expenses and depreciation were $54,000,$17,000 and $1,000 lower, respectively. Income tax expenseincreased by 27% to $290,000 on a 25% rise in pre-tax earnings.
U.S. operations reported a 23% decrease in net earnings in thesecond quarter of 2016 compared to 2015. Net earnings declinedby $255,000 to $867,000 on lower revenue and higher expenses.Revenue decreased by $225,000 or 9% to $2,335,000. Expensesincreased by $201,000 to $1,527,000. G&A rose by $120,000 to$1,300,000, while the provision for losses was $87,000 higher at$205,000. Depreciation remained unchanged. Interest expensedecreased by $6,000 to $11,000. Income tax expense declined by$171,000 to a recovery of $59,000.
Six months ended June 30, 2016 compared with six monthsended June 30, 2015
Net earnings in the first half of 2016 decreased by $350,000 or10% to $3,091,000 compared to $3,441,000 last year. Net earningsdecreased compared to 2015 as a result of lower revenue. EPSfor the current six months were 37 cents, 10% below the 41 centsearned last year. ROE in the first half of 2016 was 8.5% comparedto 10.8% last year.
Adjusted net earnings totalled $3,390,000 in the first half of 2016,10% below last year’s $3,749,000. Adjusted EPS declined 9% to41 cents compared to 45 cents in the first half of 2015. AdjustedROE for the first half of 2016 was 9.5% compared to 11.7% in 2015.
The following table provides a reconciliation of net earnings toadjusted net earnings:
Six months ended June 30 (in thousands) 2016 2015
Net earnings $ 3,091 $ 3,441 Adjustments, net of tax: Stock-based compensation 112 97 Business acquisition expenses 187 211
Adjusted net earnings $ 3,390 $ 3,749
Revenue for the first half of 2016 decreased by $1,448,000 or10% to $13,768,000 compared with $15,216,000 last year.Revenue decreased compared to 2015 mainly as a result of lowerreceivables management fees. Average funds employed in thefirst half of 2016 were $147 million compared to $148 millionlast year.
Total expenses for the current six months decreased by $771,000or 7% to $10,341,000 compared to $11,112,000 last year. G&A,the provision for losses, interest expense, business acquisitionexpenses and depreciation declined by $506,000, $162,000,$69,000, $33,000 and $1,000, respectively.
Interest expense declined by 6% to $1,075,000 compared to$1,144,000 last year on lower average borrowings this year.
G&A decreased by 6% to $8,096,000 compared to $8,602,000last year mainly as a result of lower personnel costs and management fees.
The provision for credit and loan losses declined by 16% to$847,000 in the first half of 2016 compared to $1,009,000 lastyear. The provision for the first half of 2016 and 2015 comprised:
Six months ended June 30 (in thousands) 2016 2015
Net charge-offs $ 816 $ 841
Reserves expense related to changein total allowances for losses 31 168
$ 847 $ 1,009
Net charge-offs declined by $25,000 in the first half of 2016compared to last year, while the reserves expense decreased by$137,000 to $31,000.
Business acquisition expenses comprised the amortization ofintangibles acquired as part of the Varion acquisition. For thesix months ended June 30, 2016, these expenses totalled $255,000compared with $288,000 in the first six months of 2015.
Income tax expense decreased by $327,000 or 49% to $336,000compared to $663,000 in the first half of 2015 as a result of adecline in the Company’s effective income tax rate and a 16%decline in pre-tax earnings. The Company’s effective incometax rate decreased to 9.8% this year compared to 16.2%.
Second Quarter Report 2016 | 5
Canadian operations reported a small decrease in net earningsin the first six months of 2016 compared to 2015 (see note 16 tothe Statements). Net earnings declined by $6,000 to $1,235,000compared to $1,241,000 last year on lower revenue, which waslargely offset by lower expenses. Revenue decreased by $1,052,000or 10% to $9,007,000. Expenses declined by $1,059,000 to$7,293,000. G&A was lower by $758,000 at $5,430,000, while theprovision for credit and loan losses declined by $211,000 to$489,000. Interest expense and business acquisition expensesdecreased by $57,000 and $33,000, respectively. Depreciationremained unchanged. Income tax expense rose by $13,000 to $479,000.
U.S. operations reported a 16% decline in net earnings comparedto the first half of 2015. Net earnings decreased by $344,000 to$1,856,000 compared to $2,200,000 last year. Revenue decreasedby $387,000 or 8% to $4,790,000. Expenses increased by $297,000or 11% to $3,077,000. G&A increased by $252,000 to $2,666,000,while the provision for loan losses rose by $49,000 to $358,000.Depreciation expense remained unchanged. Interest expensedeclined by $4,000 to $31,000. Income tax expense decreased by$340,000 to a recovery of $143,000.
Review of Financial Position
Equity at June 30, 2016 was a $72,222,000, a decrease of $844,000compared to $73,066,000 at December 31, 2015 but $6,593,000above the $65,629,000 at June 30, 2015. Book value per common share was $8.69 at June 30, 2016 compared to $8.79 at December 31, 2015 and $7.90 a year earlier. The decrease inequity since December 31, 2015 mainly resulted from the$2,492,000 reduction in the accumulated other comprehensiveincome (“AOCI”) balance. The components of equity are discussed below. Please also see the consolidated statements ofchanges in equity on page 15 of this Second Quarter Report.
Total assets were $158,160,000 at June 30, 2016 compared to$154,560,000 at December 31, 2015 and $173,785,000 at June 30,2015. Total assets largely comprised Loans. Excluding inter-company loans, identifiable assets located in the United Stateswere 49% of total assets at June 30, 2016 compared to 50% and39%, respectively, at December 31, 2015 and June 30, 2015.
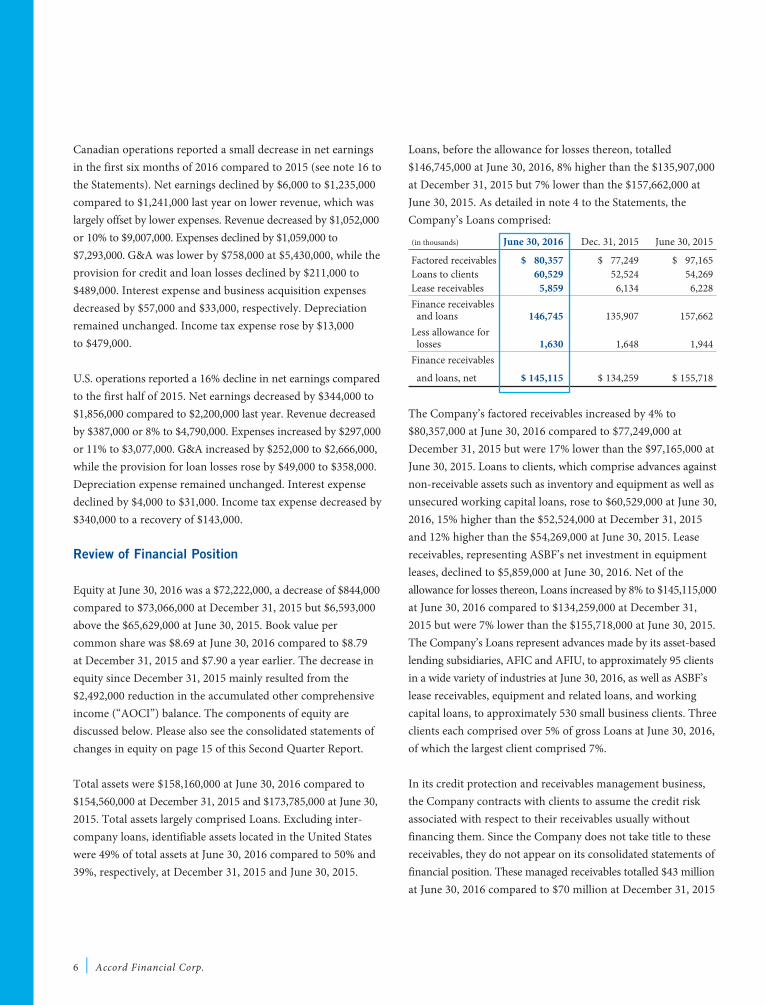
Loans, before the allowance for losses thereon, totalled$146,745,000 at June 30, 2016, 8% higher than the $135,907,000at December 31, 2015 but 7% lower than the $157,662,000 atJune 30, 2015. As detailed in note 4 to the Statements, theCompany’s Loans comprised:
(in thousands) June 30, 2016 Dec. 31, 2015 June 30, 2015
Factored receivables $ 80,357 $ 77,249 $ 97,165 Loans to clients 60,529 52,524 54,269 Lease receivables 5,859 6,134 6,228 Finance receivables and loans 146,745 135,907 157,662 Less allowance for losses 1,630 1,648 1,944 Finance receivables
and loans, net $ 145,115 $ 134,259 $ 155,718
The Company’s factored receivables increased by 4% to$80,357,000 at June 30, 2016 compared to $77,249,000 atDecember 31, 2015 but were 17% lower than the $97,165,000 atJune 30, 2015. Loans to clients, which comprise advances againstnon-receivable assets such as inventory and equipment as well asunsecured working capital loans, rose to $60,529,000 at June 30,2016, 15% higher than the $52,524,000 at December 31, 2015and 12% higher than the $54,269,000 at June 30, 2015. Leasereceivables, representing ASBF’s net investment in equipmentleases, declined to $5,859,000 at June 30, 2016. Net of theallowance for losses thereon, Loans increased by 8% to $145,115,000at June 30, 2016 compared to $134,259,000 at December 31,2015 but were 7% lower than the $155,718,000 at June 30, 2015.The Company’s Loans represent advances made by its asset-basedlending subsidiaries, AFIC and AFIU, to approximately 95 clientsin a wide variety of industries at June 30, 2016, as well as ASBF’slease receivables, equipment and related loans, and workingcapital loans, to approximately 530 small business clients. Threeclients each comprised over 5% of gross Loans at June 30, 2016,of which the largest client comprised 7%.
In its credit protection and receivables management business,the Company contracts with clients to assume the credit riskassociated with respect to their receivables usually withoutfinancing them. Since the Company does not take title to thesereceivables, they do not appear on its consolidated statements offinancial position. These managed receivables totalled $43 millionat June 30, 2016 compared to $70 million at December 31, 2015
6 | Accord Financial Corp.

and $53 million at June 30, 2015. Managed receivables comprisethe receivables of approximately 90 clients at June 30, 2016.The 25 largest clients comprised 78% of non-recourse volumein the first half of 2016. Most of the clients’ customers uponwhich the Company assumes the credit risk are “big box”, apparel,home furnishings and footwear retailers in Canada and theUnited States. At June 30, 2016, the 25 largest customersaccounted for 62% of the total managed receivables, of whichthe largest five comprised 27%. The Company monitors the retailindustry and the credit risk related to its managed receivablesvery closely. The managed receivables are regularly reviewedand continue to be well rated.
The Company’s total portfolio, which comprises both grossLoans, and managed receivables as set out above, decreased to$190 million at June 30, 2016 compared to $206 million atDecember 31, 2015 and $211 million at June 30, 2015.
As described in note 17(a) to the Statements, the Company’sbusiness involves funding or assuming the credit risk on thereceivables offered to it by its clients, as well as financing otherassets such as inventory and equipment. Credit in the Company’sasset-based lending, including leasing, and credit protectionbusiness is approved by a staff of credit officers, with largeramounts being authorized by supervisory personnel, managementand, in the case of credit in excess of $1.0 million, the Company'sPresident and the Chairman of its Board. Credit in excess of$2.5 million is approved by the Company's Credit Committee,which comprises three independent members of its Board. TheCompany monitors and controls its risks and exposures throughfinancial, credit and legal systems and, accordingly, believesthat it has procedures in place for evaluating and limiting thecredit risks to which it is subject. Credit is subject to ongoingmanagement review. Nevertheless, for a variety of reasons,there will inevitably be defaults by clients or their customers.
In its asset-based lending operations, the Company’s primaryfocus continues to be on the creditworthiness and collectabilityof its clients’ receivables. The clients’ customers have varyingpayment terms depending on the industries in which theyoperate, although most customers have payment terms of 30 to 60 days from invoice date. ASBF’s lease receivables and equipment and working capital loans are term loans with
payments usually spread out evenly over the term of the leaseor loan, which can typically be up to 60 months. Of the totalmanaged receivables that the Company guarantees payment,3.6% were past due more than 60 days at June 30, 2016. In theCompany’s asset-based lending business, receivables become“ineligible” for lending purposes when they reach a certain pre-determined age, typically 75 to 90 days from invoice date,and are usually charged back to clients, thereby limiting theCompany’s credit risk on such older receivables.
The Company employs a client rating system to assess creditrisk in its asset-based lending and leasing businesses, whichreviews, amongst other things, the financial strength of eachclient and the Company’s underlying security, while in its creditprotection business it employs a customer credit scoring systemto assess the credit risk associated with the managed receivablesthat it guarantees. Credit risk is primarily managed by ensuringthat, as far as possible, the receivables financed are of the highestquality and that any inventory, equipment or other assets securingloans are appropriately appraised. In its asset-based lendingoperations, the Company assesses the financial strength of itsclients’ customers and the industries in which they operate on aregular and ongoing basis. The financial strength of its clients’customers is often more important than the financial strengthof the clients themselves.
The Company also minimizes credit risk by limiting the maximumamount that it will lend to any one client, enforcing strict advancerates, disallowing certain types of receivables and applying concentration limits, charging back or making receivables ineligible for lending purposes as they become older, and takingcash collateral in certain cases. The Company will also confirmthe validity of the receivables that it purchases. In its asset-basedlending, the Company administers and collects the majority ofits clients’ receivables and so is able to quickly identify problemsas and when they arise and act promptly to minimize creditand loan losses. In the Company’s leasing operations, securitydeposits are obtained in respect of each equipment lease orloan. In its credit protection business, each customer is providedwith a credit limit up to which the Company will guarantee thatcustomer’s total receivables. As noted above, all customer creditin excess of $2.5 million is approved by the Company’s CreditCommittee on a case-by-case basis. Note 17(a) to the
Second Quarter Report 2016 | 7
Statements provides details of the Company’s credit exposureby industrial sector.
After the customary detailed quarter-end review of the Company’sportfolio by its Risk Management Committee, it was determinedthat all problem loans and accounts were identified and providedfor where necessary. The Company maintains separateallowances for losses on both its Loans and its guarantee ofmanaged receivables, at amounts which, in management’s judgment, are sufficient to cover losses thereon. The allowancefor losses on Loans decreased to $1,630,000 at June 30, 2016compared to $1,648,000 at December 31, 2015. The allowance was16% lower than the $1,944,000 at June 30, 2015. The allowance forlosses on the guarantee of managed receivables increased 11% to$185,000 at June 30, 2016 compared to $166,000 at December 31,2015 but was lower than the $203,000 at June 30, 2015. Thisallowance represents the fair value of estimated payments toclients under the Company’s guarantees to them. The allowanceis included in the total of accounts payable and other liabilitiesas the Company does not take title to the managed receivables andthey are not included on its consolidated statements of financialposition. The activity in the allowance for losses accounts forthe first six months of 2016 and 2015 is set out in note 4 to theStatements. The estimates of both allowance for losses are judgmental. Management considers them to be reasonable and appropriate.
Cash declined to $5,348,000 at June 30, 2016 compared with$12,440,000 at December 31, 2015 and $8,510,000 at June 30, 2015.The Company endeavors to minimize cash balances as far aspossible when it has bank indebtedness outstanding. Fluctuationsin cash balances are normal.
Assets held for sale, which comprise certain assets securingdefaulted loans that the Company obtained title to or repossessed,are stated at their net realizable value and totalled $1,399,000 atJune 30, 2016 compared to $1,544,000 at December 31, 2015and $1,811,000 last June 30. The assets will be sold as marketconditions permit. Please refer to note 5 to the Statements fordetails of changes in the assets held for sale during the first halfof 2016 and 2015. During the first half of 2016, the Companysold certain assets held for sale with a book value of $168,000resulting in a loss on sale of $59,000. The Company also obtainedtitle to or repossessed certain equipment with an estimated net
realizable value of $23,000. During the first half of 2015, theCompany sold certain assets held for sale with a book value of$1,157,000 for $1,165,000 resulting in a gain on sale of $8,000.The Company also repossessed certain equipment with an estimated net realizable value of $734,000. The estimated netrealizable value of the assets at June 30, 2016 and 2015 andDecember 31, 2015 was estimated based upon appraisals of the assets.
Intangible assets were acquired as part of the Varion acquisitionon January 31, 2014 and comprise existing customer contractsand broker relationships. Intangible assets, net of accumulatedamortization, totalled $1,241,000 at June 30, 2016 compared to$1,496,000 at December 31, 2015 and $1,784,000 at June 30, 2015.Please refer to note 6 to the Statements.
Goodwill totalled $3,125,000 at June 30, 2016 compared to$3,213,000 at December 31, 2015 and $3,084,000 at June 30, 2015.Goodwill of $1,883,000 was acquired as part of the Varionacquisition on January 31, 2014. Goodwill of US$962,000 is alsocarried in the Company’s U.S. operations and is translated intoCanadian dollars at the prevailing period-end exchange rate;foreign exchange adjustments usually arise on retranslation.Please refer to note 7 to the Statements.
Income taxes receivable, other assets, deferred tax assets andcapital assets at June 30, 2016 and 2015 and December 31, 2015were not material.
Total liabilities increased by $4,444,000 to $85,938,000 at June 30, 2016 compared to $81,494,000 at December 31, 2015but were $22,218,000 lower than the $108,156,000 at June 30, 2015.The increase since December 31, 2015 mainly resulted fromhigher bank indebtedness.
Amounts due to clients decreased by $4,820,000 to $4,582,000at June 30, 2016 compared to $9,402,000 at December 31, 2015and were $1,744,000 lower than the $6,326,000 at June 30, 2015.Amounts due to clients principally consist of collections ofreceivables not yet remitted to clients. Contractually, theCompany remits collections within a few days of receipt.Fluctuations in amounts due to clients are not unusual.
8 | Accord Financial Corp.

Bank indebtedness increased by $11,974,000 to $66,068,000 atJune 30, 2016 compared with $54,094,000 at December 31, 2015but was $14,568,000 lower than the $80,636,000 at June 30, 2015.Bank indebtedness increased compared to last December 31largely to fund the rise in Loans. The Company had approvedcredit lines with a number of banks totalling $136 million atJune 30, 2016 and was in compliance with all loan covenantsthereunder in the six months ended June 30, 2016. The Company’scredit lines are typically renewed for a period of one or two yearsat a time as circumstances dictate. Bank indebtedness usuallyfluctuates with the quantum of Loans outstanding. The Companyhas no term debt outstanding.
Notes payable decreased to $11,629,000 at June 30, 2016 comparedto $13,201,000 at December 31, 2015 and $16,623,000 at June 30,2015. The decrease in notes payable resulted from redemptions,net of new notes issued and accrued interest. Please see RelatedParty Transactions section below and note 9 to the Statements.
Accounts payable and other liabilities, income taxes payable,deferred income and deferred tax liabilities at June 30, 2016 and2015 and December 31, 2015 were not material.
Capital stock totalled $6,896,000 at June 30, 2016 and 2015 andDecember 31, 2015. There were 8,307,713 common shares outstanding at those dates. Please see note 10 to the Statementsand the consolidated statements of changes in equity on page 15of this report for details of changes in capital stock in the firsthalf of 2016 and 2015. At the date of this MD&A, July 27, 2016,8,307,713 common shares were outstanding.
Retained earnings totalled $58,662,000 at June 30, 2016 comparedto $57,066,000 at December 31, 2015 and $53,244,000 at June 30,2015. In the first half of 2016, retained earnings increased by$1,596,000, which comprised net earnings of $3,091,000 lessdividends paid of $1,495,000 (18 cents per common share).Please see the consolidated statements of changes in equity onpage 15 of this report for details of changes in retained earningsduring the first half of 2016 and 2015.
The Company’s AOCI account solely comprises the cumulativeunrealized foreign exchange income arising on the translationof the assets and liabilities of the Company’s foreign subsidiariesthat report in U.S. dollars. The AOCI balance totalled $6,551,000
at June 30, 2016 compared to $9,043,000 at December 31, 2015and $5,446,000 at June 30, 2015. Please refer to note 14 to theStatements and the consolidated statements of changes in equity on page 15 of this report, which details movements inthe AOCI account during the first half of 2016 and 2015. The$2,492,000 decline in the first six months of 2016 resulted froma fall in the value of the U.S. dollar against the Canadian dollar.The U.S. dollar weakened from $1.3840 at December 31, 2015to $1.2917 at June 30, 2016. This decreased the Canadian dollarequivalent book value of the Company’s net investment in itsforeign subsidiaries of approximately US$27 million by$2,492,000 in the first half of 2016.
Liquidity and Capital Resources
The Company considers its capital resources to include equityand debt, namely, its bank indebtedness and notes payable. TheCompany has no term debt outstanding. The Company’s objectiveswhen managing its capital are to: (i) maintain financial flexibilityin order to meet financial obligations and continue as a goingconcern; (ii) maintain a capital structure that allows theCompany to finance its growth using internally-generated cashflow and debt capacity; and (iii) optimize the use of its capitalto provide an appropriate investment return to its shareholderscommensurate with risk.
The Company manages its capital resources and makes adjustments to them in light of changes in economic conditionsand the risk characteristics of its underlying assets. To maintainor adjust its capital resources, the Company may, from time totime, change the amount of dividends paid to shareholders,return capital to shareholders by way of normal course issuerbid, issue new shares, or reduce liquid assets to repay debt.Amongst other things, the Company monitors the ratio of itsdebt to equity and its equity to total assets, principally Loans.These ratios are set out in the table below.
(as a percentage) June 30, 2016 Dec. 31, 2015 June 30, 2015 Debt* / Equity 108% 92% 148% Equity / Assets 46% 47% 38%
*bank indebtedness and notes payable
The Company’s financing and capital requirements generallyincrease with the level of Loans outstanding. The collection periodand resulting turnover of outstanding receivables also impact
Second Quarter Report 2016 | 9

Net cash inflow from financing activities totalled $11,377,000 inthe first six months of 2016 compared to an inflow of $12,682,000last year. The net cash inflow in the current six months resultedfrom an increase in bank indebtedness of $14,442,000. Partiallyoffsetting this inflow were dividend payments of $1,495,000 andnotes payables issued, net of $1,570,000. The net cash inflow in the first half of 2015 resulted from an increase in bankindebtedness of $14,280,000. Partially offsetting these inflowswere dividend payments of $1,412,000 and notes payable, net,redeemed of 186,000.
The effect of exchange rate changes on cash totalled $704,000and $681,000 in the first half of 2016 and 2015, respectively.
Overall, there was a net cash outflow of $7,092,000 in the firstsix months of 2016 compared to an inflow of $1,407,000 in thefirst half of 2015.
Contractual Obligations and Commitments at June 30,2016
Payments due in Less than 1 to 3 4 to 5 (in thousands of dollars) 1 year years years Total
Operating leaseobligations $ 372 $ 28 $ — $ 400Purchase obligations 139 85 — 224
$ 511 $ 113 $ — $ 624
Related Party Transactions
The Company has borrowed funds (notes payable) on an unsecured basis from shareholders, management, employees,other related individuals and third parties. These notes arerepayable on demand or, in the case of one note, a week afterdemand and bear interest at rates that vary with bank Prime orLibor. The rates are at or below those charged by the Company’sbank. Notes payable at June 30, 2016 were $11,629,000 comparedwith $13,201,000 at December 31, 2015 and $16,623,000 at June 30, 2015. Of these notes payable, $10,585,000 (December 31,2015 – $11,788,000; June 30, 2015 – $15,115,000) was owing torelated parties and $1,044,000 (December 31, 2015 – $1,413,000;June 30, 2015 – $1,508,000) to third parties. Interest expense onthese notes in the current quarter and first half of 2016 totalled
10 | Accord Financial Corp.
financing needs. In addition to cash flow generated from operations, the Company maintains bank lines of credit inCanada and the United States. The Company can also raise fundsthrough its notes payable program.
The Company had bank credit lines totalling $136 million atJune 30, 2016 and had borrowed $66 million against these facilities.Funds generated through operating activities and issuance of notespayable decrease the usage of, and dependence on, these lines.
As noted in the Review of Financial Position section above, theCompany had cash balances of $5,348,000 at June 30, 2016compared to $12,440,000 at December 31, 2015. As far as possible,cash balances are maintained at a minimum and surplus cash isused to repay bank indebtedness.
Management believes that current cash balances and existingcredit lines, together with cash flow from operations, will besufficient to meet the cash requirements of working capital,capital expenditures, operating expenditures, dividend paymentsand share repurchases and will provide sufficient liquidity andcapital resources for future growth over the next twelve months.
Cash flow for the six months ended June 30, 2016 compared withsix months ended June 30, 2015
Cash inflow from net earnings before changes in operating assetsand liabilities and income tax payments totalled $3,842,000 inthe first half of 2016 compared to $4,550,000 last year. Afterchanges in operating assets and liabilities and income tax payments are taken into account, there was a net cash outflowfrom operating activities of $17,739,000 in the first half of 2016compared to $11,911,000 last year. The net cash outflow in the current quarter largely resulted from financing Loans of$15,087,000. In the first half of 2015, the net cash outflow principally resulted from financing Loans of $16,330,000.Changes in other operating assets and liabilities are discussedabove and are set out in the Company’s consolidated statementsof cash flows on page 16 of this report.
Cash outflows from investing activities totalled $25,000 (2015 – $45,000) in the first half of 2016 and comprised capital assets additions.

$73,000 (2015 – $109,000) and $150,000 (2015 – $219,000),respectively.
Financial Instruments
All financial assets and liabilities, with the exception of cash,derivative financial instruments, the guarantee of managedreceivables and the Company’s SARs liability, are recorded atcost. The exceptions noted are recorded at fair value. Financialassets or liabilities, other than the lease receivables and loans toclients in our leasing business, are short term in nature and,therefore, their carrying values approximate fair values.
At June 30, 2016, the Company had entered into forward foreignexchange contracts with a financial institution which must beexercised by the Company between July 29, 2016 and February 28,2017 and which oblige the Company to sell Canadian dollarsand buy US$3,526,100 at exchange rates ranging from 1.2843 to1.4050. These contracts were entered into by the Company onbehalf of clients and similar forward foreign exchange contractswere entered into between the Company and the clients, wherebythe Company will buy Canadian dollars from and sellUS$3,526,100 to the clients. These contracts are discussed further in note 13 to the Statements.
Critical Accounting Policies and Estimates
Critical accounting estimates represent those estimates that arehighly uncertain and for which changes in those estimatescould materially impact the Company’s financial results. Thefollowing are accounting estimates that the Company considerscritical to the financial results of its business segments:
i) the allowance for losses on both its Loans and its guarantee of managed receivables. The Company maintains a separate allowance for losses on each of the above items at amounts which, in management's judgment, are sufficient to cover losses thereon. The allowances are based upon several considerations including current economic environment, condition of the loan and receivable portfolios and typical industry loss experience. These estimates are particularly judgmental and operating results may be adversely affected by significant unanticipated credit or loan losses, such as occur in a bankruptcy or insolvency.
The Company’s allowances on its Loans and its guarantee of managed receivables may comprise specific and general components. A specific allowance may be established against Loans that are identified as impaired, or non-performing, when the Company determines, based on its review, identification and evaluation of problem Loans, that the timely collection of interest and principal payments is no longer assured and that the estimated net realizable value of the Company’s loan collateral is below its book value. Similarly, a specific allowance may be established against managed receivables where a clients’ customer becomes insolvent and the Company’s guarantee is called upon. In such cases, the Company will estimate the fair value of the required payments to clients under their guarantees, net of any estimated recoveries expected from the insolvent customer’s estate.
A general or collective allowance on both its Loans and its guarantee of managed receivables is established to reserve against losses that are estimated to have occurred but cannot be specifically identified as impaired on an item-by-item or group basis at a particular point in time. In establishing its collective allowances, the Company applies percentage formulae to its Loans and managed receivables. The formulae are based upon historic credit and loan loss experience and are reviewed for adequacy on an ongoing basis. Management believes that its allowances for losses are sufficient and appropriate and does not consider it reasonably likely that the Company’s material assumptions will change. The Company’s allowances are discussed above and in notes 3(d) and 4 to the Statements.
ii) the extent of any provisions required for outstanding claims. In the normal course of business there is outstanding litigation, the results of which are not normally expected to have a material effect upon the Company. However, the adverse resolution of a particular claim could have a material impact on the Company’s financial results. Management is not aware of any claims currently outstanding upon which significant damages could be payable.
Second Quarter Report 2016 | 11

Control Environment
Disclosure controls and procedures ("DC&P") are designed toprovide reasonable assurance that all relevant information isgathered and reported to management, including the CEO andCFO, on a timely basis so that appropriate decisions can be maderegarding public disclosure. Internal Control over FinancialReporting ("ICFR") is a process designed by or under the supervision of the CEO and CFO, management and other personnel to provide reasonable assurance regarding the reliabilityof financial reporting and the preparation of financial statementsfor external purposes in accordance with IFRS. As at June 30, 2016,management evaluated and concluded on the effective design ofthe Company's DC&P and ICFR, and determined that there wereno material changes to the Company's ICFR during the threemonths then ended that materially affected, or were reasonablylikely to materially affect, the Company's ICFR.
Internal control systems, no matter how well designed, haveinherent limitations. Therefore, even those systems determinedto be effective can provide only reasonable assurance with respectto financial statement preparation and presentation. Also, projections of any evaluation of effectiveness to future periodsare subject to the risk that controls may become inadequatebecause of changes in conditions, or that the degree of compliancewith the policies or procedures may deteriorate and, as such,there can be no assurance that any design will succeed inachieving its stated goal under all potential conditions.
Risks and Uncertainties That Could Affect Future Results
Past performance is not a guarantee of future performance, whichis subject to substantial risks and uncertainties. Managementremains optimistic about the Company’s long-term prospects.Factors that may impact the Company’s results include, but arenot limited to, the factors discussed below. Please refer to note 17to the Statements, which discuss the Company’s principalfinancial risk management practices.
CompetitionThe Company operates in an intensely competitive environmentand its results could be significantly affected by the activities ofother industry participants. The Company expects competition
to persist in the future as the markets for its services continueto develop and as additional companies enter its markets. Therecan be no assurance that the Company will be able to competeeffectively with current and future competitors. If these or othercompetitors were to engage in aggressive pricing policies withrespect to competing services, the Company would likely losesome clients or be forced to lower its rates, both of which couldhave a material adverse effect on the Company’s business, operating results and financial condition. The Company willnot, however, compromise its credit standards.
Economic slowdownThe Company operates mainly in Canada and the United States.Economic weakness in either of the Company’s markets canaffect its ability to do new business as quality prospects becomelimited, although in a weak economy competition may lessen,which could result in the Company seeing more prospects.Further, the Company’s clients and their customers are oftenadversely affected by economic slowdowns and this can lead toincreases in its provision for credit and loan losses.
Credit riskThe Company is in the business of financing its clients’ receivablesand making asset-based loans, including lease financing. TheCompany’s portfolio totalled $190 million at June 30, 2016.Operating results can be adversely affected by large bankruptciesand/or insolvencies. Please refer to note 17(a) to the Statements.
Interest rate riskThe Company's agreements with its clients (affecting interestrevenue) and lenders (affecting interest expense) usually providefor rate adjustments in the event of interest rate changes so thatthe Company's spreads are protected to some degree. However,as the Company’s floating rate Loans substantially exceed itsborrowings, the Company is exposed to some degree to interestrate fluctuations. This is partially mitigated in its leasing business,where lease receivable and term loans to clients tend to be atfixed effective interest rates, while related bank borrowings tend to be floating rate. Please refer to note 17(c)(ii) to the Statements.
Foreign currency riskThe Company operates internationally. Accordingly, a portionof its financial resources is held in currencies other than the
12 | Accord Financial Corp.
Second Quarter Report 2016 | 13
Canadian dollar. The Company’s policy is to manage financialexposure to foreign exchange fluctuations and attempt to neutralize the impact of foreign exchange movements on itsoperating results where possible. In recent years, the Companyhas seen the fluctuations in the U.S. dollar against the Canadiandollar affect its operating results when its foreign subsidiariesresults are translated into Canadian dollars. It has also impactedthe value of the Company’s net Canadian dollar investment inits foreign subsidiaries, which had in the past reduced theAOCI component of equity to a loss position, although this hasnow recovered to a sizable gain position at June 30, 2016. Pleasesee notes 14 and 17(c)(i) to the Statements.
Potential acquisitions and investmentsThe Company seeks to acquire or invest in businesses thatexpand or complement its current business. Such acquisitionsor investments may involve significant commitments of financialor other resources of the Company. There can be no assurancethat any such acquisitions or investments will generate additionalearnings or other returns for the Company, or that financial orother resources committed to such activities will not be lost.Such activities could also place additional strains on the Company’sadministrative and operational resources and its ability to manage growth. Business combinations also require managementto exercise judgment in measuring the fair value of assets acquired,liabilities and contingent liabilities assumed and equity instruments issued.
Personnel significanceEmployees are a significant asset of the Company. Marketforces and competitive pressures may adversely affect the abilityof the Company to recruit and retain key qualified personnel.The Company mitigates this risk by providing a competitivecompensation package, which includes profit sharing, long-termincentives, and medical benefits, as it continuously seeks to alignthe interests of employees and shareholders.
Outlook
The Company’s principal objective is managed growth – puttingquality new business on the books while maintaining highunderwriting standards.
In the first half of 2016, the Company couldn’t quite achieve the
record levels of business activity seen in 2015 as net earningsand revenue fell short of 2015’s first half for reasons noted above.A large receivables management client left towards the end of2015 and a number of clients “graduated” to traditional financingin the past several months impacting the Company’s fundsemployed and revenue. However, the Company’s pipeline ofprospects remains strong and it is anticipated that the Company’sasset-based financing units will be able to build their fundsemployed despite operating in very competitive markets. Weopened a new office in Chicago for our U.S. business at the endof June. Named “Accord Business Finance” this new unit willprovide factoring facilities for smaller businesses than thoseserved by our South Carolina office. We expect this unit togrow and become an ever-increasing contributor to our earnings.Our credit protection and receivables management businesscontinues to face intense competition from multinational creditinsurers and it is expected this will continue. The Company’sequipment financing and leasing business continues to expandand is profitable. ASBF has recently launched an internet-basedworking capital loan product that it hopes will accelerate itsgrowth over the next few years and it is now doing largerequipment deals, which is expected to grow its funds employed.We will remain vigilant in maintaining portfolio quality in theface of an increasingly uncertain global economy. The Companycontinues to actively seek opportunities to acquire companiesor portfolios to grow its business. Overall, the Company is optimistic about its prospects for the remainder of 2016 andlooks forward to higher activity for the balance of the year.
With its substantial capital and borrowing capacity, Accord iswell positioned to capitalize on market conditions. That, coupledwith experienced management and staff, will enable the Companyto meet increased competition and develop new opportunities.Accord continues to introduce new financial and credit servicesto fuel growth in a very competitive and challenging environment.
Stuart AdairSenior Vice President, Chief Financial OfficerJuly 27, 2016

Notice to Reader Management has prepared these condensed interim unaudited consolidated financial statements and notes and is responsible for the integrity and fairness of the financial information presented therein. They have been reviewed and approved by the Company's Audit Committee and Board of Directors. Pursuant to National Instrument 51-102, Part 4, Subsection 4.3(3)(a), the Company advises that its independent auditor has not performed a review or audit of these condensed interim unaudited consolidated financial statements.
CONSOLIDATED STATEMENTS OF FINANCIAL POSITION (UNAUDITED)
14 | Accord Financial Corp.
June 30, 2016 December 31, 2015 June 30, 2015 Assets Cash $ 5,348,317 $ 12,440,143 $ 8,509,860 Finance receivables and loans, net (note 4) 145,115,004 134,259,000 155,718,261 Income taxes receivable 864,628 376,727 391,591 Other assets 623,821 658,061 1,525,948 Assets held for sale (note 5) 1,398,839 1,544,182 1,810,706 Deferred tax assets, net 135,103 217,103 598,797 Capital assets 308,082 354,910 362,376 Intangible assets (note 6) 1,241,480 1,496,242 1,784,018 Goodwill (note 7) 3,124,731 3,213,495 3,083,666
$ 158,160,005 $ 154,559,863 $ 173,785,223
Liabilities Due to clients $ 4,581,931 $ 9,401,637 $ 6,325,965 Bank indebtedness (note 8) 66,067,837 54,094,479 80,636,109 Accounts payable and other liabilities 2,131,126 2,886,546 2,561,490 Income taxes payable 645,529 932,351 869,855 Notes payable (note 9) 11,628,626 13,200,628 16,622,896 Deferred income 360,628 378,504 487,418 Deferred tax liabilities, net 521,911 600,034 652,766
85,937,588 81,494,179 108,156,499
Equity Capital stock (note 10) 6,896,153 6,896,153 6,896,153 Contributed surplus 112,799 60,329 42,840 Retained earnings 58,662,188 57,066,132 53,243,814 Accumulated other comprehensive income (note 14) 6,551,277 9,043,070 5,445,917
72,222,417 73,065,684 65,628,724
$ 158,160,005 $ 154,559,863 $ 173,785,223

Second Quarter Report 2016 | 15
Three months Six months Three and six months ended June 30 2016 2015 2016 2015 Revenue Interest and other income (note 4) $ 6,897,424 $ 7,657,156 $ 13,768,040 $ 15,216,034 Expenses Interest 574,419 633,244 1,075,308 1,144,670 General and administrative 3,992,203 4,239,593 8,096,333 8,602,380 Provision for credit and loan losses 311,943 529,485 846,605 1,008,847 Depreciation 33,571 34,596 67,588 68,452 Business acquisition expenses: amortization of intangible assets 127,381 143,888 254,762 287,776 5,039,517 5,580,806 10,340,596 11,112,125
Earnings before income tax expense 1,857,907 2,076,350 3,427,444 4,103,909
Income tax expense 231,000 340,000 336,000 663,000
Net earnings $ 1,626,907 $ 1,736,350 $ 3,091,444 $ 3,440,909
Basic and diluted earnings per common share $ 0.20 $ 0.21 $ 0.37 $ 0.41
CONSOLIDATED STATEMENTS OF COMPREHENSIVE INCOME (UNAUDITED)
Three months Six months Three and six months ended June 30 2016 2015 2016 2015 Net earnings $ 1,626,907 $ 1,736,350 $ 3,091,444 $ 3,440,909 Other comprehensive (loss) income: Items that are or may be reclassified to profit or loss: Unrealized foreign exchange (loss) gain on translation of self-sustaining foreign operations (note 14) (180,479) (450,724) (2,491,793) 2,268,168 Comprehensive income $ 1,446,428 $ 1,285,626 $ 599,651 $ 5,709,077
CONSOLIDATED STATEMENTS OF CHANGES IN EQUITY (UNAUDITED) Capital Stock Accumulated other Number of common Contributed Retained comprehensive shares outstanding Amount surplus earnings income Total
Balance at January 1, 2015 8,307,713 $ 6,896,153 $ 42,840 $ 51,215,217 $ 3,177,749 $ 61,331,959 Comprehensive income — — — 3,440,909 2,268,168 5,709,077 Dividends paid — — — (1,412,312) — (1,412,312) Balance at June 30, 2015 8,307,713 $ 6,896,153 $ 42,840 $ 53,243,814 $ 5,445,917 $ 65,628,724
Balance at January 1, 2016 8,307,713 $ 6,896,153 $ 60,329 $ 57,066,132 $ 9,043,070 $73,065,684 Comprehensive loss — — — 3,091,444 (2,491,793) 599,651 Stock-based compensation expense related to stock option grant — — 52,470 — — 52,470 Dividends paid — — — (1,495,388) — (1,495,388) Balance at June 30, 2016 8,307,713 $ 6,896,153 $ 112,799 $ 58,662,188 $ 6,551,277 $ 72,222,417
CONSOLIDATED STATEMENTS OF EARNINGS (UNAUDITED)

Six months ended June 30 2016 2015
Cash provided by (used in) Operating activities Net earnings $ 3,091,444 $ 3,440,909 Items not affecting cash: Allowance for losses, net of charge-offs and recoveries 30,554 167,564 Deferred income (49,697) (68,920) Amortization of intangible assets 254,762 287,776 Depreciation 67,588 68,452 Loss (gain) on disposal of capital assets 59,324 (8,369) Stock-based compensation expense related to stock option grant 52,470 — Deferred tax expense (recovery) 4,610 (345,884) Current income tax expense 331,390 1,008,884 3,842,445 4,550,412 Changes in operating assets and liabilities Finance receivables and loans, gross (15,087,309) (16,329,966) Due to clients (4,795,956) (412,924) Other assets 21,551 736,060 Accounts payable and other liabilities (744,241) (837,289) Disposal of assets held for sale 109,019 910,912 Income tax paid, net (1,084,782) (528,052) (17,739,273) (11,910,847) Investing activities Additions to capital assets, net (24,681) (45,024) (24,681) (45,024)
Financing activities Bank indebtedness 14,442,383 14,280,040 Notes payable redeemed, net (1,570,493) (186,079) Dividends paid (1,495,388) (1,412,312) 11,376,502 12,681,649
Effect of exchange rate changes on cash (704,374) 680,809 (Decrease) increase in cash (7,091,826) 1,406,587 Cash at January 1 12,440,143 7,103,273
Cash at June 30 $ 5,348,317 $ 8,509,860 Supplemental cash flow information Net cash used in operating activities includes: Interest paid $ 998,316 $ 1,021,633
CONSOLIDATED STATEMENTS OF CASH FLOWS (UNAUDITED)
16 | Accord Financial Corp.

Second Quarter Report 2016 | 17
NOTES TO CONSOLIDATED FINANCIAL STATEMENTS (UNAUDITED)Three and six months ended June 30, 2016 and 2015
1. Description of the businessAccord Financial Corp. (the "Company") is incorporated byway of Articles of Continuance under the Ontario BusinessCorporations Act and, through its subsidiaries, is engaged inproviding asset-based financial services, including factoring,financing, leasing, credit investigation, credit protection andreceivables management, to industrial and commercial enterprises, principally in Canada and the United States. TheCompany's registered office is at 77 Bloor Street West, Toronto,Ontario, Canada.
2. Basis of presentation and statement of complianceThese condensed interim unaudited consolidated financialstatements ("Statements") are expressed in Canadian dollars,the Company’s functional and presentation currency, and havebeen prepared in compliance with International AccountingStandard 34, Interim Financial Reporting (“IAS 34”) as issuedby the International Accounting Standards Board ("IASB").
These Statements do not include all of the information andfootnotes required for full annual financial statements preparedin accordance with International Financial Reporting Standards(“IFRS”). They have been prepared using the accounting policiesthat the Company expects to utilize in its consolidated financialstatements for the year ending December 31, 2016, the moresignificant of which are detailed in note 3. These accountingpolicies are based on IFRS standards and International FinancialReporting Interpretations Committee (“IFRIC”) interpretationsthat the Company expects to be applicable at that time. TheseStatements and notes should be read in conjunction with theaudited consolidated financial statements and notes included in the Company’s Annual Report for the fiscal year endedDecember 31, 2015.
The preparation of the condensed interim unaudited consolidatedfinancial statements in conformity with IFRS requires managementto make judgments, estimates and assumptions that affect theapplication of accounting policies and the reported amounts ofassets, liabilities, revenue and expenses. Actual results may differfrom those estimates. Estimates and underlying assumptions are
reviewed on an ongoing basis. Changes to accounting estimatesare recognized in the year in which the estimates are revised andin any future periods affected. Estimates that are particularlyjudgmental relate to the determination of the allowance for lossesrelating to finance receivables and loans and to the guarantee ofmanaged receivables (notes 3(d) and 4), the determination ofthe value of goodwill and intangible assets on acquisition (notes6 and 7), as well as the net realizable value of assets held for sale (notes 3(g) and 5) and deferred tax assets and liabilities.Management believes that these estimates are reasonable and appropriate.
The condensed interim unaudited consolidated financial statementsof the Company have been prepared on an historical cost basisexcept for the following items which are recorded at fair value:
• Cash • Assets held for sale • Derivative financial instruments (a component of other assets and/or accounts payable and other liabilities) • Share appreciation rights (“SARs”) liability* • Guarantee of managed receivables* *a component of accounts payable and other liabilities
The condensed interim unaudited consolidated financial statements for the three and six months ended June 30, 2016 wereapproved for issue by the Company’s Board of Directors (“Board”)on July 27, 2016.
3. Significant accounting policiesa) Basis of consolidation These financial statements consolidate the accounts of the Company and its wholly owned subsidiaries; namely, Accord Financial Ltd. ("AFL"), Accord Financial Inc. ("AFIC") and Varion Capital Corp. ("Varion") in Canada and Accord Financial, Inc. ("AFIU") in the United States. The Company exercises 100% control over each of its subsidiaries. The accounting policies of the Company's subsidiaries are aligned with IFRS. Intercompany balances and transactions are eliminated upon consolidation.

18 | Accord Financial Corp.
contracts that are non-cancellable direct financing leases and provide for monthly lease payments, usually for periods of one to five years. The present value of the minimum lease payments and residual values expected to be received under the lease terms is recorded at the commencement of the lease. The difference between this total value, net of execution costs, and the cost of the leased asset is unearned revenue, which is recorded as a reduction in the asset value, with the net amount being shown as the net investment in leases (specifically, the Company’s lease receivables). The unearned revenue is then recognized over the life of the lease using the effective interest rate method, which provides a constant rate of return on the net investment throughout the lease term.
d) Allowances for losses The Company maintains allowances for losses on its finance receivables and loans and its guarantee of managed receivables. At each reporting date, the Company assesses whether there is objective evidence that the finance receivables and loans or managed receivables are impaired. A finance receivable and loan or a group of finance receivables or loans is (are) impaired when objective evidence demonstrates that a loss event has occurred after the initial recognition of these asset(s), and that the loss event has an effect on the future cash flows resulting from the finance receivable(s) and loan(s) that can be estimated reliably. At each reporting date, the Company also assesses whether there is objective evidence that a loss event has occurred in respect of the Company's guarantee of managed receivables. A loss event has occurred if there exists objective evidence that a debtor is bankrupt or insolvent and payments, which can be estimated reliably, are required to be made to clients under the Company's guarantees to them.
The Company maintains these allowances for losses at amounts which, in management's judgment, are sufficient to cover losses thereon. The allowances are based upon several considerations, including current economic trends, condition of the loan and customer receivable portfolios and typical industry loss experience.
The Company considers evidence of impairment for finance receivables and loans and managed receivables at both a specific asset and collective level. All finance receivables
b) Revenue recognition Revenue principally comprises interest, including discount fees, and factoring commissions from the Company's asset-based financial services, including factoring and leasing, and is measured at the fair value of the consideration received. For receivables purchased in its recourse factoring business, discount fees are calculated as a discount percentage of the gross amount of the factored invoice and are recognized as revenue over the initial discount period. Additional discount fees are charged on a per diem basis if the invoice is not paid by the end of the initial discount period. For managed receivables, factoring commissions are charged upfront and a certain portion is deferred and recognized over the period that costs are incurred collecting the receivables. Interest charged on finance receivables and loans to clients is recognized as revenue using the effective interest rate method. In the Company's leasing business, interest is recognized over the term of the lease agreement or installment payment agreement using the effective interest rate; the effective interest rate is that rate which exactly discounts estimated future cash receipts through the expected life of the lease, installment payment or loan agreement. Fees related to direct finance leases, installment payment agreements and loan receivables of Varion are considered an integral part of the yield earned on the debtor balance and are accounted for using the effective interest rate method.
Other revenue, such as due diligence fees, documentation fees and commitment fees, is recognized as revenue when earned.
c) Finance receivables and loans The Company finances its clients principally by factoring their receivables, providing asset-based loans and financing equipment leases. Finance receivables (namely, factored receivables and lease receivables) and loans to clients are non-derivative financial assets with fixed or determinable payments that are not quoted in an active market and that the Company does not intend to sell immediately or in the near term. Finance receivables and loans to clients are initially measured at fair value plus incremental direct transaction costs and subsequently measured at amortized cost using the effective interest rate method.
The Company’s leasing operations have standard lease

Second Quarter Report 2016 | 19
and loans and managed receivables are first assessed for specific impairment and, if found not to be specifically impaired, they are then collectively assessed for any impairment that has been incurred but not yet identified.
Losses on finance receivables and loans are charged to the allowance for losses account when collectability becomes questionable and the underlying collateral is considered insufficient to secure the loan balance. Credit losses on managed receivables are charged to the respective allowance for losses account when debtors are known to be bankrupt or insolvent. Recoveries from previously written-off accounts are credited to the respective allowance for losses account once collected. The allowance for losses on finance receivables and loans is recorded at amortized cost, while the allowance for losses on the guarantee of managed receivables is recorded at fair value.
e) Foreign subsidiaries The Company's foreign subsidiaries report in U.S. dollars and their assets and liabilities are translated into Canadian dollars at the exchange rate prevailing at the statement of financial position date. Revenue and expenses are translated into Canadian dollars at the average monthly exchange rate then prevailing. Resulting translation gains and losses are credited or charged to other comprehensive income or loss and presented in the accumulated other comprehensive income or loss component of equity.
f) Stock-based compensation The Company accounts for SARs and stock options issued to directors and/or employees using fair value-based methods. The Company utilizes the Black-Scholes option-pricing model to calculate the fair value of the SARs and stock options on the grant date. Changes in the fair value of outstanding SARs are calculated at each reporting date, as well as at settlement date. The fair value of the awards is recorded in general and administrative expenses over the awards vesting period, or immediately if fully vested.
The Company’s senior executive long-term incentive plan (“LTIP”) (note 10(g)) contemplates grants thereunder may be settled in common shares and/or cash. Grants are determined as a percentage of the participants’ short-term annual bonus, up to an annual LTIP pool maximum, which
may be adjusted up or down based on the Company’s adjusted return on average equity over the three-year vesting period of an award. The fair value of the LTIP award(s), calculated at each reporting date, is recorded in general and administrative expenses over the awards vesting period, with a corresponding liability established.
g) Assets held for sale Assets acquired or repossessed on realizing security on defaulted finance receivables and loans are held for sale and are stated at the lower of cost or recoverable amount (also referred to as “net realizable value”).
h) Future accounting policies IFRS 9, Financial Instruments ("IFRS 9"), will replace the guidance provided in IAS 39, Financial Instruments Recognition and Measurements. The Standard includes new guidance on: (i) classification and measurement of financial assets and liabilities; (ii) impairment of financial assets; and (iii) hedge accounting. The Company intends to adopt IFRS 9 in its consolidated financial statements for the annual period beginning on January 1, 2018. The impact of adoption of IFRS 9 has not yet been determined.
IFRS 15, Revenue from Contracts with Customers ("IFRS 15"), will replace the existing standards for revenue recognition. The new standard establishes a framework for the recognition and measurement of revenues generated from contracts with customers, with the exception of revenue earned from contracts in the scope of other standards, such as financial instruments, insurance contracts and leases. The new standard also requires additional disclosures about the nature, amount, timing and uncertainty of revenues and cash flows arising from transactions with customers. IFRS 15 is effective for the fiscal year beginning January 1, 2018. The impact of adoption of IFRS 15 has not yet been determined.
IFRS 16, Leases (“IFRS 16”), will replace existing guidance on accounting for leases. The accounting treatment of leases by lessees will change fundamentally. IFRS 16 eliminates the current dual accounting model for lessees, which distinguishes between on-balance sheet finance leases and off balance sheet operating leases. Instead, there is a single, on-balance sheet accounting model that is

20 | Accord Financial Corp.
2015 – $166,000; June 30, 2015 – $203,000) as a collectiveallowance for losses on the guarantee of these managed receivables,which represents the estimated fair value of the guarantees atthose dates. This allowance is included in the total of accountspayable and other liabilities as the Company does not take titleto the managed receivables and they are not included in theconsolidated statement of financial position.
The activity in the allowance for losses on the guarantee ofmanaged receivables account during the six months ended June 30, 2016 and 2015 was as follows:
2016 2015
Allowance for losses at January 1 $ 166,000 $ 190,000 Provision for credit losses 133,594 72,194 Charge-offs (122,232) (82,556) Recoveries 7,638 23,362 Allowance for losses at June 30 $ 185,000 $ 203,000
The nature of the Company's business involves funding orassuming the credit risk on the receivables offered to it by itsclients, as well as financing other assets, such as inventory andequipment. These transactions are conducted on terms that areusual and customary to the Company's asset-based lending andfactoring activities. The Company controls the credit risk associated with its finance receivables and loans and managedreceivables in a variety of ways. For details of the Company'spolicies and procedures in this regard, please refer to note 17(a).
At June 30, 2016, the Company held cash collateral of $1,426,590(December 31, 2015 – $1,486,710; June 30, 2015 – $1,785,742)to help reduce the risk of loss on certain of the Company'sfinance receivables and loans and managed receivables.
The Company considers the allowances for losses on both itsfinance receivables and loans to clients and its guarantee ofmanaged receivables critical to its financial results (see note 3(d)).As noted above, the Company maintains a separate allowancefor losses on each of the above items at amounts, which, inmanagement's judgment, are sufficient to cover estimated lossesthereon. The allowances are based upon several considerations,including current economic environment, condition of the loanand receivable portfolios and typical industry loss experience.These estimates are particularly judgmental and operating resultsmay be adversely affected by significant unanticipated credit orloan losses, such as occur in a bankruptcy or insolvency.
similar to current finance lease accounting. IFRS 16 is effective for fiscal years beginning January 1, 2019. The impact of adoption of IFRS 16 has not yet been determined.
4. Finance receivables and loans
June 30, 2016 Dec. 31, 2015 June 30, 2015
Factored receivables $ 80,357,606 $ 77,249,252 $ 97,165,559 Loans to clients 60,528,682 52,523,477 54,268,631 Lease receivables 5,858,716 6,134,271 6,228,071
Finance receivables and loans, gross 146,745,004 135,907,000 157,662,261 Less allowance for losses 1,630,000 1,648,000 1,944,000
Finance receivables and loans, net $ 145,115,004 $ 134,259,000 $ 155,718,261
Lease receivables comprise Varion’s net investment in leases asdescribed in note 3(c). Varion’s lease receivables at June 30, 2016are expected to be collected over a period of up to five years.
Interest income earned on finance receivables and loans duringthe three and six months ended June 30, 2016 totalled $5,746,396(2015 – $6,037,949) and $11,452,990 (2015 – $11,907,074),respectively. Fees from receivables management and credit protection services during the three and six months ended June 30,2016 totalled $675,917 (2015 – $1,115,526) and $1,616,885(2015 – $2,545,495), respectively.
The Company's allowance for losses on finance receivables andloans to clients at June 30, 2016 and 2015 and December 31, 2015comprised only a collective allowance. The activity in theallowance for losses on finance receivables and loans accountduring the first six months of 2016 and 2015 was as follows:
2016 2015
Allowance for losses at January 1 $ 1,648,000 $ 1,763,000 Provision for loan losses 713,011 936,653 Charge-offs (702,970) (788,596) Recoveries 1,513 6,507 Foreign exchange adjustment (29,554) 26,436 Allowance for losses at June 30 $ 1,630,000 $ 1,944,000
The Company has entered into agreements with clients, wherebyit has assumed the credit risk with respect to the majority of theclients' receivables. At June 30, 2016, the gross amount of thesemanaged receivables was $42,890,148 (December 31, 2015 –$70,148,210; June 30, 2015 – $53,356,678). At June 30, 2016,management provided an amount of $185,000 (December 31,

Second Quarter Report 2016 | 21
Existing customer Broker contracts relationships Total
Cost January 1, 2015 and June 30, 2015 $ 1,179,097 $ 1,343,938 $ 2,523,035
Accumulated amortization January 1, 2015 (264,117) (187,124) (451,241) Amortization expense (185,708) (102,068) (287,776) June 30, 2015 (449,825) (289,192) (739,017)
Net book value January 1, 2015 $ 914,890 $ 1,156,814 $ 2,071,794 June 30, 2015 $ 729,272 $ 1,054,746 $ 1,784,018
7. Goodwill
2016 2015
Balance at January 1 $ 3,213,495 $ 2,998,172 Foreign exchange adjustment (88,764) 85,494 Balance at June 30 $ 3,124,731 $ 3,083,666
Goodwill is tested for impairment annually. During 2015, the Company conducted an annual impairment review and determined there was no impairment to the carrying value ofgoodwill. 2016’s impairment review will be conducted in theCompany’s fourth quarter unless impairment indicators ariseearlier. Goodwill of US$961,697 is carried in the Company’sU.S. subsidiary and a foreign exchange adjustment is recognizedeach period-end when this balance is translated into Canadiandollars at the prevailing period-end exchange rate.
8. Bank indebtednessRevolving lines of credit totalling approximately $136,000,000 havebeen established with a number of banks, bearing interest varyingwith the bank prime rate or Libor. These lines of credit are collateralized primarily by finance receivables and loans to clients.At June 30, 2016, the amounts outstanding under the Company’slines of credit totalled $66,067,837 (December 31, 2015 – $54,094,479;June 30, 2015 – $80,636,109). The Company was in compliancewith all loan covenants under these lines of credit during the sixmonths ended June 30, 2016 and 2015.
9. Related party transactions (notes payable)Notes payable are to individuals or entities and consist ofadvances from shareholders, management, employees, otherrelated individuals and third parties. The notes are unsecured,due on demand, or in the case of one note, a week after requesting
In establishing its collective allowances, the Company appliespercentage formulae to its finance receivables and loans andmanaged receivables. The Company reviewed and adjusted itsallowance for losses formulae at the beginning of 2016. Thechanges in estimate did not have a material impact on theCompany’s consolidated financial statements.
5. Assets held for saleThe estimated net realizable value of the assets held for sale atJune 30, 2016 and 2015 and movements therein during the firstsix months of 2016 and 2015 were as follows:
2016 2015
Assets held for sale at January 1 $ 1,544,182 $ 2,172,491 Additions 23,000 733,950 Disposals (168,343) (1,156,815) Foreign exchange adjustment — 61,080 Assets held for sale at June 30 $ 1,398,839 $ 1,810,706
During 2016 and prior years, the Company obtained title to orrepossessed certain long-lived assets securing defaulted loans.These assets will be disposed of as market conditions permit.The estimated net realizable value of the assets at the abovedates was based upon appraisals of the assets.
The assets disposed in 2016 were sold for $109,019 resulting ina loss of $59,324 compared to the estimated net realizable valuethereof. This loss was included in other income. The assets disposed in 2015 were sold for $1,165,184 resulting in a gain of$8,369 compared to the estimated net realizable value thereof.The gain was included in other income.
6. Intangible assetsThe Company’s intangible assets were as follows:
Existing customer Broker contracts relationships Total
Cost January 1, 2016 and June 30, 2016 $ 1,179,097 $ 1,343,938 $ 2,523,035
Accumulated amortization January 1, 2016 (635,533) (391,260) (1,026,793) Amortization expense (152,694) (102,068) (254,762) June 30, 2016 (788,227) (493,328) (1,281,555)
Book value January 1, 2016 $ 543,564 $ 952,678 $ 1,496,242 June 30, 2016 $ 390,870 $ 850,610 $ 1,241,480

22 | Accord Financial Corp.
repayment, and bear interest at rates below those of the Company’sbank lines of credit.
Notes payable were as follows:
June 30, 2016 Dec. 31, 2015 June 30, 2015
Related parties $ 10,584,399 $ 11,787,564 $ 15,115,234 Third parties 1,044,227 1,413,064 1,507,662 $ 11,628,626 $ 13,200,628 $ 16,622,896
Interest expense on the notes payable for the three and six monthsended June 30, 2016 and 2015 was as follows:
Three Months Six Months
2016 2015 2016 2015 Related parties $ 65,768 $ 99,402 $ 135,822 $ 198,572 Third parties 6,789 9,385 14,489 20,558 $ 72,557 $108,787 $ 150,311 $ 219,130
10. Capital stock, contributed surplus, dividends,share appreciation rights, stock option plans, seniorexecutive long-term incentive plan, and stock-basedcompensation
a) Authorized capital stock The authorized capital stock of the Company consists of an unlimited number of first preferred shares, issuable in series, and an unlimited number of common shares with no par value. The first preferred shares may be issued in one or more series and rank in preference to the common shares. Designations, preferences, rights, conditions or prohibitions relating to each class of shares may be fixed by the Board. At June 30, 2016 and 2015 and December 31, 2015, there were no first preferred shares outstanding.
b) Issued and outstanding The Company's issued and outstanding common shares during the first six months of 2016 and 2015 are set out in the consolidated statements of changes in equity.
c) Contributed surplus
2016 2015
Balance at January 1 $ 60,329 $ 42,840 Stock-based compensation expense related to stock option grant (note 10(f)) 52,470 — Balance at June 30 $ 112,799 $ 42,840
d) Dividends Dividends in respect of the Company’s common shares are declared in Canadian dollars. During the three and six months ended June 30, 2016, dividends totalling $747,694 (2015 – $706,156) and $1,495,388 (2015 – $1,412,312), respectively, or $0.09 (2015 – $0.085) and $0.18 (2015 – $0.17), respectively, per common share were declared and paid.
On July 27, 2016, the Company declared a quarterly dividend of $0.09 per common share, payable September 1, 2016 to shareholders of record at the close of business on August 15, 2016.
e) Share appreciation rights The Company has established a SARs plan, whereby SARs are granted to directors and key managerial employees of the Company. The maximum number of SARs which may be granted in any fiscal year under the plan is 2.5% of the total number of issued and outstanding common shares of the Company at the time of grant. The SARs will have a strike price at the time of grant equal to the volume weighted average trading price of the Company's common shares on the Toronto Stock Exchange for the ten days that the shares were traded immediately preceding the date of grant, or other ten-day trading period that the Company's Board may determine. Employees can sell part or all of their SARs after holding them for a minimum of 24 months. Each employee's SARs not sold to the Company will automatically be sold on the last business day on or preceding the fifth anniversary following such grant. Directors have to sell their SARs to the Company on or before October 27, 2017 at which time they will automatically be sold.
No SARs have been granted by the Company to directors or employees since 2011. 10,000 SARs were exercised during the three and six months ended June 30, 2016. No SARs were exercised in the three and six months ended June 30, 2015.
The Company’s vested and outstanding SARs were as follows:
Exercise price Grant date June 30, 2016 Dec. 31, 2015 June 30, 2015$ 6.03 July 28, 2009 7,500 7,500 7,500$ 5.50 May 7, 2010 5,000 15,000 15,000$ 7.95 May 4, 2011 55,000 55,000 55,000$ 7.56 July 26, 2011 5,000 5,000 5,000 72,500 82,500 82,500

Second Quarter Report 2016 | 23
At June 30, 2016, the Company had accrued a liability of $161,125 (December 31, 2015 – $190,050; June 30, 2015 – $298,950) in respect of the fair value of outstanding SARs.
f) Stock option plans The Company has established an employee stock option plan. Under the terms of the plan, an aggregate of 1,000,000 common shares has been reserved for issue upon the exercise of options granted to key managerial employees of the Company and its subsidiaries. According to the terms of the plan, these options vest over a period of three years provided certain minimum earnings criteria are met. Although the Company may still grant stock options to employees, it has not done so since May 2004.
The Company has also established a non-executive directors' stock option plan. Under the terms of the plan, an aggregate of 500,000 common shares has been reserved for issue upon the exercise of options granted to non-executive directors of the Company.
Options are granted to purchase common shares at prices not less than the market price of such shares on the grant date.
On October 28, 2015, the Company granted 100,000 stock options to its five non-executive directors at an exercise price $9.56. These 100,000 options were the only ones outstanding at June 30, 2016 (December 31, 2015 – 100,000; June 30, 2015 – nil). Fifty percent of these options vest after one year and fifty percent after two years. The options have to be exercised within five years of the grant date, namely, by October 27, 2020 at which time they expire.
The fair value of the 100,000 options granted was determined using the Black-Scholes option pricing model with the following assumptions on the grant date:
Risk free interest rate 0.82% Expected dividend yield 3.77% Expected share price volatility 23.50% Expected life of option 5.0 years Fair value per option $1.40
g) Senior executive long-term incentive plan Under the LTIP, which was introduced in 2015, grants may be made annually to the Company's senior executive
management group and are measured and assessed over a three-year performance period. Grants are determined as a percentage of the participants' short-term annual bonus subject to an annual LTIP pool maximum of 5% of adjusted consolidated net earnings. Vesting of the LTIP is subject to achievement over a three-year period of a cumulative annual adjusted return on average consolidated shareholders' equity and may be adjusted up or down subject to achievement of certain minimum and maximum return thresholds. The Compensation Committee of the Board has the discretion to determine whether payments are settled through the issuance of shares and/or paid in cash.
h) Stock-based compensation During the three months ended June 30, 2016, the Company recorded a stock-based compensation expense of $100,410 (2015 – $59,550), of which $48,500 (2015 – nil) was in respect of the Company’s LTIP award(s), $26,235 (2015 – nil) was in respect of the non-executive directors’ stock option grant and $25,675 (2015 – $59,550) was in respect of the Company’s outstanding SARs. For the six months ended June 30, 2016, the Company recorded a stock-based compensation expense of $135,545 (2015 – $135,600), of which $97,000 (2015 – nil) was in respect of the Company’s LTIP award(s) and $52,470 (2015 – nil) was in respect of the non-executive directors’ stock option grant, while there was a recovery of $13,925 (2015 – expense $135,600) in respect of the Company’s outstanding SARs.
11. Earnings per common share and weighted average number of common sharesBasic earnings per share have been calculated based on theweighted average number of common shares outstanding in theperiod without the inclusion of dilutive effects. Diluted earningsper share are calculated based on the weighted average numberof common shares plus dilutive common share equivalents outstanding in the period, which in the Company’s case consistsentirely of stock options.
exchange contracts with a financial institution which must be exercised by the Company between July 29, 2016 and February 28,2017 and which oblige the Company to sell Canadian dollars andbuy US$3,526,100 at exchange rates ranging from 1.2843 to 1.4050.These contracts were entered into by the Company on behalf ofclients and similar forward foreign exchange contracts were enteredinto between the Company and the clients, whereby the Companywill buy Canadian dollars from and sell US$3,526,100 to the clients.
At December 31, 2015, the Company had entered into forward foreign exchange contracts with a financial institution that maturedbetween January 29, 2016 and March 31, 2016 and obliged theCompany to sell Canadian dollars and buy US$700,000 at exchangerates ranging from 1.3075 to 1.3100, while at June 30, 2015, theCompany had entered into forward foreign exchange contractswith a financial institution that matured between July 2, 2015 andOctober 30, 2015 and obliged the Company to sell Canadian dollarsand buy US$1,350,000 at exchange rates ranging from 1.2111 to1.2590. These contracts were entered into by the Company onbehalf of a client and similar forward foreign exchange contractswere entered into between the Company and the client, wherebythe Company bought Canadian dollars from and sold US$700,000and US$1,350,000, respectively, to the client.
The favorable and unfavorable fair values of these contracts wererecorded on the Company's consolidated statements of financialposition in other assets and accounts payable and other liabilities,respectively. The fair value of the contracts were classified as Level 2under IFRS 7. During the six months ended June 30, 2016 and 2015,there was no movement between the three-level fair value hierarchydescribed in note 3(p) to the Company’s audited consolidatedfinancial statements for the fiscal year ended December 31, 2015.
14. Accumulated other comprehensive income Accumulated other comprehensive income ("AOCI") solely comprises the unrealized foreign exchange gain (commonly referredto as cumulative translation adjustment) arising on translation ofthe assets and liabilities of the Company's foreign subsidiaries thatreport in U.S. dollars. Changes in the AOCI balance during the sixmonths ended June 30, 2016 and 2015 are set out in the consolidatedstatements of changes in equity.
15. Fair values of financial assets and liabilities Any financial assets or liabilities recorded at cost are short termin nature and, therefore, their carrying values approximate fair
24 | Accord Financial Corp.
The following is a reconciliation of common shares used in thecalculation of earnings per share:
Three and six months ended June 30 2016 2015
Basic weighted average number of common shares outstanding 8,307,713 8,307,713 Effect of dilutive stock options — — Diluted weighted average number of common shares outstanding 8,307,713 8,307,713
For the three and six months ended June 30, 2016, all outstandingoptions were excluded from the calculation of the dilutedweighted average number of common shares outstandingbecause they were considered to be anti-dilutive for earningsper common share purposes. There were no options outstandingin the three and six months ended June 30, 2015. 12. Contingent liabilitiesa) In the normal course of business there is outstanding litigation, the results of which are not expected to have a material effect upon the Company. Pending litigation, or other contingent matters represent potential financial loss to the Company. The Company accrues a potential loss if the Company believes the loss is probable and it can be reasonably estimated. The decision is based on information that is available at the time. The Company estimates the amount of the loss by consulting with the outside legal counsel that is handling the defense. This involves analyzing potential outcomes and assuming various litigation and settlement strategies. At June 30, 2016, the Company’s management was not aware of any litigation the aggregate liability from which would materially affect the financial position of the Company.
b) At June 30, 2016, the Company was contingently liable with respect to letters of credit issued on behalf of clients in the amount of $17,600 (December 31, 2015 – $481,201; June 30, 2015 – $382,448). In addition, at June 30, 2016 and 2015, and December 31, 2015, the Company was contingently liable with respect to letters of guarantee issued on behalf of its clients in the amount of $150,000. These amounts were considered in determining the allowance for losses on finance receivables and loans. 13. Derivative financial instrumentsAt June 30, 2016, the Company had entered into forward foreign

Second Quarter Report 2016 | 25
values. Under the fair value hierarchy, finance receivables andloans would be classified as Level 3.
16. Segmented information The Company operates and manages its businesses in onedominant industry segment – providing asset-based financialservices to industrial and commercial enterprises, principally inCanada and the United States. There were no significant changesto capital assets and goodwill during the periods under review.
Three months ended June 30, 2016: United Inter-(in thousands) Canada States company Total
Identifiable assets $ 81,152 $ 77,008 $ — $ 158,160
Revenue $ 4,562 $ 2,335 $ — $ 6,897
Expenses Interest 563 11 — 574 General and administrative 2,692 1,300 — 3,992 Provision for credit and loan losses 107 205 — 312 Depreciation 23 11 — 34 Business acquisition expenses 127 — — 127 3,512 1,527 — 5,039
Earnings before income tax expense 1,050 808 — 1,858 Income tax expense 290 (59) — 231 Net earnings $ 760 $ 867 $ — $ 1,627
Three months ended June 30, 2015: United Inter-(in thousands) Canada States company Total
Identifiable assets $ 105,890 $ 67,805 $ — $ 173,785
Revenue $ 5,098 $ 2,560 $ (1) $ 7,657 Expenses Interest 617 17 (1) 633 General and administrative 3,060 1,180 — 4,240 Provision for credit and loan losses 411 118 — 529 Depreciation 24 11 — 35 Business acquisition expenses 144 — — 144 4,256 1,326 (1) 5,581
Earnings before income tax expense 842 1,234 — 2,076 Income tax expense 228 112 — 340 Net earnings $ 614 $ 1,122 $ — $ 1,736
Six months ended June 30, 2016: United Inter-(in thousands) Canada States company Total
Identifiable assets $ 81,152 $ 77,008 $ — $ 158,160
Revenue $ 9,007 $ 4,790 $ (29) $ 13,768
Expenses Interest 1,073 31 (29) 1,075 General and administrative 5,430 2,666 — 8,096 Provision for credit and loan losses 489 358 — 847 Depreciation 46 22 — 68 Business acquisition expenses 255 — — 255 7,293 3,077 (29) 10,341
Earnings before income tax expense 1,714 1,713 — 3,427 Income tax expense 479 (143) — 336 Net earnings $ 1,235 $ 1,856 $ — $ 3,091
Six months ended June 30, 2015: United Inter-(in thousands) Canada States company Total
Identifiable assets $ 105,890 $ 67,805 $ — $ 173,785
Revenue $ 10,059 $ 5,177 $ (20) $ 15,216 Expenses Interest 1,130 35 (20) 1,145 General and administrative 6,188 2,414 — 8,602 Provision for credit and loan losses 700 309 — 1,009 Depreciation 46 22 — 68 Business acquisition expenses 288 — — 288 8,352 2,780 (20) 11,112
Earnings before income tax expense 1,707 2,397 — 4,104 Income tax expense 466 197 — 663 Net earnings $ 1,241 $ 2,200 $ — $ 3,441
17. Financial risk managementThe Company is exposed to credit, liquidity and market risksrelated to the use of financial instruments in its operations. The Board has overall responsibility for the establishment andoversight of the Company's risk management framework throughits Audit Committee. In this respect, the Audit Committeemeets with management and the Company's Risk ManagementCommittee at least quarterly. The Company's risk managementpolicies are established to identify, analyze, limit, control and

monitor the risks faced by the Company. Risk managementpolicies and systems are reviewed regularly to reflect changes inthe risk environment faced by the Company.
a) Credit risk Credit risk is the risk of financial loss to the Company if a client or counterparty to a financial instrument fails to meet its contractual obligations. In the Company's case, credit risk arises with respect to its loans to and other financial transactions with clients, its guarantee of managed receivables, and any other financial transaction with a counterparty that the Company deals with. The carrying amount of these loans and managed receivables represents the Company's maximum credit exposure and is the most significant measurable risk that it faces. The nature of the Company's asset-based lending, including factoring and leasing, business involves funding or assuming the credit risk on the receivables offered to it by its clients, as well as financing other assets, such as inventory and equipment. Typically, the Company takes title to the factored receivables and collateral security over the other assets that it lends against and does not lend on an unsecured basis. It does not take title to the managed receivables as it does not lend against them, but it assumes the credit risk from the client in respect of these receivables.
In its asset-based lending, including leasing, and credit protection and receivables management operations, credit is approved by a staff of credit officers, with larger amounts being authorized by supervisory personnel, management and, in the case of credit in excess of $1.0 million, the Company's President and the Chairman of its Board. Credit in excess of $2.5 million is approved by the Company's Credit Committee, which comprises three independent members of its Board. The Company monitors and controls its risks and exposures through financial, credit and legal systems and, accordingly, believes that it has procedures in place for evaluating and limiting the credit risks to which it is subject. Credit is subject to ongoing management review. Nevertheless, for a variety of reasons, there will inevitably be defaults by clients or their customers. In its asset-based lending operations, the Company's primary focus continues to be on the credit-worthiness and collectability of its clients’ receivables.
The clients' customers have varying payment terms depending on the industries in which they operate, although most customers have payment terms of 30 to 60 days from invoice date. ASBF's lease receivables and equipment and working capital loans are term loans with payments usually spread out over the term of the lease of loan, which can typically be up to 60 months. Of the total managed receivables that the Company guarantees payment, 3.6% were past due more than 60 days at June 30, 2016 (December 31, 2015 – 2.9%; June 30, 2015 – 4.9%). In the Company's asset-based lending business, receivables become "ineligible" for lending purposes when they reach a certain pre-determined age, usually 75 to 90 days from invoice date, and are usually charged back to clients, thereby eliminating the Company's credit risk on such older receivables.
The Company employs a client rating system to assess credit risk in its asset-based lending and leasing businesses, which reviews, amongst other things, the financial strength of each client and the Company's underlying security, while in its credit protection and receivables management business, it employs a customer credit scoring system to assess the credit risk associated with the managed receivables that it guarantees. Credit risk is primarily managed by ensuring that, as far as possible, the receivables financed are of the highest quality and that any inventory, equipment or other assets-securing loans are appropriately appraised. In its asset-based lending operations, the Company assesses the financial strength of its clients' customers and the industries in which they operate on a regular and ongoing basis. The financial strength of its clients' customers is often more important than the financial strength of the clients themselves.
The Company also minimizes credit risk by limiting the maximum amount that it will lend to any one client, enforcing strict advance rates, disallowing certain types of receivables, charging back or making receivables ineligible for lending purposes as they become older, and taking cash collateral in certain cases. The Company will also confirm the validity of the receivables that it purchases. In its asset-based lending operations, the Company administers and collects the majority of its clients’ receivables and so is able to quickly identify problems as and when they arise and act promptly to minimize credit and loan losses. In the Company’s leasing
26 | Accord Financial Corp.

Second Quarter Report 2016 | 27
operations, security deposits are obtained in respect of each equipment lease or loan. In its credit protection and receivables management business, each customer is provided with a credit limit up to which the Company will guarantee that customer's total receivables. All customer credit in excess of $2.5 million is approved by the Company's Credit Committee on a case-by-case basis. At June 30, 2016, the Company had not guaranteed any accounts receivable in excess of $10 million for any customer.
The Company's credit exposure relating to its finance receivables and loans by industrial sector was as follows:
June 30, 2016 Gross finance receivables % of Industrial sector (in thousands) and loans total Financial and professional services $ 44,686 35 Manufacturing 44,424 26 Wholesale and distribution 34,109 23 Retail 6,703 5 Other 16,823 11 $ 146,745 100
June 30, 2015 Gross finance receivables % of Industrial sector (in thousands) and loans total Financial and professional services $ 53,243 34 Manufacturing 50,751 32 Wholesale and distribution 35,262 22 Retail 7,449 5 Other 10,957 7 $ 157,662 100
The Company’s credit exposure relating to its managed receivables by industrial sector was as follows: June 30, 2016 Managed % of Industrial Sector (in thousands) receivables total
Retail $ 37,217 87 Other 5,673 13
$ 42,890 100
June 30, 2015 Managed % of Industrial Sector (in thousands) receivables total
Retail $ 45,217 85 Other 8,140 15
$ 53,357 100
As set out in notes 3(d) and 4 the Company maintains an allowance for credit and loan losses on its finance receivables and loans and its guarantee of managed receivables. The Company maintains a separate allowance for losses on each of the above items at amounts, which, in management's judgment, are sufficient to cover losses thereon. The allowances are based upon several considerations including current economic trends, condition of the loan and receivable portfolios and typical industry loss experience.
b) Liquidity risk Liquidity risk is the risk that the Company will not be able to meet its financial obligations as they fall due. The Company's approach to managing liquidity risk is to ensure, as far as possible, that it will always have sufficient liquidity to meet its liabilities when they fall due, under both normal and stressed conditions, without incurring unacceptable losses or risking damage to the Company's reputation. The Company's principal obligations are its bank indebtedness, notes payable, due to clients, and accounts payable and other liabilities. Revolving credit lines totalling approximately $136,000,000 have been established at a number of banking institutions, bearing interest varying with the bank prime rate or Libor. At June 30, 2016, the Company had borrowed $66,067,837 (December 31, 2015 – $54,094,479; June 30, 2015 – $80,636,109) against these facilities. These lines of credit are collateralized primarily by finance receivables and loans to clients. The Company was in compliance with all loan covenants under these lines of credit during the six months ended June 30, 2016. Notes payable are due on demand, or in the case of one note, a week after demand, and are to individuals or entities and consist of advances from shareholders, management, employees, other related individuals and third parties. As at June 30, 2016, 91% of these notes were due to related parties and 9% to third parties. Due to clients principally consist of collections of receivables not yet remitted to the Company's clients. Contractually, the Company remits collections within a

week of receipt. Accounts payable and other liabilities comprise a number of different obligations, the majority of which are payable within six months.
At June 30, 2016, the Company had gross finance receivables and loans totalling $146,745,000 (December 31, 2015 – $135,907,000; June 30, 2015 – $157,662,000) which substantially exceeded its total liabilities of $85,938,000 at that date (December 31, 2015 – $81,494,000; June 30, 2015 – $108,156,000). The Company's receivables normally have payment terms of 30 to 60 days from invoice date. Together with its unused credit lines, management believes that current cash balances and liquid short-term assets are more than sufficient to meet its financial obligations as they fall due.
All assets and liabilities, other than Varion’s lease receivables and equipment loans, capital assets, deferred tax, intangible assets, goodwill, SARs and the LTIP liability are expected to be settled within 12 months at the values stated in the consolidated statements of financial position.
c) Market risk Market risk is the risk that changes in market prices, such as foreign exchange rates and interest rates, will affect the Company's income or the value of its financial instruments. The objective of managing market risk is to control market risk exposures within acceptable parameters, while optimizing the return on risk.
i) Currency risk The Company is exposed to currency risk primarily in its foreign operations, which operate in U.S. dollars, to the full extent of the foreign operations net assets of US$26,557,000 at June 30, 2016. The Company's investment in its foreign operations is not hedged as they are long-term in nature. Unrealized foreign exchange gains or losses arise on translation of the assets and liabilities of the Company's foreign operations into Canadian dollars each period-end. Resulting foreign exchange gains or losses are credited or charged to other comprehensive income or loss with a corresponding entry to the AOCI component of equity (note 14). The Company is also subject to foreign currency risk on the earnings of its foreign operations, which are unhedged. Based on the foreign operations results for the six months ended June 30, 2016, a one-cent change in the
U.S. dollar against the Canadian dollar would change the Company's annual net earnings by approximately $28,000. It would also change other comprehensive income and the AOCI component of equity by $266,000.
The Company's Canadian operations have some assets and liabilities denominated in foreign currencies, principally factored receivables and loans, cash, bank indebtedness, due to clients and notes payable. These assets and liabilities are usually economically hedged, although the Company enters into foreign exchange contracts from time to time to hedge its currency risk when there is no economic hedge. At June 30, 2016, the Company's unhedged foreign currency positions in its Canadian operations totalled $169,000 (December 31, 2015 – $276,000; June 30, 2015 – $61,000). The Company ensures that its net exposure is kept to an acceptable level by buying or selling foreign currencies on a spot or forward basis to address short-term imbalances. The impact of a 1% change in the value of its unhedged foreign currency positions against the Canadian dollar would not have a material impact on the Company's net earnings.
ii) Interest rate risk Interest rate risk pertains to the risk of loss due to the volatility of interest rates. The Company's lending and borrowing rates are usually based on bank prime rates of interest or Libor and are typically variable. The Company actively manages its interest rate exposure where possible.
The Company's agreements with its clients (affecting interest revenue) and lenders (affecting interest expense) usually provide for rate adjustments in the event of interest rate changes so that the Company's spreads are protected to a large degree. However, as the Company's finance receivables and loans substantially exceed its floating and short-term fixed rate (usually 30 days) borrowings, the Company is exposed to interest rate risk as a result of the difference, or gap, that exists between interest sensitive assets and liabilities. This gap largely exists because of, and fluctuates with, the quantum of the Company's equity. This is partially mitigated in the Company’s leasing business, where lease receivables and term loans to clients are usually at fixed effective interest rates, while related bank borrowings are currently at floating rates.
28 | Accord Financial Corp.

Second Quarter Report 2016 | 29
The following table shows the interest rate sensitivity gap at June 30, 2016:
Floating 0 to 12 1 to 3 4 to 5 Non-rate(in thousands) rate months years years sensitive Total
Assets Cash $ 3,248 $ — $ — $ — $ 2,100 $ 5,348 Finance receivables and loans, net 131,664 5,419 9,249 784 (2,001) 145,115Assets held for sale — — — — 1,399 1,399All other assets — 864 — — 5,434 6,298
134,912 6,283 9,249 784 6,932 158,160
Liabilities Due to clients — — — — 4,582 4,582Bank indebtedness 4,400 61,668 — — — 66,068Notes payable 11,629 — — — — 11,629All other liabilities — 646 — — 3,013 3,659Equity — — — — 72,222 72,222
16,029 62,314 — — 79,817 158,160
$118,883 $ (56,031) $ 9,249 $ 784 $(72,885) $ —
Based on the Company's interest rate positions as at June 30, 2016, a sustained 100 basis point rise in interest rates across all currencies and maturities would increase net earnings by approximately $630,000 over a one year period. A decrease of 100 basis points in interest rates would reduce net earnings to a somewhat lesser extent.
18. Capital managementThe Company considers its capital structure to include equityand debt, namely, its bank indebtedness and notes payable. TheCompany's objectives when managing capital are to: (a) maintainfinancial flexibility in order to preserve its ability to meet financialobligations and continue as a going concern; (b) maintain acapital structure that allows the Company to finance its growthusing internally-generated cash flow and debt capacity; and (c) optimize the use of its capital to provide an appropriateinvestment return to its shareholders commensurate with risk.
The Company's financial strategy is formulated and adaptedaccording to market conditions in order to maintain a flexiblecapital structure that is consistent with its objectives and the riskcharacteristics of its underlying assets. The Company managesits capital structure and makes adjustments to it in light ofchanges in economic conditions and the risk characteristics ofits underlying assets. To maintain or adjust its capital structure,
the Company may, from time to time, change the amount ofdividends paid to shareholders, return capital to shareholdersby way of normal course issuer bid, issue new shares, or reduceliquid assets to repay other debt. The Company monitors theratio of its debt to equity and its equity to total assets. As a percentage, these ratios were 108% (December 31, 2015 – 92%;June 30, 2015 – 148%) and 46% (December 31, 2015 – 47%;June 30, 2015 – 38%), respectively, at June 30, 2016 indicatingthe Company's continued financial strength and relatively lowdegree of leverage. The Company's debt, and leverage, will usually rise with an increase in finance receivables and loansand vice-versa. The Company's share capital is not subject toexternal restrictions. However, the Company's credit facilitiesinclude debt to tangible net worth ("TNW") covenants.Specifically, at June 30, 2016, AFIC and AFIU are required tomaintain a debt to TNW ratio of less than 3.5 on a combinedbasis. Varion is required to maintain a debt to TNW ratio ofless than 3.0. The Company was fully compliant with its bankingcovenants during the six months ended June 30, 2016 and 2015.There were no changes in the Company's approach to capitalmanagement from previous periods.
19. Subsequent eventsAt July 27, 2016 there were no subsequent events occurringafter June 30, 2016 that required disclosure.

www.accordfinancial.com
In Canada
Toronto
(800) 967-0015
Montreal
(800) 231-2977
Vancouver
(844) 982-3010
In the U.S.(800) 231-2757