Embed Size (px)
Citation preview

Contents lists available at ScienceDirect
Cognitive Psychology
journal homepage: www.elsevier.com/locate/cogpsych
Distinguishing experts from novices by the Mind’s Hand and Mind’sEyeJohn K. Lindstedta,⁎, Wayne D. Grayb
a Department of Psychological Sciences, Rice University, United Statesb Cognitive Science Department, Rensselaer Polytechnic Institute, United States
A R T I C L E I N F O
Keywords:TetrisChoice reaction timePrincipal Component AnalysisExpertExtreme expertisePerceptual learningPerceptual expertiseSequential decision-makingTime pressureVideo gamesSkill
A B S T R A C T
Tetris is a complex task notable for the increasingly substantial demands it makes on perception,decision-making, and action as the game is played. To investigate these issues, we collected dataon 39 features of Tetris play for each Tetris zoid (piece), for up to 16 levels of difficulty, as each of240 players played an hour of Tetris under laboratory conditions. Using only early (level 1) data,we conducted a Principle Component Analysis which found intriguing differences among itsthree, statistically significant, principle components. Each of these components captures differentcombinations of perception, decision-making, and action which suggests differing higher levelskills, tactics, and strategies. Each component is presented and discussed, and then used in aseries of principle component regression analyses on subsets of these data (a) from differentTetris levels, as well as (b) from players of different levels of expertise. We validate these modelswith data collected at a locally held Tetris tournament. These components represent elements ofexpertise; namely, correlations among perceptual, decision-making, and motor features that re-present processing stages and hierarchical control and which distinguish expert from noviceTetris players. These components provide evidence for an integrated complex of processes – theMind’s Hand and the Mind’s Eye – that are the essence of expertise in the real-time, sequential-decision-making task of Tetris.
1. Introduction
Tetris is a complex task, notable for the perceptual-motor demands it makes on human players. These demands start low and slowbut increase the longer the game is played. However, the game’s surface-level perceptual-motor demands are not as notable orimportant as the demands that Tetris places on the complex interactions between human cognition, perception, and action.
(A) In play – Tetris is a complex, dynamic decision-making task, in which even hesitating requires a decision to hesitate.1
(B) Skilled performance in Tetris – requires perceptual learning, planning, motor skills, sequential decision-making, and more. Suchtopics are often studied one at a time, each isolated from the others. Explaining the role of all these within the context of Tetriswould push us and push the field towards more integrated theories of cognition.
(C) Skill variations in the human subject pool – as Tetris is one of the most played games in the world (Stuart, 2010), we knew thatsimply by inviting a few hundred Rensselaer students into our lab for an hour each, we would be able to sample a wide-range of
https://doi.org/10.1016/j.cogpsych.2018.11.003Accepted 21 November 2018
⁎ Corresponding author.E-mail address: [email protected] (J.K. Lindstedt).
1 Lec (1962): Auch zum Zögern muß man sich entschließen – “Even the hesitation you have to decide.”
Cognitive Psychology 109 (2019) 1–25
0010-0285/ © 2018 Elsevier Inc. All rights reserved.
T

skilled performance.(D) Event structure – Tetris imposes event structures (Zacks, Speer, Swallow, Braver, & Reynolds, 2007) to which all players must
adapt. To some degree, the degree of adaptation is a surrogate measure of expertise.
Points A and B (above) suggested to us that Tetris would be a fruitful task for advancing cognitive science by following Newell’sinjunction to, “accept a single complex task and do all of it” (Newell, 1973), point C suggested that Tetris players, representing awide-range of skill levels, would be readily available on a college campus, and point D adds to the richness of Tetris as a manageablycomplex domain for studying the acquisition of expertise.
Newell issued his injunction to the field in his infamous, “You can’t play 20 questions with nature and win” (Newell, 1973),sometimes referred to as “Newell’s complaint.” Thirty years after Newell, Wulf and Shea (2002) published their own complaint titled,“Principles derived from the study of simple skills do not generalize to complex skill learning.”. Wulf and Shea worried, as Newell did,that the phenomena studied by them and their colleagues would not generalize beyond the laboratory to complex skilled perfor-mance.
Our Background section explains our subtitle, the “Mind’s Eye in Perception and the Mind’s Hand in Action”, some of our scope, aswell as discussing prior human research and machine modeling work on Tetris. In the Event Structure of Tetris we introduce ourdomain of study to readers who play or who have never played Tetris. In Research Questions, we present three questions driving ourwork, address these questions in Section 5 – Laboratory Study, and validate them in Section 6 – Field Study: Validating the PCAModel. In Section 7 we synthesize our findings and examine what they have to say about human cognition and expertise. We end inSection 7.5, by summarizing our major findings and the conclusions we draw.
2. Background
In this section we (a) make clear the relevance of our referent to the Mind’s Hand and Mind’s Eye in our subtitle, (b) introduce pastresearch on haste versus waste – and the view that skilled performers may be both faster and more deliberate than less skilledperformers, (c) provide an overview of our work on machine players of Tetris, and (d) summarize this section.
2.1. Expertise: the Mind’s Eye in perception and the Mind’s Hand in action
Arguably, the modern study of expertise began with Chase and Simon’s “Perception in Chess” (1973a) and “The Mind’s Eye inChess” (1973b). In both papers, we can paraphrase the authors as asking “what do experienced chess players ‘see’ when they look at achess position?” In our work, we ask, “what do experienced Tetris players see” that leads them to place zoids in one position on theTetris board rather than another. In common with Chase & Simon we are not focused on perception per se but more on the mind’s eyein playing Tetris.
Referring to the experiences of expert chess or expert Tetris players as the “mind’s eye” implies perceptual learning (Abernethy,Farrow, & Mann, 2018; Landy, 2018) and/or a high level of pattern recognition that is heavily knowledge dependent in that the samephysical stimuli – a given configuration of chess pieces – can be interpreted by novice chess players as a simple pattern of white andblack pieces, while expert players see a Sicilian Defense not a French Defense during the opening moves – or a Bishop and Knightfianchetto checkmate rather than Anastasia’s checkmate.
Of course, Chess is not an action game and a focus on Chess and on other “slow movement” paradigms such as the Tower of Hanoi(Anzai & Simon, 1979; Simon, 1975) may have contributed to Simon’s general inattention to an “action” component in his pains-takingly detailed player-by-player analyses of “what is learned” in these paradigms. We refer to this neglected component as the“mind’s hand” in action which we see as compatible with Witt’s (2018, chap. 11) discussions of the interdependence of perception onaction and of action on perception.
2.2. Quick but not rushed, fast but not hasty: are skilled performers faster but more deliberate than novices?
In several domains, it has been noted that motor elements of skilled performers are immune from task elements that impair thebehavior of novice performers. In an interesting real-world study, Shinar, Meir, and Ben-Shoham (1998) found that manual gearshifting affected novice drivers’ detection of road signs whereas operating a car with an automatic transmission did not. Experienceddrivers, in contrast, were equally able to detect road signs regardless of the cognitive or motor demands made by their car’stransmission.
It seems to be that the most damaging distractions are those that focus the performer’s attention on their own actions (Wulf &Prinz, 2001). However, this conclusion merits a strong and interesting caveat; namely, that the damaging effect of a performer’s self-focus varies with the performer’s level of expertise.
In a study of novice vs experienced golfers, Beilock and colleagues (Beilock, Bertenthal, McCoy, & Carr, 2004, p. 379) reportedthat experienced golfers did better hitting the golf ball while monitoring for an auditory tone than when attending to their swing.Novice golfers, in contrast, did better while attending to their swing than while monitoring for the tone. This finding was extended(Beilock, Bertenthal, Hoerger, & Carr, 2008) by varying the “tool” used from a regular “putter” to an oddly constructed one (referredto by the authors as “a funny putter”) with the funny putter bothering the experienced golfers more than the novices. A nearlyidentical finding was obtained (Gray, 2004) in a baseball batting task when the two conditions entailed attending to the frequency ofa tone versus the direction of bat movement.
J.K. Lindstedt, W.D. Gray Cognitive Psychology 109 (2019) 1–25
2

2.3. Machine players of Tetris
In the last 10 years, Tetris has been used as an experimental paradigm for testing various machine learning algorithms. Themajority of the machine learning studies use Cross-Entropy Reinforcement Learning (CERL) modeling (e.g., Fahey, 2015; Gabillon,Ghavamzadeh, & Scherrer, 2013; Şimşek, Algorta, & Kothiyal, 2016; Szita & Lorincz, 2006; Thiery & Scherrer, 2009b, 2009a). In thissubsection we briefly review two lines of research using machine models to illuminate the human challenge of Tetris.
2.3.1. Viewing the objective function of reinforcement learning models as making cognitive claimsThe objective function favored by the Machine Learning Community is simply the number of lines cleared and, once trained with
this objective function, their best models can clear hundreds of thousands of lines. These models make their decisions in millisecondsand, unlike human players, do not have to deal with time pressures due to increasing drop rates. Similarly, the models do not have toworry about the time needed to rotate and move the current zoid to the preferred location. Just as clearly, the models can play forhundreds of thousands of lines as they never become tired, never become bored, never become hungry, and never have to deal withanything that might distract a human.
In contrast to the machine learning perspective, Janssen and Gray (2012) argued, that for human modeling, the choice of “when”,“what”, and “how much” to reward in a reinforcement learning model can be viewed as making claims on human cognition. “What”is rewarded is referred to as the objective function and when we (Sibert, Gray, & Lindstedt, 2017) trained our models using differentobjective functions, we found that the model trained to optimize score rather than number of lines cleared, provided a better match tothe human data with differences in score accounting for approximately 40% of novice human placements and nearly 65% of experthuman placements. Unlike the machine learning studies where, during training, the models played until they died, in our study themodels trained for a maximum of 506 zoids per game.2 Although the Score model cleared fewer lines than did the Lines model (168 vs200), its score was notably higher (175,455 versus 103,342).
Studying the feature weights learned by the two models, we concluded that the Score model had developed the higher risk, higherpayoff policy of using multiple line clears. For example, in Tetris, clearing 4 lines at once yields 7.5 times as many points as clearingone line, four times. However, this strategy requires building a higher board. In contrast, the risk-adverse, Lines model relied almostexclusively on single-line clears.
2.3.2. Tortoises and HaresOur most recent machine modeling work on Tetris (Sibert & Gray, 2018), used a grid search to evaluate 116 models of Tetris
defined by 6 features with 11 possible weights per feature for a total of 1,771,561 models per run. The results presented here are fromSibert and Gray’s Study 1a.
For study 1a, the Hare models were run either until they died or played 200 lines (whichever came first). In a second run, allmodels played until they died (Tortoise models) with the longest run model playing 125,829 lines.
Table 1 shows that the behavior of the best Hare model differed from that of the best Tortoise model. The vast majority (73.6%) ofline clears for the Tortoise model were 1-Line clears with very few (0.1%) 4-Line clears. In contrast, the Best Hare model showed a U-shaped distribution of line clears with more 4-Line clears than 3-Line clears and 26% fewer 1-Line clears than for the Best Tortoisemodel.
Table 2 shows data collected in our lab from human players. Importantly, the better human players (Ranks 1 and 2) show astronger U-shaped function than our machine players, with a much higher proportion of 4-line clears than those shown by the Haremachine models (compare the Best Hare model in Table 1 with the Rank 1 and Rank 2 human players in Table 2).
Interestingly, the distribution of line clears for our poorest human players, Ranks 4 and 5, resembles our Best Tortoise modelsmore than they do our Best Hare models. Perhaps more interesting is that Rank 1 shows more 4-Line clears than 1-Line clears andRank 2 shows almost as many 4-Line clears as 1-Line clears. Whatever it is that our best human players are doing, it is something(s)very different than our Best Hare model.
2.4. Summary of section
We began with brief overviews of the cognitive science issues we investigate in this work; the Mind’s Eye in Perception and Mind’sHand in Action (Section 2.1) and differences between skilled performers and novices (Section 2.2) in tasks involving the integrationof perception, decision-making, and action.
We then reviewed results from our work that explored machine modeling approaches for understanding human trade-offs inTetris (Section 2.3). Both our past (Sibert et al., 2017) and current (Sibert & Gray, 2018) machine modeling work enabled us to focuson subtle differences in decision-making to determine whether, when all other aspects of complex cognition are removed, a con-tribution of the focal aspect(s) remains. These sorts of surgeries cannot be performed on human players but can be performed onmodel players.
2 The span of “506” zoids was picked as, at the time of the Sibert et al. (2017) study, that was the highest span of Tetris played by any player in ourlaboratory.
J.K. Lindstedt, W.D. Gray Cognitive Psychology 109 (2019) 1–25
3

3. The event structure of Tetris
Tetris3 is a puzzle game in which players arrange falling blocks, known as zoids, into configurations known as the pile, whileattempting to leave as few gaps as possible (see Fig. 1). Players can move the zoid left and right (translations), rotate the zoidclockwise or counterclockwise, and manually drop the zoid to expedite the fall to its destination. When a player fills an entire row ofcells with zoid segments, the line is cleared and points are awarded. (Fig. 1 illustrates various elements of the game board and scoringrules in the game of Tetris.)
In common with many human events (e.g., pitching a tent, going for a hike, cooking a meal, or playing a board game), the eventstructure of Tetris was designed (Zacks et al., 2007; Zacks & Swallow, 2007). The most basic Tetris event structure is the episode (seeTable 3). As Tetris is played, the zoid falls from top-to-bottom while being acted on by the player. The drops are step-like and if agiven zoid were to fall all 20 rows from top-to-bottom it would pause 20 times. However, except in the case of an empty or nearlyempty board, most zoids come to rest before falling 20 rows.
Within an episode, within each step of the zoid’s fall, there can be multiple instances of three types of player initiated movements.Players can move the zoid left or right (translations), rotate it clockwise or counterclockwise (rotations), or force an early drop to thenext row. As these movements usually occur in combination with each other and as sequences of these various movements are oftencontinuous across two or more steps, we refer to any and all combinations of these elements as player initiated movements (seeTable 3). As there is only one movable zoid per each Tetris episode, it is convenient to consider all movements of that zoid as oneevent.4
Also within an episode, a Player Initiated Movement event can result in filling 1, 2, 3, or 4 rows, thereby triggering a third type ofevent, clear rows(s), which clears 1, 2, 3, or 4 rows at once.
The fourth type of event is triggered at every 10th row clear event; namely, a level change (see Table 3). The number of levels forTetris begins at level 0 and increments by one for each 10 rows cleared. The level change is made salient by changes in the levelindicator (beneath the score and lines indicators in Fig. 1a) and by changes in the color schemes for the 7 zoids. Interestingly, manyadvanced players have memorized the correspondence between color scheme and level number. However, for the student players westudy, the color scheme per se is not especially important.
The fifth type of event are speedups in the drop rate (see Table 3); however, for other than the 17 best players we study in thispaper, speedups are synonymous with level changes. That is, for the first 10 levels of play, levels 0–9 (see Table 5) each change inlevel results in a color change and an increase in drop rate. But, as Table 5 shows, although all level changes result in color changes,above level 9, not all level changes result in speed increments. As very few of our 240 college players make it beyond level 9, theintricacies of this fifth level of event structure are largely ignored in this paper.
Tetris supports events other than those shown in Table 3. However, those events represent Extreme Expert maneuvers that ourlaboratory players either do not know about or cannot execute.
4. Research approach and questions
In this work, we attempt to relate the common and distinguishing behaviors of novice and expert Tetris players to the theoreticalconstructs of cognitive psychology. As ours is an exploratory effort, we ask the following questions:
Table 1Model Players: Percentage of types of line clears for the Best Tortoise and Best Hare models(from Study 1a of Sibert and Gray, 2018).
Line Clear Type Best Tortoise Best Hare
1-Line 73.61 47.742-Line 24.26 25.133-Line 2.01 9.054-Line 0.11 18.09
Table 2Human Players: Percentage of type of line clears by Human Skill Level (from Sibert and Gray, 2018).
Line Clear Type Rank 1 Rank 2 Rank 3 Rank 4 Rank 5
1-Line 26.63 33.31 46.87 51.82 62.372-Line 19.93 22.28 31.63 30.55 24.753-Line 4.41 14.05 10.81 10.20 9.854-Line 49.02 30.36 10.69 7.43 3.03
3 Readers who are unfamiliar with the game Tetris or who have never seen an expert play Tetris may wish to watch the last round of play at the2016 Classic Tetris World Championships – https://www.youtube.com/watch?v=DdfRQjb5o9k.
4 In large part, the decision where to segment movement is a level of analysis issue.
J.K. Lindstedt, W.D. Gray Cognitive Psychology 109 (2019) 1–25
4

(1) Can expert players be distinguished from novices when both are playing under low time pressure (level 1, fall rate 1.25 rows/s)and, if so, on what performance components are they distinguished?
(2) Can we distinguish among our very best players when they are playing Tetris under high time pressure (level 9, fall rate10.0 rows/s)?
Fig. 1. Elements of the game of Tetris. On the left of figure (a) is an example screen from the game with labels added: the “zoid” is the active gamepiece that falls from the top of the screen and can be manipulated by the player; the “pile” refers to the accumulated zoid segments at the bottom ofthe game space; and the “next” area is a preview of the next active zoid. The player’s current score, lines cleared this game, and current difficultylevel are displayed, as well as the current game number in the session. On the right of figure (a) are examples of filling and clearing 1, 2, 3, and 4lines. Point values for line clears of each size scale with difficulty level according to the formulas shown, where “level” is the current game difficultylevel. Figure (b) shows the time pressure present at different levels of the game in the form of the amount of vertical space automatically traversedby the zoid in the span of 1 s.
J.K. Lindstedt, W.D. Gray Cognitive Psychology 109 (2019) 1–25
5

(3) Can we then again distinguish among our very best players when they are playing Tetris under low pressure?(4) Can our findings be generalized to a different population of players (contestants trying to qualify for a Tetris Tournament rather
than college students playing Tetris for course credit) and to very different conditions of play; that is, the open and noisyenvironment of a Game and Anime Festival as opposed to the relative peace and quiet of the sound-controlled chambers used inthe lab?
5. Laboratory study
In the laboratory study, we seek to construct models of player expertise based on the results of a Principal Component Analysis ofempirically collected performance data, then compare the findings of these models of player skill under conditions of both high andlow time pressure that naturally occur in the task.
This section contains five main parts and a discussion. Parts 1 and 2 are discussed in the Methodology subsection. Part 1 detailsthe collection of an hour of Tetris gameplay data from each of 240 students in the laboratory. Part 2 details the set of 39 behavioralfeatures extracted from the gameplay data collected in part 1 (i.e., the moment-to-moment structure of the pile and player actionswhile maneuvering the zoid).
Parts 3–5 are discussed in the Results subsection. Part 3 codes player expertise, or the criterion score, as a normalized trans-formation of the mean of the highest-scoring four games played in the one hour lab sessions from part 1. Part 4 is a PrincipalComponent Analysis (PCA) that reduces the 39 features from part 2 into a set of 3 orthogonal components by weighting them in sucha way as to account for as much of the variance in player behavior as possible (note that specific indicators of the player’s final gamescore or game level were not included in this analysis). Part 5 constructs Principal Component Regression (PCR) models of player skillusing the criterion scores from part 3 and the three components from part 4. Models are constructed and compared for both lowpressure (level 1, 239 players) and high pressure (level 9, 27 players) game scenarios, with a third model focused on skill differencesamong the 27 high-scoring players under low pressure conditions. Fig. 2 shows the relationship and flow of data between the parts ofthis laboratory study.
5.1. Methodology
5.1.1. Part 1: Data collectionOver the course of 5 semesters between 2013 and 2015, we collected one hour of gameplay performance data from 240 parti-
cipants in our laboratory with the intent of comparing their relative levels of expertise as distinguished by the fine details of theirmoment-to-moment task performance.
5.1.1.1. Participants. Participants were recruited from the undergraduate populations of General Psychology and Sports Psychologycourses. Participation was rewarded with course credit (or hourly compensation of $10 for a session during Summer semesters).Participation in the study was reviewed and approved by the Rensselaer IRB.
5.1.1.2. The Tetris task. The task of each subject was to play the Meta-T (Lindstedt & Gray, 2015) implementation of “Classic Tetris”(Wikipedia, 2016). Although there are minor visual differences stemming from our use of Python as an implementation language, theMeta-T version of Tetris is a faithful representation of the original NES Tetris used at the annual, “Classic Tetris World Championship”(CTWC). Meta-T has been examined by the software expert of CTWC and found to be a faithful version of Classic Tetris up throughlevel 19. Above level 19 there are subtle hardware and software differences between Meta-T running on a modern computer and theoriginal Tetris cartridge running on a 1980s-era NES machine (as used by the CTWC) that have proven difficult to reconcile. However,as none of the 240 participants in our lab or in the tournaments run by our lab has ever reached level 19, these feature differenceswere not important to this study.
5.1.1.3. Procedure. Each participant was seated in front of a desktop computer,5 given an NES (Nintendo Entertainment System)controller (retrofitted to connect to the computer via USB), and asked to play 50 min of our custom experimental Tetris softwareMeta-T (Lindstedt & Gray, 2015). After the game, the participant completed a brief exit survey and was debriefed.
Table 3The event structure of Tetris.
Event Label Description
Event 1 Episode One zoid entering screen and coming to restEvent 2 Player Initiated Movement Rotation, Translation, or Forced dropEvent 3 Rows cleared Filling, thereby clearing 1–4 rowsEvent 4 Level change Triggering next level by clearing 10 rowsEvent 5 Speed ups Increase in drop rate
5 The computer was equipped with an SMI eye tracking system. Eye tracking data were collected, but are not part of the current study.
J.K. Lindstedt, W.D. Gray Cognitive Psychology 109 (2019) 1–25
6

During play, the Meta-T software tracks game states and keypresses to the millisecond level with such fidelity that a perfect replayof each player’s performance could be played back at actual (or arbitrary) speed. This high fidelity logging allows analysis of thedetails of moment-to-moment gameplay that goes far beyond simple analyses of overall game scores used in other Tetris studies (e.g.,Holmes, James, Coode-Bate, & Deeprose, 2009; Linn & Petersen, 1985; Martin-Gutierrez, Luis Saorin, Martin-Dorta, & Contero, 2009;Okagaki & Frensch, 1994; Sims & Mayer, 2002; Terlecki, Newcombe, & Little, 2008). Hence, Meta-T transforms Tetris from the “gameas treatment condition” mode used in these prior studies, to a Game-XP (game as experimental paradigm) (Gray, 2017).
5.1.1.4. Data reduction and filtering. As a player progresses through a single game of Tetris, the time pressure rises with the levelchange (Event 4, see Table 3) until even the best players can no longer control the board, resulting in the end of the game. This finallevel of play necessarily contains the time at which things “went wrong” and the player lost the game, possibly exhibiting panickedbehavior in the process. While this “game-losing behavior” is likely to be quite interesting to examine on its own, it is qualitativelydifferent from whatever constitutes “successful” performance for a given player’s level of expertise. Many players choose to abortgames early if all is not going exactly to plan. This behavior is more common during the early levels, when the player has littleinvested, than it is when the game’s difficulty level approaches the limit of the player’s ability. Although we asked players not to abortwhen they had the impulse to get a fresh start, it seems at least some Tetris players could not avoid doing so. As a data analysis issue,this game-aborting behavior is difficult to efficiently and reliably distinguish from both normal play behavior and strugglingbehavior.
Thus, to side-step the issues of end-of-game panic and self-termination, we only use data from “completed” game levels, excludingbehavior from the final level reached. Before filtering the data, in total the 240 players played 2153 games (mean 9.0 per player),producing a total of 271,843 episodes (mean 1132.7 per player). We omit the one player who never managed to complete level 0.After filtering, the data set contains data from 239 players playing 1814 games (mean 7.6 per player) and producing 213,322 episodes(mean 892.6 per player). (Some of these filtering processes will become clearer when we walk through a sample player’s data inFig. 5.)
Fig. 2. Graph of the flow of data through the experiment.
J.K. Lindstedt, W.D. Gray Cognitive Psychology 109 (2019) 1–25
7

5.1.2. Part 2: Decomposing Tetris play into measurable featuresFor each episode of gameplay, we decomposed the Tetris task into an array of measurable features each of which reflects some
aspect(s) of player behavior (a complete list of these features is provided in Appendix A). Many of these features are measures of thegame state that a player can visually observe and reason over. These features include information about the shapes of the piles aplayer builds and the locations in which a player ultimately places the falling zoid. Some of these game state features were derivedfrom the machine learning literature (Fahey, 2015; Gabillon et al., 2013; Szita & Lorincz, 2006; Thiery & Scherrer, 2009a), where thefocus has been on developing metrics of the “goodness” of each zoid-placement.
We interpret many of our features as measuring (a) errors of commission and recovery (e.g., the number of unworkable ‘pits’present in the game state), (b) risk and reward (e.g., how high the player allows a board to grow in favor of a high payoff maneuvers),and (c) more abstract elements a player may be sensitive to, such as relative “randomness” or “ugliness” (e.g., the general disarray ofthe board).
Unlike for human players, interactive elements of placing a zoid (e.g., motor times, action sequence efficiency) are trivial or non-existent for Machine Players (MPs). Hence, our set of features goes beyond those of the MP work and also includes measures of how aplayer maneuvers a zoid to its ultimate destination. These features correspond with classic psychometric elements of behavior presentin most any interactive task, including counts and kinds of keypresses, initial and average response latencies, and measures ofefficiency of move execution. Fig. 3 illustrates some of the features measured. (See Appendix A for extended definitions of each of our39 features.)
This robust list of features suffers from one critical drawback: there is substantial overlap among the definitions of many of thesefeatures such that they are highly correlated. Fig. 4 shows a visual representation of the correlation matrix for this full set of featuresbased on all of the available episode-level data, post filtering. For the exact correlation coefficients, see Appendix A. It is clear fromthe extent to which the correlations appear to cluster in the figure that some of these features are measuring similar underlyingelements of the task and player behavior. In the next section we turn to principal component analysis to construct a reduced set ofcomponents that better explains variation in performance.
Fig. 3. Some features of gameplay in Tetris: (a) features of the board state, including the maximum height of the pile (max_ht), the number ofunworkable holes buried in the pile (pits – indicated by the red circles), the mean height of all columns in the pile (mean_ht), the “jaggedness” of thepile’s perimeter (jaggedness); (b) a feature describing how well a particular zoid-placement fits with the surrounding pile (matches); and (c) thethree types of keypress actions in the game (translations, rotations, and drops) and three temporal features of the episode including the initiallatency of the first keypress of the episode (init_lat), the mean latency of keypresses throughout an episode (avg_lat), and the time until the playerfinally (if at all) drops the zoid into the pile (drop_lat).
J.K. Lindstedt, W.D. Gray Cognitive Psychology 109 (2019) 1–25
8

5.2. Results
The data collected from each participant captured performance as granular as the individual keystrokes in Player InitiateMovements (see Event 2, Table 3), and as coarse as summary scores for the entire game. The basic unit of analysis is Event 1, theepisode (see Table 3); that is, the time between a zoid appearing, dropping, and stopping. The period of “dropping” includes all Event2s (i.e., keystrokes to rotate, transpose, or drop that zoid), as well as less observable player decisions on where to place the zoid andhow to move the zoid to the targeted location. Of course, not all plans are equally well-thought out or equally well-executed and ourtask was to identify those elements of player behavior that signify differences in player expertise.
Our approach is more exploratory than confirmatory, with our goal being to “observe and report” details related to phenomenonof expert player skill. We enter into this analysis trivially expecting to find significant correlations between player behavior andplayer expertise, but what we are most interested in are those patterns of behavior that differentially signal novice versus expertperformance.
Before addressing the relationship between player behavior and player expertise, we must first: (1) appropriately codify playerexpertise, and (2) identify what distinct elements of player behavior are most meaningful in the game of Tetris. To address the former,we construct a metric of expertise based on players’ game outcomes, and perform a principal component analysis to address the latter.
Fig. 4. Correlation matrix of all features measured across all episodes analyzed. Feature correlations are represented as percentages in the cellsbelow the diagonal. In the cells above the diagonal, the hue indicates the direction of the correlation (red is negative, blue is positive), and thetransparency represents the strength of the correlation (full colors are near 1 or −1, fading to white as values approach zero). Note the high degreeof correlated clusters of features throughout, such as the more interactive behavioral elements on the upper left, and various clusters among themore structural elements of the task in the bottom right, and some weaker connections among those two groups along the upper right. (Forinterpretation of the references to color in this figure legend, the reader is referred to the web version of this article.)
J.K. Lindstedt, W.D. Gray Cognitive Psychology 109 (2019) 1–25
9

5.2.1. Part 3: Codifying expertise in TetrisIn the present investigation, “experts” are considered to be players who score higher than their peers and do so routinely and con-
sistently, not just in the occasional outstanding instance. As such, we want to use an average score to smooth out high outliers. But becauseTetris is a sequential task where a series of perfectly executed “good” decisions can be undone with a single critical error, it is much easierfor a skilled player to “crash and burn” than it is for a novice player to secure an abnormally high score. Thus we examine each player’s“best consistent performance” by taking the mean of each player’s best 4 game scores achieved in their 1 h of laboratory gameplay. Thismeasure forgives the player’s worst games, while considering their four best games as exemplary of their expertise. Fig. 5 shows that Player3117’s highest four games scored 142,443, 106,569, 85,028, and 178,400 points. The mean of these four is 128,110 points.
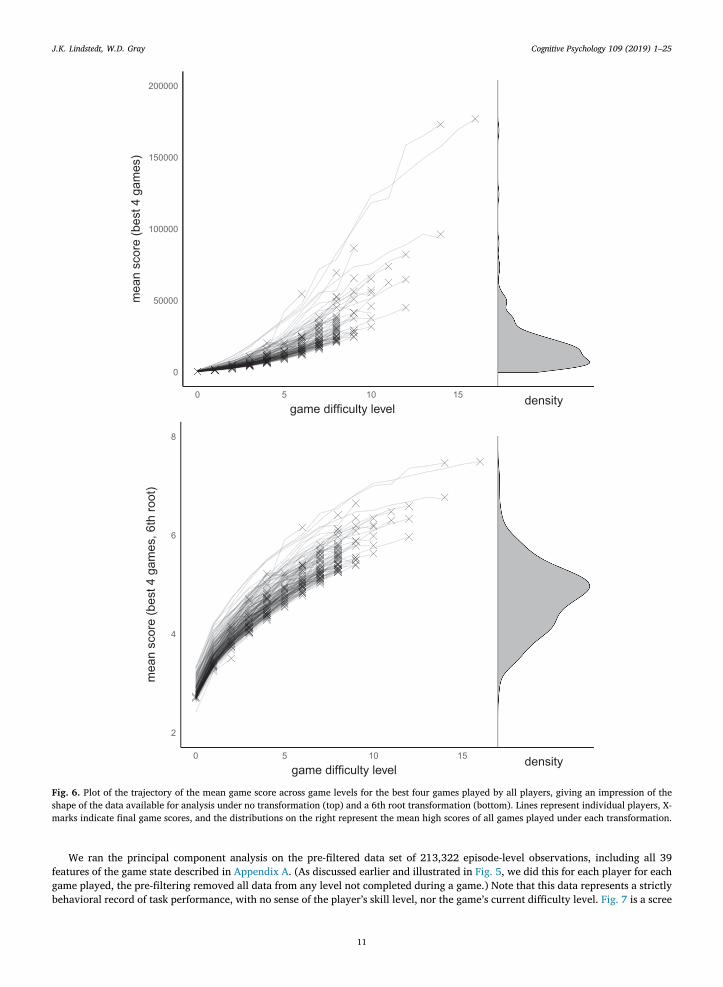
As players progress through the game the speed at which the zoids drop increases and the points received for 1-line clears, 2-lineclears, 3-line clears, and 4-line clears (aka “a tetris”) are multiplied. Hence, the scoring system is highly positively skewed. In pursuitof a normal distribution of criterion scores measuring player skill, we found the transformation that maximized normality for thesecriterion scores was a sixth-root transform, with a Shapiro-Wilks test revealing it had the least deviation from normal compared toother roots and log transformations (W = 0.992, p = 0.24). This transformation is done not with any particular cognitive mechanismin mind, but for statistical convenience.
For comparison, Fig. 6, charts the trajectory of each player’s mean score (best four games, untransformed) and mean score (best fourgames, 6th root transform) across each game difficulty level, as well as the distributions of players’ mean high scores under eachtransformation. Most notable in the figure is that, for the untransformed data, there is a pile of overlapping lines and low (under 50,000points) scoring games at the easier levels of game difficulty (x-axis) with a sparse collection of stronger players represented at the higherlevels of play, all of which produces a highly skewed distribution of summary scores. By contrast, the 6th root transformation highlightsthe differences between players across levels, and produces a much more normalized distribution of summary scores.
Thus, a player’s “criterion score” is equal to the 6th root of the mean of the best 4 games played in 1 h, a normally distributedrepresentation of a player’s level of expertise in comparison to their peers. With our operationally defined measure of player ex-pertise, we now examine what combinations of measures of moment-to-moment player behavior best account for the variety ofperformance in Tetris using principal component analysis.
5.2.2. Part 4: Principal Component AnalysisPrincipal component analysis finds a reduced set of orthogonal components that maximally capture variation in the task behavior.
Each component is a weighted combination of a subset of the 39 features of player performance. Using this process, we reduce our 39features to 3 components and examine them for more intuitive descriptions of how behavior varies in this task.6
Fig. 5. An Illustration of the data produced by a single subject (subject ID 3117). Each line represents a single game played, showing both theultimate score and all game difficulty levels for which data was captured during the course of that game. The four games with the highest scores ofthe hour-long session are highlighted in gray, and the average of those games’ scores and the sixth root “criterion” score are displayed below.Incomplete game levels excluded from analysis are grayed out with dotted borders. Data from game difficulty levels 1 and 9 (highlighted) from thebest four games are later used for the low and high time pressure conditions for principal component regression models.
6 We also performed an exploratory factor analysis (EFA) which we do not report in the main body of this article because its resultant factorloadings did not differ substantially from the PCA’s. Additionally, whereas the PCA yielded three components that seem coherent (as represented bythe names we assigned and our discussions of them in the text), the EFA created 12 factors that lacked coherence. We revisit this issue in ourConclusions & Summary section.
J.K. Lindstedt, W.D. Gray Cognitive Psychology 109 (2019) 1–25
10
We ran the principal component analysis on the pre-filtered data set of 213,322 episode-level observations, including all 39features of the game state described in Appendix A. (As discussed earlier and illustrated in Fig. 5, we did this for each player for eachgame played, the pre-filtering removed all data from any level not completed during a game.) Note that this data represents a strictlybehavioral record of task performance, with no sense of the player’s skill level, nor the game’s current difficulty level. Fig. 7 is a scree
0
50000
100000
150000
200000
0 5 10 15
game difficulty level
mea
n sc
ore
(bes
t 4 g
ames
)
density
2
4
6
8
0 5 10 15
game difficulty level
mea
n sc
ore
(bes
t 4 g
ames
, 6th
root
)
density
Fig. 6. Plot of the trajectory of the mean game score across game levels for the best four games played by all players, giving an impression of theshape of the data available for analysis under no transformation (top) and a 6th root transformation (bottom). Lines represent individual players, X-marks indicate final game scores, and the distributions on the right represent the mean high scores of all games played under each transformation.
J.K. Lindstedt, W.D. Gray Cognitive Psychology 109 (2019) 1–25
11

plot7 showing the variance in the data explained by each component. Typically, one searches for the inflection point, or “elbow”, in ascree plot to determine how many components to include in further analysis, as the explanatory power gained tapers off with eachadditional component considered. Here we see the elbow at component 4, which suggests we use only the first 3 components in theanalysis. Because the remaining components explain little variance (and are difficult to describe in terms meaningful to task be-havior), they are excluded.
Table 4 shows that the three principal components included in the analysis explained 25.6%, 14.0%, and 9.3% of the variance inthe observed data, for a cumulative total of 48.9%. Table B1 in Appendix A shows the exact feature loadings for each component.
5.2.2.1. Component 1, “disarray”. Disarray is associated with larger piles, more holes, general messiness, and pile structures that aregenerally unfavorable. A positive value here means the pile is larger and more difficult to work with, while a negative value relatesmore to lower piles.
5.2.2.2. Component 2, “4-line planning”. Planning for “Tetrises” requires an empty vertical space that is at least 4 rows deep. This typeof structure is associated with large but orderly piles that leave a deep empty well on the far left or right of the game board – an idealsetup for performing the valuable but risky maneuver of clearing 4-lines at once (i.e., a “Tetris”). Higher values of component 2 implymore progress toward preparing for a 4-line payoff, while lower values are associated with shorter piles, and perhaps more short-sighted strategies.
5.2.2.3. Component 3, “decide-move-placed”. This component neatly corresponds to the activities in Event 2 (see Table 3), PlayerInitiated Movement. The “decide” subcategory measures choice-response-time on four features and, for a fifth feature, includes theproportion of time in the episode during which the player intentionally “dropped”8 a zoid. The “move” subcategory compares theminimum number of movements required to get the zoid to its resting location with the actual number used (i.e., sum of rotations,lateral transitions, or intentional drops). The “placed” subcategory measures the goodness of the zoid’s placement in terms ofminimizing the height of the pile and maximizing the number of edges matched (as per Fig. 3b).
�
�
�
�
� � � � � � � �
0.05
0.10
0.15
0.20
0.25
1 2 3 4 5 6 7 8 9 10 11 12component
prop
ortio
n of
var
ianc
e
Fig. 7. Scree plot of the proportion of variance explained by each component. The dashed line represents the “elbow”, the point of inflection atwhich components offer substantially diminished returns in terms of both variance explained and ease of description. As such, only the first threecomponents are included in the analysis.
Table 4Results of the principal component analysis.
Component Label Relevant Features % Variance Explained
1 disarray High height, many pits 25.62 4-line planning High height, deep wells 14.03 decide-move-placed Efficient and fast movements 9.3
Total 48.9
7 “A scree plot displays the eigenvalues associated with a component or factor in descending order versus the number of the component or factor”,see (Minitab, 2017).
8 Zoids will drop by themselves. However, players can hasten drop speed by pressing and holding the drop button. Doing this indicates that theplayer has decided exactly where she wants the zoid to land.
J.K. Lindstedt, W.D. Gray Cognitive Psychology 109 (2019) 1–25
12

5.2.2.4. Principal Component Analysis discussion. The 3 components found in the PCA explain just under 50% of the variance amongall observed episode-level behavioral measures of our Tetris data. The component explaining the most variance, “disarray”, is ageneral assessment of the disorder in the pile. A close 2nd in terms of variance accounted for is “4-line planning” which relates tobuilding orderly piles (i.e., structures). The importance of this component is unsurprising, as orderliness is a defining feature of theTetris game in that one must neatly fill rows to perform well. The third component, “decide-move-placed”, is our quick but notrushed, working at a deliberate speed but not hasty component (see our Background section discussion in Section 2.2) and is anoutstanding example of the mind’s hand working in close coordination with the mind’s eye. Together, these are the principalcomponents, the elements of expertise, in Tetris.
5.2.3. Part 5: Principal Component RegressionCan we separate our novices from our stars by the moves they make or only by the points they score? Are our three principal
components really “components of expertise” which allow us to understand as well as predict performance?To answer these questions we construct three separate, multiple linear regression models. First, the low time pressure (level 1)
model uses all 236 players who completed level 19. With data from 236 players, this is our “model of the masses.” Hence, our firstquestion is whether, when all players are playing an easy level, can our three components capture any differences in expertise?
Second, the level 9 model shifts the focus to only those 27 players who are skilled enough to survive at higher game speeds,highlighting what distinguishes the very best players from one another; among these 27 players can we distinguish the “best of thebest” from the “benchwarmers”?
Third, our final multiple regression model provides a twist on the first two. For this one, we construct a level 1 model that includesonly our best 27 players; that is, those who made it through level 9 or beyond. As we will show, we know from our level 9 model thatthese players differ from each other at the high-speeds demanded by level 9, but can we separate our “best of the best” from our“benchwarmers” even when both are at an easy and relaxed level of play?
5.2.3.1. Data aggregation. We summarize our players’ performance data by taking the mean of their component scores for eachdifficulty level for which they had data. By reference to Fig. 5, for player 3117, we took the mean of games 2, 4, 5, and 6 for level 1,but only games 2, 4, and 6 for level 9. (This follows as player 3117 lost the game at level 9 for game 5 and we are only using data forlevels that were successfully completed). Hence, the data used for player 3117 is based on fewer games than that of a player whocompleted level 9 on each of his/her four criterion games, but both players would still have a single representative score for eachcomponent at each game level.
5.2.3.2. Multiple linear regression results. As shown in Table 6, we calculated three multiple linear regressions to predict player expertise(i.e., criterion score), two with level 1 data and one with level 9 data. Each model was then run through a bidirectional stepwise modelselection process based on minimum Akaike Information Criterion (AIC) to eliminate superfluous components in the model.10
Table 5Game speed and proportion of data at different levels. The time taken (in seconds) for a zoid to fall from the top of the screen tothe bottom for a given level of game difficulty. Decisions about where to place the zoid and all maneuvering of the zoid to theproper position must take place in this span of time. Game levels 1 and 9 were chosen for constructing the multiple regressionmodels of low and high time pressure scenarios, respectively.
Difficulty level Time to impact Players with data
Count Percentage
0 16.00 s 239 99.5%(low) 1 14.33 s 236 98.3%
2 12.67 s 225 93.8%3 11.00 s 211 87.9%4 9.33 s 189 78.8%5 7.67 s 158 65.8%6 6.00 s 139 57.9%7 4.33 s 106 44.2%8 2.67 s 67 27.9%
(high) 9 2.00 s 27 11.3%10–12 1.67 s 8 5.8%13–15 1.33 s 3 2.5%16–18 1.00 s 1 0.4%19–28 0.67 s 0 0.0%
29+ 0.33 s 0 0.0%
9 This excludes our 3 poorest players who never made it to the end of level 1, see Table 5.10 The AIC is a measure of model quality designed to assess which of a given set of models is the most likely given the data. In the case of stepwise
model selection, factors are added or removed and the resulting model is compared. The resulting model is the most likely model from among the setof permutations of the factors initially included.
J.K. Lindstedt, W.D. Gray Cognitive Psychology 109 (2019) 1–25
13

For the Level 1–all model (leftmost model in Table 6), regression was significant [ = <F p(3, 232) 144.9, 0.0001] with an adjustedR2 of 0.648. Players’ predicted expertise level (criterion score) is equal to 5.01–0.12 (disarray score) + 0.22 (4-line planningscore) + 0.44 (decide-move-placed score). All three components were significant predictors of player expertise at level 1. None of thecomponents were eliminated during model selection.
For the Level 9–best model (rightmost model in Table 6), regression was significant [ = <F p(2, 24) 12.5, 0.001] with an adjustedR2 of 0.470. Players’ predicted expertise level (criterion score) is equal to 5.65 + 0.13 (“disarray” score) + 1.12 (“decide-move-placed” score). Only the “decide-move-placed” component was a significant predictor of player expertise at level 9, while the“disarray” component showed near-alpha significance ( =p 0.058). The “4-line planning” component was eliminated from this model.
To investigate whether the behavior of the “best of the best” players’ differed among themselves at low time pressure, we ran amultiple regression model using level 1 data for only the 27 best, Level 1–best (i.e., those who successfully completed level 9 at leastonce), shown as the middle model in Table 6. The regression was significant [ = <F p(2, 24) 24.47, 0.0001] with an adjusted R2 of0.644. Players’ predicted expertise level (criterion score) is equal to 5.58 + 0.09 (“4-line planning” score) + 0.50 (“decide-move-placed” score). Both the “4-line planning” and “decide-move-placed” components were significant predictors of player expertise atlevel 1 for the 27 best players. The “disarray” component was eliminated from this model. Fig. 8 illustrates the fit of each model’spredictions to its training data.
5.3. Discussion: laboratory study
5.3.1. Level 1 – All 236For the low time pressure level 1 model with 236 players, the component scores successfully predict differences in player ex-
pertise. Even though level 1 is not challenging, the component analysis differentiates between low and high skilled players. The
Table 6Component coefficients of three multiple linear regression models constructed using data from difficulty level 1 and 9 using the 3 principalcomponent scores. The model in the left column includes level 1 data (only) for all 236 players who completed level 1. The model in the rightcolumn includes level 9 data (only) for each of the 27 players who completed level 9. The model in the middle column includes the same 27 playersincluded in the right column model, but only uses their data collected at level 1. All 3 models attempt to predict the players’ criterion score (i.e.,player expertise).
Level 1 – all (236) Level 1 – best (27) Level 9 – best (27)
Components coeff. sign. coeff. sign. coeff. sign.
(Intercept) 5.01 < 0.0001∗∗∗ 5.59 < 0.0001∗∗∗ 5.65 < 0.0001∗∗∗
disarray −0.12 < 0.0001∗∗∗ – – 0.13 0.0584-line planning 0.22 < 0.0001∗∗∗ 0.09 < 0.043∗ – –decide-move-placed 0.44 < 0.0001∗∗∗ 0.51 < 0.0001∗∗∗ 1.12 < 0.0001∗∗∗
Fig. 8. Fitted values of principal component multiple regression models for the two game levels examined.
J.K. Lindstedt, W.D. Gray Cognitive Psychology 109 (2019) 1–25
14
component that most separates players by skill is the decide-move-placed component. This is our human-execution component whose11 features fall into three categories: decision efficiency (choice-reaction-time and drop probability), efficient movements (mini-mizing the number of rotations and transpositions used to move the zoid to the targeted location), and goodness of the zoid’splacement (i.e., placement of the zoid so as to maximize the number of edges matched to the piece and to lower the overall height ofthe board).
5.3.2. Level 9 – Best 27The high time pressure level 9 model (27 players) differentiates among the relatively small number of players with data at this
high difficulty level. Importantly, the decide-move-placed component is the only significant predictor of player skill at this level.
5.3.3. Level 1 – Best 27We ran this model to determine whether we could differentiate among our 27 best players based on their performance at level 1.
After all, a naive perspective would be that although this group could not help being better on our metrics at level 1 than our lesserskilled players, the skill differences among this top group would not show through at this supposedly relaxed level of play. However,our discovery of skill differences between members of this elite group of players at level 1 play suggests two conflicting hypotheses:(a) the best players are intentionally rushed or hasty, versus (b) the best players are quick but not rushed – that is, they are working ata deliberate speed but not hasty. The former suggests that players are executing movements as fast as possible perhaps to warm up orpractice. The latter suggests that from the players’ perspective, they are not feeling rushed or hasty but are simply making decisionswith their acquired efficiency and precision that results in faster decisions, more efficient movements, and more effective placements(as per our discussion in Background 2.2).
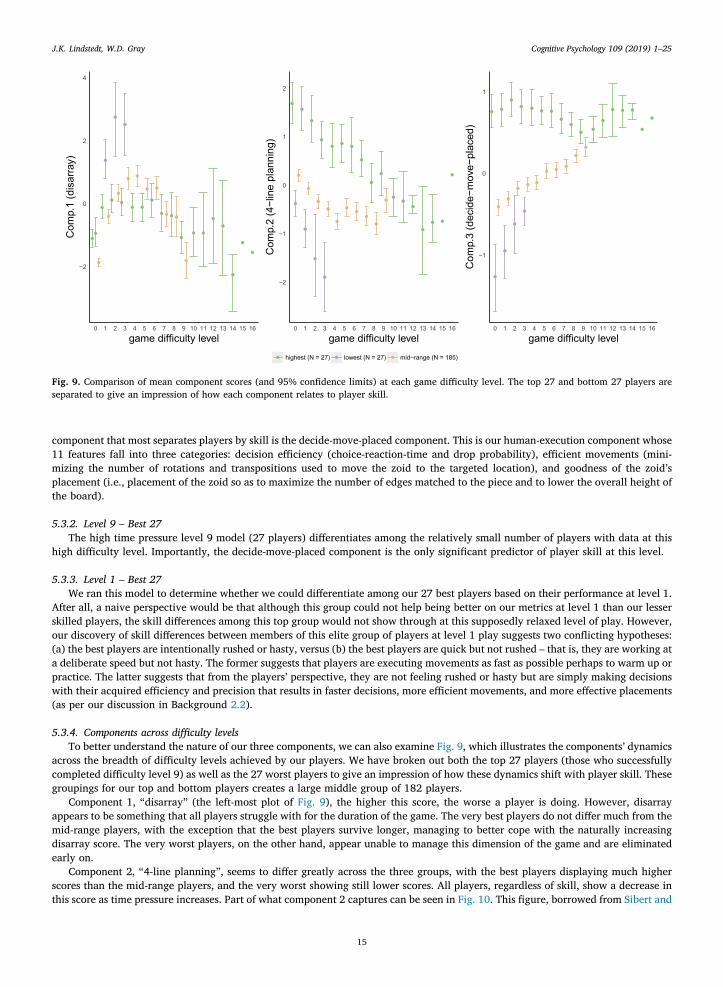
5.3.4. Components across difficulty levelsTo better understand the nature of our three components, we can also examine Fig. 9, which illustrates the components’ dynamics
across the breadth of difficulty levels achieved by our players. We have broken out both the top 27 players (those who successfullycompleted difficulty level 9) as well as the 27 worst players to give an impression of how these dynamics shift with player skill. Thesegroupings for our top and bottom players creates a large middle group of 182 players.
Component 1, “disarray” (the left-most plot of Fig. 9), the higher this score, the worse a player is doing. However, disarrayappears to be something that all players struggle with for the duration of the game. The very best players do not differ much from themid-range players, with the exception that the best players survive longer, managing to better cope with the naturally increasingdisarray score. The very worst players, on the other hand, appear unable to manage this dimension of the game and are eliminatedearly on.
Component 2, “4-line planning”, seems to differ greatly across the three groups, with the best players displaying much higherscores than the mid-range players, and the very worst showing still lower scores. All players, regardless of skill, show a decrease inthis score as time pressure increases. Part of what component 2 captures can be seen in Fig. 10. This figure, borrowed from Sibert and
Fig. 9. Comparison of mean component scores (and 95% confidence limits) at each game difficulty level. The top 27 and bottom 27 players areseparated to give an impression of how each component relates to player skill.
J.K. Lindstedt, W.D. Gray Cognitive Psychology 109 (2019) 1–25
15

Gray (2018), shows the number of Tetrises (i.e., 4-Line clears) per level for each of 67 players as their level of play increases.11 As thefigure suggests, for even the best players, the number of Tetrises per level drops as the rate of falling increases from level 0 to level 16.However, as Appendix B1 shows, this component does not count the number of Tetris but, rather, is measuring changes in boardconfigurations as the game speeds up and players become unwilling to build the high structures required for 4-Line clears; suchhuman concerns are captured by the “4-line planning” component as something about board height, jaggedness, and other features ofboard construction which vary across player skill as well as across level-of-play.
Component 3, “decide-move-placed”, shows a very interesting trend – most players increase their “decide-move-placed” beha-viors (i.e., those behaviors associated with speed, accuracy, and efficiency) as task demands increase, but the very best playersmaintain a nearly constant level of the “decide-move-placed” component across all difficulty levels, maintaining nearly the samespeed and accuracy at level 1 as at level 9 and beyond. Although we list the features of our decide-move-placed component in theserial order of (a) decide, (b) move, and (c) placed, we believe this component is more complex than that ordering suggests. Forexample, with increasing expertise we believe that the ability to spot the best placement comes first. Hence, the end of the “decide”phase (which is marked by any keypress for a transposition, rotation, or drop) signals that the player has decided not simply to“move” the zoid but fully “where best to place the zoid”. This location decision also implies that the player has evaluated the board todetermine that an open path exists to that location.
Rank 1
Rank 2
Rank 3
Rank 4
Rank 5
0 5 10 15
0
50000
100000
150000
0
30000
60000
90000
0
20000
40000
60000
80000
0
5000
10000
15000
20000
25000
2500
5000
7500
10000
Current Level
Cur
rent
Sco
re
Tetris Per Level
0
1
2
Participant Scores by Level
Fig. 10. Number of 4-line clears (i.e., Tetrises) per level for each of 67 HPs across each level and game that each HP played. The larger the dot themore Tetris per that game at that level. The darker the dot, the more HPs represented at that level. Note that the range of levels played is plotted asthe x-axis whereas the score reached in each level of play is shown on the y-axis. Also note that the range of the y-axes vary by Rank level with theshortest range being for Rank 5 (novices) and the longest range for Rank 1 (experts). See text for more details. (From Sibert and Gray, 2018.)
11 The 5 levels of expertise used by Sibert and Gray, roughly correspond to the five levels used in this paper but note that the Sibert and Gray figureis based on the 67 players used in Sibert et al. (2017) which is a subset of the 239 players used here.
J.K. Lindstedt, W.D. Gray Cognitive Psychology 109 (2019) 1–25
16

5.3.5. SummaryThese analyses show that the components that emerged from our Principal Component Analysis of players are important to
different degrees for discriminating among players at different levels of expertise. Under low time pressure (level 1 play), scores onthese three components correlate significantly with expertise among all 236 players (see Table 6). Interestingly, under high timepressure (level 9 play), only our decide-move-placed component remains discriminative among the 27 players who completed level 9.Isolating these 27 players to look at their level 1 performance (see Level 1 - best (27) of Table 6) shows that this decide-move-placedcomponent continues to discriminate among these 27 even when that time pressure is removed. We also see that, of the threecomponents, only the “decide-move-placed” component remains invariant across skill levels for our very best players. Implications ofthese findings are discussed in the general discussion section below.
6. Field study: validating the PCA model
Typically to validate our statistical models of player expertise we would employ methods such as leave one out (LOO) cross-validation or splitting the data into training and test sets. While such paths of analysis are well traveled and more than adequate, weare in a unique position to perform a more unusual method of model validation which increases the external validity (Gray &Salzman, 1998, p. 217) [see also, (Cook & Campbell, 1979)] of our PCA model by generalizing our conclusions across persons,settings, and times; namely, (a) to a new dataset of players (persons), (b) who were playing in the “qualifying rounds” of a tour-nament and not “laboratory” conditions (places), and (c) in some cases, were playing years before or after our laboratory datacollection (times).
Fig. 11. Illustration of data collected for tournament player 18 in the 2014 tournament, similar to Laboratory player 3117 presented earlier. Thehighlighted game score represents the player’s qualifying round high score (QHS). Dimmed game levels were incomplete and omitted from analysis.The shaded purple region indicates the small slice of behavioral data used by the level 1 Principal Component Regression model to estimate playerskill.
3
4
5
6
7
3 4 5 6
PCR skill estimate (criterion)
high
est q
ualif
ying
sco
re (s
ixth
root
)
Fig. 12. Principal component regression. R2 = 0.525. Correlation between qualifying round high score and principal component regression (PCR)skill estimates based on level 1 player data during those games of the qualifying round.
J.K. Lindstedt, W.D. Gray Cognitive Psychology 109 (2019) 1–25
17

6.1. Tournament procedure
We hosted Tetris tournaments using our Meta-T software (Lindstedt & Gray, 2015) at Rensselaer Polytechnic Institute’s annualstudent-run, Genericon conventions from 2014 to 2017. Genericon’s attendees consist of a mix of RPI students, local area residents,and some super-fans who fly in from longer distances. Entrance into each Tetris tournament was free, such that even low-skill playerscould be encouraged to participate and contribute (after all, “it’s for science!”). To attract skilled players, we awarded cash prizes of$300, $200, and $150 for 1st, 2nd, and 3rd place winners respectively. (Data collection was approved by the Rensselaer IRB in aproposal written specifically for the tournaments.)
Each tournament consisted of a qualifying round and a single elimination tournament. Across the four years of tournaments, 124hopeful players competed in our qualifying rounds with those 8 who scored the highest in one of their two qualifying round gamesgoing on to compete in that year’s tournament.
During the qualifying round, all contestants played two games, using the same two random seeds. This meant that the order inwhich the sequence of zoids appeared in each qualifying game was fixed such that all players would experience the same two zoidlists, though the order in which the two games were played was randomly selected.
As each year’s tournament consisted of only 8 players, we do not have enough tournament data to conduct a statistically powerfulanalysis of the tournaments proper.12 However, the 124 hopeful players who completed the two qualifying round trials did provide uswith enough data to validate our laboratory results.
6.2. Qualifying round data selection
In common with the laboratory analyses reported above, we excluded the final incomplete level of each player’s game and thenextracted level 1 data from each tournament entrant’s two qualifying round games. Then all three component scores were computed,and all values were averaged per player such that each player was represented by one three-dimensional behavioral data point for thepurposes of estimating their expertise using our level 1 PCR model from the laboratory study. Fig. 11 illustrates the available data fora sample tournament entrant.
6.3. Qualifying round estimates of expertise
During the qualifying round, each contestant played two complete games. Hence, we cannot compute the same, “mean of thehighest four games”, criterion score as with the laboratory data. Instead, we estimate player expertise by the same ruler used todetermine their inclusion in the tournament: the highest qualifying score (HQS). We then apply the sixth-root transformation used inthe criterion score used for the laboratory study.
6.3.1. Qualifying round results: PCR skill estimate predicting qualifying round scoresWe predicted each player’s individual expertise level (criterion score) based only on their level-1 behavioral components, which
we will refer to as a player’s PCR skill estimate. We then ran a simple linear regression examining whether the PCR skill estimatescorrelated with the players’ HQS. The resulting model had an adjusted R2 of 0.525 ( = <F p(1, 122) 136.8, 0.0001), showing a re-lationship between the laboratory model’s skill estimates and players’ game performance during the qualifying round. Fig. 12 il-lustrates this relationship. This finding compares well to our in laboratory test reported above which found an adjusted R2 of 0.652.
6.4. Tournament prediction discussion
The PCR model did well in predicting qualifying round performance (adjusted R2 of 0.525), only somewhat less than on thelaboratory data on which it was trained (adjusted R2 of 0.648). Notably, this successful prediction involves (a) a new dataset of players(persons), (b) who were playing under “tournament” not “laboratory” conditions (places), and (c) in some cases, were playing yearsbefore or after our laboratory data collection (times). These successful predictions increase the effect construct validity of ourfindings. The model’s success is especially exciting as these predictions are based only on data collected during a short section of earlygameplay (level 1 alone), long before it is clear what the final scores for those games will be – our model can “watch” only a handfulof episodes and make reasonable estimates about that player’s success in a tournament setting.
7. Summary & conclusions
Our work has focused on “taking one task” – a faithful re-creation of the 1985 NES Tetris – and “doing it all” – examining aplethora of measures of the task, both in and outside the laboratory, to try to find telling trends. While we do not believe that we havedone all of it, we do believe that this work, together with our recent (Sibert et al., 2017; Sibert & Gray, 2018) and planned work ismaking progress in that direction. The outcome of the current work can be summarized as six findings.
12 We did attempt some “prognostication”, attempting to see if our model could predict the winners of tournament matches just from “watching”players’ level 1 qualifying round performance, but the low N across many years of tournaments made this an underpowered endeavor, perhaps to berevisited in the future.
J.K. Lindstedt, W.D. Gray Cognitive Psychology 109 (2019) 1–25
18
First, under low time pressure, our three behavioral components capture some of the elements of expertise which distinguishplayer expertise across a wide spectrum of skill.
Second, when the pressure is on (at level 9), players with the highest expertise can only be distinguished by the “decide-move-placed” component (see Fig. 9).
Third, under low time pressure (level 1), when the stakes are low, our 27 “best of the best” players can be distinguished from eachother by behaviors of the “decide-move-placed” and the “4-line planning” components.
Fourth, the best players show “decide-move-placed” scores on par with their best performance even at lower levels, while thesame score for other players starts low and increases to keep pace with the game’s increasing difficulty.
Fifth, all players, even the very best, show decreasing “4-line planning” behavior as the game’s time pressure increases. AsAppendix B shows, the 4-line planning component reflects board structures and is not a simple count of lines cleared. The best playersstay high on the 4-line planning component at a higher rate, and for longer periods as task demands increase, but eventually everyoneabandons this high-risk, high-reward strategy in favor of behaviors more sustainable under the increased task demands.
Finally, our predictions are validated outside the laboratory in a field study, doing almost as well at predicting skill on fewer dataper subject, with less time, and under more uncontrolled conditions.
7.1. Interpretations
The three components reflect different scopes. We interpret the “decide-move-placed” component as our strongest measure ofimmediate cognition; namely, the interactions of cognition, perception, and action required by dynamic decision-making. Thiscomponent captures elements of both fast and accurate decision-making, and it seems to reveal a player’s level of skill across the fullspectrum of expertise represented in our data set, as well as across the full breadth of the game’s increasing levels of time pressure.
In contrast, the focus of “4-line planning” seems less on immediate behavior and more on the nature of the board structures beingbuild. This component provides an element of higher-order cognition which guides the “on board” structure as it is being built,maintained, and repaired. However, the parts of these subtasks – that is, the steps required to build, maintain, and repair under Tetristime pressure – are the domain of the decide-move-placed component.
In contrast to the above two components, we read “disarray” more as a snapshot of the state of a building construction site; albeit,one in which as soon as the successful structures are built, parts of them vanish or collapse, and the process must start again. To alarge degree, the other two components work together to control or eliminate the level of disarray that results from the randomselection of zoids.
The picture painted by the nature and interactions of these three components presents Tetris as a dynamic, decision-making task,entailing situation assessment (the disarray component), planning (the 4-Line planning component), and dynamic decision-makingand action (the decide-move-placed component). Together and separately each component is mediated by the player’s skill andknowledge.
7.2. What’s the hurry?
It is somewhat curious to see our very best players exhibiting their “fast and accurate” behaviors even under the minimal temporaldemands of level 0 or 1 – after all, at low levels there is no cost to taking time to do things slowly and carefully. It seems that bysetting their pace during low game levels to the breakneck speeds required by high game levels that players are taking needless risks!Are they?
In studies of StarCraft13 players, Huang, Yan, Cheung, Nagapan, and Zimmermann (2017) suggest that there is a perceived valuein “staying warm”; that is, players will press control sequences at a rapid rate that adds little or nothing at the beginning of the game,but which become critical for the high pressure, rapid action situations later in the game. Are our best Tetris players simply stayingwarm? Perhaps so, but we suspect there is more to the puzzle: it is possible these players simply cannot go slow. As discussed inSection 2.2, Beilock et al. (2004, p. 379) show that “haste does not always make waste”, as the best golfers perform far worse whenthey slow down to focus explicitly on sub-components of the task, then when they are distracted or performing at speed. As in Wulfand Prinz (2001), Beilock and colleagues’ findings suggest that slowing down to examine these well-established routines disruptstheir execution.
In the case of Tetris, at least some of this speedup must be due to the increasing automation of event structures, driven primarilyby the same simple practice effects as were observed by Shiffrin and Schneider (Schneider & Shiffrin, 1977; Shiffrin & Schneider,1977) over spans of 10 or so hours. By this view, rapid performance is simply a consequence of dozens if not hundreds of hours ofpractice; hence, players are not intentionally working fast; rather, “working fast” has become their new normal. Alternatively, itmight be the case that the players who do become Tetris experts have deliberately practiced being fast at low levels so as to achievethe speed needed at high levels of play. Champion Tetris players report practicing 5 or more hours per week and many report havingdone so for decades.14 It may be that through long hours over long time periods of either simple or deliberate practice (Ericsson,Krampe, & Tesch-Römer, 1993) players become faster; hence, at early levels of play working fast is their new normal.
13 Readers unfamiliar with StarCraft may want to read the Wikipedia entry at https://en.wikipedia.org/w/index.php?title=StarCraft_(video_game)&oldid=866607050.
14 Based on unpublished data collected during interviews with players at the 2016, 2017, and 2018 Classic Tetris World Championships.
J.K. Lindstedt, W.D. Gray Cognitive Psychology 109 (2019) 1–25
19

7.3. Balancing Newell’s challenge
We have taken up Newell’s (1973) challenge– to “take one task and do all of it”, as well as address Wulf and Shea’s (2002)complaints regarding the need to examine cognition in complex tasks, beyond the simplicity of most laboratory studies. To achievethis, however, we have sacrificed something intrinsic to most of cognitive psychology research: experimental control. Just as thelaboratory differs greatly from the wilderness of the outside world, so too does a complex task such as Tetris differ from streamlinedlaboratory experiments designed to tease apart the inner workings of cognitive mechanisms.
For Tetris, even in expert competitions, in which two players battle each other by playing the same random seed at the same time,the decisions made by each player are very different and the board configurations they build are very different. Likewise, acrossgames the random selection of zoids (with replacement) almost guarantees that the sequence of zoids will never be one that a givenplayer has seen before. When these factors are considered along with the individual variability between players and the noiseinherent to the performance of a complex, dynamic task, we are pleased to have captured 65% of variance in the lab (with our level 1laboratory model) and 53% of the variance in the field study.
Our work has benefited from the fact that Tetris is a task that, although somewhat rough in its distribution of data, still inherentlyprovides a quasi-experimental task environment. Indeed, this property of many games has led us to argue for “Game-XP”; that is,games as experimental paradigms (Gray, 2017), the view that action games may be used as vehicles to advance the study of humancognition. By this view, games provide experimental psychologists with a motivated workforce which may either be experiencedalready in the task or may be induced to perform the task in the laboratory for longer than one hour. In either case, there areconsiderable advantages to the field from studying the behavior of people who are skilled as opposed to unskilled in our laboratorytasks. We hasten to add that we see this research direction not as a replacement to carefully focused laboratory experimentation, butas complementary in the pursuit of understanding how our basic cognitive mechanisms coordinate and interact to explain thecomplexity of behavior beyond the laboratory.
7.4. Above novices and beyond Tetris
The present work focuses on a subset of players with a limited range of skill, and only in the singular domain of Tetris. We thinkthis approach is promising beyond both of those limitations.
7.4.1. Looking to higher skillWe know that greater skill exists in the version of Tetris examined here. The Classic Tetris World Championship (CTWC) is a
growing annual competition that attracts players from across the world to compete in the Nintendo Entertainment System (NES)version of Tetris. The competitors in this event demonstrate extremely fast and accurate gameplay, reach difficulty levels far beyondthat of the players in our studies, and enjoy discussing maneuvers and nuances of the task that emerge only at the very fastest speeds.Essentially, these champions begin where our players stop – they often begin their games at difficulty level 18, while our playersseldom reach level 16 (see Table 5). We anticipate future studies which will focus on our collaboration with this group and ourfindings about their extreme expertise in our chosen domain.
7.4.2. Beyond TetrisWe believe this work sets the stage for examining expertise in other manageably complex tasks, both in and outside the la-
boratory. Ultimately, our principal component regression approach requires only that a task can be broken into a meaningful eventstructure, that its behavioral dynamics can be measured in multiple dimensions, and that skill is reasonably quantifiable. Mostcomplex tasks have enough constituent moving parts to lend themselves well to these requirements, and the results of the currentstudy have convinced us that principal component regressions are a powerful lens through which to examine complex, dynamicbehavior.
7.5. Conclusions
We examined how expertise manifests in Tetris. A principle component analysis of 39 task features yielded three componentswhich differed across levels of player skill for both the rigorous setting of the laboratory and for the “wilderness” of locally held Tetristournaments. These three components represent elements of Tetris expertise.
The disarray component represents the natural disarray of the task that all players face but which the very worst players finddifficult to contend. The 4-line planning component captures the board structures required for the high-risk, high-reward “Tetris”maneuver, for which the game is named. Our analyses show that the ability to build and maintain the needed structures varies greatlywith player skill, but all players eventually abandon it as the task demands increase. The decide-move-placed component captures theplayers’ interactive skill within the task – both by hand and by eye – the ability of the best players to rapidly process the environment,
J.K. Lindstedt, W.D. Gray Cognitive Psychology 109 (2019) 1–25
20

select good moves, and execute them quickly and efficiently. Our plots (see Fig. 8, right) show that average players, increasing engagein these activities as task demands increase. Interesting, the plots also show that the very best players engage in these activities asmuch at level 0 as they do at level 16 – apparently, once mastered these skills are never disengaged.
Together, these components highlight the different challenges – and, to an extent, the very different games – that players ofdifferent skill levels face in the game of Tetris, and the gradual coordination of players’ inherent cognitive abilities with their growingunderstanding of task dynamics as their skills evolve from novice to expert.
Author contributions
This work is based on Lindstedt’s doctoral thesis. For this paper, Lindstedt and Gray wrote the manuscript, Lindstedt did themodeling and data analyses, Gray and Lindstedt discussed the results and elaborated the theoretical implications of the results.Correspondence should be sent to John K. Lindstedt, Department of Psychological Sciences, Rice University, Houston, TX 77251.Email: [email protected]. The work was supported, in part, by grant N00014-16-1-2796 to Wayne Gray from theOffice of Naval Research, Dr. Ray Perez, Project Officer.
Appendix A. Behavioral features of Tetris
Many of these features appear at first to be tediously similar, but work in the AI community (Thiery & Scherrer, 2009a) has shownthat some subtle variations between these different features can be critical to survival for artificial agents; thus, we have included asmany of these features in the analysis as was feasible.
A.1. Motor-related features
These features are related to the execution of motor actions, including keypresses, actions performed, latencies, and efficiency ofthe zoid’s path.
Actions: keypresses made by the player.
rots - Rotations. The number of zoid-rotations performed in an episode.trans - Translations. The number of times the zoid was moved left or right– translated– in an episode.prop_u_drops - Proportion of user drops. The proportion of top-to-bottom movement that was intentionally dropped by the playerin an episode. 1 indicates the player dropped the zoid the full length of the screen, and 0 indicates they never dropped it at all.
Path efficiency: comparing the keypresses used to the minimum necessary to complete the episode.
min_rots_diff - Minimum rotations difference. The difference between the number of rotations used and the number needed toachieve the zoid’s final position. Lower values are more efficient.min_trans_diff - Minimum translations difference. The difference between the number of translations used and the numberneeded to achieve the zoid’s final position. Lower values are more efficient.
Latencies: reaction and response times at various points in an episode.
initial_lat - Initial latency. Time elapsed in milliseconds from the start of the episode until the first keypress.drop_lat - Drop latency. Time elapsed in milliseconds from the start of the episode until the player first drops the zoid.avg_lat - Average latency. The mean time between all keypresses in an episode.resp_lat - Response latency. The time from the start of the episode in milliseconds until either the zoid is first dropped or the zoid islocked into its final position. This is a more clear measure of actual response time than drop_lat, as it accounts for episodes inwhich the zoid was never dropped.
Task-structure features. These features are related to the structural information in the task environment available for the playerto reason over and, in turn, those that result from the player’s gameplay decisions and mistakes.
Column heights: measures of the heights of each column of the game board.
mean_ht, max_ht, min_ht - Mean, Maximum, and Minimum height. The mean, maximum, and minimum height among all 10columns in the pile. Note that only maximum height needs to exceed 20 to result in a game over.cd_1 - cd_9 - Column difference (0,1)–(8,9). 9 features representing the difference in height between each successive pair of
J.K. Lindstedt, W.D. Gray Cognitive Psychology 109 (2019) 1–25
21

columns. Positive values imply a raise in height from left to right, while negative implies the opposite.max_diffs - Maximum difference. Maximum difference in heights among cd_1 through cd_9.
Pits: the unworkable covered holes that prevent line-clears.
pits - Pits. The number of empty cells in the pile that are covered from above. As a player must fill an entire row to clear it, pitsmust have the cells above them cleared before their row can be cleared.pit_depth - Pit depth. The sum of all pits weighted by the number of filled cells above them in a column. This score gives moreweight to pits buried deeper in the pile.pit_rows - Pit rows. The number of rows containing pits. This measure considers any number of pits in one row to be equivalent,as clearing everything above such a row would uncover all of its pits simultaneously.lumped_pits - Lumped pits. A measure of pits considering all adjacent groups of pits to be identical. Thus four isolated pits in thepile would have more weight than one 2 × 2 cluster of pits.
Wells: the low-height columns surrounded by higher columns on either side which are relevant for fitting certain zoid shapes.
wells - Wells. The number of empty, uncovered cells with a filled cell on either side. The deeper a well is, the harder it is to workwith. Yet deep wells are also associated with the highest scoring 4-line-clear Tetris maneuver.deep_wells - Deep wells. The number of consecutive well segments of depth 3 or more. These are unique in the game in that theycan only be filled by an I-zoid without creating one or more pits.cuml_wells - Cumulative wells. Similar to wells, but weighing each segment of the well heavier as it goes deeper. A well of depth1 evaluates as 1 (1); a well of depth 2 evaluates to 3 (2 + 1); a well of depth 3 evaluates to 6 (3 + 2 + 1); and so on.max_well - Maximum well. The depth of the deepest well.
Pile orderliness: measures of the overall “randomness” or “order” of the pile.
jaggedness - Jaggedness. The perimeter of the top of the pile. A lower value implies a flatter pile, while a higher value implies amore craggy surface.col_trans, row_trans - Column and row transitions. The number of times a cell changes from open to closed along either columnsor rows. This generally measures the “randomness” of the pile; a tall pile with no pits would rate low, as would a completelyempty board, whereas a checkerboard pattern or completely random pile (i.e., riddled with pits and overhangs) would rate high.pattern_div - Pattern diversity. This measure compares the pattern of empty and filled cells in each column, and the same for eachrow. Lower scores implies similar patterns across the pile, whereas a higher score implies more variability in the patterns created.weighted_cells - Weighted cells. A count of the total number of filled cells in all columns, each weighted by its own height. Thesame number of total cells filled arranged flatly would rate lower than a those same cells stacked entirely along one wall, as morecells would be weighted higher due to their height.
Zoid-placement: local measures of the current zoid’s position at the end of the episode.
landing_height - Landing height. The height of the bottom of the zoid’s final position.matches - Matches. The number of edges of the zoid (in its final position) that border a filled cell. A low number impliesprecarious positioning of the zoid, whereas a higher number implies a zoid fitting more “snugly” into the surrounding pile.d_max_ht - Delta maximum height. The change in the max_height score after placing the zoid and clearing any filled lines. Anegative value implies line clears, while a zero-value implies the zoid was not placed at the top, and positive values imply the zoidpushed the top of the pile higher (and closer to failure).d_pits - Delta pits. The change in the pits score after placing the zoid and clearing any filled lines. Negative values imply lines werecleared and pits were successfully opened up, while positive values imply the zoid placement created one or more new pits.
Appendix B. Principal component loadings
See Table B1.
J.K. Lindstedt, W.D. Gray Cognitive Psychology 109 (2019) 1–25
22

Appendix C. Exploratory factor analysis loadings
Table C1 makes explicit the factor loadings produced by an alternative analysis to the PCA reported in the paper, an exploratoryfactor analysis. Though some weights are different, many of the factors found either bear a striking resemblance to those found in thePCA or are so subtle and esoteric that they defy description. For simplicity’s sake (in an already very complex analysis) we decided toerr on the side of the straightforward and report the PCA results (see Table C1).
Table B1Feature loadings from the principal component analysis. 5 features are omitted (cd_2–cd_8) as they did not contribute to any of theselected components.
Component 1 2 3Label disarray 4-line planning decide-move-placed
% variance 25.6% 14.0% 9.6%Features
rots −0.348trans −0.275
prop_u_drops −0.105 0.314
min_rots_diff −0.350min_trans_diff −0.306
initial_lat −0.180drop_lat −0.390avg_lat −0.193resp_lat −0.452
mean_ht 0.305min_ht 0.255 −0.218max_ht 0.290
cd_1 0.192cd_9 −0.201
max_diffs 0.260
pits 0.272 −0.177pit_depth 0.273 −0.150pit_rows 0.278 −0.173
lumped_pits 0.265 −0.180
wells 0.119 0.373deep_wells 0.115 0.372cuml_wells 0.107 0.365
max_well 0.112 0.367
jaggedness 0.113 0.309col_trans 0.273 −0.161
row_trans 0.291pattern_div 0.199
weighted_cells 0.295
landing_height 0.285matches 0.137
d_max_ht −0.133d_pits
Table C1Loadings of each feature on the twelve factors produced by an exploratory factor analysis (EFA) of the same data set used in the PCA presented in thearticle.
Factor 1 2 3 4 5 6 7 8 9 10 11 12% variance 23.8% 13.5% 5.5% 5.3% 4.6% 3.7% 3.1% 1.6% 1.4% 1.0% 0.8% 0.7%Features
rots 0.955 0.109 0.116trans 0.106 0.901prop_u_drops −0.277 −0.242 −0.468 −0.193 −0.257
min_rots_diff 0.947 0.105 0.110min_trans_diff 0.145 0.875 0.120
(continued on next page)
J.K. Lindstedt, W.D. Gray Cognitive Psychology 109 (2019) 1–25
23

References
Abernethy, B., Farrow, D., & Mann, D. L. (2018). Superior anticipation. In K. A. Ericsson, R. R. Hoffman, A. Kozbelt, & A. M. Williams (Eds.). The Cambridge handbook ofexpertise and expert performance (pp. 677–695). (2nd ed.). Cambridge University Press.
Anzai, Y., & Simon, H. A. (1979). Theory of learning by doing. Psychological Review, 86(2), 124–140. https://doi.org/10.1037//0033-295X.86.2.124.Beilock, S. L., Bertenthal, B. I., McCoy, A. M., & Carr, T. H. (2004). Haste does not always make waste: Expertise, direction of attention, and speed versus accuracy in
performing sensorimotor skills. Psychonomic Bulletin & Review, 11(2), 373–379. https://doi.org/10.3758/BF03196585.Beilock, S. L., Bertenthal, B. I., Hoerger, M., & Carr, T. H. (2008). When does haste make waste? Speed-accuracy tradeoff, skill level, and the tools of the trade. Journal
of Experimental Psychology-Applied, 14(4), 340–352. https://doi.org/10.1037/a0012859.Chase, W. G., & Simon, H. A. (1973a). Perception in chess. Cognitive Psychology, 4(1), 55–81. https://doi.org/10.1016/0010-0285(73)90004-2.Chase, W. G., & Simon, H. A. (1973b). The mind’s eye in chess. In W. G. Chase (Ed.). Visual information processing (pp. 215–281). New York: Academic Press.Cook, T. D., & Campbell, D. T. (1979). Quasi-experimentation: Design and analysis issues for field settings. Chicago: Rand McNally.Ericsson, K. A., Krampe, R. T., & Tesch-Römer, C. (1993). The role of deliberate practice in the acquisition of expert performance. Psychological Review, 100(3),
363–406.Fahey, C. P. (2015). Tetris AI [Online]. Accessed 2015-Jan-30.Gabillon, V., Ghavamzadeh, M., & Scherrer, B. (2013). Approximate dynamic programming finally performs well in the game of Tetris. Advances in neural information
processing systems: Vol. 26, (pp. 1754–1762).Gray, R. (2004). Attending to the execution of a complex sensorimotor skill: Expertise differences, choking, and slumps. Journal of Experimental Psychology: Applied,
10(1), 42–54.Gray, W. D. (2017). Games-XP: Action games as cognitive science paradigm. Topics in Cognitive Science, 9(2), 289–307. https://doi.org/10.1111/tops.12260.Gray, W. D., & Salzman, M. C. (1998). Damaged merchandise? A review of experiments that compare usability evaluation methods. Human-Computer Interaction, 13(3),
203–261. https://doi.org/10.1207/s15327051hci1303_2.Holmes, E. A., James, E. L., Coode-Bate, T., & Deeprose, C. (2009). Can playing the computer game “Tetris” reduce the build-up of flashbacks for Trauma? A proposal
from cognitive science. PLoS ONE, 4(1), e4153. https://doi.org/10.1371/journal.pone.0004153.Huang, J., Yan, E., Cheung, G., Nagapan, N., & Zimmermann, T. (2017). Master maker: Understanding gaming skill through practice and habit from gameplay
behavior. Topics in Cognitive Science, 9(2), 437–466. https://doi.org/10.1111/tops.12251.Janssen, C. P., & Gray, W. D. (2012). When, what, and how much to reward in reinforcement learning based models of cognition. Cognitive Science, 36(2), 333–358.
Table C1 (continued)
Factor 1 2 3 4 5 6 7 8 9 10 11 12% variance 23.8% 13.5% 5.5% 5.3% 4.6% 3.7% 3.1% 1.6% 1.4% 1.0% 0.8% 0.7%Features
initial_lat 0.504 0.114drop_lat 0.312 0.643 0.241avg_lat −0.171 0.710 0.104resp_lat 0.354 0.771 0.271 0.115
mean_ht 0.901 0.267 0.116 −0.207 0.139 0.136 0.103min_ht 0.933 −0.169 −0.148 0.103max_ht 0.793 0.296 0.164 0.351 −0.237 0.102 0.108cd_1 0.534 −0.165 0.374 0.309 0.136cd_2 0.138cd_7 −0.174cd_8 0.146cd_9 −0.561 0.162 0.374 0.380max_diffs 0.486 0.605 0.274 0.292
pits 0.966 −0.108pit_depth 0.942 −0.186 −0.107pit_rows 0.971lumped_pits 0.944 −0.267
wells 0.949 0.114 0.121 −0.203deep_wells 0.946 0.130 −0.116cuml_wells 0.939 0.112max_well 0.953 0.119
jaggedness 0.574 0.722 0.108 0.137 0.121 −0.287col_trans 0.945 −0.311row_trans 0.806 0.304 0.416 0.106 −0.203pattern_div 0.520 0.170 0.281 0.466 −0.104 −0.184weighted_cells 0.868 0.277 −0.262 0.197 0.172
landing_height 0.803 0.269 0.117 0.245 −0.222 0.161 0.146matches −0.127 −0.155 −0.734d_max_ht 0.105 0.628d_pits 0.105 0.203
J.K. Lindstedt, W.D. Gray Cognitive Psychology 109 (2019) 1–25
24

https://doi.org/10.1111/j.1551-6709.2011.01222.x.Landy, D. (2018). Perception in expertise. In K. A. Ericsson, R. R. Hoffman, A. Kozbelt, & A. M. Williams (Eds.). The Cambridge handbook of expertise and expert
performance (pp. 151–164). (2nd ed.). Cambridge Handbooks in Psychology. Cambridge University Press. https://doi.org/10.1017/9781316480748.010.Lec, S. J. (1962). Unfrisierte Gedanken (Unkempt thoughts) (J.G. (translator), Ed.)New York: St. Martin’s Press.Lindstedt, J. K., & Gray, W. D. (2015). Meta-T: Tetris as an experimental paradigm for cognitive skills research. Behavior Research Methods, 25. https://doi.org/10.
3758/s13428-014-0547-y.Linn, M. C., & Petersen, A. C. (1985). Emergence and characterization of sex differences in spatial ability: A meta-analysis. Child Development, 56(6), 1479–1498.
https://doi.org/10.1111/j.1467-8624.1985.tb00213.x.Martin-Gutierrez, J., Luis Saorin, J., Martin-Dorta, N., & Contero, M. (2009). Do video games improve spatial abilities of engineering students? International Journal of
Engineering Education, 25(6,SI), 1194–1204.Minitab (2017). What is a scree plot? [Online]. Accessed 2017-Jan-30.Newell, A. (1973). You can’t play 20 questions with nature and win: Projective comments on the papers of this symposium. In W. G. Chase (Ed.). Visual information
processing (pp. 283–308). New York: Academic Press.Okagaki, L., & Frensch, P. A. (1994). Effects of video game playing on measures of spatial performance: Gender effects in late adolescence. Journal of Applied
Developmental Psychology, 15(1), 33–58.Schneider, W., & Shiffrin, R. M. (1977). Controlled and automatic human information-processing. 1. Detection, search, and attention. Psychological Review, 84(1), 1–66.
https://doi.org/10.1037//0033-295X.92.3.424.Shiffrin, R. M., & Schneider, W. (1977). Controlled and automatic human information-processing. 2. Perceptual learning, automatic attending, and a general theory.
Psychological Review, 84(2), 127–190. https://doi.org/10.1037/0033-295X.91.2.269.Shinar, D., Meir, M., & Ben-Shoham, I. (1998). How automatic is manual gear shifting? Human Factors, 40(4), 647–654.Sibert, C., & Gray, W. D. (2018). The Tortoise and the Hare: Understanding the influence of sequence length and variability on decision making in skilled performance.
Computational Brain & Behavior, 1–13. https://doi.org/10.1007/s42113-018-0014-4.Sibert, C., Gray, W. D., & Lindstedt, J. K. (2017). Interrogating feature learning models to discover insights into the development of human expertise in a real-time,
dynamic decision-making task. Topics in Cognitive Science, 9, 1–21. https://doi.org/10.1111/tops.12225.Simon, H. A. (1975). The functional equivalence of problem solving skills. Cognitive Psychology, 7(2), 268–288.Sims, V. K., & Mayer, R. E. (2002). Domain specificity of spatial expertise: The case of video game players. Applied Cognitive Psychology, 16(1), 97–115.Şimşek, Ö., Algorta, S., & Kothiyal, A. (2016). Why most decisions are easy in Tetris—And perhaps in other sequential decision problems, as well. Proceedings of the
33rd international conference on machine learning (pp. 1757–1765). JMLR.Stuart, K. (2010). Tetris and Snake - The biggest games in the world. The Guardian.Szita, I., & Lorincz, A. (2006). Learning Tetris using the noisy cross-entropy method. Neural Computation, 18(12), 2936–2941.Terlecki, M. S., Newcombe, N. S., & Little, M. (2008). Durable and generalized effects of spatial experience on mental rotation: Gender differences in growth patterns.
Applied Cognitive Psychology, 22(7), 996–1013.Thiery, C., & Scherrer, B. (2009a). Building controllers for Tetris. ICGA Journal, 32, 3–11.Thiery, C., & Scherrer, B. (2009b). Improvements on learning Tetris with Cross-Entropy. ICGA Journal, 32(1), 23–33.Wikipedia (2016). Classic Tetris World Championship – Wikipedia, The Free Encyclopedia [Online]. Accessed 30-January-2017.Witt, J. K. (2018). Perception and action. Stevens’ handbook of experimental psychology and cognitive neuroscience (pp. 489–523). Wiley Online Library. https://doi.org/
10.1002/9781119170174.epcn211.Wulf, G., & Prinz, W. (2001). Directing attention to movement effects enhances learning: A review. Psychonomic Bulletin & Review, 8(4), 648–660. https://doi.org/10.
3758/BF03196201.Wulf, G., & Shea, C. H. (2002). Principles derived from the study of simple skills do not generalize to complex skill learning. Psychonomic Bulletin & Review, 9(2),
185–211. https://doi.org/10.3758/BF03196276.Zacks, J. M., Speer, N. K., Swallow, K. M., Braver, T. S., & Reynolds, J. R. (2007). Event perception: A mind-brain perspective. Psychological Bulletin, 133(2), 273–293.Zacks, J. M., & Swallow, K. M. (2007). Event segmentation. Current Directions in Psychological Science, 16(2), 80–84. https://doi.org/10.1111/j.1467-8721.2007.
00480.x.
J.K. Lindstedt, W.D. Gray Cognitive Psychology 109 (2019) 1–25
25