Embed Size (px)
Citation preview

Distributed Adaptive Data Collection Protocol forImproving Lifetime in Periodic Sensor Networks
Ali Kadhum Idrees, Member, IAENG, and Ali Kadhum M. Al-Qurabat
Abstract—Periodic Sensor Networks (PSNs) represent oneof the essential elements of emerging Cyber-Physical System(CPS) designs because of their using in multiple applications.PSNs are one of the major contributors of the big data in thefuture. One fundamental challenge in PSNs is to periodicallycollect the large volume of data in an energy efficient way andthen transmit them to the sink so as to enhance the networklifetime. Since sensor batteries have a limited lifetime, therefore,adaptive sampling method to periodic data collection is requiredto support energy-efficient data gathering and fusion of CPS. Inthis research, we suggest a protocol, called Distributed AdaptiveDAta Collection protocol (DADAC), which collects periodicallysensor readings and prolong the lifetime of a Periodic SensorNetwork (PSN). The lifetime of DADAC protocol is dividedinto cycles. Each cycle is composed of four stages. First, datacollection. Second, dimensionality reduction using Piecewise Ag-gregate Approximation (PAA) technique to reduce the amountof data collected by each sensor. Third, Frequency Reductionusing SAX (Symbolic Aggregate approXimation) approach inorder to remove the redundant data before send them tosink. Fourth, sampling rate adaptation based PAA similarityto acclimate its rate of sampling according to the dynamicmodification of the monitored environment. DADAC allows eachsensor to remove the redundant collected data and adapts itssampling rate in accordance with the monitored environmentconditions.
We conduct extensive simulation experiments on real sensordata by applying OMNeT++ network simulator to explain theeffectiveness of the DADAC protocol in comparison with twoother existing methods.
Index Terms—Periodic Sensor Networks, Data Collection,Adaptive Sampling Rate, PAA similarity & SAX, NetworkLifetime.
I. INTRODUCTION
In the last years, the Cyber-Physical System (CPS) hasappeared as an important trend to enhance the interac-tions between virtual and physical worlds[1]. CPS combinesbetween physical devices such as sensors with the cyberelements (i.e., informational) to form an intelligent systemdeals with dynamic changes of the physical environment.In many proposed studies, Wireless Sensor Network (WSN)is considered as a primary component of cyber physicalsystems. CPS is a combination between both cyber resourcesand WSN. WSN represents an important factor in people’slife, because of their widespread use in many applicationssuch as agricultural, healthcare, transportation, environment,industry, and military [2], [3], [4], [5]. WSN is composedof a large number of low-cost tiny sensors that deployed formonitoring physical phenomena of a specific region of inter-est such as temperature, sound, vibration, pressure, or motion
Manuscript received 19 Jun 2017 ; revised 22 Jul 2017. This work wassupported in part by the University of Babylon, Iraq.
Ali Kadhum Idrees is with the Department of Computer Science, Univer-sity of Babylon, Iraq. e-mail: [email protected].
Ali Kadhum M. Al-Qurabat is with the Department of Software, Univer-sity of Babylon, Iraq. e-mail: [email protected].
[3]. Sensor node can sense, process, and communicate withlimited capabilities in battery power, storage, computation,and bandwidth [4], [6], [7]. They collect the sensed data fromthe monitored environment, manipulate the data locally, andtransmit them to the sink for further analysis [8].
One of the most critical constraints of the sensor node isthe battery life. Due to the environment or cost restrictions,it is difficult or impossible to change or recharge the sensorbatteries. Thus, the sensor nodes are deployed with highdensity in order to enhance the network lifetime. In sensornode, the radio unit represents the principal source of energyconsumption. Therefore, it is important to remove redundantsensed data before reporting them to the sink to save theenergy and improve the lifetime of sensor node [9], [10],[11]. It is necessary to take into consideration data capturing,communication, and routing problems in order to designenergy-saving protocol for PSN. Data collection approachesdetermine the way of sensor’s work in data collection andsending to the base station. Therefore, data collection rep-resents the crucial function in PSNs [12]. The CPS gatherssensor readings from physical environment and joins themto different information sources for real-time analysis[13].
There are two models for data collection in WSNs: time-driven and event-driven [12]. This work considers time-driven data collection which is named Periodic Sensor Net-works (PSNs). In PSN, every sensor node transmits thesensed data of the monitored area to the sink periodically.Several PSNs applications use the periodic way to monitorcertain conditions regularly such as pressure, humidity, tem-perature, etc. Two main challenges in PSN. First, PSN hasto provide adequate lifetime in order to satisfy application’sneeds. Second, data management is more difficult due tothe huge amount of collected data by this network. Manyproposed works consider reducing the amount of data duringthe collection and communication without considering theaccuracy of data. Data reduction aims to prolong the networklifetime and facilitate data analysis and decision making. InPSN, the change in the monitored environment can slowdown or speed up. The energy consumption can be decreasedwhen the sensor node modifies its sampling rate based on thedynamic modification of the monitored phenomena. There-fore, to prolong the network lifetime, adaptive sampling forperiodic data collection is required for energy optimizationand data reduction [14], [15].
This paper introduces the following contributions.i) A protocol named DADAC is devised to collect the
sensor data in an adaptive way such that the volumeof data is reduced while PSN lifetime is enhanced.The principal idea of DADAC protocol is to utilize thesimilarity of collected data and adapts its sampling rateaccordingly. DADAC works into cycles. Four stages ineach cycle: data collection, dimensionality reduction,

frequency reduction using SAX technique, and samplingrate adaptation using PAA similarity. The sensor nodeprovides a new sampling rate after each cycle based onthe similarity between the periods of one cycle.
ii) A new adaptive sampling rate algorithm based PAA sim-ilarity is suggested. In each cycle, the speed of readingscapturing inside the sensor node depends mainly on thepreviously calculated sampling rate adaptively. DADACprotocol uses SAX approach to eliminate the redundancyin the collected measures before sending them the basestation so as to save energy and improve the lifetime.
iii) The simulation results are accomplished by OMNeT++network simulator to illustrate the effectiveness of theDADAC protocol. The DADAC protocol has been com-pared to two algorithms in the related works: PFFalgorithm that proposed by Bahi et al.(2014) [16] andHarb et al. algorithm (2016) that introduced in [17].
The rest of this paper is organized as follows. Next sectionexhibits literature review. Section 3 explains the descriptionof DADAC protocol. Protocol evaluation is shown in Section4. Finally, we present the conclusion and future works inSection 5.
II. LITERATURE REVIEW
Adaptive collection approaches are considered as a goodcandidate to save energy and extend the network lifetimeof PSNs. The major objective of an adaptive collectiontechnique is to make the sensor node be able to change itssampling rate dynamically in accordance with the monitoredenvironment conditions. This can reduce the repetitive gath-ered data, consume less energy, and decrease the processingload at the base station [14]. Adaptive collection avoidscapturing the redundant samples by exploiting the correlation(temporal[18], [19], spatial[20], [21], or spatio-temporal[22],[23], [24]) between sensed data. In order to save the energyof a WSN, several methods are proposed in [25], [26], [27],[28], [29] to improve the lifetime of the network.
This section reviews some related literature concerning theadaptive data collection in WSNs. The works proposed in[20], [21] consider adaptive sampling schemes based spatialcorrelation among the physical sensed data. In [20], thesampling rate is adapted by the base station. Initially, thebase station activates a set of sensors to get the senseddata of monitored environment. The correlation percentage iscomputed for the received sensed data to increase or decreasethe activated sensors.
Some other approaches study temporal correlation amongsensed data [18], [19]. Chatterja and Havinga [18] presenta sampling algorithm based temporal correlation amongsensed data. In this algorithm, the sampling rate is modifieddepending on the stability of the monitored environment. Thesampling rate increases when the environment conditions areunstable, otherwise the rate decreases.
Spatio-temporal correlation is used by some adaptive sam-pling techniques such as in [22], [23], [24]. For instance,Masoum et al. [24] introduce an energy-saving mechanismfor data collection. Their scheme exploits spatio-temporalcorrelation among sensors and their sensed data to determinethe candidate sensors which are responsible for sampling andtransmission. The selected sensors are adaptively changed.
Some researchers used prediction as a way to adjust thesampling rate of sensor nodes [30], [31], [32], [33], [34]. Anenergy saving information gathering scheme is proposed byLiu et al. [30] to predict the sampling rate inside sensorusing ARIMA model. In [31], the authors presented analgorithm for adaptive sampling using Box-Jenkins approachto estimate the future sensor readings, depending on theexisting readings. Alippi et al. [34] introduced a poweraware adaptive sampling method for snow monitoring. Theiralgorithm provides online estimation based on fast Fouriertransform.
In recent years, several adaptive sampling approaches inPSNs have been studied [35], [36], [37], [16], [14], [17].Laiymani and Makhoul [35] proposed a scheme for adaptivesampling using ANOVA model and Fisher test in PSNs. Thisalgorithm works at the sensor node to adapt its sampling rate.The authors in [16] proposed method to remove the repetitionof collected data in PSN called Prefix Frequency Filtering(PFF). Makhoul et al. [14] suggested adaptive data gatheringapproach for PSN. They combine between ANOVA modeland remaining energy to permit every sensor node to modifyits sampling rate in accordance with environment dynamics.Srbinovski et al. [36] proposed a power saving data collectionalgorithm for power scavenging in WSNs. Their approachtakes the energy harvesting from the monitored sensing areaand modifies its sampling rate based on the remaining energyand observed environment. An adaptive sampling algorithmbased on endocrine regulation mechanism (EASA) in WSNis presented [37]. The EASA algorithm uses hormone in-formation to control the nodes in working state or restingstate and adjusts collection frequency dynamically. Harb andMakhoul [17] proposed adaptive data collection approachbased set similarity among sensor readings. Their techniqueallows each sensor node to identify, first, the similaritybetween data collected among successive periods using setsimilarity function, then to adjust its sampling rate to thenewly calculated score of similarity. The sensor node reducesthe amount of redundant collected readings and extends thenetwork lifetime.
This paper suggested a Distributed Adaptive DAta Col-lection (DADAC) protocol for PSNs. The major goal ofDADAC is to remove redundant sensor readings, save energy,and improve the network lifetime. DADAC performs fourmain phases. First, data collection according to adaptivesampling rate. Second, PAA approach is applied to avoidthe redundancy in the collected data. Third, DADAC allowsto each sensor node to adapt its sampling rate for eachcycle (cycle = 2 periods) based on the PAA similarity.Fourth, SAX technique is used to remove the repetition in thecollected data and then transmits them to the sink. DADACis simulated on the OMNeT++ network simulator using realdata of sensor nodes. The comparison results show that ourprotocol can provide a better performance and prolong thenetwork lifetime.
III. DESCRIPTION OF THE DADAC PROTOCOL
DADAC protocol is given in more details in this section.The main objective of this protocol is to enable each sensorto modify its sampling rate adaptively in accordance withthe dynamic changing of the monitored environment. Con-sequently, this reduces the amount of redundant gathered
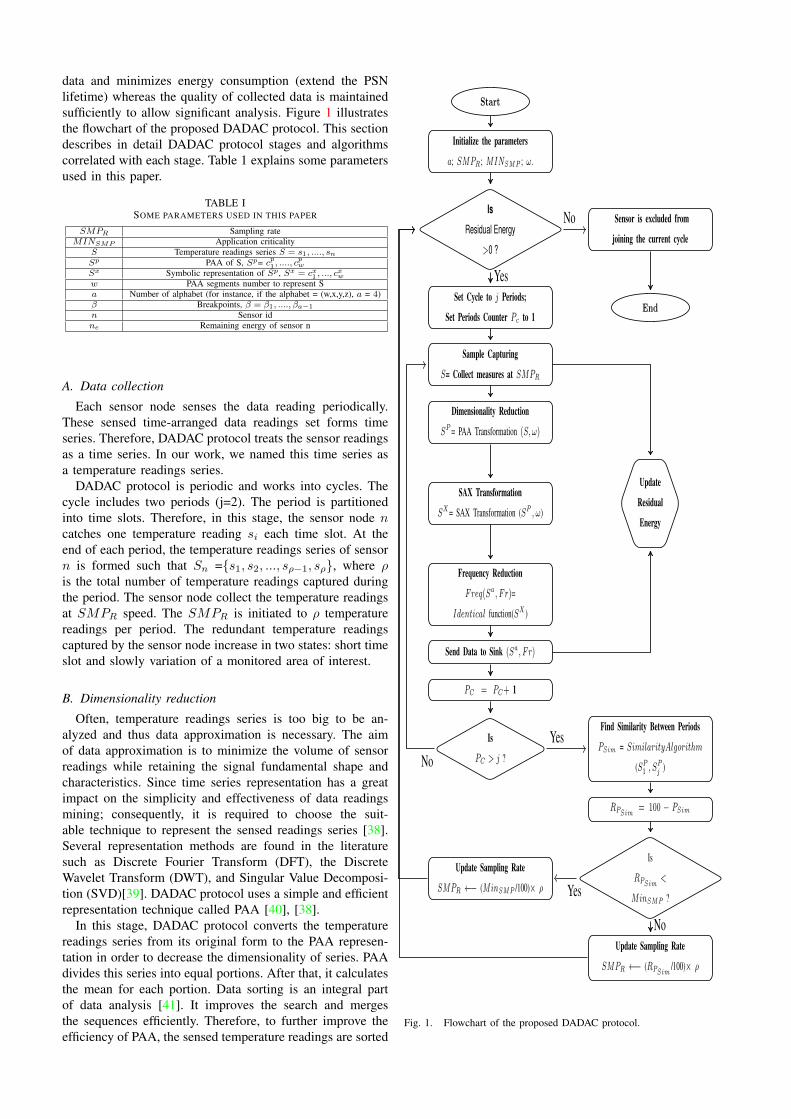
data and minimizes energy consumption (extend the PSNlifetime) whereas the quality of collected data is maintainedsufficiently to allow significant analysis. Figure 1 illustratesthe flowchart of the proposed DADAC protocol. This sectiondescribes in detail DADAC protocol stages and algorithmscorrelated with each stage. Table 1 explains some parametersused in this paper.
TABLE ISOME PARAMETERS USED IN THIS PAPER
SMPR Sampling rateMINSMP Application criticality
S Temperature readings series S = s1, ...., snSp PAA of S, Sp= cp1, ...., c
pw
Sx Symbolic representation of Sp, Sx = cx1 , ..., cxw
w PAA segments number to represent Sa Number of alphabet (for instance, if the alphabet = (w,x,y,z), a = 4)β Breakpoints, β = β1, ...., βa−1
n Sensor idne Remaining energy of sensor n
A. Data collection
Each sensor node senses the data reading periodically.These sensed time-arranged data readings set forms timeseries. Therefore, DADAC protocol treats the sensor readingsas a time series. In our work, we named this time series asa temperature readings series.
DADAC protocol is periodic and works into cycles. Thecycle includes two periods (j=2). The period is partitionedinto time slots. Therefore, in this stage, the sensor node ncatches one temperature reading si each time slot. At theend of each period, the temperature readings series of sensorn is formed such that Sn ={s1, s2, ..., sρ−1, sρ}, where ρis the total number of temperature readings captured duringthe period. The sensor node collect the temperature readingsat SMPR speed. The SMPR is initiated to ρ temperaturereadings per period. The redundant temperature readingscaptured by the sensor node increase in two states: short timeslot and slowly variation of a monitored area of interest.
B. Dimensionality reduction
Often, temperature readings series is too big to be an-alyzed and thus data approximation is necessary. The aimof data approximation is to minimize the volume of sensorreadings while retaining the signal fundamental shape andcharacteristics. Since time series representation has a greatimpact on the simplicity and effectiveness of data readingsmining; consequently, it is required to choose the suit-able technique to represent the sensed readings series [38].Several representation methods are found in the literaturesuch as Discrete Fourier Transform (DFT), the DiscreteWavelet Transform (DWT), and Singular Value Decomposi-tion (SVD)[39]. DADAC protocol uses a simple and efficientrepresentation technique called PAA [40], [38].
In this stage, DADAC protocol converts the temperaturereadings series from its original form to the PAA represen-tation in order to decrease the dimensionality of series. PAAdivides this series into equal portions. After that, it calculatesthe mean for each portion. Data sorting is an integral partof data analysis [41]. It improves the search and mergesthe sequences efficiently. Therefore, to further improve theefficiency of PAA, the sensed temperature readings are sorted
Start
Initialize the parameters
a; SMPR; MINSMP ; ω.
Is
Residual Energy
>0 ?
Sensor is excluded from
joining the current cycle
Set Cycle to j Periods;
Set Periods Counter Pc to 1End
Sample Capturing
S= Collect measures at SMPR
Dimensionality Reduction
SP = PAA Transformation (S, ω)
SAX Transformation
SX= SAX Transformation (SP , ω)
Update
Residual
Energy
Frequency Reduction
Freq(Sa, Fr)=
Identical function(SX )
Send Data to Sink (Sa, Fr)
PC = PC+ 1
Is
PC > j ?
Find Similarity Between Periods
PSim = SimilarityAlgorithm
(SP1 , SPj )
RPSim = 100 − PSim
Update Sampling Rate
SMPR ←− (MinSMP /100)× ρ
Is
RPSim <
MinSMP ?
Update Sampling Rate
SMPR ←− (RPSim /100)× ρ
No
Yes
NoYes
Yes
No
Fig. 1. Flowchart of the proposed DADAC protocol.
in descending order to group the similar ( or close similar)readings to each other. The sorted temperature readings seriesS = {s1, ...., sρ}, is normalized using z-normalization beforetransforming it into PAA representation. This procedureguarantees that input temperature readings series convertedto output series whose mean is nearly 0 whilst the standarddeviation is in a range near to 1. This normalization isnecessary to permit our algorithm to concentrate on thestructural similarities/dissimilarities instead of the amplitude[39], [42]. This normalization is calculated as follow
µ =
∑ρi=1(si)
ρ(1)
σ =
√∑ρi=1(si − µ)2ρ− 1
(2)
s′
i =si − µσ
(3)
Where σ, µ, and s′
i are the mean, standard deviation, andnormalized temperature reading.
At each period, PAA represents the collected temperaturereadings series S of length ρ in a w-dimensional space(typically w � ρ) set such that Sp=sp1,... , spw. Each ith
value in Sp is computed using the following formula
spi =w
ρ
ρw i∑
j= ρw (i−1)+1
spj (4)
In order to decrease the dimensionality of temperaturereadings series from ρ to w, the sensed temperature readingsseries is partitioned into segments with equal sizes. Afterthat, PAA computes the mean for the sensed data readingswithin each segment so as to produce a sensed data-reducedrepresentation set. The time complexity of computing themean in Eq. 4 is O(ρ). The transformation process oforiginal temperature readings series to PAA representationis presented in Algorithm 1.
Algorithm 1. PAA Dimensionality Reduction
Require: S (ρ-dimensional temperature readings series),w (PAA segments number)
Ensure: Sp (set of PAA Coefficients)1 : S ←− Sorting(S) in descending order2 : For i←− 1 to ρ do3 : spi ←−
si−µσ
4 : end for5 : For k ←− 1 to w
6 : Spk ←− wρ
∑ ρwk
j=ρw
(k−1)+1spj
7 : end for8 : return Sp
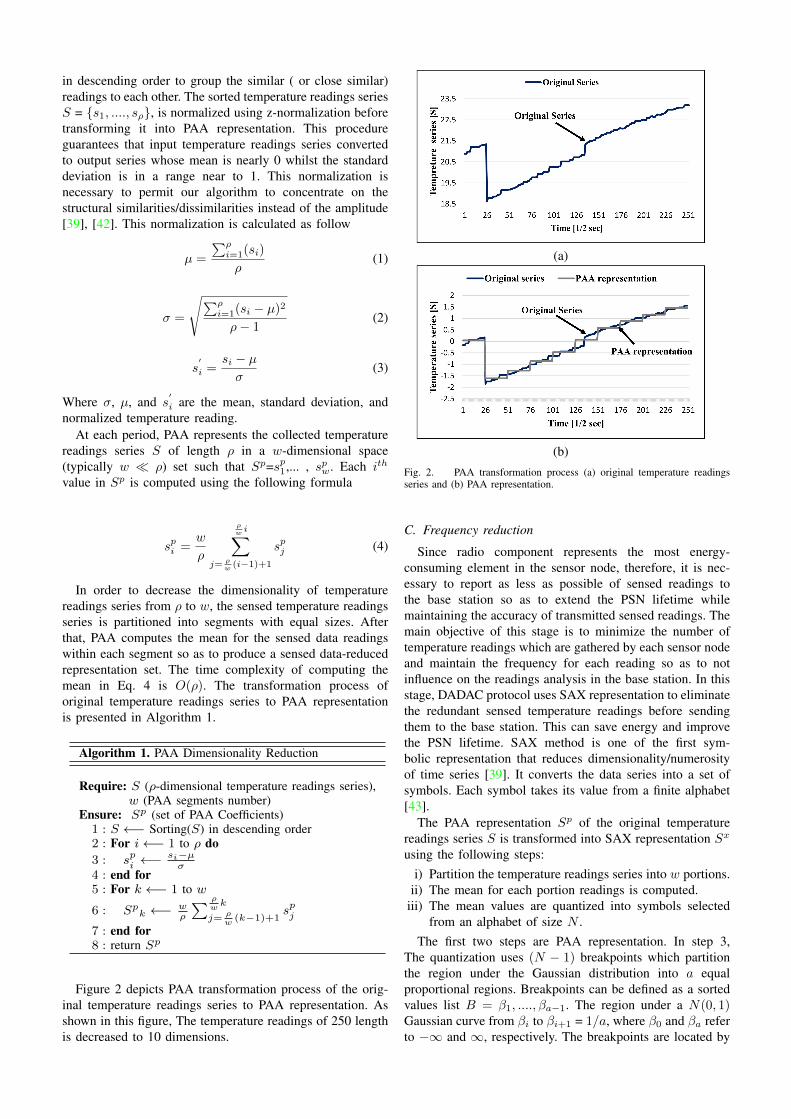
Figure 2 depicts PAA transformation process of the orig-inal temperature readings series to PAA representation. Asshown in this figure, The temperature readings of 250 lengthis decreased to 10 dimensions.
(a)
(b)Fig. 2. PAA transformation process (a) original temperature readingsseries and (b) PAA representation.
C. Frequency reduction
Since radio component represents the most energy-consuming element in the sensor node, therefore, it is nec-essary to report as less as possible of sensed readings tothe base station so as to extend the PSN lifetime whilemaintaining the accuracy of transmitted sensed readings. Themain objective of this stage is to minimize the number oftemperature readings which are gathered by each sensor nodeand maintain the frequency for each reading so as to notinfluence on the readings analysis in the base station. In thisstage, DADAC protocol uses SAX representation to eliminatethe redundant sensed temperature readings before sendingthem to the base station. This can save energy and improvethe PSN lifetime. SAX method is one of the first sym-bolic representation that reduces dimensionality/numerosityof time series [39]. It converts the data series into a set ofsymbols. Each symbol takes its value from a finite alphabet[43].
The PAA representation Sp of the original temperaturereadings series S is transformed into SAX representation Sx
using the following steps:i) Partition the temperature readings series into w portions.
ii) The mean for each portion readings is computed.iii) The mean values are quantized into symbols selected
from an alphabet of size N .The first two steps are PAA representation. In step 3,
The quantization uses (N − 1) breakpoints which partitionthe region under the Gaussian distribution into a equalproportional regions. Breakpoints can be defined as a sortedvalues list B = β1, ...., βa−1. The region under a N(0, 1)Gaussian curve from βi to βi+1 = 1/a, where β0 and βa referto −∞ and ∞, respectively. The breakpoints are located by

search them in a statistical table. For instance, Table 2 showsA lookup table of the breakpoints for a with values rangefrom 3 to 10 [39].
TABLE IIA LOOKUP TABLE OF THE BREAKPOINTS FOR a.
a 3 4 5 6 7 8 9 10βi β1 -0.43 -0.67 -0.84 -0.97 -1.07 -1.15 -1.22 -1.28
β2 0.43 0 -0.25 -0.43 -0.57 -0.67 -0.76 -0.84β3 0.67 0.25 0 -0.18 -0.32 -0.43 -0.52β4 0.84 0.43 0.18 0 -0.14 -0.25β5 0.97 0.57 0.32 0.14 0β6 1.07 0.67 0.43 0.25β7 1.15 0.76 0.52β8 1.22 0.84β9 1.28
When the breakpoints have been determined, the PAAcoefficients can be quantized as follow. Every PAA valueless than the smallest breakpoint will be converted to ”a”symbol, whilst the PAA values that are equal to or largerthan the smallest breakpoint and less than the second smallestbreakpoint are converted into ”b” symbol, etc. Figure 3presents mapping PAA values into SAX symbols usingbreakpoints, where ρ =250, w = 10, and a = 5. In thisfigure, the temperature readings series is mapped to the word”caabbcdeee”.
Fig. 3. Mapping PAA values into SAX symbols using breakpoints.
In Figure 3, SAX representation provides five symbols: a,b, c, d, and e. The symbols can be merged to introduce asequence called word. It can be defined as follow. Let alphaiindicates the ith value of the alphabet ( i.e., alpha1 = a andalpha2= b). Consequently, the transformation from a PAArepresentation Sp to a word Sx is computed as follows
Sxi = alphaj , iif βj−1 ≤ spi < βj . (5)
After converting the PAA values into SAX symbols, theresulted SAX symbols sequence will include redundant sym-bols due to multiple consecutive segments are transformedto the same symbol. In this stage, DADAC protocol removesthese redundant symbols in each period to prevent transmit-ting the same symbols to the base station. Therefore, wewill define a function that allows each sensor node to findthe similarity among the symbols of word Sx = sx1 , ..., s
xw
to eliminate this redundancy.The identical function identifies the similarity between two
symbols sxi and sxj and can be defined as follow
Identical(sxi , sxj ) =
{1 if sxi = sxj0 otherwise.
The sensor node n will search for the same symbols inthe word of the period j. If the same symbols are found, thesensor will record only the first occurrence of the symbol,and removes the others while increasing the frequency of thesymbol by one every time occurs in the word. Otherwise,the sensor will add this symbol to the set and initiated itsfrequency to 1. Frequency of the Symbol fr(sxi ) is definedas the number of the occurrence of the same symbol in thesame set. This reduced set of symbols and its frequencieswill be transmitted to the base station after converting eachsymbol to its equivalent mean of PAA segment. The processof SAX frequency reduction is illustrated in algorithm 2.
Algorithm 2. SAX Frequency Reduction
Require: Sp (w-dimensional PAA coefficients),a (Alphabet Length), α (Alphabetic)
Ensure: Rs (Reduced set of readings),FR
s(Frequencies of readings in Rs)
1 :For i←− 1 to w do2 : For j ←− 1 to a do3 : if βj ≤ spi < βj+1 then4 : Sxi ←− αj5 : end if6 : end for7 :end for8 : z ←− 09 :For m←− 1 to a do10 : z ←− z + 111 : For n←− 1 to w do12 : if Identical(Sxn, αm) = 1 then13 : FR
s
z ←− FRs
z + 114 : end if15 : end for16 : if (FR
s
z > 1) then17 : Rsz ←− αm18 : end if19 : end for20 :For i←− 1 to z do21 : d←− Ascii(Rsi )− 9722 : Rsi ←− βd × σ + µ23 : end for24 : return Rs, FR
s
D. Adaptive sampling rate
In this stage, DADAC protocol modifies its sampling ratebased on the percentage of similarity between temperaturereadings of different periods in the cycle. The main purposeof this stage is to calculate the similarity among periodsafter each finished cycle to acclimate the rate of samplingaccording to the new similarity rate. DADAC protocol adaptsits rate of sampling at the end of each cycle. Therefore, it usesthe PAA distance measure to find the amount of similaritybetween periods of each cycle.
1) Similarity measure: This section describes some mea-sures used to give the distance between two temperaturereadings series. Euclidean distance represents one of the mostfamous distance measures. Euclidean distance between two

temperature readings series Q and C of the same length ρis given by the following formula
DE(Q,C) =
√√√√ ρ∑i=1
(qi − ci)2. (6)
Let Q and C represent two collected temperature readingsseries. The PAA representations for the two series are Qp
and Cp. The lower bounding approximation of the Euclideandistance between the two temperature readings series Qp andCp can be obtained using the following formula
DPAA(Qp, Cp) =
√ρ
w
√√√√ w∑i=1
(qpi − cpi )
2. (7)
An examples for the visual representation of distancemeasures presented in Eq. 6 and Eq. 7 can be shown in[39].
DADAC protocol uses Similar function to identify theSimilarity between two transformed PAA temperature read-ings series Qp and Cp. The Similar function refers to thesimilarity between two PAA temperature readings seriesusing the following formula
SIM(Qp, Cp) =1
1 +DPAA(Qp, Cp). (8)
After that, in order to measure the similarity percentage(PSim), it is defined as follow
PSim = SIM(Qp, Cp)× 100. (9)
Algorithm 3 gives the similarity percentage (PSim) calcu-lation between two PAA temperature readings series Qp andCp.
Algorithm 3. Similarity Algorithm
Require: Qp, Cp, ρ (dimension before reduction)Ensure: PSim1 : Sum ←− 02 : For i←− 1 to w do3 : Sum ←− Sum+ (Qpi − Cpi)24 : end for5 : if (Sum = 0)then6 : DPAA ←− 07 : else8 : DPAA ←−
√ρw
√Sum
9 : end if10 : Sim ←− 1
1+DPAA11 : PSim ←− Sim× 10012 : return PSim
2) Verification the similarity of periods: In DADAC pro-tocol, the sampling period refers to the time duration duringwhich the sensor capture sensed temperature readings fromthe surrounding environment. The speed of change of envi-ronmental conditions and what fundamental features shouldbe periodically gathered in temperature readings collectionmodel can influence on the sampling period. In DADACprotocol, every node able to adapt its rate of samplingaccording to the amount of similarity among temperature
readings series collected during different periods. The aimof computing the similarity between the temperature read-ings series every cycle is to adapt the rate of samplingbased on the new calculated similarity. Therefore, the PAAsimilarity coefficient is employed to discover the similaritypercentage, PSim among several periods per cycle. On onehand, if PSim is high, it means the monitored condition ischanged at a slow speed. Therefore, the sensor node willdecrease its rate of sampling to the minimum value to preventcollecting redundant readings. On the other hand, if PSimis low, the sensor node will collect temperature readingsat approximately maximum sampling rate so as to preventlosing significant readings. Therefore, to acclimate the rateof sampling of sensor node in accordance with the computedsimilarity among periods, the reverse of similarity percentagefor PAA similarity coefficient RPSim is computed as follows
RPSim = 100− PSim. (10)
Consequently, the computed RPSim will be used to accli-mate the rate of sampling of the sensor in the new periods.When there is a high degree of similarity among periods(i.e., PSim is high), the sensor node balances its rate ofsampling to the minimum value (RPSim is low). Otherwise,it balances its rate of sampling to the maximum value. Asaforementioned, the process of adapting the sampling rate inthe sensor node depends on the RPSim , thus the applicationcriticality will be taken into consideration in this process.
3) Application criticality: The PSN can be used for moni-toring disasters by using various kinds of sensor devices, e.g.,for temperature, displacement, pressure, and concentration ofchemicals, or noise detection. The influence of disasters onpeople and on the environment is not the same. Therefore, thesensor can modifies its rate of sampling in a different mannerfor each monitored disasters. In order that, if the risk level ofthe disaster is high then the sensor node must collect sensedreadings more than if the risk level of the disaster is low. Thiscan provide collected readings with high quality to make bothof the analysis easier, and the monitored disaster is betterto understand. There is an inversely proportional relationbetween PSim and RPSim . Therefore, when the similarityamong periods is high, the RPSim will force the sensor nodeto make its sampling rate as minimum as possible.
In general, when the sensor node has the ability to alterits rate of sampling depending on the application’s needsin PSNs, this will save its energy. In DADAC protocol, thecriticality of application is expressed as a minimum amountof sampling rate in a period for a sensor node, MINSMP .MINSMP takes values in the range 0 to 100 which representthe criticality level either low or high respectively. The sensornode adapts the new sampling rate to the MINSMP (notto the RPSim) when the recently calculated sampling rateis less than MINSMP . Depending on the requirements ofthe application and before the deployment, all the sensornodes initialize their MINSMP . It is also possible to changeMINSMP dynamically during the lifetime of the networkfor the whole sensors or for just a given subgroup of sensorsif there are some types of management and control schemesare available.
Algorithm 4 illustrates an adaptive sampling rate approach.The main purpose of this algorithm is to give every sensordevice the ability to modify its rate of sampling to conserve

Algorithm 4. Adaptive Sampling Rate Algorithm
Require: j (One cycle = j periods), ρ, MINSMP , a: alphabetEnsure: SMPR (new sampling rate)1 : SMPR ←− ρ2 : while ne > 0 do3 : for i←− 1 to j do4 : Collect readings series (Si) at SMPR speed5 : Spi ←− Algorithm1 (Si, w)6 : SendToSink(Rs, FR
s)←− Algorithm2 (Spi , a, α)
7 : end for8 : for each cycle do9 : PSim ←− Algorithm3 (Sp1 , S
pj , ρ)
10 : RPSim ←− 100− PSim11 : if RPSim < MINSMP then12 : SMPR ←− (MINSMP /100)× ρ13 : else14 : SMPR ←− (RPSim/100)× ρ15 : end if16 : end for17 : end while
its power and to decrease the volume of collected data.Algorithm 4 works into cycles and each cycle consists ofj periods. In each period, the sensor captures ρ temperaturereadings. The number of periods j is fixed to 2 in algorithm4. For each cycle, the sensor node looks for the similaritypercentage among periods (line 9), then it computes RPSim(line 10). Therefore, the sensor node will decide to increaseits sampling rate to computed RPSim when it is greaterthan MINSMP which is determined by the application.Otherwise, it decreases its sampling rate to the MINSMP
(lines 11-15).
IV. PROTOCOL EVALUATION
A. Simulation framework
To study and evaluate DADAC protocol, extensive simula-tions are performed with discrete event simulator OMNeT++[44]. DADAC protocol is distributed at each sensor node andit is based on the dataset of Intel Berkeley Research Lab[45]. PSN in this Lab includes 54 Mica2Dot sensors. Thesensed data of the weather (such as temperature, humidity,and light) are periodically collected by these sensors onceeach 31 seconds. The base station is located at the center ofthe Lab. It receives sensed readings from each sensor nodeby a single hop. In our simulation, the sensor nodes use a logfile contains about 2.3 million readings collected previouslyby Mica2Dot sensor nodes in the Lab. This article uses onlyone measure of sensor node measurements: temperature1.Some sensor nodes are not used in our simulation because itsdata may be missing or truncated. Therefore, the temperaturereadings of 47 sensor nodes are selected and stored. Theresults are the average of 47 sensor nodes. Table III givesthe selected parameters settings.
In the experimental simulations, Some performance met-rics are applied to assess the effectiveness of the DADACprotocol such as sampling rate adaptation, number of col-lected temperature readings by a sensor node, number of senttemperature readings, energy consumption, and lifetime.
DADAC protocol uses the same energy consumptionmodel discussed in [17]. Energy consumed by the sensor
1the others are done by the same manner.
TABLE IIISIMULATION PARAMETERS FOR PSN INITIALIZATION
Parameter ValuePSN size 47 nodes
a 5 and 10 symbolsρ 20, 50, 100 and 200 readings
MINSMP 20, 40 and 60w 10%, 20%, 50%, 75% of the collected measuresj 2
Eelec 50 nJ/bitβamp 100 pJ/bit/m2
node depends only on the periodically collected and sent tem-perature readings to the base station. The cost of transmissionis calculated for a m− bits message and for a distance d asfollow
ETX(m, d) = Eelec ∗m+ βamp ∗m ∗ d2. (11)
The energy consumption required for capturing m− bitsby the sensor node is calculated as follow
ECX(m, d) = ETX(m, d)/7. (12)
These experiment simulations consider the length of datareading m equal to 64. In the case of transmission, 16bits are added to m − bits message which correspondsto the frequency of data reading m. Consequently, Energyconsumption is defined as the total energy dissipated at eachsensor node during the collection and transmission of datareadings and formulated as follow
ETotal = ETX(m, d) + ECX(m, d). (13)
B. Performance analysis
In this section, several experiments are achieved to showthe performance of DADAC protocol. It is distributed at eachsensor node in the PSN. Every node reads real temperaturereadings periodically and adapts its rate of sampling aftereach cycle based on the similarity percentage among col-lected sets of temperature readings.
1) Sampling rate adaptation: Figure 4 shows the adap-tation of sampling rate and for two sizes of temperaturereadings (50 and 100 respectively). The results illustratethe ability of sensor device to modify its rate of samplingdynamically depending on the application criticality level.The risk level MINSMP can be determined according tothe type and requirement of application used to monitor thedisaster.
In this experiment, MINSMP uses two values: 20 forlow risk level disaster and 60 for high risk level disaster. Asshown in Figure 4, the adaptation of sampling rate is dynamicand after each cycle based on the application criticality level(i.e., MINSMP= 20 or 60). The results in Figure 4 (a) and(b) validate the good performance of our protocol.
2) Number of collected readings: Figure 5 shows thenumber of collected readings by the node at the end ofsimulation. DADAC protocol uses different values for theparameters SMPR, a, MINSMP , and w.
As shown in these results, the alphabet size a does notaffect the number of collected readings because of adaptationof sampling rate depends basically on the similarity amongperiods. DADAC protocol collects as large as possible of

10
15
20
25
30
35
40
45
50
200 400 600 800 1000 1200
Sa
mp
ling
Ra
te (
Re
ad
ing
s/P
erio
d)
Period Number
Smin=20Smin=60
(a)
20
25
30
35
40
45
50
55
60
65
70
75
80
85
90
95
100
100 200 300 400 500 600 700
Sa
mp
ling
Ra
te (
Re
ad
ing
s/P
erio
d)
Period Number
Smin=20Smin=60
(b)Fig. 4. Sampling rate adaptation (a) ρ = 50 and (b) ρ = 100.
temperature reading as the MINSMP increases. This cansupport application requirements when the risk level is highthen DADAC protocol collect more readings. It can beseen that increasing the ρ leads to increase the number ofcollected readings because of the decreasing in the similaritypercentage between collected readings of successive periods.Concerning the accuracy, it can be seen that when the numberof segments w decreases then the number of collectedreadings decreases due to increasing the similarity amongcollected readings according to the defined identical function.
3) Number of sent readings: In this experiment, thenumber of sent readings by sensor node is evaluated. Anothertask carried out by DADAC protocol is to remove redundantcollected readings before send them to the base station whilemaintaining the accuracy of collected readings. Figure 6indicates the number of sent readings by the node at theend of the simulation.
Obviously, the number of sent readings increases withthe number of alphabet sizes. This is due to the lack ofsimilarity among collected readings. It can be seen thatDADAC protocol send the larger amount of readings to thebase station when the MINSMP increases. This can supportthe application needs by sending a larger number of readingswhen the risk level of application is high. It is obvious thatthe increase in the SMPR leads to decrease the numberof sent measures due to SAX transformation of collectedreadings into fixed number of symbols, each one associatedwith different frequency. For example, suppose a =5 and
0
10000
20000
30000
40000
50000
60000
10 20 50 75 100
Nu
mb
er
of
Co
llecte
d R
ea
din
gs
Segments Ratio (%)
DADAC(Smin=20, SAX=5)DADAC(Smin=20, SAX=10)DADAC(Smin=40, SAX=5)
DADAC(Smin=40, SAX=10)DADAC(Smin=60, SAX=5)
DADAC(Smin=60, SAX=10)
(a)
0
10000
20000
30000
40000
50000
60000
10 20 50 75 100
Nu
mb
er
of
Co
llecte
d R
ea
din
gs
Segments Ratio (%)
DADAC(Smin=20, SAX=5)DADAC(Smin=20, SAX=10)DADAC(Smin=40, SAX=5)
DADAC(Smin=40, SAX=10)DADAC(Smin=60, SAX=5)
DADAC(Smin=60, SAX=10)
(b)Fig. 5. Number of collected readings (a) ρ = 50 and (b) ρ = 100.
SMPR=50, the 50 collected readings will be representedby 5 symbols (a, b, c, d, and e). Each of these symbolshas a different associated frequency (e.g., 5, 4, 15, 10, 16).If the SMPR increases to 100 for the same 5 symbols, itleads to represent the 100 collected readings by the same5 symbols and with different associated frequency for eachsymbol. Therefore, DADAC protocol reduces the number ofredundant data before send them to the base station to savesmore energy and improve lifetime.
4) Energy consumption: In this experiment, the energyconsumption of the sensor node using DADAC protocol isstudied. Figure 7 illustrates energy consumption by a sensornode at the end of the simulation.
As shown in Figure 7, when the a and w increase, thenumber of sent readings increases (see Figure 6) thus energyconsumption by the sensor node using DADAC protocolincreases. DADAC protocol increases the sent readings whenthe risk level of the application is high. Therefore, theenergy consumption by DADAC protocol increases whenthe MINSMP increases. Furthermore, it is obvious that theincrease in the SMPR leads to decrease the number of sentreadings thus save the energy of sensor node.
5) Data Accuracy: This experiment shows another sig-nificant evaluation metric to assess the quality of DADACprotocol is the data accuracy of collected data. This metricrefers to the rate of the data lost. However, the data accuracyis computed at the end of the experiment by subtracting the

0
1000
2000
3000
4000
5000
6000
7000
8000
9000
10000
10 20 50 75 100
Nu
mb
er
of
Se
nt
Re
ad
ing
s
Segments Ratio (%)
DADAC(Smin=20, SAX=5)DADAC(Smin=20, SAX=10)DADAC(Smin=40, SAX=5)
DADAC(Smin=40, SAX=10)DADAC(Smin=60, SAX=5)
DADAC(Smin=60, SAX=10)
(a)
0
1000
2000
3000
4000
5000
6000
7000
10 20 50 75 100
Nu
mb
er
of
Se
nt
Re
ad
ing
s
Segments Ratio (%)
DADAC(Smin=20, SAX=5)DADAC(Smin=20, SAX=10)DADAC(Smin=40, SAX=5)
DADAC(Smin=40, SAX=10)DADAC(Smin=60, SAX=5)
DADAC(Smin=60, SAX=10)
(b)Fig. 6. Number of sent readings (a) ρ = 50 and (b) ρ = 100.
lost data readings rate from the total number of data readingscollected by the sensor without adaptive sampling. Tables IVand V shows the data accuracy of DADAC protocol for ρ =50 and ρ = 100 respectively with a = 5. The conducted resultsconfirm that the DADAC protocol gives a suitable level ofdata accuracy. It gives at least 99.34 % of data accuracy.Hence, the decision at the base station will be not affected.Therefore, DADAC protocol can be considered as an energy-efficient method to adapt the rate of sampling of the sensorwhilst keeping a high level of data accuracy of the gathereddata.
TABLE IVDATA ACCURACY OF COLLECTED DATA (ρ = 50).
SegmentsRatio (%)
Data Accuracy (%)Smin=20 Smin=40 Smin=60
10 99.36 99.34 99.6420 99.39 99.59 99.6950 99.56 99.66 99.7375 99.34 99.54 99.67
C. Comparison results
Depending on the conducted results in the subsection IV-B,DADAC protocol, with a = 5 and segments ratio = 10%,seem to give the best results to be compared with the bestresults of other two existing techniques. The first schemeis called PFF that proposed by Bahi et al.(2014) [16]. The
0
0.02
0.04
0.06
0.08
0.1
0.12
10 20 50 75 100
En
erg
y C
on
su
mp
tio
n (
Jo
ule
s)
Segments Ratio (%)
DADAC(Smin=20, SAX=5)DADAC(Smin=20, SAX=10)DADAC(Smin=40, SAX=5)
DADAC(Smin=40, SAX=10)DADAC(Smin=60, SAX=5)
DADAC(Smin=60, SAX=10)
(a)
0
0.02
0.04
0.06
0.08
10 20 50 75 100
En
erg
y C
on
su
mp
tio
n (
Jo
ule
s)
Segments Ratio (%)
DADAC(Smin=20, SAX=5)DADAC(Smin=20, SAX=10)DADAC(Smin=40, SAX=5)
DADAC(Smin=40, SAX=10)DADAC(Smin=60, SAX=5)
DADAC(Smin=60, SAX=10)
(b)Fig. 7. Energy consumption by a sensor node (a) ρ = 50 and (b) ρ = 100.
TABLE VDATA ACCURACY OF COLLECTED DATA (ρ = 100)
SegmentsRatio (%)
Data Accuracy (%)Smin=20 Smin=40 Smin=60
10 99.49 99.58 99.6420 99.56 99.61 99.6650 99.54 99.57 99.6275 99.57 99.60 99.63
second approach is called Harb et al. (2016) that introducedin [17].
1) Number of collected readings: Figure 8 illustrates thenumber of collected readings at the end of simulation byevery sensor node using DADAC protocol compared withother two approaches. DADAC protocol decreases the num-ber of collected readings by a sensor node from 18% to 76%compared to PFF. The PFF does not allow to the sensor nodeto adapt its sampling rate. Therefore, it always collects thesame number of readings. Whereas, in comparison with Harbet al. approach which allows the sensor node to adapt its rateof sampling based on the similarity between the periods ofone cycle, DADAC protocol decreases the collected readingsfrom 5% to 29%.
The results illustrate that DADAC protocol has the abilityto get rid of the redundant collected readings efficiently soas to decrease the overhead of transmitted readings to thebase station thus improve the network lifetime. It can beseen that DADAC protocol increases the volume of collected

0
10000
20000
30000
40000
50000
60000
70000
80000
90000
20 50 100 200
Num
ber
of C
olle
cte
d R
eadin
gs
Number of Readings/Period
Harb et al.(Smin=20)DADAC(Smin=20)
Harb et al.(Smin=40)DADAC(Smin=40)
Harb et al.(Smin=60)DADAC(Smin=60)
PFF
Fig. 8. Number of collected readings by a sensor node.
readings when the MINSMP is increased. This increment inthe collected readings is to meet the application requirementswhen the risk level is high.
2) Number of sent readings: When collecting the datareadings at each period, DADAC protocol at the sensornode able to decrease the number of sent readings to thebase station by using SAX method. Therefore, DADACprotocol finds the redundant symbols in the word of eachperiod and allocates for every symbol its frequency. Figure 9demonstrates the number of sent readings by a sensor node tothe base station at the end of simulation for DADAC protocolcompared with the PFF and Harb et al. methods.
0
1000
2000
3000
4000
5000
6000
7000
8000
9000
20 50 100 200
Num
be
r of S
en
t R
ead
ing
s
Number of Readings/Period
Harb et al.(Smin=20)DADAC(Smin=20)
Harb et al.(Smin=40)DADAC(Smin=40)
Harb et al.(Smin=60)DADAC(Smin=60)
PFF
Fig. 9. Number of sent readings by a sensor node.
The results illustrate that DADAC protocol at each sensornode decreases from 56% to 65% of the number of sentreadings to the base station as comparing to the PFF andfrom 55% to 60% as comparing to the Harb et al. meth-ods respectively. Therefore, DADAC protocol removes theredundant collected readings successfully and the number ofsent readings to the base station is reduced. We can also seethat the volume of sent readings from the sensor node to thebase station decreases when ρ increases or w decreases. Thisis due to the number of sent readings rely on the number ofcollected readings, segments ratio, the identical function, andthe risk level of application.
3) Energy consumption: Figure 10 shows the energyconsuming by DADAC protocol at the sensor node comparedwith PFF and Harb et al. approaches.
0
0.02
0.04
0.06
0.08
0.1
0.12
0.14
20 50 100 200
Ene
rgy C
on
sum
ptio
n (
Jo
ule
s)
Number of Readings/Period
Harb et al.(Smin=20)DADAC(Smin=20)
Harb et al.(Smin=40)DADAC(Smin=40)
Harb et al.(Smin=60)DADAC(Smin=60)
PFF
Fig. 10. Energy consumption.
As shown in Figure 10, DADAC protocol outperforms theother approaches in term of energy consumption. It savesenergy because it reduces both collected and sent readingsat the sensor node. The consumed energy of a sensor nodeusing DADAC protocol is minimized from 37% to 70% ascompared to PFF and from 20% to 59% as compared to Harbet al. techniques respectively. It can be observed that DADACprotocol is effective in terms of reducing energy consumptionfor the applications with high and low risk level, where moreenergy is saved when MINSMP decreases.
4) Lifetime of sensor node: Finally, we study the influenceof the number of collected and sent readings on the PSNlifetime. As exhibited by Figure 11, DADAC protocol givesa longer network lifetime compared with other approaches.Every sensor node initiated its energy to 40mJ for the wholeapproaches in this comparison.
0
500
1000
1500
2000
2500
3000
3500
20 50 100 200
Nu
mb
er
of P
erio
ds
Number of Readings/Period
Harb et al.(Smin=20)DADAC(Smin=20)
Harb et al.(Smin=40)DADAC(Smin=40)
Harb et al.(Smin=60)DADAC(Smin=60)
PFF
Fig. 11. Lifetime of a sensor node.
DADAC protocol enhances the lifetime of sensor nodeup to 56% and 60% comparing to the Harb et al. and PFFtechniques respectively. These results are obtained due to theefficiency of DADAC protocol in conserving the energy ofthe sensor thus increases the PSN lifetime for both high and

low risk level applications, whilst maintaining the quality ofthe gathered readings.
5) Energy saving ratio: This metric exhibits the capabilityof DADAC protocol to conserve energy. Figure 12 showsthe energy saving ratio at the sensor node compared withPFF and Harb et al. approaches. Energy saving ratio = (1-(CEt/Einit))*100. Einit refers to the initial energy of thesensor node where Einit = 0.08 joule. CEt refers to thetotal consumed energy at the sensor node.
0
10
20
30
40
50
60
70
80
90
100
20 50 100 200
Ene
rgy S
avin
g R
atio (
%)
Number of Readings/Period
Harb et al.(Smin=20)DADAC(Smin=20)
Harb et al.(Smin=40)DADAC(Smin=40)
Harb et al.(Smin=60)DADAC(Smin=60)
PFF
Fig. 12. Energy saving ratio.
The results show that the DADAC protocol saves effi-ciently energy because it reduces both gathered and trans-mitted readings at the sensor node. As illustrated in Figure12, the saved energy of a sensor node using DADAC protocolis maximized from 38% to 77% whilst Harb et al. techniquesaved from 22% to 45%. The saved energy at the sensornode using PFF algorithm is incresed from 1% to 23%.PFF algorithm shows less energy saving compared withother approaches. However, DADAC protocol can save moreenergy that leads to extend the life of the sensors batteries.
6) Algorithmic complexity: As an analytical study, everysensor node ni constructs sequence of sensed data Si of ρtemperature readings. The time complexity of the algorithm1 is O(ρ). The time complexity of the algorithm 2 is O(w a),where w is the number of segments and a is the length ofAlphabet. Algorithm 3 has O(w) as a computation complex-ity. The time complexity of the algorithm 4 is O((w · a) +ρ). Therefore, the time complexity of our proposed DADACprotocol in the worst case is O((w · a) + ρ) and it will saveat most(2 × ρ ) measures at the memory of the sensor nodein each cycle. Therefore, the storage (space) complexity ofDADAC protocol is O(ρ). The time complexity of Harb et al.algorithm takes O(ρ 2). Finally, the time complexity of PFF isO(ρ × log2(ρ)). In addition, the complexity of the message inDADAC protocol depends mainly on the number of collecteddata (ρ) in the period, which is fixed by the application. If itis required a large value for ρ, several solutions can be usedsuch as data packet division. The space complexity dependson the sensor node memory size as well as ρ, which can behandled in a similar way to the complexity of the message.
7) The t-test: In this section, we use the statistical anal-ysis such as t-test to show that our results are significant.Therefore, the t-test is applied on the comparison result of theenergy consumption between our proposed DADAC protocol
and the two existing methods (Harb et al. and PFF). The t-test (with p-value) between DADAC and Harb et al. is equalto 0.000106089, whilst the t-test (with p-value) betweenDADAC and PFF is equal to 4.09444E-06. Hence, the t-test (with p-value < 0.05) shows that our result is significantand the energy consumption is significantly reduced.
V. CONCLUSION AND FUTURE WORKS
This paper presents a protocol, called distributed adap-tive data collection protocol (DADAC), which collects pe-riodically sensor readings and improves the PSN lifetime.DADAC protocol works into cycles and consists of fourphases. First, collecting the data readings. Second, the sen-sor converts the collected temperature readings into PAArepresentation in order to reduce its dimensionality. Third,the redundant collected readings are reduced using SAXapproach. Fourth, sampling resolution to adapt the rate ofsampling at the sensor node in accordance with the dy-namic changing of observed environment. DADAC protocolconsiders the risk level of an application by fixing theminimum sampling rate that permits to sensor node to collectreadings at a minimum rate while maintaining a good qualityof the collected readings. To assess the effectiveness ofDADAC protocol, we compared it with two other methodsusing several performance metrics like a number of collectedand sent readings, energy consumption, and PSN lifetime.Simulation results show the efficiency of DADAC protocolto conserve the energy at the sensor nodes thus prolong thePSN lifetime.
In future, We plan to improve our work to consider thesensing overlap among sensor nodes at the aggregator levelto optimize both the aggregated readings and lifetime whilemaintaining a good accuracy.
ACKNOWLEDGMENT
The authors would like to gratefully acknowledge theUniversity of Babylon, Iraq for the financial support.
REFERENCES
[1] E. M. Shakshuki, H. Malik, and T. Sheltami, “Wsn in cyber phys-ical systems: Enhanced energy management routing approach usingsoftware agents,” Future Generation Computer Systems, vol. 31, pp.93–104, 2014.
[2] G. Abdul-Salaam, A. H. Abdullah, M. H. Anisi, A. Gani, and A. Ale-laiwi, “A comparative analysis of energy conservation approaches inhybrid wireless sensor networks data collection protocols,” Telecom-munication Systems, vol. 61, no. 1, pp. 159–179, 2016.
[3] K. K. Chand, P. V. Bharati, and B. S. Ramanjaneyulu, “Optimizedenergy efficient routing protocol for life-time improvement in wirelesssensor networks,” in Advances in Engineering, Science and Manage-ment (ICAESM), 2012 International Conference on. IEEE, 2012, pp.345–349.
[4] K. Shivanna and H. Shalini Kumari, “Energy efficient data mining inmulti-feature sensor networks using improved leach communicationprotocol,” IOSR Journal of Computer Engineering, vol. 3, no. 3, pp.8–11, 2012.
[5] A. K. Idrees, K. Deschinkel, M. Salomon, and R. Couturier,“Perimeter-based coverage optimization to improve lifetime in wirelesssensor networks,” Engineering Optimization, vol. 48, no. 11, pp. 1951–1972, 2016.
[6] A. Idrees, K. Deschinkel, M. Salomon, and R. Couturier, “Distributedlifetime coverage optimization protocol in wireless sensor networks,”The Journal of Supercomputing, vol. 71, no. 12, pp. 4578–4593, 2015.
[7] A. K. Idrees, K. Deschinkel, M. Salomon, and R. Couturier, “Coverageand lifetime optimization in heterogeneous energy wireless sensornetworks,” ICN 2014, p. 60, 2014.

[8] C. Alippi, G. Anastasi, C. Galperti, F. Mancini, and M. Roveri, “Adap-tive sampling for energy conservation in wireless sensor networks forsnow monitoring applications,” in 2007 IEEE International Conferenceon Mobile Adhoc and Sensor Systems. IEEE, 2007, pp. 1–6.
[9] X. Tang and J. Xu, “Adaptive data collection strategies for lifetime-constrained wireless sensor networks,” IEEE Transactions on Paralleland Distributed Systems, vol. 19, no. 6, pp. 721–734, 2008.
[10] A. K. I. Ali K. M. Al Qurabat, “Distributed data aggregation pro-tocol for improving lifetime of wireless sensor networks,” The 1stInternational Conference on Information Technology (ICoIT’17), pp.220–230, 2017.
[11] A. K. I. Wesam Huseein, “Energy - efficient sensor activity schedulingprotocol for wireless sensor networks,” The 1st International Confer-ence on Information Technology (ICoIT’17), pp. 257–265, 2017.
[12] G. Campobello, A. Segreto, and S. Serrano, “Data gathering techniquesfor wireless sensor networks: A comparison,” International Journal ofDistributed Sensor Networks, vol. 2016, 2016.
[13] L. A. Tang, J. Han, and G. Jiang, “Mining sensor data in cyber-physicalsystems,” singhua Science and Technology, vol. 19, no. 3, pp. 225–234,2014.
[14] A. Makhoul, H. Harb, and D. Laiymani, “Residual energy-basedadaptive data collection approach for periodic sensor networks,” AdHoc Networks, vol. 35, pp. 149–160, 2015.
[15] A. K. I. Ali K. M. Al Qurabat, “Adaptive data collection protocol forextending lifetime of periodic sensor networks,” The 1st InternationalConference on Information Technology (ICoIT’17), pp. 108–118, 2017.
[16] J. M. Bahi, A. Makhoul, and M. Medlej, “A two tiers data aggregationscheme for periodic sensor networks.” Adhoc & Sensor WirelessNetworks, vol. 21, no. 1, 2014.
[17] H. Harb, A. Makhoul, A. Jaber, R. Tawil, and O. Bazzi,“Adaptive data collection approach based on sets similarity functionfor saving energy in periodic sensor networks,” InternationalJournal of Information Technology and Management, pp. 1–19, InPress 2016. [Online]. Available: http://www.inderscience.com/info/ingeneral/forthcoming.php?jcode=ijitm.
[18] S. Chatterjea and P. Havinga, “An adaptive and autonomous sensorsampling frequency control scheme for energy-efficient data acqui-sition in wireless sensor networks,” in International Conference onDistributed Computing in Sensor Systems. Springer, 2008, pp. 60–78.
[19] A. Masoum, N. Meratnia, and P. J. Havinga, “A decentralized qualityaware adaptive sampling strategy in wireless sensor networks,” inUbiquitous Intelligence & Computing and 9th International Con-ference on Autonomic & Trusted Computing (UIC/ATC), 2012 9thInternational Conference on. IEEE, 2012, pp. 298–305.
[20] R. Willett, A. Martin, and R. Nowak, “Backcasting: adaptive samplingfor sensor networks,” in Proceedings of the 3rd international sympo-sium on Information processing in sensor networks. ACM, 2004, pp.124–133.
[21] J. Wang, S. Tang, B. Yin, and X.-Y. Li, “Data gathering in wirelesssensor networks through intelligent compressive sensing,” in INFO-COM, 2012 Proceedings IEEE. IEEE, 2012, pp. 603–611.
[22] C. Liu, K. Wu, and J. Pei, “An energy-efficient data collectionframework for wireless sensor networks by exploiting spatiotemporalcorrelation,” IEEE Transactions on Parallel and Distributed Systems,vol. 18, no. 7, pp. 1010–1023, 2007.
[23] B. Gedik, L. Liu, and S. Y. Philip, “Asap: an adaptive samplingapproach to data collection in sensor networks,” IEEE Transactionson Parallel and distributed systems, vol. 18, no. 12, pp. 1766–1783,2007.
[24] A. Masoum, N. Meratnia, and P. J. Havinga, “An energy-efficientadaptive sampling scheme for wireless sensor networks,” in IntelligentSensors, Sensor Networks and Information Processing, 2013 IEEEEighth International Conference on. IEEE, 2013, pp. 231–236.
[25] F. Alassery and W. K. Ahmed, “Toward energy efficient wireless sen-sor networks using pilot periods for collision detection,” EngineeringLetters, vol. 24, no. 1, pp. 113–124, 2016.
[26] F. Alassery, W. K. Ahmed, M. Sarraf, and V. Lawrence, “A low com-putational complexity statistical discrimination algorithm for collisiondetection in wireless sensor networks,” IAENG International Journalof Computer Science, vol. 41, no. 3, pp. 204–211, 2014.
[27] Y. MALEH and A. Ezzati, “Lightweight intrusion detection scheme forwireless sensor networks,” IAENG International Journal of ComputerScience, vol. 42, no. 4, pp. 347–354, 2015.
[28] W.-H. Kuo, Y.-S. Chen, K.-T. Cheng, and T.-W. Lu, “Signal strengthbased indoor and outdoor localization scheme in zigbee sensor net-works.” IAENG International Journal of Computer Science, vol. 23,no. 1, pp. 55–64, 2016.
[29] P. Chaturvedi and A. Daniel, “A hybrid scheduling protocol for targetcoverage based on trust evaluation for wireless sensor networks.”
IAENG International Journal of Computer Science, vol. 44, no. 1,pp. 87–104, 2017.
[30] C. Liu, K. Wu, and M. Tsao, “Energy efficient information collectionwith the arima model in wireless sensor networks,” in GLOBE-COM’05. IEEE Global Telecommunications Conference, 2005., vol. 5.IEEE, 2005, pp. 5–pp.
[31] Y. W. Law, S. Chatterjea, J. Jin, T. Hanselmann, and M. Palaniswami,“Energy-efficient data acquisition by adaptive sampling for wirelesssensor networks,” in Proceedings of the 2009 International Conferenceon Wireless Communications and Mobile Computing: Connecting theWorld Wirelessly. ACM, 2009, pp. 1146–1151.
[32] P. Padhy, R. K. Dash, K. Martinez, and N. R. Jennings, “A utility-basedadaptive sensing and multihop communication protocol for wirelesssensor networks,” ACM Transactions on Sensor Networks (TOSN),vol. 6, no. 3, p. 27, 2010.
[33] A. Jain and E. Y. Chang, “Adaptive sampling for sensor networks,” inProceeedings of the 1st international workshop on Data managementfor sensor networks: in conjunction with VLDB 2004. ACM, 2004,pp. 10–16.
[34] C. Alippi, G. Anastasi, M. Di Francesco, and M. Roveri, “An adaptivesampling algorithm for effective energy management in wirelesssensor networks with energy-hungry sensors,” IEEE Transactions onInstrumentation and Measurement, vol. 59, no. 2, pp. 335–344, 2010.
[35] D. Laiymani and A. Makhoul, “Adaptive data collection approach forperiodic sensor networks,” in 2013 9th International Wireless Commu-nications and Mobile Computing Conference (IWCMC). IEEE, 2013,pp. 1448–1453.
[36] B. Srbinovski, M. Magno, B. O’Flynn, V. Pakrashi, and E. Popovici,“Energy aware adaptive sampling algorithm for energy harvestingwireless sensor networks,” in Sensors Applications Symposium (SAS),2015 IEEE. IEEE, 2015, pp. 1–6.
[37] J. Zhang, L. Ren, Y. Ding, and K. Hao, “Adaptive sampling algorithmwith endocrine regulation mechanism for wireless sensor network,”in Intelligent Systems and Knowledge Engineering (ISKE), 2015 10thInternational Conference on. IEEE, 2015, pp. 502–507.
[38] C. Cassisi, P. Montalto, M. Aliotta, A. Cannata, and A. Pulvirenti,“Similarity measures and dimensionality reduction techniques for timeseries data mining,” Advances in data mining knowledge discovery andapplications, 2012.
[39] J. Lin, E. Keogh, S. Lonardi, and B. Chiu, “A symbolic representationof time series, with implications for streaming algorithms,” in Pro-ceedings of the 8th ACM SIGMOD workshop on Research issues indata mining and knowledge discovery. ACM, 2003, pp. 2–11.
[40] E. Keogh, K. Chakrabarti, M. Pazzani, and S. Mehrotra, “Dimension-ality reduction for fast similarity search in large time series databases,”Knowledge and information Systems, vol. 3, no. 3, pp. 263–286, 2001.
[41] Wikipedia, “Sorting — wikipedia, the free encyclopedia,” 2016,[Online; accessed 23-August-2016]. [Online]. Available: https://en.wikipedia.org/w/index.php?title=Sorting&oldid=733029871
[42] J. Lin and Y. Li, “Finding structural similarity in time series datausing bag-of-patterns representation,” in International Conference onScientific and Statistical Database Management. Springer, 2009, pp.461–477.
[43] S. Malinowski, T. Guyet, R. Quiniou, and R. Tavenard, “1d-sax:A novel symbolic representation for time series,” in InternationalSymposium on Intelligent Data Analysis. Springer, 2013, pp. 273–284.
[44] A. Varga’s, “Omnet++ discrete event simulator.” 2003. [Online].Available: https://omnetpp.org/.
[45] S. Madden, “Intel berkeley research lab,” 2004, [Online; accessed25-August-2016]. [Online]. Available: http://db.csail.mit.edu/labdata/labdata.html
Ali Kadhum IDREES received his B.Sc. andM.Sc. degrees in Computer Science from the Uni-versity of Babylon, Iraq in 2000 and 2003 respec-tively. He received his Ph.D. degree in ComputerScience (Wireless Networks) in 2015 from theUniversity of Franche-Comte (UFC), France. Heis currently an assistant professor in ComputerScience at the University of Babylon, Iraq. His re-search interests include Wireless Networks, WSNs,SDN, IoT, Distributed Computing, Data Mining,and Optimization in Communication Networks.

Ali Kadhum M. Al-Qurabat is currently a Ph.D.student in the Software Department, University ofBabylon, Iraq. He received the M.Sc. degree inIT from Universiti Tenaga Nasional (UNITEN),Malaysia, in 2012. He received the B.Sc. degreein computer science from University of Baby-lon, Iraq, in 2002. He joined the Department ofComputer Science, University of Babylon, Iraq, in2006, where he is currently an assistant Lecturer.His research interests include E-Procurement, sen-sor networks, WSN, data aggregation.